

Abstract
Sodium magnetic resonance (MR) imaging in humans has promised metabolic information that can improve medical management in important diseases. This technology has yet to find a role in clinical practice, lagging proton MR imaging by decades. This review covers the literature that demonstrates that this delay is explained by initial challenges of low sensitivity at low magnetic fields and the limited performance of gradients and electronics available in the 1980s. These constraints were removed by the introduction of 3T and now ultrahigh (≥7T) magnetic field scanners with superior gradients and electronics for proton MR imaging. New projection pulse sequence designs have greatly improved sodium acquisition efficiency. The increased field strength has provided the expected increased sensitivity to achieve resolutions acceptable for metabolic interpretation even in small target tissues. Consistency of quantification of the sodium MR image to provide metabolic parametric maps has been demonstrated by several different pulse sequences and calibration procedures. The vital roles of sodium ion in membrane transport and the extracellular matrix will be reviewed to indicate the broad opportunities that now exist for clinical sodium MR imaging. The final challenge is for the technology to be supplied on clinical ≥3T scanners.
Graphical Abstract
Integrated 23Na/1H MR examination at 3 Tesla of a patient with a brain tumor in right parietal lobe showing (from left to right) quantitative gray scale sodium MR image and TSC bioscale with color scale followed by co-registered proton anatomic images (non contrast T1-weighted, contrast enhanced T1-weighted, T2*-weighted and T2-FLAIR images and color relative blood volume map).

1.0 Introduction
Recent excellent reviews of sodium (23Na) magnetic resonance (MR) imaging in humans have discussed the intricacies of spatially encoding the 23Na MR signal into an image despite the low sensitivity and the biexponential relaxation behavior of the quadrupolar sodium ions in tissue [1–4]. Specific human applications in the brain, heart and cartilage have also been reviewed [5–7]. These reviews have taken the perspective of the MR physics for generating high quality 23Na MR images.
The 23Na MR signal provides novel metabolic information about tissue that is quite different from that of hydrogen (that henceforth, by convention, will be called the proton, 1H) that is used for current clinical MR imaging. The interpretation of 23Na MR images was initially descriptive emphasizing the anatomic distribution of contrast changes for detection of disease, following the approach used for interpreting 1H MR images [8–10]. Once the early controversy about “invisible sodium” in tissue was understood to reflect the rapid biexponential relaxation of the 23Na MR signal in tissue [9,10], improved technology was required to unmask this metabolic information with quantitative tissue sodium concentration (TSC) mapping. The earliest proponents of 23Na MR imaging expounded this goal of quantification [8,10]. Developments in hardware and software motivated by the need to improve resolution and data acquisition efficiency of 1H MR imaging have been vital to the continued development of 23Na MR imaging to where clinical implementation could be considered.
Major unmet needs persist in medicine. Many prevalent diseases have either no anatomic correlates or anatomic correlates occur very late in disease progression. Clinical MR imaging has not proven useful for clinical diagnosis of psychiatric illnesses [11–13] except to exclude anatomic based diseases that may mimic or present as psychiatric disease. Important neurodegenerative diseases such as Alzheimer’s disease and Huntington disease have only late anatomical changes detected by imaging [14–16]. Recently updated diagnostic criteria for AD provided imaging criteria for research purposes but advised against their clinical use [17]. Even a neurological disease with such profound manifestations as epilepsy often has no anatomical clues as to the site or etiology of the disease in up to 85% of cases [18–22].
This review of existing literature posits that quantitative 23Na MR imaging can significantly extend clinical MR imaging beyond anatomic changes to earlier stages of disease and to diseases without an anatomic basis. Two separate perspectives will be integrated to support this proposition.
Firstly, the biological roles of the sodium ion will be reviewed. Sodium ion homeostasis is as fundamental to all biology as is the aqueous milieu in which biology exists. This appreciation of sodium biology suggests where 23Na MR imaging can advance current clinical practice.
Secondly, the unique information for clinically relevant 23Na MR imaging requires quantification. As the historical limitations have been overcome, the methods for quantification of spatially encoded 23Na MR signals, never a priority for 1H MR imaging, will be reviewed. As 23Na MR imaging does not have the signal-to-noise ratio (SNR) to achieve the same high spatial and temporal resolution of 1H MR imaging, its contribution to medicine must be fundamentally different. Quantification in this context means metabolic parameters with biochemical dimensions such as concentration (millimoles/volume or mass of tissue) and reaction rate (millimoles/unit time/volume or mass of tissue) with specified errors. Such parametric maps have the potential to permit metabolic modeling of tissue sodium biochemistry. Such maps can provide objective longitudinal monitoring of disease progression and response to treatment. Whereas biomarkers have only statistical correlations to outcome, sodium parameters have causal real-time relationships to both energy consuming and structural processes. Such quantitative spatially resolved parameters have been termed bioscales [23].
2.0 Biological Significance of Sodium Ion Homeostasis in Humans
The two major biological functions of sodium ions in human biology are its central role in the energy-consuming processes of membrane transport and its passive role as the major counter ion for balancing charges of tissue anionic macromolecules. These functions will now be highlighted in Sections 2.1 and 2.2, respectively.
2.1. Membrane Transport Using Ionic Pumps
The many thousands of coupled chemical reactions that make up the complex biochemistry of human metabolism are organized and coordinated through the compartmentalization of the different biochemical pathways and associated enzymes. Semi-permeable membranes separate compartments within and between individual cells. Transport mechanisms must be available for acquisition of vital substrates (e.g. glucose), to release products (e.g. neurotransmitters), to regulate metabolite concentrations (e.g. calcium ions), to allow energy production (e.g. oxidative phosphorylation), for elimination of toxic byproducts (e.g. urea) and to control cell volume. Despite the many different metabolites that must cross these semi-permeable membranes against concentration gradients, a common mechanism has evolved to power all membrane transport. This energy-consuming membrane bound enzyme is actually a family of isozymes called the sodium/potassium ion pumps (Na+/K+ ATPase). It is made up of three types of polypeptide units, α, β and γ. There are four α isoforms termed α1, α2, α3 and α4 arising from separate genes ATP1A1, ATP1A2, ATP1A3 and ATP1A4 [24]. The protein α and β subunits have catalytic functions while the γ subunit has a regulatory function. The conformational changes that move three sodium ions out of the cell for every two potassium ions transported into the cell requires energy generated by the hydrolysis of the third high-energy phosphate bond of adenosine triphosphate (ATP) [25,26]. The shared 1997 Nobel Prize in Chemistry, awarded to Jens C. Skou for his discovery of this membrane bound protein in 1957, underlines the significance of understanding ion homeostasis across membranes in biology [27].
In tissue, semi-permeable membranes separate compartments with different concentrations of large anionic macromolecules. Small cations and anions distribute between compartments to maintain overall electrical neutrality resulting in different ionic concentrations in the different compartments. Water partitions across the semi-permeable membrane to equalize the total ionic concentrations. This passive process is modified by the membrane bound Na+/K+ ATPase that maintains a low intracellular sodium concentration of about 10–20 mM and a high intracellular potassium concentration of about 145 mM while extracellular concentrations of sodium and potassium are 135–145 mM and 4 mM, respectively [28]. This ionic distribution then determines the passive water distribution between compartments and thereby controls cell volume. Although the water distribution is passive, water-selective membrane bound proteins called the aquaporins form the channels through which the water molecules selectively pass without ions. The ion gradients provide reverse diffusion gradients across the membrane. Potassium ions have the highest permeability of membranes in brain tissue due to the presence of a membrane bound protein channel that is selective for potassium ions. The Nobel Prize in Chemistry in 2003 was shared by Peter Agre and Roderick MacKinnon for their respective discoveries of the structures and selectivity of the membrane bound channel proteins for water (aquaporins) [29,30] and ions (potassium) [31–33]. This prize again recognizes the fundamental significance of the mechanisms of ion and water transport through membranes in biology.
As well as controlling cell volume, the ion concentration gradients across the semi-permeable cell membranes determine the resting membrane potential. In the brain, neurons have a resting membrane potential of about negative 60–70 mV compared to the extracellular compartment [28]. This electrical potential serves as the basis for the action potentials of neurotransmission along axons and neurotransmitter release across synapses. Although this resting membrane potential in the brain, as expressed in the Goldman-Hodgkin-Katz equation [28,34], is largely determined by the potassium ion, due to its high permeability, the potassium ion gradient is linked to that of the sodium ion gradient via the Na+/K+ ATPase activity. Up to two thirds of the energy production of the neuron is used to maintain this resting membrane potential [35].
The pivotal role of sodium in membrane transport that underpins so many vital functions can be a site of dysfunction and disease and is indicative of the potential importance of clinical 23Na MR imaging.
2.2. Anionic Macromolecules and Counter Ions
As the macromolecules that make up the structural integrity of tissue have electrostatically charged functional groups, counter ions are required to balance the resultant electrostatic interactions [36–38]. These electrostatic attractive and repulsive forces determine the solubility, conformation and aggregation properties of macromolecules such as proteins, nucleic acids, proteoglycans, phospholipds and glycolipids. These interactions, along with hydrophobic and hydrophilic affinities, control the structural and catalytic functions of these macromolecules. Sodium plays a key role as a counter ion in maintaining the structural and functional integrity of these macromolecules in all tissues both within and outside the cells.
2.2.1. Articular Cartilage: Tissue with Low Cell Volume Fraction
Articular cartilage is a tissue that lacks both blood vessels and innervation, being composed of a largely hypoxic extracellular matrix (ECM) that provides its mechanical role of weight bearing in joints [39–43]. Briefly, cartilage has a very low cellular content (<5% cell by volume); with the extracellular macromolecules providing the compressive stiffness to buffer weight bearing and tensile strength to resist shear forces within mobile joints [44–48]. The biochemical structure of cartilage tissue consists of about 15–30% by volume of extracellular cross-linked glycosamine sulphate proteoglycan (GAG) polymers, (primarily aggrecan) binding water in a network of primarily type II collagen proteins occupying up to 50–75% of tissue volume. 80–85% of cartilage weight comes from water and dissolved electrolytes [48]. Whereas the collagen proteins provide tensile strength to maintain overall shape of the cartilage, the compressive elasticity of the cartilage is due to the bound water and electrostatic repulsion of the sulphate and carboxyl groups of the GAG. These functional groups constitute the fixed charge density (FCD) of the GAG that generates the osmotic pressure within the cartilage. The equation, derived by Donnan [49], summarizes the biochemistry of the mechano-electrochemical properties of cartilage that relate the FCD, CF, to the equilibrium concentrations of the counter ions in the ECM (C) and in the bathing solution of synovial fluid in the joint space (C*), such that:
| {1} |
Under instantaneous compressive loads, water bound in the GAG network provides compressive resistance while prolonged compression extrudes bound water and counter ions from the polymer to lubricate the joint space while the electrostatic repulsion of the negatively charged sulphate and carboxyl groups provides further compressive elasticity. The density of the collagen protein network controls the rate of shifts in water thereby determining overall cartilage function. The concentration of sodium within normal cartilage ECM is as high as 300 mM, reflecting its role as the counter ion for the GAG network and is a measure of the GAG content [50–52]. Although the sodium concentration is high in cartilage, the cartilage structures are small providing a challenge for 23Na MR imaging. Quantification of sodium in such small structures must address the issue of partial volume effects (PVE) as the cartilage is immersed in the synovial fluid of the joint that also has a high sodium concentration.
2.2.2. Brain: Tissue with High Cell Volume Fraction
The ECM in the small interstitial space of the brain is the structural scaffold controlling tissue integrity. This ECM, including the perineural nets (PNN) [53], is made up of specific gene products from the neurons and glial cells that mimic the structural principles of cartilage but without collagen and with different GAG polymers. The ECM of the brain consists primarily of macromolecules of proteoglycans also termed lecticans (neurocan, brevican, versican, phosphacan, synecan, glypican) with variable GAG polymers of chondroitin sulphate, dermatan sulphate, keratin sulphate, heparin sulphate and non-sulphated hyaluronic acid. Hyaluronan is a non-sulphated polymer of glucosamine and glucoronic acid without a protein component that is cross-linked by the lecticans to the protein tensacin. Another group of membrane-bound proteins called the integrins link the ECM to the surface of neurons [54].
Although the ECM of brain is different from that of cartilage, the structural principle of macromolecular anions and sodium counter ions still applies. The electrostatic effect of the ECM provides structural scaffolding for the cells of brain tissue while buffering the cationic concentrations of the small interstitial space and balancing the water distribution between the intra- and extra-cellular compartments.
There are still many complex and yet incompletely understood interactions between the ECM and neuronal and glial cells that affect cellular metabolism, function, proliferation, synaptic plasticity and gene expression that are associated with disease and well beyond the scope of this review [55]. Briefly, ECM-modifying enzyme systems involve the extracellular proteases (matrix metalloproteinases and tissue plasminogen activator) and the GAG degradation enzymes of hyaluronidase, chondroitinase and heparanase. These enzymes sculpture the proteins and polysaccharide side chains of GAG in the ECM during development. The ECM also has binding functions for various growth factors such as vascular endothelial growth factor (VEGF) and for fibroblast growth factor (FGF) and communicates with the cells via the integrins and so should not be thought of as simply a scaffold.
The TSC in the brain reflects both intracellular and extracellular sodium that acts as the counter ion for macromolecular anions in both compartments. The extracellular space can be divided into three compartments. The interstitial space between cells containing the ECM must be distinguished from the perivascular space and the vascular space. The recent neuropathology literature now recognizes that the perivascular spaces (Virchow-Robin spaces) around small arteries and arterioles penetrate brain tissue from the CSF-filled subarachnoid spaces from the pia mater and contain CSF [56–69]. Such spaces are always present and can sometimes be enlarged and observed on delayed contrast enhanced conventional 1H MR images [70]. The vascular space of the brain is small, representing only about 3% of the brain tissue volume, with white matter having half the vascular volume of gray matter. The perivascular space is even smaller. CSF is produced by the choroid plexus in the ventricles but normally does not penetrate the brain parenchyma directly. CSF penetrates from the subarachnoid space through the pia mater along the perivascular spaces of penetrating arteries and arterioles to the terminal capillary beds and then out along the draining veins. This network is now well documented in humans by multiple in vivo and ex vivo ultrastructural and diffusional neuropathological techniques [56–69]. This pathway is thought to be equivalent to the lymphatic drainage network of tissues outside the central nervous system. However these perivascular spaces are separated from the interstitium by astrocytic foot processes [66–69]. These astrocytes control fluid flow between the interstitium to the perivascular spaces indicating that these are different compartments. The interstitial fluid is not derived from CSF but comes from the capillary beds of the vascular system and so has a different origin and function from CSF. Furthermore, the movement of low molecular weight molecules from the interstitium into the perivenous spaces for removal from the brain is dependent on aquaporin expression in the astrocytes [66]. This pathway has been termed glympatic pathway [66]. In contrast, the periarterial flow appears to be hydrodynamically driven by cardiac pulsations [65]. Currently, the sodium MR signal from brain tissue reflects all of these different spaces of the extracellular and intracellular compartments.
3.0. Overcoming the Previous Challenges of 23Na MR Imaging
The potential metabolic information was the early driving motivation for developing clinical 23Na MR imaging. Its development required solutions to the challenge of low sensitivity (Section 3.1) to have practical means to obtain accurate parametric maps of TSC (quantification, Section 3.2).
3.1. Sensitivity Limitations
Sodium is second only to protons in having the most sensitive biologically relevant MR signal. The considerably lower concentration (e.g. 35 mM sodium ions compared to 80M protons in human brain) and its four fold lower intrinsic sensitivity presented a significant barrier to early 23Na MR imaging. Clinical magnets had a low field strength with limited gradient and electronics performance but sufficient for the long relaxation times of the 1H MR signal. In the 1980s and early 1990s, 1.5 Tesla was the highest field strength of state-of-the-art clinical scanners [10,71,72]. Unlike sodium in free solution of CSF, the sodium MR signal in tissue has biexponential relaxation behavior with most of the 23Na signal being lost within a few milliseconds. This biexponential behavior, attributed to the quadrupolar property of the sodium nucleus, is related to the anisotropic environment of sodium ions generated by macromolecules. This rapid signal loss resulted in images of low signal to noise ratio (SNR), primarily reflecting sodium in the CSF spaces with little relevant information from the tissues [10,71,72]. As much as 60% of the sodium signal was termed “invisible sodium” due to this rapid loss of signal before spatial encoding could be performed. The “invisible sodium”, correctly attributed to sodium ions with short relaxation time, became controversial when this sodium was thought to be intracellular and bound to macromolecules. The belief was that the extracellular compartment was an extension of CSF spaces and allowed free diffusion. This may be partially true for water and very small molecules [73,74] but not for sodium cations. It is now well established that macromolecular anions are present in both intracellular and interstitial compartments and that the rapid relaxing sodium MR signal arises from both tissue compartments [75–77].
Clinical trials on prototype clinical 3 Tesla scanners between 1995 and 1998 resulted in the first Federal Drug Administration (FDA) approved clinical 3T scanner in 1999 [78,79]. The improved sensitivity of 3 Tesla with improved gradients and electronics was revolutionary for 1H MR imaging and particularly for functional MR imaging (fMRI) which was one of the driving motivations for this field strength to enter clinical practice. A side benefit was the significant improvement in sensitivity for 23Na MR imaging [79]. The performance of the gradients and electronics had been improved for 1H MR imaging on 3T scanners but also removed the previous constraints on 23Na MR imaging [10,71,72].
The lack of reliable metabolic images and the technical challenges in those early days prior to 3T scanners resulted in lackluster enthusiasm for further development by clinicians and scanner manufacturers alike. The many technical advancements made in human MR scanners to improve 1H MR imaging over the next decade in high (3T) and ultra high field (7, 9.4 and 10.5T) superconducting magnets [78,80–82], actively shielded gradients [83,84], radiofrequency (RF) antennae [85–87], digital electronics and computers as well as a more complete understanding of image generation and signal processing [88–91] have surmounted all of the original technical hurdles associated with the lower sensitivity of 23Na MR imaging.
The steps taken for generating high quality biochemically meaningful sodium images in humans will now be reviewed.
3.2. Quantification Challenges
The lower SNR of sodium MR imaging compared to that of protons is determined by two primary factors beyond the difference in intrinsic MR sensitivity of the two nuclei. These are the biological concentrations and the nuclear relaxation properties.
3.2.1. Biological Concentrations
The concentration differences between sodium and protons in biology are the obvious first factor that compromises the SNR of sodium MR imaging relative to that of protons. As the 23-sodium isotope is 100% abundant in nature, concentration enhancement via isotope enrichment, such as had been used in human 17-oxygen MR imaging [92], is not possible for sodium.
3.2.2. Nuclear Relaxation Properties of 23Na
The nuclear properties of the sodium nucleus are more complicated than those of the proton. A complete discussion of the quantum mechanics underlying these MR phenomena is available elsewhere [1–4,93–95] but some simple explanations provide an introductory framework that also leads to the basis for quantification of 23Na MR signals.
Quantum mechanics describes the fundamental properties of subatomic particles that are not apparent in the behavior of macroscopic objects. These properties are reflected in the quantum numbers assigned to such particles. The spin quantum number (I) summarizes the magnetic properties of subatomic particles. As the proton is a subatomic particle with an electric charge and motion, it has a magnetic field and can be referred to as a magnetic dipole. This magnetic property of the proton is assigned I = ½. The magnetic field of the proton allows interactions with fluctuating magnetic fields generated in its immediate environment by neighboring magnetic dipoles such as electrons and other nuclei. These interactions of magnetic fields are short range, dependent on relative orientation and on the frequency of fluctuation. The proton has a spherically symmetric positive electric charge and so has no directionality in an electrical sense. In contrast, the sodium nucleus, a collection of protons and neutrons, has a positive charge and a spin quantum number of I = 3/2. Just as with protons, the magnetic field of the sodium nucleus can interact with local fluctuating magnetic fields. In addition, the larger sodium nucleus has a non-spherical distribution of the electric charge that can be described by an electric quadrupole moment. Such quadrupolar nuclei can experience the effects of neighboring fluctuating electric fields as well as magnetic fields. As the electric field interactions are stronger, they dominate over magnetic field interactions.
Quantum mechanics dictates that an ensemble of nuclei with non-zero spin number I has a number of discrete energy states, mI, given by 2I+1. Thus, sodium has 2I+1 = 4 energy states where mI = 3/2, ½, − ½ and −3/2. These energy states are equivalent or degenerate in the absence of an applied magnetic field (B0 = 0). Application of a magnetic field (B0 > 0) generates non-degenerate energy states so that transitions can occur between states. However the quantum mechanical selection rule for simple MR observable transitions are limited to ΔmI = ± 1 so that sodium nuclei have three possible transitions (−3/2 → −1/2, −1/2 → +1/2, +1/2 → +3/2) between the four energy levels. These transitions are termed single quantum coherences. In aqueous environments where kinetic energy allows rapid motion, magnetic and electric fields average out to become isotropic on the time scale of the MR phenomenon. All transitions then occur at the same first order rate constant and the sodium MR signal shows single exponential relaxation behavior for both longitudinal and transverse relaxation times, termed T1 and T2, respectively. Note for clarity and without further explanation that convention states that the highest energy levels are negative for positive spin quantum numbers. However, in macromolecular environments where rotational and translational motions are slowed, the non-spherical distribution of the electric charge of the sodium nucleus permits interaction with anisotropic electric fields of the charged groups on the macromolecular anions. Such electric field interactions produce faster relaxation rates for the −3/2 ←→ −1/2 and 1/2 ←→ 3/2 transitions, termed satellite transitions compared to the −1/2 ←→ +1/2 transition, termed the central transition [1–10, 93–97]. The interactions of these electric fields cause the biexponential behavior of sodium ions, with about two thirds of the signal relaxing at the faster rate (i.e., shorter relaxation time). Other transitions (−1/2←→3/2 and −3/2←→1/2), termed double quantum coherences (DQC), and (−3/2←→3/2), termed triple quantum coherences (TQC), can occur but require more complicated filtered MR experiments to be observed. Such multiple quantum transitions reflect macromolecular interactions but viewing these interactions with 23Na MR imaging is not yet practical for routine clinical studies and so will not be discussed further [1–4,96–101].
When biexponential behavior is present, the two components are referred to as the fast and slow components when discussing relaxation rates or as the short (T2s) and long (T2l) components when discussing relaxation times. This transverse relaxation behavior is also reflected in the longitudinal relaxation times (T1) although these times are longer. Although relaxometry can sometimes be used resolve these long and short components in research settings, such methods are still far too time consuming for imaging to be practical clinically. The transverse relaxation times in the literature vary with tissues such as brain, heart and cartilage with ranges for the short component being 0.5–3.0 ms and the long component being 7–30 ms [96–98,102,103]. These ranges presumably reflect the great heterogeneity of sodium environments within and among different tissues.
3.2.3 Quantification
The principles underlying the MR measurement of a concentration of an observable metabolite have been described [104–106]. Briefly, the Curie Law states that the maximum measured MR signal (M0) is related to the number (N) of nuclei in the sample by:
| {2} |
where the B0 is the applied static magnetic field, T is absolute temperature, k is the Boltzmann constant, γ is the gyromagnetic ratio and h is Planck’s constant. For imaging, N is the number of nuclei in each voxel of the image. The MR antenna must be designed to have uniform sensitivity across the field of view (FOV) and the magnitude of the excitation magnetic field (B1) of the RF pulse must be selected to maximize the signal without saturation and short enough so that the signal is detected before significant signal relaxation has occurred. The time from the center of the RF pulse to initial signal detection at zero effective encoding gradient is termed the echo time (TE) and should be as short as possible. It is also assumed that the encoding gradients are linear so that all voxels have equal volume. Rearrangement of Equation {2} indicates that the sample concentration, C(sample), in each voxel can be determined from the product of the known concentration, C(calibration), of a calibration phantom with the ratio of the maximum measured MR signals from the voxel of interest in the sample (M0(sample)) and calibration phantom (M0(calibration)), such that:
| {3} |
The necessary condition of uniform sensitivity over the FOV requires corrections for both B0 and B1 non-uniformities. The encoding gradients should be calibrated to ensure that voxels are the same volume over the FOV. A number of methods are available for such corrections with hardware design [107] and with mapping techniques [108–112]. The calibration phantom can be placed within the same FOV as the sample [91,102]. However, as RF antennae are designed to achieve the best filling factor for the sample of interest to maximize SNR, space becomes a problem. Adequate space within the FOV is possible for muscle and breast MR imaging [113,114]. Such calibration phantoms at the edge of the FOV are located in regions of high B0 and B1 inhomogeneity near the RF coil. Limited space within the antenna also requires phantoms to be small so that the images are prone to artifacts. The alternative approach is to use a separate imaging measurement with a larger calibration phantom placed in the same location within the antenna as the sample [106,115]. This phantom must produce the same electrical coupling to the antenna as the sample or a normalization phantom must be used in the same location within the FOV for both the sample and calibration measurements [106]. Both methods have been reported in the literature with advantages and disadvantages.
Although equation {3} indicates that the calibration should be linear, the effect of noise on MR signal intensity in magnitude images must not be neglected for low SNR images. Ideally the SNR should be greater than 10 to achieve a minimally acceptable accuracy of measurement (<10%). Image noise is independent of the MR signal to be measured but produces a positive offset of signal intensity that results in a nonlinear response function for low SNR MR signals [116,117]. The simplified approach used in the literature is to use two or more calibration phantoms with concentrations in the biological range so that the linearity of the calibration response can be established for the SNR of the images [106,118–120]. However, even a linear calibration curve may not be correct if the relaxation properties of the signal from calibration phantoms do not match those of the tissue for which the sodium concentration is to be measured or if the calibration phantoms do not couple to the RF antenna with the same efficiency as the sample [106].
23Na MR imaging is now discussed in terms of producing quantitative maps at acceptable spatial resolution in a reasonable acquisition time.
4.0. Encoding the Sodium MR Signal
4.1 Radial Projection Imaging
MR imaging, as first reported using the proton MR signal by Paul Lauterbur in 1973 [121], used radial projection imaging (RPI) in which the MR signal was immediately observed under a set of linear frequency encoding gradients of different orientations. Although an incredibly important and insightful concept, rewarded 30 years later when Professor Lauterbur shared the Noble Prize in Physiology or Medicine in 2003, the original RPI acquisition method and back-projection reconstruction algorithm were very inefficient for generating high-resolution images. This inefficiency resulted in very long acquisition times at relatively low resolution even for proton signals. This RPI method was soon replaced in proton MR imaging with orthogonal phase and frequency encoding of refocused echoes of the MR signal using spin-echo and gradient-echo imaging acquisition protocols and fast Fourier Transform (FFT) reconstruction methods that remain the basis of clinical MR imaging today [122,123]. Although these acquisition schemes radically reduced proton imaging acquisition times while producing higher spatial resolution images with multiple types of image contrast, such methods could not be used with the much shorter relaxation times of sodium. Until actively shielded gradients and better designed gradient drivers and transmit/receive switches improved gradient switching times and shortened TE, 23Na MR imaging remained limited to primarily measuring the slowly relaxing component of the sodium signal. The early clinical experiences at 1.5T with acquisition delay times as short as 2.5 ms reported the need for further technical development [10,80,81,124,125].
4.2 Modern Spatial Encoding of the Sodium MR Signal
A full description of MR imaging and k-space is beyond the scope of this review and introductions are available elsewhere [122,123,126,127]. However from the above discussion of relaxation properties, quantitative 23Na MR imaging of tissue requires rapid spatial encoding of the sodium MR signal immediately after it is generated by the B1 field to avoid loss of the fast component of the MR signal. This condition is met by turning on the encoding gradient immediately at the end of the B1 pulse, as in the radial projection imaging (RPI) method. To avoid signal loss from the time required for conventional slice selection, the B1 field is generated by a short rectangular RF pulse that excites the whole sample. The resultant signal from the sample must then be encoded by projections in three dimensions. A simplified explanation of spatial encoding now follows because the advances in this process were essential for 23Na MR imaging to become feasible for use in clinical settings.
The inefficiency of a three-dimensional radial projection (3DRPI) acquisition is reflected in the 35-minute total acquisition time required for an isotropic resolution of 4 mm [10]. This inefficiency is easily appreciated in the k-space description of imaging as the center of k-space is densely sampled but the edges of k-space are undersampled. As the lowest sampling density determines the spatial resolution, many more projections are required to increase the sampling density further from the center of k-space. As each projection takes a repetition time TR, more projections mean longer total acquisition times contradictory to the goal of high resolution images in short acquisition times for human imaging.
The major breakthrough for sodium imaging came with the realization that there are no physical constraints from the antenna used for MR signal detection so that more efficient projection encoding schemes can be used for MR imaging. The first practical demonstration came from Fernando Boada in the form of the twisted projection imaging (TPI) scheme [105,128,129]. This method replaced radial linear gradients with time varying gradients with a short radial component to move rapidly away from the center of k-space followed by a time varying gradient that swept out a three dimensional spiral trajectory [105,106]. The total acquisition involved rotating these complex trajectories on a set of stacked cones to cover 3D space. The resolution provided by this more uniform sampling over a sphere was determined by the angular spread of the cones. The speed up in total acquisition time was considerable as each twisted projection acquired the equivalent of multiple radial projections on the same cone. TPI allowed the first quantitative sodium concentration maps of human brain to be acquired at 3 Tesla in 10 minutes at a nominal isotropic spatial resolution of about 5 mm. A very short TE of less than 0.3 ms was achieved at 3T [105,128,129]. Boada used the computationally more efficient reconstruction algorithm for the TPI data that had been first introduced for positron emission tomography (PET) [130,131]. This reconstruction process gridded the projection k-space data onto a Cartesian reference frame with an appropriate weighting function for each point to allow the use of the FFT for image reconstruction.
Variations on Boada’s ultra-short TE (UTE) approach to optimize gradient switching properties followed with 3Dcones [132] and flexible TPI [106]. Density adapted 3D radial acquisition projection (DA-3DRPI) in which the radial gradient is decreased as the readout time progresses to sample time domain data more uniformly also increased efficiency over 3DRPI with simple gradients [133,134]. Another method using slice selection with slightly longer TE times, called acquisition-weighted stack of spirals (AWSOS), offers shorter total acquisition times at much higher in-plane resolution [135–137]. Other k-space trajectories using distributed spiral trajectories (SPRITE, FLORET) have been proposed [138–140] and used for 23Na MR imaging, further increasing acquisition efficiency and/or resolution [138,141,142]. Such high spatial resolution provides access to small target tissues such as cartilage and may at least partially resolve gray and white matter in the brain. Higher resolution images show less degradation of quantification by PVE that otherwise require correction by post processing [143–145].
Derived from older sequences (BLAST [146], RUFIS [147]) that appeared in the early 1990s but never used for 23Na MR imaging, newer pulse sequences have been developed for imaging protons of water immobilized within macromolecular structures of bone and cartilage. These are sweep imaging with Fourier Transform (SWIFT) and zero TE sequences (ZTE), both with potential for 23Na MR imaging [148–151]. These newer sequences further dramatically shorten TE by applying the RF pulse while the encoding gradient is being applied. Although these sequences further minimize TE, T1 saturation is present so that quantification of the signal remains to be verified for 23Na MR imaging.
A comparison of different acquisition schemes using the calibration method with external calibration references at the edge of FOV has been reported for the human brain at 9.4T [119]. Of the five pulse sequences compared, TPI was judged to be optimal for quantification. Similar TSC values were obtained for the other projection methods while the GRE sequence with longer TE values was not considered to be as accurate [119].
Because imaging requires many RF pulses, quantitative MR imaging must separate each encoding step with a TR that is sufficient to ensure full T1 relaxation. If T1 is known then a correction can be applied but T1 is usually not known for various pathologies and takes too long to measure accurately for routine clinical practice. As T1 of sodium in body fluids is about 40–50 ms and almost full relaxation is achieved in times about three to four times longer than T1. TR values of around 160 ms are sufficient to avoid tissue sodium T1 saturation of CSF and therefore of the faster relaxing tissue sodium. This long TR value limits signal averaging to improve SNR but avoids another important issue for clinical imaging. The specific absorption rate (SAR) of energy into the sample from the RF pulse must be kept within guidelines. The FDA sets these guidelines in the United States to avoid excessive heating that can harm the subject. These guidelines are easily surpassed if short TR values are used [152]. Quantitative 23Na MR imaging with long TR values stays well within these SAR guidelines.
4.3. Spatial Resolution and Partial Volume Effects
The description of spatial resolution differs between projection spatial encoding and the Cartesian approach of phase and frequency encoding. Although voxel dimensions are the nominal resolution in Cartesian acquisitions, the point spread function (PSF), defining the distribution of signal intensity in a voxel, spreads beyond the voxel dimensions in projection imaging [153]. Some of this loss of spatial resolution is because projection encoding produces a spherical k-space dataset that is a subset of the cubic k-space coverage of Cartesian encoding. This mismatch widens the PSF by about 40% [105,106,154,155]. This loss of resolution is not dependent on the nucleus but only on the encoding scheme. For sodium MR imaging, there is further blurring due to the rapid loss of signal from T2 relaxation during the encoding, especially for the fast component of the biexponential relaxation of tissue sodium [105,106,128,154–156]. Together with the need to restrict total acquisition times for human imaging due to subject motion, these issues impose resolution limits that inevitably mean large voxels with millimeter dimensions for projection encoding compared to the submillimeter voxels of orthogonal encoding [118,157]. The consequence of these factors is that the nominal voxel dimensions over-estimate the true spatial resolution. As the signal intensity of each voxel is influenced by the signal intensities of neighboring voxels, PVE are significant. Quantification of signal intensities is perturbed by these PVE when regions of interest are small (several millimeter range for sodium voxels) and in heterogeneous tissue. For example, resolving accurate values of TSC in convoluted cortical gray matter (GM) with dimensions of a couple of millimeters from neighboring white matter (WM) and CSF is problematic without correction for PVE. Motion produces further correlations across the FOV to further complicate the real PSF and correction of PVE.
Attempts to correct PVE using the geometric transfer matrix (GM) method, initially developed for positron emission tomography (PET), have been made for 23Na MR imaging, providing a partial correction [143,144]. The method of segmenting the large sodium voxels into compartments by using co-registered higher resolution proton voxels has also been used [145] but ignores the important issue that the PSF of voxels in pure CSF adjacent to voxels in pure gray matter are overlapping to produce mixed signals that are not fully corrected by this segmentation method. Probably the best means to reduce PVE is by improving the spatial resolution with the newer pulse sequences (e.g., AWSOS) that use rapid slice selection and asymmetric voxels [136–141] or isotropic voxels with newer 3D gradient echo methods [142]. Such high-resolution methods will demand ultrahigh field (≥7T) for sensitivity.
4.4. Tissue Compartments
The use of shift reagents has distinguished the extracellular and intracellular sodium signals so that each concentration could be measured separately in cell suspensions, perfused tissues and rodents with implanted tumors [75–77,158]. Both the intracellular and extracellular compartments show biexponential relaxation with similar contributions from the short relaxation component [76]. These results confirmed that sodium-macromolecular interactions occurred in both compartments. The use of shift reagents is not feasible in humans. Attempts to measure the sodium concentrations in the different compartments using the biexponential behavior, as originally suggested [10], now seem futile. However such efforts continue to be reported based on the assumption that the extracellular space contains CSF with free sodium ions [142,159–162]. This assumption arises from the partial suppression of the sodium MR signal in tissue using inversion recovery approaches to 23Na MR imaging. The reduction in signal has been assumed to be only from the extracellular compartment because the method suppresses the signal from the CSF in the ventricular system [161]. Although the interpretation is tempered to say that the separation is imperfect only biasing the remaining sodium MR signal towards the intracellular compartment, this is misleading for any interpretation of pathology when the degree of bias is unknown. From the discussion in Section 2.2.2, the interstitial space is not a CSF space. It is also clear that even intracellular sodium is not all bound to macromolecular structures. The Na+/K+ATPase activity and the resting membrane potential, as described by the Goldman equation, require free sodium concentrations in both compartments [28,34].
4.5. Hardware
The advancements in acquisition pulse sequences have improved spatial resolution in shorter acquisition times. Performance of these more efficient spatial encoding sequences has been dependent on faster switching and shorter ring down times of the transmit-receive switches and low eddy currents of actively shielded gradients, as have been reviewed elsewhere [1,3,5]. Increased field strength with modern 3T clinical scanners has provided the expected improved SNR for sodium MR imaging [79,]. Even higher field strengths (≥7T) have further improved performance SNR [162]. RF antenna design for sodium MR imaging, including incorporation of proton capabilities for imaging of the brain, body and extremities have been reported [163–167] and reviewed [168]. This integration of proton and sodium MR imaging, providing co-registered high-resolution anatomy images with superimposable biochemical maps, bodes well for a fully integrated 1H/23Na examination for clinical service. Given the current state of sodium MR imaging, the remaining hurdle to routine clinical sodium MR imaging will now be discussed.
Because current clinical MR imaging is based on the 1H MR signal, MR scanners have been optimized for 1H MR imaging with low noise, narrow band digital electronics. To satisfy researchers requesting access to other frequencies (e.g., carbon, sodium, phosphorus, lithium, fluorine) for imaging and spectroscopy on clinical scanners, broadband multi-nuclear spectroscopy packages (the so called MNS packages) have been supplied as a general solution for all non-proton frequencies. This package is not a standard part of clinical scanners. Although such broadband hardware and software are not optimized for any single frequency, the additional cost of this more expensive general solution is more of a handicap to clinical 23Na MR imaging than the non-optimized performance. RF antennae for sodium imaging are available commercially although very expensive in a niche marketplace. These high costs are the largest impediment for further clinical development of 23Na MR imaging. In contrast, the commercial investment required to develop hyperpolarized 13-carbon (13C) MR imaging for clinical scanners was made before any significant human applications had been demonstrated and despite large costs for the polarization device and ongoing operating costs [169]. As 23Na has almost the same resonance frequency as 13C, this commercial platform may provide an opportunity to investigate 23Na MR imaging in a clinical environment, particularly if 13C hyperpolarization does not become a clinical reality.
Fortunately, sites that have the MNS package on their clinical 3T scanners and appropriate expertise in hardware fabrication and pulse sequence development have been advancing 23Na MR imaging. The use of phase array antennae that take advantage of multiple receivers have been reported for breast, brain and cartilage 23Na MR imaging [114,163,167] although verification of quantification of such sodium images remains to be confirmed. The goal of producing coils with configurations that allow both proton and sodium imaging to be performed without moving the patient and without degrading imaging performance remains an elusive goal [163].
The challenges confronting 23Na MR imaging of humans from three decades ago have been addressed with today’s clinical 3T MR scanners that have the MNS package and commercially available RF coils using research pulse sequences and analysis software. Instrumentation improvements will continue just as is happening with 1H MR imaging. The prohibitive high cost barrier for routine clinical sodium MRI will be discussed further in Section 6.0 after the feasibility studies for clinical applications of 23Na MR imaging in multiple organ systems are discussed in Section 5.0.
5.0 Sodium in Human Disease
Although a broad experience with 23Na MR imaging in human disease suggests that sodium metabolic parameters may be useful, no multicenter clinical trials have been undertaken. This was also true for 1H MR imaging [170] and multicenter clinical trials for MR imaging remain rare [171]. The more recent observational studies investigating human diseases with sodium MR imaging will be described under the two biological categories of active and passive functions of sodium ions.
5.1. Diseases coupled to Na+/K+ ATPase Activity
Sodium ion pumps control most vital transport processes within and throughout all cells. Loss of ion homeostasis, reflecting ill health, can be measured by TSC. Such disruption can be observed in a number of diseases. It is also important to recognize that diseases can also arise directly from abnormal genetic expression of the ion pumps themselves [172–175]. Two well studied but rare diseases arising from gene mutations in the ATP1A3 gene coding for the α3 subunit of the Na+/K+ ATPase expressed on neurons are alternating hemiplegia of childhood and rapid-onset dystonia-Parkinsonism. Familial hemiplegic migraine type 2 is an example of a mutation of the ATP1A2 gene resulting in expression of abnormal α2 subunits in glial cells. The low frequency and severity of these diseases again indicate the vital role of this enzyme in ion homeostasis. Sodium MR imaging has not yet been reported in these rare diseases. The more common disease of multiple sclerosis in its various clinical manifestations has been studied with quantitative sodium MR imaging but will not be discussed further as the metabolic basis of the increased TSC remains unclear [141,176–178].
5.1.1 Stroke Management
Stroke is one of the leading causes of death and disability in the world [179]. Stroke occurs with rapid onset of neurological symptoms and signs following abrupt occlusion of a blood vessel supplying blood to a region of the brain. Inadequate blood flow rapidly depletes tissue oxygen. Lack of oxygen stops ATP production from oxidative phosphorylation with resultant loss of ion homeostasis across cell membranes due to energy failure of the Na+/K+ ATPase ion pumps. The change in distribution of ion concentrations between tissue compartments is the harbinger of cell death as water redistribution results in cytotoxic edema and cell swelling that, if not quickly reversed, destroys the cell.
Although stroke is usually the abrupt consequence of blood clots embolizing from the diseased walls of large extracranial or intracranial arteries, the underlying disease of arteriosclerosis is only slowly progressive over many decades. The heart can also be a source of emboli usually from cardiac dysfunction from the same underlying vascular disease of the coronary arteries. Modifiable risk factors, including hypertension and smoking, enhance disease progression and risk of stroke. Control of these factors by medication and lifestyle changes has significantly reduced stroke risk and stabilized the annual number of stroke deaths.
Although acute stroke is a medical emergency, the underlying pathology is chronically progressive. Despite the success of preventive approaches, stroke remains a significant healthcare burden. An excellent review, examining the role of metabolic imaging in the management of acute ischemic disease, has summarized the different information available from each of the imaging modalities and suggested how that information may be used in acute stroke [179]. 23Na MR imaging was discussed but not given a definitive role in medical management. Multiple recent clinical trials have indicated that patients with acute non-hemorrhagic stroke (out to 6 hours from the initial symptom onset) involving clots in the internal carotid arteries or proximal branches should be treated with rapid mechanical retrieval of the clot together with thrombolytic agent to establish early tissue perfusion [as reviewed in 180–184]. Statistically, patients have better outcomes when reperfusion is achieved within 6 hours. Beyond 6 hours, benefits are reduced and there is increased risk of hemorrhage, presumably from reperfusing dead tissue, which further compromises outcome. Any imaging used in such an acute setting must be readily available and rapidly deployed to avoid delays in this new treatment protocol. However, even after 6 hours, some patients who are fortunate to have sufficient collateral circulation into the region of the compromised tissue may still benefit from reperfusion [185]. There are also patients with stroke not involving large vessel occlusion who would not be eligible for mechanical thrombectomy. Such patients would be treated with thrombolysis only out to 4.5 hours.
Thus, current practice of acute stroke management does not need 23Na MR imaging. However TSC measurements may be useful to guide management decisions by identifying patients with viable tissue who may benefit from intervention outside the current therapeutic windows for thrombolysis and thrombectomy [184]. Such a tissue viability parameter from 23Na MR imaging was posited from earlier research using diffusion/perfusion measurements in a cat model of stroke [186] and later demonstrated for 23Na MR imaging in patients [187] and confirmed by a number of laboratories [186–190]. These studies suggested that a TSC threshold may indicate when viable tissue is still present [187–192].
Approximately 10% of patients with large supratentorial strokes develop considerable brain swelling that leads to transtentorial herniation with brainstem compression and death in the first few days following acute onset. Mortality is very high at ~80% if this complication is left untreated [193–196]. This delayed death from stroke is termed malignant middle artery syndrome or malignant stroke syndrome [191]. One treatment is a decompressive hemicraniectomy to allow the swollen brain to herniate through the craniectomy site rather than transtentorially to compress the brainstem [194–196]. When the brain swelling resolves, the bone flap is reinstalled in a second surgical procedure of hemicranioplasty. An alternative treatment is a single craniotomy with the surgical resection of the dead tissue to generate space for swelling. Such a strokectomy requires the dead tissue to be distinguished from viable tissue and few surgeons are willing to undertake such a procedure [197]. The belief is that stroke recovery is related to the survival of the remaining neurons in the area of stroke although the outcome from single strokectomy procedure is the same as for the hemicraniectomy and subsequent hemicranioplasty [197,198]. Functional recovery following stroke does not occur in the damaged tissue but rather by neuroplasticity of existing neurocognitive networks [199,200]. The two-step hemicraniectomy and hemicranioplasty approach also involves an extended stay in the intensive care unit, increased risk for infection and longer recovery times that add cost to stroke management. Establishing nonviable tissue for strokectomy has been done with CT perfusion studies with xenon gas [197] as well as 23Na MR imaging with good outcomes in a small number of patients [188].
In summary, sodium imaging does address unmet needs in stroke management but only after the acute phase when the therapeutic windows for standard of care protocols have closed or entry criteria for those protocols have not been met. As many patients arrive for medical care after this emergent time or without a witnessed time of onset, a viability parameter should have value. 23Na MR imaging provides a metabolic parameter of TSC that reflects such tissue viability and could serve in decision-making in the appropriate medical setting.
5.1.2. Management of Malignancy
Tumor treatment protocols have been established using large multi-center clinical trials [201,202]. Such trials take many years to recruit sufficient patients to reach the statistical power required to resolve differences in survival among the treatment arms. Many factors influence outcome in these patients including heterogeneity in tumor cell type, location and size as well as attrition from the complications of treatment and medical complications of ill health as well as patient compliance. Many patients must be recruited to balance this population heterogeneity across the comparison arms of such cross-sectional clinical trial designs [201,202]. The Meier-Kaplan curves are a common summary of the survival results. Attempts have been made to find imaging biomarkers that are predictive of outcome. Such biomarkers are posited as possible surrogate measures of outcome, i.e., survival, but do not measure quantitative real-time tumor responses. The methods for data analysis of images have moved beyond simple regions of interest analysis to other statistical methods based on distributions such as used by the parametric mapping technique [203]. However such statistical approaches still attempt statistical predictions of survival based on correlations with outcome, as shown in recent reports [204–206]. This limitation arises when there is no established model of causality connecting the measured parameters to the biological changes produced by the treatment. An alternative approach would be to use quantitative parameters to measure the effectiveness of the treatment on a shorter time scale in each patient. This approach requires a quantitative causal model linking tumor response to the effect of the treatment. In these terms, the treatment is designed to selectively kill tumor cells and the desired response in the tumor is loss of cells. Treatments could then be changed if a treatment produced an unsatisfactory response in an individual patient. If the short-term treatment response is to be measured, the question is not survival of the patient but rather cell kill response in the tumor per cycle of therapy. This question is the reverse side of tissue viability discussed under stroke in Section 5.1.1
5.1.2.1. Brain Tumors
The increase in sodium concentrations in brain tumors is due to two reasons. The intracellular sodium concentration increases in proliferating tissue. The extracellular space also expands in brain tumors with expansion of the ECM that is different from normal brain. Tumors are included under the active role of sodium as the clinical question is tumor viability that is based on the energy consuming process of ion pumping.
Although cancer treatment has achieved reassuring results for many tumors outside the central nervous system, brain tumors still retain an abysmal prognosis despite triple therapy with surgical resection, chemoradiation and chemotherapy. Glioblastoma, the most common brain tumor in adults, is classified as a World Health Organization (WHO) grade IV malignancy with short survival times without treatment. With treatment, median survival is 14.6 months with 30% two-year survival and 10% five-year survival [201,202,207]. Radiation prolongs survival by a few months with follow-up chemotherapy with temazolamide achieving the current survival times. An extension in survival of months after three decades of clinical trials suggests the need for a new approach. Death from brain tumors is from local tumor progression whereas metastatic disease, not local recurrence, produces death from malignancies in the rest of the body.
The unasked clinical question in the monitoring of brain tumors during fractionated chemotherapy and radiation is how much tumor tissue has been destroyed with each fraction or cycle of therapy. The surrogate indicators used to imply response are primarily clinical assessment and imaging changes in volume or alteration of 1H MR signal characteristics. Changes in volume are not particularly sensitive even after many cycles of treatment and difficult to measure accurately in a surgical bed with treatment changes extending into normal tissue. Permeability changes depicted by enhancement from intravenously administered gadolinium-based contrast agents have been interpreted as reflecting changes in tumor vessels. MR perfusion studies based on dynamic susceptibility contrast (DSC) and dynamic contrast enhancement (DCE) mechanisms have been interpreted as measures of tumor relative blood volume and relative blood flow [208–210]. Although these parameters are potentially quantitative, the analyses have controversies and limitations. DSC perfusion studies are often compromised due to susceptibility-induced loss of signal from blood products left in the surgical site. DCE studies require an arterial input function that is of questionable validity in the setting of pathology. Conventional MR signal characteristics have no direct biological interpretation. Diffusion weighted imaging, and its enhancements as diffusion tensor imaging and kurtosis imaging, reflects ultrastructural features of tissue but no quantitative model connects diffusion of water to the heterogeneous structure of tumors and specifically to tumor cell density [211,212]. Water diffusion is altered by many features found in tumors including changes in the concentration and structure of the macromolecules that fill the expanded interstitial space of tumors but not directly related to cell density [213,214]. It should be noted that the ECM of tumors is different from that of normal brain with increased collagen not found in the ECM of normal brain. The volume of ECM in brain tumors is higher than that of normal brain tissue while the cell volume fraction of brain tumors is lower than normal human brain [211–213]. These findings of decreased cell volume fraction (CVF) in human tumors are supported by the finding of tumor sodium concentrations are greater than TSC in normal brain measured by 23Na MR imaging [216]. The model used to determine CVF is a simple two-compartment model [106,136]. If the volume of a voxel VV placed entirely within tissue can be divided between two compartments of the intracellular compartment with a sodium concentration Ci and volume Vi and the extracellular compartment of sodium concentration Ce and volume Ve then it follows by law of conservation, that the total tissue sodium concentration TSC is the sum of the moles in each compartment and that the cell volume fraction CVF can be derived as:
| {4} |
As quantitative 23Na MR imaging gives the TSC in each voxel, the CVF can be derived if the concentrations of sodium in the two compartments are known. The Ce is known from systemic sodium homeostasis to be approximately 145 mM and can be verified by a standard serum sodium concentration. The Ci is also known for normal cells to be about 12 mM [28]. However proliferating cells such as in tumor cells have increased sodium concentrations. These cells can have twice or more normal concentrations but as the Ce is much greater than Ci, the error from not having an accurate Ci value introduces only a small systematic error in CVF estimated from equation {4}. For normal brain tissue where TSC = 35 mM, CVF = 0.83 in good agreement with other methods [211–213]. In tumors, TSC varies over a range from 50 to 100 mM allowing CVF to vary over a range of 0.71 to 0.33. These CVF values are well below normal brain and also in agreement with independent methods [213–214]. Even if the Ci is doubled, as has been reported in proliferating rodent tumor cells [215], the range in CVF is still 0.79 to 0.37. The increase in TSC is outside the error in the estimate of Ci and is explained by the expanded ECM in the extracellular space and decreased CVF of tumors [216]. It is important to recognize that confusion has arisen from the neuropathological description of brain tumors as being highly cellular, based on apparent density of stained nuclei of small tumor cells under the light microscope, compared to the background of normal brain tissue. Even though the cells of normal tissue are much more densely packed, meaning small extracellular space, the nuclei of normal cells are not as numerous. Tumor cells cannot pack densely as the cell-cell junctions present between normal cells are absent. Restricted diffusion in tumors, sometimes observed by diffusion weighted MR imaging, is not due to high CVF but rather related to excessive and altered ECM [216].
A new paradigm for clinical trials would be to add measurements of the change in CVF and tumor volume defined objectively based on normal CVF during each cycle of treatment to the current outcome measures of overall survival and progression free survival. Cell kill fraction would be the decrease in CVF during each treatment cycle. The tumor volume based on an automated threshold and the histograms of CVF derived using equation {4} within the threshold have been reported as a means of monitoring regional tumor responses on a time scale as short as a single cycle (e.g., Figure 1) [217,218]. These observational studies will need to be expanded into clinical trials to generalize the results and to validate the assumption that achieving a high cell kill prolongs survival, as required by the Prentice criteria for surrogate markers of outcome [219,220].
Figure 1.

54-year old right-handed male with an inoperable grade II oligoastrocytoma in the right frontal lobe treated with fractionated radiation therapy (6 weeks 30 fractions, 60 Gy) and 10 cycles of temazolamide chemotherapy. Multiple axial partitions from the 3D CVF maps before (a) and after (b) chemoradiation treatment showing the decrease in volume of the heterogeneous right frontal mass. Normal brain is green (CVF = 0.81). CSF is black (CVF = 0.0). Tumor CVF varies between 0.3 and 0.75. (c) Histograms normalized to the same area for presentation of CVF within the region of tumor before (green line) and after (purple line) fractionated radiation therapy and after 10 cycles of chemotherapy (blue line) with ROIs drawn automatically at threshold of CVF = 0.75 showing little change in the shape of the CVF distribution but marked decrease in volume from 228 ml to 136 ml to 64 ml, respectively, at end of each treatment. The control region (red) is from a control region in the contralateral parietal lobe and shows a mean CVF of 0.81. The color scale for CVF extends from 0 (black) to 1 (green). (d) 1H axial images before (top row) and post (bottom row) radiation with pre-gadolinium T1-weighted (left) post-gadolinium T1-weighted (middle) and T2-weighted FLAIR images (right) show the poorly defined non-enhancing mass in the right frontal lobe that decreased in volume with treatment. The changes were monitored weekly and changes were progressive decrease in volume as the tumor margins reverted to normal CVF indicating killing of infiltrating tumor.
A role for sodium MR imaging in defining biopsy sites and extent of human brain tumors has been reported to be better that conventional proton MR image contrast [221,222]. A recent report on sodium MR imaging in human brain tumors has suggested its prognostic potential may be better than isocitrate dehydrogenase (IDH1) mutation genetic status [223]. The presence of the IDH1 mutation that occurs in 12% of glioblastomas is well known to predict better response to temazolamide chemotherapy [224]. An interesting point arising from the genetic survey of glioblastomas has been that 90% of glioblastomas show mutations related to ion transport underpinning the importance of ion homeostasis in cell cycle processes of neoplasia [225–228].
5.1.2.2. Other Cancers
Unlike brain tumors with very poor outcome from local disease progression, outcome in breast cancer is determined by metastatic disease. Although 1H MR imaging has high sensitivity of over 90% for detecting breast abnormalities, specificity remains below 75% [229] making mammography the better screening modality. Although 23Na MR imaging can be expected to also have low specificity for breast pathology, it may have a role in measuring response to therapy prior to surgical resection in advanced tumors [230,231]. A role for sodium imaging in other cancers such as prostate cancer is still evolving [232].
5.1.3. Neurodegenerative diseases including Alzheimer’s Disease (AD)
A major challenge facing the healthcare system is the increasing elderly population with concomitant increasing neurodegenerative diseases. The highest risk factor for neurodegenerative disease is increasing age. Alzheimer’s disease, the most common cause of dementia in the elderly, and other dementias are estimated to have cost US$226 billion dollars during 2015 in the United States [233]. Projected costs for the future aging population are astronomical. Despite decades of research and enormous sums of money, no effective treatments are available for cure of Alzheimer’s disease. As this disease begins decades prior to the clinical onset of symptoms, the opportunity exists to prevent the onset of symptoms if the pathological progression can be halted. However clinical trials using delay of onset of clinical symptoms as the outcome measure to evaluate early interventions would have to continue for decades. A recent review of the clinical trials performed over the last three decades and the development of trial methodology summarizes the lack of significant impact of trials directed towards late stages of disease and suggests a refocusing of efforts towards preclinical disease [234]. Clinical trials using delayed advancement of clinical symptoms in patients already manifesting the clinical disease have involved thousands of patients and lasted many years only to demonstrate that the treatments were of no value in reversing or stopping progression of cognitive decline [235,236]. Earlier smaller and shorter studies had suggested some delay in disease advancement but without effect on cognitive decline [237–240]. These studies support the view that, once brain tissue has been destroyed by disease, drugs are unlikely to be effective in reversing cognitive decline [234,241].
Such abysmal results in developing treatments for such a devastating disease after so much research suggest the need to refocus efforts on the early phases of the disease prior to clinical symptoms. Such an approach requires quantitative in vivo parameters sensitive to the earliest changes produced by the pathological process. The quantitative parameters are needed to measure progression, given no clinical symptoms are evident at this preclinical stage. A quantitative parameter measured in each subject also allows each participant to be their own control in longitudinal studies. Such paired measurements, rather than cross-sectional averages from populations, reduce the number of participants required to power a trial and do not have to extend over decades to reach clinically relevant endpoints.
Comprehensive reviews of the pathological development of Alzheimer’s disease have been provided elsewhere [242,243]. The classification of the pathological evolution of the disease includes positive and negative factors. The Braak and Braak classification (244) is based on the positive factor of the neurofibrillary tangles (NFT) that first appear in the entorhinal cortex of the temporal lobes. The NFT are now known to contain phosphorylated tau protein. Briefly, the Braak neuropathological staging of AD is based on the distribution, pattern and density of neurofibrillary tangles (NFT) and neuropil threads that develop in pyramidal cells, initially in the transentorhinal cortex (presymptomatic transentorhinal stages I and II), extending into the entorhinal cortex and hippocampal regions (incipient AD limbic stages III and IV) and spreading to the neocortex (fully developed AD neocortical stages V and VI) [245–247]. Other staging classifications for disease progression based on amyloid deposition have been proposed [247–251]. Extracellular deposits of beta amyloid with reactive astrocytes-neuritic plaques (NP) are another positive histological finding. Currently, the densities of NFT and NP in the neocortex and limbic areas are both used for the AD pathologic diagnosis. The negative factors include loss of synapses and pyramidal cells in the entorhinal cortex. The role of amyloid plaques has now been proposed recently as an independent process that enhances the further development of the AD pathology [14–16,252–256].
If early interventions for AD are to be developed, these pathological changes of cell and synaptic loss as well as NFT and NP in the presymptomatic stages I and II need to be quantified as parameters for measuring disease progression. Longitudinal measurements in the inaccessible entorhinal cortex of the temporal lobes necessitate the role of noninvasive imaging, preferable without ionizing radiation. Although 1H MR imaging has reported progressive hippocampal atrophy using morphometric techniques, these are findings of symptomatic AD [252–256]. Such morphometric parameters have large biological variations in the normal population. This means that large numbers of patients are required to detect differences between normal and AD populations in cross-sectional studies. [252]
Recent reports from independent lines of research indicate that the cell density of the human brain remains constant with age and has a very small biological variation [257,258]. The loss of brain volume with advancing age is well recognized as a part of normal aging [259]. Although originally thought to represent loss of cells from the brain with age, modern design based stereology [259] and cell counting techniques [260] have demonstrated that the normal aging brain does not loose cells but rather cells undergo an adaptive loss of synapses and dendritic arborization with concomitant decrease in cell volumes and interstitial space [259–267]. The implication is that the interstitial space and therefore the ECM within this space must decrease at the same rate as the cells become smaller. This is not unreasonable as the ECM is under dynamic turnover and is the product of the same cells. A smaller cell supports less ECM thereby providing a mechanism for keeping the CVF constant. CVF, derived from the TSC measured from quantitative 23Na MR imaging has been reported as being constant for normal aging adults across the age range from 21 to 79 years [115]. The whole brain average CVF was reported as 0.82±0.01, in agreement with values provided by other techniques [213,214]. This result serves as a baseline for examining the CVF and TSC in the hippocampus of AD patients. A qualitative sodium MR imaging study, performed using qualitative ratios of signal intensities between hippocampus and a control region of the brain, has reported signal intensity changes consistent with cell loss in the hippocampus of AD patients [268]. However that report used patients with symptomatic disease. PVE were not corrected and as patients who have symptomatic AD also have hippocampal atrophy, CSF contamination may have contributed to the signal change. Hippocampal volumes decrease with normal ageing and so comparison to age-matched controls does not eliminate PVE [269]. The detection of CVF changes in the preclinical stage with 23Na MR imaging has yet to be reported (Figure 2).
Figure 2.
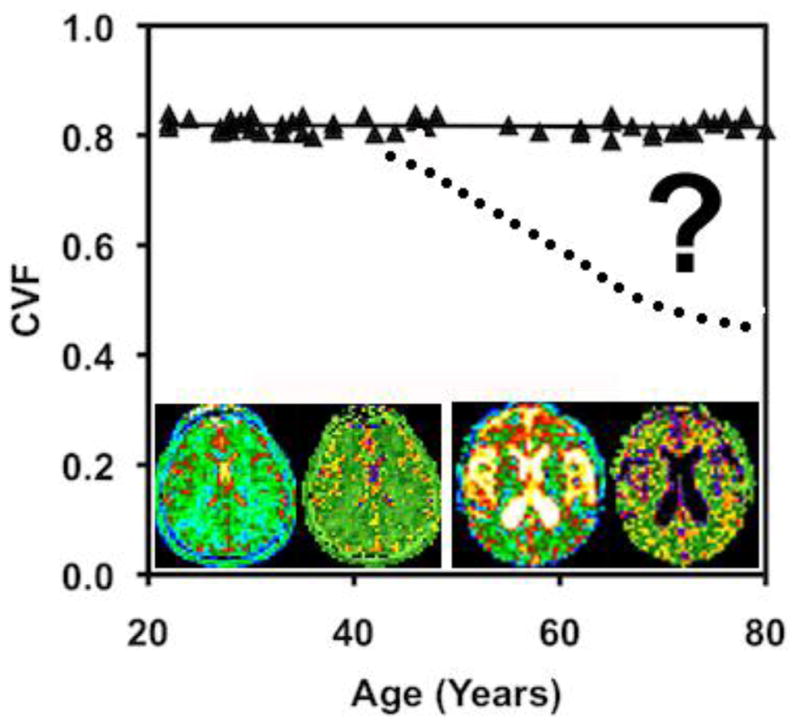
CVF as a function of age in cognitively normal adults. Image inserts of a young adult (left pair) and elderly adult (right pair), each with the TSC (left) and CVF (right) bioscales. The elderly subject shows the expected increased CSF spaces (white on TSC and black on CVF maps) but the brain parenchyma has the same TSC and CVF in both subjects (green color). The question remains to be answered as to when subjects with neurodegenerative disease (dotted line) deviate from the normal function.
To achieve the required sensitivity for 23Na MR imaging to detect the earliest cell loss in the small target of the entorhinal cortex in stages I and II of AD, as reported from neuropathological studies in human normal and AD brains [270], the challenges of PVE and the broad PSF across multiple voxels discussed in Section 4.3 must be addressed to minimize CSF contamination biases towards lower CVF. This suggests a role for the use of clinical ultrahigh magnetic fields (≥7T) and the higher resolution pulse sequences.
5.1.4 Heart, Skeletal Muscle and the Rest of the Body
Sodium MR imaging has been reviewed for the heart elsewhere [6] and cardiac studies with sodium MR imaging continue to develop at 3T and higher magnetic fields [271–273]. Feasibility studies have been reported in skeletal muscle that relate to muscle diseases and exercise [274–276]. The sodium concentration gradient through the medulla of the normal kidney which is the basis of renal function has been reported from sodium MR imaging [277–279]. Body and spine sodium MR imaging is developing and will expand opportunities and applications [280–284] as had been forecast almost 3 decades ago [285]. These studies are just a few of the numerous applications that will continue to evolve as sodium capabilities become available on clinical scanners at 3T and above.
5.2. Structural Diseases
The balancing of the electrostatic charges on macromolecules is an important role of sodium ions for the structural scaffolding of all tissues. These interactions of sodium ions with macromolecules in both the interstitial and intracellular compartments produce the biexponential relaxation behavior of the sodium MR signal. This signal behavior can provide insight into tissue function and structure in health and disease.
5.2.1. Cartilage
The two most significant risk factors for joint and cartilage disease are advanced age and obesity, both of which continue to increase. The most important disease of cartilage is osteoarthritis (OA). For comparison to neurodegenerative diseases, OA costs the US healthcare insurance payers US$149 billion and the patients in out of pocket costs of US$36 billion in 2007 [286–288]. Such high costs do not measure the diminished quality of life that comes from joint pain that begins with cartilage disease [287,289]. These costs are distributed across early low costs of symptomatic pain relief with medications to ultimately very high costs of joint arthroplasty (joint replacement surgery). For example, total knee arthroplasty offers an effective solution for knee osteoarthritis but the cost is prohibitive for use as an early intervention of such a prevalent disease [288].
Better early interventions are clearly required. This disease progresses over decades from mild pain to severe compromise of joint function and immobility with all the attendant medical and social complications. Just as with neurodegenerative disease, this slow progression offers the opportunity for early intervention to prevent the long-term complications. Similarly, the clinical trials required for the development and evaluation of early interventions require a quantitative assessment parameter for monitoring individual patients longitudinally. Again, paired samples, where participants act as their own control, requires fewer participants to statistically power such clinical trials. Outcome not longer depends on assessment of subjective symptoms of pain that change with chronicity.
Loss of the intact collagen and proteoglycans are early indicators of cartilage-based degenerative joint disease prior to the onset of anatomical changes [52,290]. The decrease in the cartilage sodium concentration measures the loss in FCD due to the loss of GAG is evidence of early osteoarthritis (OA) [289,291–293]. The challenges are that cartilage is usually thin compared to spatial resolution of 23Na MR imaging. The largest joint cartilage is in the knee and measures less than 2 millimeters in thickness in cadaveric specimens from elderly adults [294]. This cartilage is immersed in synovial fluid with its own high sodium concentration. Thus, accurate quantification of the sodium concentration within the cartilage must avoid the PVE of synovial fluid. High spatial resolution with the newer pulse sequences combined with ultra-high field (≥3T) may be the best method for achieving accurate measurements [7]. Within these constraints, 23Na MR imaging has been applied to human studies of cartilage in health and disease [295–301]. This approach may meet the request for new methods to evaluate early treatments of cartilage diseases [302].
5.2.2. Other Diseases of the ECM
The ECM of all solid tissue performs not only the role of the tissue scaffolding that is being continuously sculptured but is also involved in many other functions including sodium storage. The clinical dogma is that the kidneys maintain the sodium balance in the body. Orally ingested sodium is balanced by sodium lost in the urine. This balance supposedly reflects the constant serum sodium concentration. However, recent metabolic studies in humans measuring this balance between ingested and excreted sodium do not support this widely held concept. The use of 23Na MR imaging to examine the sodium concentration in muscle and skin, along with these metabolic studies, has led to a new perspective of sodium balance within the body [303–306]. These studies demonstrate that sodium can be bound to GAG in the skin as a store of sodium ions that is not in equilibrium with the blood and that mobilization from these stores may contribute to hypertension. Interestingly, these studies were performed in humans before animals. This means that a measurement of serum sodium alone does not provide a measure of sodium balance in the body [307]. 23Na MR imaging is currently the only means of non-invasively investigating these sodium stores in humans.
Dysfunction of the ECM results in many fibrotic diseases such as pulmonary fibrosis, systemic sclerosis (scleroderma), liver cirrhosis and cardiovascular disease and is thought to be crucial for tumorigenesis and metastatic progression of cancer [308]. These diseases present potential opportunities for 23Na MR imaging once it is available in clinical practice.
6.0. Barriers to the Clinical Future for 23Na MRI
Widespread clinical sodium MR imaging at 3T remains prohibitively expensive due to the high cost of the research MNS packages and RF coils offered by the commercial vendors in the absence of reimbursement codes. This situation is unlikely to change until clinical radiologists demand a more specific sodium single excitation channel capability at a lower cost on 3T scanners. Given access to this clinical capability, radiologists would be able to answer medical questions about tissue viability in clinical settings where anatomic proton MR imaging is performed as a standard part of medical care, as discussed in Section 5. Such sodium MR imaging would be added to the reimbursed proton MRI examination just as additional proton sequences are often requested. Such additional imaging is not performed for increased reimbursement but for improved medical care. Even without adding any of the recent innovations of parallel excitation and reception now used for proton MRI, the current state of sodium MR imaging can answer these new clinical questions in acceptable acquisition times as an addition to the conventional anatomic sequences of proton MR examinations. This strategy to expand imaging capabilities without reimbursement is exemplified by diffusion tensor imaging and perfusion imaging. Both of these advanced proton MR imaging techniques are purchased to deliver improved medical care despite having no specific reimbursement codes.
Further improvements to sodium MRI will continue but are not essential for clinical use. However, a multi-center clinical experience beyond the research environment is essential to promote seeking reimbursement codes for sodium MR imaging. This dilemma of high capital cost of equipment for performing sodium MR imaging without additional reimbursement while having no multi-center clinical experience with which to support an application for reimbursement codes can be resolved. The need to contain rapidly escalating healthcare costs through improved preventive medicine may be one motivating issue to move beyond this impasse. Clinical trials for evaluation of early interventions to halt progression of preclinical AD pathology (and other neurodegenerative disease) may be a validating application for clinical sodium MRI in the brain (as discussed in Section 5. 1.3). Similarly, evaluation of early interventions to slow or stop progression of osteoarthritis (as discussed in Section 5.2.1) may be another cost containment motivator in structural disease in the body. Other applications in stroke and malignancy, also discussed in Section 5, have a clinical role once sodium MRI is in clinical practice but these applications are unlikely to be significant cost reducers for these diseases. Both AD and osteoarthritis are expensive slowly progressive diseases in the increasingly aging population that offer opportunities for early prevention or mitigation of progression. Anatomic proton MRI does not provide this same information although performed in these clinical settings to exclude treatable causes that mimic these diseases.
As ultra-high field clinical scanners become available in the next few years, sodium MRI will be available as a routine imaging application. However, these scanners are not essential for clinical use of sodium MRI if scanner vendors provide a low cost solution for sodium MR imaging for the more widely available 3T scanners.
7.0 Conclusion
The controversies that existed in the 23Na MR imaging literature in the past have largely been resolved and have helped open new avenues of investigation. The variability in older published values for TSC in the brain were unacceptable high, presumably due to differences in calibration procedures and biases in acquisition methods with a range from below 20 mM [178] to greater than 60 mM [309], as previously reviewed [1]. Recent literature after 2010 from multiple laboratories using different acquisition schemes and calibration procedures reassuringly give values for TSC values for the white matter or average brain tissue of normal human brains, where PVE are minimized, of around 35±3 mM with a range from 30 to 38 mM [112,115,137,141], pleasingly consistent with the expected value calculated from the two compartment model using equation {4} using known intracellular and extracellular concentrations and volumes determined by other methods. This remaining variation can be attributed to small systematic errors from differences in calibration methodology and PVE.
The proposition that sodium MR imaging is ready for clinical use is supported by the literature. The challenges of imaging the quadrupolar sodium nucleus quantitatively have been addressed at ≥3T. The creative efforts of the few investigators in the early 1980s and of those who followed have not only resolved these issues but also demonstrated the rich potential for clinical use in important diseases. These applications are not substituting sodium for protons but offer to provide new metabolic information earlier in the disease processes to better serve medical discovery and ultimately clinical management. The important leap from qualitative biomarkers to bioscales of quantitative metabolic parameters can greatly improve clinical trial design. Parameters such as tissue sodium concentration (TSC), cell volume fraction (CVF) and fixed charge density (FCD) are tightly regulated in the normal state and so have small biological variations. Because diseases produce large changes in these parameters at early stages of disease progression, these bioscales can reduce the size and length of clinical trials for evaluation of early interventions. The vital roles of sodium in human health justifies moving 23Na sodium MR imaging beyond the fun of the spin physics to address the unmet needs of modern healthcare. Diseases with significant economic impact and a long preclinical phase emphasize the need for preventive medicine and early interventions. Clinical 23Na MR imaging can meet the demands of healthcare cost containment by “doing more earlier to lower costs and improve outcome”. What remains is for the scanner manufacturers to step up to the remaining challenge of providing these capabilities on existing clinical 3T and ultrahigh field MR scanners for a supportable cost.
Highlights.
Clinical 23Na MRI is feasible if integrated with 1H MRI on 3Tesla scanners
Quantitative 23Na MRI offers new medically relevant biochemical maps
Brain tissue sodium concentration reflects changes in tissue viability in stroke
Tissue sodium concentration reflects real-time response of tumors to therapy
Tissue sodium concentration measures early degenerative changes of cartilage
Acknowledgments
The author acknowledges that work mentioned in this manuscript was partially funded by PHS grant RO1 CA1295531A1.
Abbreviations
- AD
Alzheimer’s disease
- ATP
adenosine triphosphate
- Cl
chloride ion
- CSC
cartilage sodium concentration
- CSF
cerebrospinal fluid
- CVF
cell volume fraction
- DCE
dynamic contrast enhancement
- DSC
dynamic susceptibility contrast
- ECM
extracellular matrix
- FDA
Federal Drug Administration
- FCD
fixed charge density
- FFT
fast Fourier transform
- FOV
field of view
- GAG
glycosaminoglycan
- GM
gray matter
- GTM
geometric transfer matrix
- HCO32−
bicarbonate ion
- K+
potassium ion
- MR
magnetic resonance
- MRI
magnetic resonance imaging
- NFT
neurofibrillary tangles
- NP
neuritic plaque
- 23Na
sodium nucleus
- Na+/K+ ATPase
Sodium/potassium ATP hydrolase
- OA
osteoarthritis
- PNN
perineural nets
- PET
positron emission tomography
- PSF
point spread function
- PVE
partial volume effects
- RF
radiofrequency
- RPI
radial projection imaging
- 3DRPI
three-dimensional radial projection imaging
- SAR
specific absorption rate
- SNR
signal-to-noise ratio
- T1
longitudinal relaxation time
- T2
transverse relaxation time
- TE
time to echo or echo time
- TR
repetition time
- TSC
tissue sodium concentration
- WM
white matter
Footnotes
Publisher's Disclaimer: This is a PDF file of an unedited manuscript that has been accepted for publication. As a service to our customers we are providing this early version of the manuscript. The manuscript will undergo copyediting, typesetting, and review of the resulting proof before it is published in its final citable form. Please note that during the production process errors may be discovered which could affect the content, and all legal disclaimers that apply to the journal pertain.
References
- 1.Bottomley PA. Sodium MRI in Man: Technique and Findings. eMagRes. 2012 [Google Scholar]
- 2.Madelin G, Lee J-S, Regatte RR, Jerschow A. Sodium MRI: Methods and applications. Prog Nucl Magn Reson Spectrosc. 2014;79:14–47. doi: 10.1016/j.pnmrs.2014.02.001. [DOI] [PMC free article] [PubMed] [Google Scholar]
- 3.Madelin G, Regatte RR. Biomedical Applications of Sodium MRI In Vivo. J Magn Reson Imaging. 2013;38(3):511–529. doi: 10.1002/jmri.24168. [DOI] [PMC free article] [PubMed] [Google Scholar]
- 4.Ouwerkerk R. Sodium MRI. Methods Mol Biol. 2011;711:175–201. doi: 10.1007/978-1-61737-992-5_8. [DOI] [PubMed] [Google Scholar]
- 5.Shah NJ, Worthoff WA, Langen KJ. Imaging of sodium in the brain: a brief review. NMR Biomed. 2016;29(2):162–74. doi: 10.1002/nbm.3389. [DOI] [PubMed] [Google Scholar]
- 6.Bottomley PA. Sodium MRI in human heart: a review. NMR Biomed. 2016;29(2):187–196. doi: 10.1002/nbm.3265. [DOI] [PMC free article] [PubMed] [Google Scholar]
- 7.Zbýň S, Mlynárik V, Juras V, Szomolanyi P, Trattnig S. Sodium MR Imaging of Articular Cartilage Pathologies. Curr Radiol Rep. 2014;2(4):41. doi: 10.1007/s40134-014-0041-4. [DOI] [PMC free article] [PubMed] [Google Scholar]
- 8.Hilal SK, Maudsley AA, Ra JB, Mun SK. In Vivo NMR Imaging of Sodium-23 in the Human Head. J Comput Assist Tomogr. 1984;9(1):1–7. doi: 10.1097/00004728-198501000-00001. [DOI] [PubMed] [Google Scholar]
- 9.Winkler SS. Sodium-23 magnetic resonance brain imaging. Neuroradiology. 1990;32(5):416–420. doi: 10.1007/BF00588475. [DOI] [PubMed] [Google Scholar]
- 10.Hilal SK, Oh CH, Mun IK, Silver AJ. Sodium Imaging. In: Stark DD, Bradley WG, editors. Magnetic Resonance Imaging. Mosby; St Louis: 1992. pp. 1091–1110. [Google Scholar]
- 11.Krystal JH, State MW. Psychiatric Disorders: Diagnosis to Therapy. Cell. 2014;157(1):201–214. doi: 10.1016/j.cell.2014.02.042. [DOI] [PMC free article] [PubMed] [Google Scholar]
- 12.MacQueen GM. Will there be a role for neuroimaging in clinical psychiatry? J Psychiatry Neurosci. 2010;35(5):291–293. doi: 10.1503/jpn.100129. [DOI] [PMC free article] [PubMed] [Google Scholar]
- 13.Farah MJ, Gillihan SJ. The Puzzle of Neuroimaging and Psychiatric Diagnosis: Technology and Nosology in an Evolving Discipline. AJOB Neurosci. 2012;(4):31–41. doi: 10.1080/21507740.2012.713072. [DOI] [PMC free article] [PubMed] [Google Scholar]
- 14.Frisoni GB, Fox NC, Jack CR, Scheltens P, Thompson PM. The clinical use of structural MRI in Alzheimer disease. Nat Rev Neurol. 2010;6(2):67–77. doi: 10.1038/nrneurol.2009.215. [DOI] [PMC free article] [PubMed] [Google Scholar]
- 15.Jack CR, Jr, Dickson DW, Parisi JE, Xu YC, Cha RH, O'Brien PC, Edland SD, Smith GE, Boeve BF, Tangalos EG, Kokmen E, Petersen RC. Antemortem MRI findings correlate with hippocampal neuropathology in typical aging and dementia. Neurology. 2002;58(5):750–7. doi: 10.1212/wnl.58.5.750. [DOI] [PMC free article] [PubMed] [Google Scholar]
- 16.Jack CR, Jr, Knopman DS, Jagust WJ, Petersen RC, Weiner MW, Aisen PS, Shaw LM, Vemuri P, Wiste HJ, Weigand SD, Lesnick TG, Pankratz VS, Donohue MC, Trojanowski JQ. Tracking pathophysiological processes in Alzheimer's disease: an updated hypothetical model of dynamic biomarkers. Lancet Neurol. 2013;12(2):207–16. doi: 10.1016/S1474-4422(12)70291-0. [DOI] [PMC free article] [PubMed] [Google Scholar]
- 17.McKhann GM, Knopman DS, Chertkow H, Hyman BT, Jack CR, Jr, Kawas CH, Klunk WE, Koroshetz WJ, Manly JJ, Mayeux R, Mohs RC, Morris JC, Rossor MN, Scheltens P, Carrillo MC, Thies B, Weintraub S, Phelps CH. The diagnosis of dementia due to Alzheimer’s disease: Recommendations from the National Institute on Aging-Alzheimer’s Association workgroups on diagnostic guidelines for Alzheimer’s disease. Alzheimers Dement. 2011;7(3):263–269. doi: 10.1016/j.jalz.2011.03.005. [DOI] [PMC free article] [PubMed] [Google Scholar]
- 18.Berg AT, Mathern GW, Bronen RA, Fulbright RK, DiMario F, Testa FM, Levy SR. Frequency, prognosis and surgical treatment of structural abnormalities seen with magnetic resonance imaging in childhood epilepsy. Brain. 2009;132:2785–2797. doi: 10.1093/brain/awp187. [DOI] [PMC free article] [PubMed] [Google Scholar]
- 19.Doescher JS, de Grauw TJ, Musick BS, Dunn DW, Kalnin AJ, Egelhoff JC, Byars AW, Mathews VP, Austin JK. Magnetic resonance imaging (MRI) and electroencephalographic (EEG) findings in a cohort of normal children with newly diagnosed seizures. J Child Neurol. 2006;21(6):491–5. [PMC free article] [PubMed] [Google Scholar]
- 20.Boxerman JL, Hawash K, Bali B, Clarke T, Rogg J, Pal DK. Is Rolandic Epilepsy Associated With Abnormal Findings On Cranial MRI? Epilepsy Res. 2007;75(2–3):180–185. doi: 10.1016/j.eplepsyres.2007.06.001. [DOI] [PMC free article] [PubMed] [Google Scholar]
- 21.Friedman E. Epilepsy Imaging in Adults: Getting It Right. AJR Am J Roentgenol. 2014;203:1093–1103. doi: 10.2214/AJR.13.12035. [DOI] [PubMed] [Google Scholar]
- 22.Petrou M, Foerster B, Maly PV, Eldevik OP, Leber S, Sundgren PC. Added utility of gadolinium in the magnetic resonance imaging (MRI) workup of seizures in children younger than 2 years. J Child Neurol. 2007;22(2):200–3. doi: 10.1177/0883073807300302. [DOI] [PubMed] [Google Scholar]
- 23.Thulborn KR, Atkinson IC. From standardization to quantification: beyond biomarkers towards bioscales as neuro MR imaging surrogates of clinical endpoints. Under Hot Topics in Functional Neuroradiology [Google Scholar]; Faro SH, Mohamed FB, Helpern JA, Jensen JH, Thulborn KR, Atkinson IC, Sair HI, Mikulis DJ. AJNR Am J Neuroradiol. 2013;34:2241–2249. doi: 10.3174/ajnr.A3721. [DOI] [PMC free article] [PubMed] [Google Scholar]
- 24.Blanco G, Mercer RW. Isozymes of the Na-K-ATPase: heterogeneity in structure, diversity in function. Am J Physiol - Renal Physiol. 1998;275(5):F633–F650. doi: 10.1152/ajprenal.1998.275.5.F633. [DOI] [PubMed] [Google Scholar]
- 25.Jorgensen PL, Hakansson KO, Karlish SJ. Structure and Mechanism of Na,K-ATPase: Functional Sites and Their Interactions. Annu Rev Physiol. 2003;65:817–49. doi: 10.1146/annurev.physiol.65.092101.142558. [DOI] [PubMed] [Google Scholar]
- 26.De Lores Arnaiz GR, Ordieres MG. Brain Na+, K+-ATPase Activity In Aging and Disease. Int J Biomed Sci. 2014;10(2):85–102. [PMC free article] [PubMed] [Google Scholar]
- 27.Boldyrev AA. Na+,K+-ATPase: 40 years of investigations. Membr Cell Biol. 2000;13(6):715–9. [PubMed] [Google Scholar]
- 28.Somjen GG. Normal Function, Seizures and Stroke. Oxford University Press; New York: 2004. Ions in the Brain. [Google Scholar]
- 29.Knepper MA, Nielsen S. Peter Agre, 2003 Nobel Prize winner in chemistry. J Am Soc Nephrol. 2004;15(4):1093–5. doi: 10.1097/01.asn.0000118814.47663.7d. [DOI] [PubMed] [Google Scholar]
- 30.Agre P, Kozono D. Aquaporin water channels: molecular mechanisms for human diseases. FEBS Letters. 2003;555(1):72–78. doi: 10.1016/s0014-5793(03)01083-4. [DOI] [PubMed] [Google Scholar]
- 31.Zhou Y, Morais-Cabral JH, Amelia Kaufman A, MacKinnon R. Chemistry of ion coordination and hydration revealed by a K+ channel Fab complex at 2.0Å resolution. Nature. 2001;414:43–48. doi: 10.1038/35102009. [DOI] [PubMed] [Google Scholar]
- 32.Zhou M, Morais-Cabral JH, Mann S, MacKinnon R. Potassium channel receptor site for the inactivation gate and quaternary amine inhibitors. Nature. 2001;411:657–661. doi: 10.1038/35079500. [DOI] [PubMed] [Google Scholar]
- 33.Morais-Cabral JH, Zhou Y, MacKinnon R. Energetic optimization of ion conduction rate by the K+ selectivity filter. Nature. 2001;414:37–42. doi: 10.1038/35102000. [DOI] [PubMed] [Google Scholar]
- 34.Koester J. Resting Membrane Potential. In: Kandel ER, Schwartz JH, editors. Principles of Neural Science. Elservier; New York: 1981. pp. 27–35. [Google Scholar]
- 35.Ames AI. CNS energy metabolism as related function. Brain Res Rev. 2000;34:42–68. doi: 10.1016/s0165-0173(00)00038-2. [DOI] [PubMed] [Google Scholar]
- 36.Timasheff SN. Protein-solvent preferential interactions, protein hydration, and the modulation of biochemical reactions by solvent components. Proc Natl Acad Sci U S A. 2002;99(15):9721–6. doi: 10.1073/pnas.122225399. [DOI] [PMC free article] [PubMed] [Google Scholar]
- 37.Baldwin RL. How Hofmeister ion interactions affect protein stability. Biophys J. 1996;71(4):2056–2063. doi: 10.1016/S0006-3495(96)79404-3. [DOI] [PMC free article] [PubMed] [Google Scholar]
- 38.Collins KD. Charge density-dependent strength of hydration and biological structure. Biophys J. 1997;72(1):65–76. doi: 10.1016/S0006-3495(97)78647-8. [DOI] [PMC free article] [PubMed] [Google Scholar]
- 39.Lai WM, Hou JS, Mow VC. A triphasic theory for the swelling and deformation behaviors of articular cartilage. J Biomech Eng. 1991;113(3):245–58. doi: 10.1115/1.2894880. [DOI] [PubMed] [Google Scholar]
- 40.Grodzinsky AJ, Levenston ME, Jin M, Frank EH. Cartilage tissue remodeling in response to mechanical forces. Annu Rev Biomed Eng. 2000;2:691–713. doi: 10.1146/annurev.bioeng.2.1.691. [DOI] [PubMed] [Google Scholar]
- 41.Torzilli PA, Deng XH, Ramcharan M. Effect of compressive strain on cell viability in statically loaded articular cartilage. Biomech Model Mechanobiol. 2006;5(2–3):123–32. doi: 10.1007/s10237-006-0030-5. [DOI] [PubMed] [Google Scholar]
- 42.Jayasuriya CT, Chen Y, Liu W, Chen Q. The influence of tissue microenvironment on stem cell-based cartilage repair. Ann N Y Acad Sci. 2016:27. doi: 10.1111/nyas.13170. [Epub ahead of print] [DOI] [PMC free article] [PubMed] [Google Scholar]
- 43.Huber M, Trattnig S, Lintner F. Anatomy, biochemistry, and physiology of articular cartilage. Invest Radiol. 2000;35(10):573–80. doi: 10.1097/00004424-200010000-00003. [DOI] [PubMed] [Google Scholar]
- 44.Bank RA, Soudry M, Maroudas A, Mizrahi J, TeKoppele JM. The increased swelling and instantaneous deformation of osteoarthritic cartilage is highly correlated with collagen degradation. Arthritis Rheum. 2000;43(10):2202–10. doi: 10.1002/1529-0131(200010)43:10<2202::AID-ANR7>3.0.CO;2-E. [DOI] [PubMed] [Google Scholar]
- 45.Mäkelä JTA, Huttu MRJ, Korhonen RK. Structure-function relationships in osteoarthritic human hip joint articular cartilage. Osteoarthritis Cartilage. 2012;20(11):1268–77. doi: 10.1016/j.joca.2012.07.016. [DOI] [PMC free article] [PubMed] [Google Scholar]
- 46.Mäkelä JT, Han SK, Herzog W, Korhonen RK. Very early osteoarthritis changes sensitively fluid flow properties of articular cartilage. J Biomech. 2015;48(12):3369–76. doi: 10.1016/j.jbiomech.2015.06.010. [DOI] [PubMed] [Google Scholar]
- 47.Tiku ML, Madhan B. Preserving the longevity of long-lived type II collagen and its implication for cartilage therapeutics. Ageing Res Rev. 2016;28:62–71. doi: 10.1016/j.arr.2016.04.011. [DOI] [PubMed] [Google Scholar]
- 48.Mow VC, Wang CC, Hung CT. The extracellular matrix, interstitial fluid and ions as a mechanical signal transducer in articular cartilage. Osteoarthritis Cartilage. 1999;7(1):41–58. doi: 10.1053/joca.1998.0161. [DOI] [PubMed] [Google Scholar]
- 49.Donnan FG. The theory of membrane equilibria. Chemical Revs. 1924;1:73–90. [Google Scholar]
- 50.Shapiro EM, Borthakur A, Dandora R, Kriss A, Leigh JS, Reddy R. Sodium visibility and quantitation in intact bovine articular cartilage using high field 23Na MRI and MRS. J Magn Reson. 2000;142(1):24–31. doi: 10.1006/jmre.1999.1932. [DOI] [PubMed] [Google Scholar]
- 51.Shapiro EM, Borthakur A, Gougoutas A, Reddy R. Na-23 MRI accurately measures fixed charge density in articular cartilage. Magn Reson Med. 2002;47:284–291. doi: 10.1002/mrm.10054. [DOI] [PMC free article] [PubMed] [Google Scholar]
- 52.Wheaton AJ, Borthakur A, Shapiro EM, Regatte RR, Akella SV, Kneeland JB, Reddy R. Proteoglycan loss in human knee cartilage: quantitation with sodium MR imaging--feasibility study. Radiology. 2004;231(3):900–5. doi: 10.1148/radiol.2313030521. [DOI] [PubMed] [Google Scholar]
- 53.Carstens KE, Phillips ML, Pozzo-Miller L, Weinberg RJ, Dudek SM. Perineuronal Nets Suppress Plasticity of Excitatory Synapses on CA2 Pyramidal Neurons. J Neurosci. 2016;36(23):6312–20. doi: 10.1523/JNEUROSCI.0245-16.2016. [DOI] [PMC free article] [PubMed] [Google Scholar]
- 54.Pan L, Zhao Y, Yuan Z, Qin G. Research advances on structure and biological functions of integrins. Springerplus. 2016;5(1):1094. doi: 10.1186/s40064-016-2502-0. eCollection 2016. [DOI] [PMC free article] [PubMed] [Google Scholar]
- 55.Bonneh-Barkay D, Wiley CA. Brain Extracellular Matrix in Neurodegeneration. Brain Pathol. 2009;19(4):573–585. doi: 10.1111/j.1750-3639.2008.00195.x. [DOI] [PMC free article] [PubMed] [Google Scholar]
- 56.Carare RO, Hawkes CA, Jeffrey M, Kalaria RN, Weller RO. Review: cerebral amyloid angiopathy, prion angiopathy, CADASIL and the spectrum of protein elimination failure angiopathies (PEFA) in neurodegenerative disease with a focus on therapy. Neuropathol Appl Neurobiol. 2013;39(6):593–611. doi: 10.1111/nan.12042.. [DOI] [PubMed] [Google Scholar]
- 57.Iliff JJ, Wang M, Liao Y, Plogg BA, Peng W, Gundersen GA, Benveniste H, Vates GE, Deane R, Goldman SA, Nagelhus EA, Nedergaard M. A paravascular pathway facilitates CSF flow through the brain parenchyma and the clearance of interstitial solutes, including amyloid β. Sci Transl Med. 2012;4(147):147ra111. doi: 10.1126/scitranslmed.3003748.. [DOI] [PMC free article] [PubMed] [Google Scholar]
- 58.Rennels ML, Blaumanis OR, Grady PA. Rapid solute transport throughout the brain via paravascular fluid pathways. Adv Neurol. 1990;52:431–9. [PubMed] [Google Scholar]
- 59.Zhang ET, Inman CB, Weller RO. Interrelationships of the pia mater and the perivascular (Virchow-Robin) spaces in the human cerebrum. J Anat. 1990;170:111–23. [PMC free article] [PubMed] [Google Scholar]
- 60.Cserr HF, Harling-Berg CJ, Knopf PM. Drainage of brain extracellular fluid into blood and deep cervical lymph and its immunological significance. Brain Pathol. 1992;2(4):269–76. doi: 10.1111/j.1750-3639.1992.tb00703.x. [DOI] [PubMed] [Google Scholar]
- 61.Aukland K, Reed RK. Interstitial-lymphatic mechanisms in the control of extracellular fluid volume. Physiol Rev. 1993;73(1):1–78. doi: 10.1152/physrev.1993.73.1.1. [DOI] [PubMed] [Google Scholar]
- 62.Abbott NJ. Evidence for bulk flow of brain interstitial fluid: significance for physiology and pathology. Neurochem Int. 2004;45(4):545–52. doi: 10.1016/j.neuint.2003.11.006. [DOI] [PubMed] [Google Scholar]
- 63.Weller RO. Microscopic morphology and histology of the human meninges. Morphologie. 2005;89(284):22–34. doi: 10.1016/s1286-0115(05)83235-7. [DOI] [PubMed] [Google Scholar]
- 64.Koh L, Zakharov A, Johnston M. Integration of the subarachnoid space and lymphatics: is it time to embrace a new concept of cerebrospinal fluid absorption? Cerebrospinal Fluid Res. 2005;2:6. doi: 10.1186/1743-8454-2-6. [DOI] [PMC free article] [PubMed] [Google Scholar]
- 65.Hadaczek P, Yamashita Y, Mirek H, Tamas L, Bohn MC, Noble C, Park JW, Bankiewicz K. The “perivascular pump” driven by arterial pulsation is a powerful mechanism for the distribution of therapeutic molecules within the brain. Mol Ther. 2006;14(1):69–78. doi: 10.1016/j.ymthe.2006.02.018. [DOI] [PMC free article] [PubMed] [Google Scholar]
- 66.Iliff JJ, Wang M, Liao Y, Plogg BA, Peng W, Gundersen GA, Benveniste H, Vates GE, Deane R, Goldman SA, Nagelhus EA, Nedergaard M. A paravascular pathway facilitates CSF flow through the brain parenchyma and the clearance of interstitial solutes, including amyloid β. Sci Transl Med. 2012;4(147):147ra111. doi: 10.1126/scitranslmed.3003748.. [DOI] [PMC free article] [PubMed] [Google Scholar]
- 67.Carare RO, Bernardes-Silva M, Newman TA, Page AM, Nicoll JA, Perry VH, Weller RO. Solutes, but not cells, drain from the brain parenchyma along basement membranes of capillaries and arteries: significance for cerebral amyloid angiopathy and neuroimmunology. Neuropathol Appl Neurobiol. 2008;34(2):131–44. doi: 10.1111/j.1365-2990.2007.00926.x. [DOI] [PubMed] [Google Scholar]
- 68.Weller RO, Subash M, Preston SD, Mazanti I, Carare RO. Perivascular drainage of amyloid-beta peptides from the brain and its failure in cerebral amyloid angiopathy and Alzheimer's disease. Brain Pathol. 2008;18(2):253–66. doi: 10.1111/j.1750-3639.2008.00133.x. [DOI] [PMC free article] [PubMed] [Google Scholar]
- 69.Ball KK, Cruz NF, Mrak RE, Dienel GA. Trafficking of glucose, lactate, and amyloid-beta from the inferior colliculus through perivascular routes. J Cereb Blood Flow Metab. 2010;30(1):162–76. doi: 10.1038/jcbfm.2009.206. [DOI] [PMC free article] [PubMed] [Google Scholar]
- 70.Naganawa S, Nakane T, Kawai H, Taoka T. Gd.based contrast enhancement of perivascular spaces in the basal ganglia. JSMRM Magn Reson Med Sci. doi: 10.2463/mrms.mp.2016-0039. org/10.2463/mrms.mp.2016-0039. [DOI] [PMC free article] [PubMed]
- 71.Feinberg DA, Crooks LA, Kaufman L, Brant-Zawadzki M, Posin JP, Arakawa M, Watts JC, Hoenninger J. Magnetic resonance imaging performance: a comparison of sodium and hydrogen. Radiology. 1985;156(1):133–8. doi: 10.1148/radiology.156.1.4001399. [DOI] [PubMed] [Google Scholar]
- 72.Perman WH, Thomasson DM, Bernstein MA, Turski PA. Multiple short-echo (2.5-ms) quantitation of in vivo sodium T2 relaxation. Magn Reson Med. 1989;9(2):153–60. doi: 10.1002/mrm.1910090202. [DOI] [PubMed] [Google Scholar]
- 73.Syková E, Nicholson C. Diffusion in Brain Extracellular Space. Physiol Rev. 2008;88(4):1277–1340. doi: 10.1152/physrev.00027.2007. [DOI] [PMC free article] [PubMed] [Google Scholar]
- 74.Verkman A. Diffusion in the extracellular space in brain and tumors. Phys Biol. 2013;10(4):045003. doi: 10.1088/1478-3975/10/4/045003. [DOI] [PMC free article] [PubMed] [Google Scholar]
- 75.Naritomi H, Kanashiro M, Sasaki M, Kuribayashi Y, Sawada T. In vivo measurements of intra- and extracellular Na+ and water in the brain and muscle by nuclear magnetic resonance spectroscopy with shift reagent. Biophys J. 1987;52(4):611–616. doi: 10.1016/S0006-3495(87)83251-4. [DOI] [PMC free article] [PubMed] [Google Scholar]
- 76.Winter PM, Bansal N. TmDOTP(5-) as a (23)Na shift reagent for the subcutaneously implanted 9L gliosarcoma in rats. Magn Reson Med. 2001;45(3):436–42. doi: 10.1002/1522-2594(200103)45:3<436::aid-mrm1057>3.0.co;2-6. [DOI] [PubMed] [Google Scholar]
- 77.Navon G. Complete Elimination of the Extracellular Na-23 Nmr Signal in Triple Quantum Filtered Spectra of Rat Hearts in the Presence of Shift-Reagents. Magn Reson Med. 1993;30(4):503–6. doi: 10.1002/mrm.1910300415. [DOI] [PubMed] [Google Scholar]
- 78.Thulborn KR. Why Neuroradiologists should consider Very High Field Magnets for Clinical Applications of fMRI? Top Magn Reson Imaging. 1999;10:1–2. doi: 10.1097/00002142-199902000-00001. [DOI] [PubMed] [Google Scholar]
- 79.Thulborn KR. Clinical rationale for very high field (3.0 Tesla) functional MR imaging. Top Magn Reson Imaging. 1999;10:37–50. doi: 10.1097/00002142-199902000-00004. [DOI] [PubMed] [Google Scholar]
- 80.Gizewski ER, Mönninghoff C, Forsting M. Perspectives of Ultra-High-Field MRI in Neuroradiology. Clin Neuroradiol. 2015;25(Suppl 2):267–73. doi: 10.1007/s00062-015-0437-4. [DOI] [PubMed] [Google Scholar]
- 81.Ugurbil K. Magnetic resonance imaging at ultrahigh fields. IEEE Trans Biomed Eng. 2014;61(5):1364–79. doi: 10.1109/TBME.2014.2313619. [DOI] [PMC free article] [PubMed] [Google Scholar]
- 82.Budinger TF, Bird MD, Frydman L, Long JR, Mareci TH, Rooney WD, Rosen B, Schenck JF, Schepkin VD, Sherry AD, Sodickson DK, Springer CS, Thulborn KR, Uğurbil K, Wald LL. Toward 20 T magnetic resonance for human brain studies: opportunities for discovery and neuroscience rationale. MAGMA. 2016;29(3):617–39. doi: 10.1007/s10334-016-0561-4. [DOI] [PMC free article] [PubMed] [Google Scholar]
- 83.Mansfield P, Chapman B. Active Magnetic Screening of Gradient Coils in NMR Imaging. J Magn Reson. 1986;66:573–576. [Google Scholar]
- 84.Spees WM, Buhl N, Sun P, Ackerman JJ, Neil JJ, Garbow JR. Quantification and compensation of eddy-current-induced magnetic-field gradients. J Magn Reson. 2011;212(1):116–23. doi: 10.1016/j.jmr.2011.06.016. [DOI] [PMC free article] [PubMed] [Google Scholar]
- 85.Miller JR, Zhang K, Ma QY, Mun IK, Jung KJ, Katz J, Face DW, Kountz DJ. Superconducting receiver coils for sodium magnetic resonance imaging. IEEE Trans Biomed Eng. 1996;43(12):1197–9. doi: 10.1109/10.544344. [DOI] [PubMed] [Google Scholar]
- 86.Qian Y, Zhao T, Wiggins GC, Wald LL, Zheng H, Weimer J, Boada FE. Sodium imaging of human brain at 7 T with 15-channel array coil. Magn Reson Med. 2012;68(6):1807–14. doi: 10.1002/mrm.24192. [DOI] [PMC free article] [PubMed] [Google Scholar]
- 87.Benkhedah N, Hoffmann SH, Biller A, Nagel AM. Evaluation of adaptive combination of 30-channel head receive coil array data in 23Na MR imaging. Magn Reson Med. 2016;75(2):527–36. doi: 10.1002/mrm.25572. [DOI] [PubMed] [Google Scholar]
- 88.Qian Y, Stenger VA, Boada FE. Parallel imaging with 3D TPI trajectory: SNR and acceleration benefits. Magn Reson Imaging. 2009;27(5):656–63. doi: 10.1016/j.mri.2008.10.008. [DOI] [PMC free article] [PubMed] [Google Scholar]
- 89.Qian Y, Zhang Z, Wang Y, Boada FE. Decomposed direct matrix inversion for fast non-cartesian SENSE reconstructions. Magn Reson Med. 2006;56(2):356–63. doi: 10.1002/mrm.20974. [DOI] [PubMed] [Google Scholar]
- 90.Niendorf T, Paul K, Oezerdem C, Graessl A, Klix S, Huelnhagen T, Hezel F, Rieger J, Waiczies H, Frahm J, Nagel AM, Oberacker E, Winter L. W(h)ither human cardiac and body magnetic resonance at ultrahigh fields? technical advances, practical considerations, applications, and clinical opportunities. NMR Biomed. 2015 Feb 23; doi: 10.1002/nbm.3268.. [Epub ahead of print] [DOI] [PubMed] [Google Scholar]
- 91.Alizai H, Chang G, Regatte RR. MRI of the Musculoskeletal System: Advanced Applications using High and Ultrahigh Field MRI. Semin Musculoskelet Radiol. 2015;19(4):363–74. doi: 10.1055/s-0035-1563735. [DOI] [PubMed] [Google Scholar]
- 92.Atkinson IC, Thulborn KR. Feasibility of Mapping the Tissue Mass Corrected Bioscale of Cerebral Metabolic Rate of Oxygen Consumption Using 17-Oxygen and 23-Sodium MR Imaging in a Human Brain at 9.4 T. NeuroImage. 2010;51:723–733. doi: 10.1016/j.neuroimage.2010.02.056. [DOI] [PubMed] [Google Scholar]
- 93.Rooney WD, Springer CS. A comprehensive approach to the analysis and interpretation of the resonances of spins 3/2 from living systems. NMR Biomed. 1991;4:209–226. doi: 10.1002/nbm.1940040502. [DOI] [PubMed] [Google Scholar]
- 94.Rooney WD, Springer CS. The molecular environment of intracellular sodium: 23Na NMR relaxation. NMR Biomed. 1991;4:227–245. doi: 10.1002/nbm.1940040503. [DOI] [PubMed] [Google Scholar]
- 95.Abragam A. Principles of Nuclear Magnetism. Chapter VII. Oxford University Press; Oxford: 1961. pp. 216–260. [Google Scholar]
- 96.Pekar J, Renshaw PF, Leigh JS. Selective Detection of Intracellular Sodium by Coherence-Transfer NMR. J Magn Reson. 1987;72:159–161. [Google Scholar]
- 97.Qian Y, Panigrahy A, Laymon CM, Lee VK, Drappatz J, Lieberman FS, Boada FE, Mountz JM. Short-T2 Imaging for Quantifying Concentration of Sodium (23Na) of Bi-Exponential T2 Relaxation. Mag Reson Med. 2014 doi: 10.1002/mrm.25393. [DOI] [PMC free article] [PubMed] [Google Scholar]
- 98.Ra JB, Hilal SK, Cho ZH. A method for in vivo MR imaging of the short T2 component of sodium-23. Magn Reson Med. 1986;3(2):296–302. doi: 10.1002/mrm.1910030213. [DOI] [PubMed] [Google Scholar]
- 99.Kalyanapuram R, Seshan V, Bansal N. Three-dimensional triple-quantum-filtered 23Na imaging of the dog head in vivo. J Magn Reson Imaging. 1998;8:1182–1189. doi: 10.1002/jmri.1880080527. [DOI] [PubMed] [Google Scholar]
- 100.Hancu I, Thulborn K, Schiff D, Shen G, Boada F. In vivo single and triple quantum filtered 23Na MRI of brain neoplasms. Proceedings of the 8th Annual Meeting of ISMRM; Denver. 2000; p. 388. [Google Scholar]
- 101.Borthakur A, Hancu I, Boada FE, Shen GX, Shapiro EM, Reddy R. In vivo triple quantum filtered twisted projection sodium MRI of human articular cartilage. J Magn Reson. 1999;141(2):286–90. doi: 10.1006/jmre.1999.1923. [DOI] [PubMed] [Google Scholar]
- 102.Madelin G, Jerschow A, Regatte RR. Sodium relaxation times in the knee joint in vivo at 7T. NMR Biomed. 2012;25(4):530–7. doi: 10.1002/nbm.1768. [DOI] [PMC free article] [PubMed] [Google Scholar]
- 103.Perman WH, Thomasson DM, Bernstein MA, Turski PA. Multiple short-echo (2.5-ms) quantitation of in vivo sodium T2 relaxation. Magn Reson Med. 1989;9(2):153–60. doi: 10.1002/mrm.1910090202. [DOI] [PubMed] [Google Scholar]
- 104.Thulborn KR, Ackerman JJH. Absolute molar concentrations by NMR in inhomogeneous B1: A scheme for analysis of in vivo metabolites. J Magn Reson. 1983;55:357–71. [Google Scholar]
- 105.Boada FE, Gillen JS, Shen GX, Chang SY, Thulborn KR. Fast three dimensional sodium imaging. Magn Reson Med. 1997;37:706–15. doi: 10.1002/mrm.1910370512. [DOI] [PubMed] [Google Scholar]
- 106.Lu A, Atkinson IC, Claiborne T, Damen F, Thulborn KR. Quantitative Sodium Imaging with a Flexible Twisted Projection Pulse Sequence. Magn Reson Med. 2010;63:1583–1593. doi: 10.1002/mrm.22381. [DOI] [PMC free article] [PubMed] [Google Scholar]
- 107.Thulborn KR, Boada FE, Shen GX, Christensen JD, Reese TG. Correction of B1 inhomogeneities using echo-planar imaging of water. Magn Reson Med. 1998;39:369–75. doi: 10.1002/mrm.1910390306. [DOI] [PubMed] [Google Scholar]
- 108.Lommen J, Konstandin S, Krämer P, Schad LR. Enhancing the quantification of tissue sodium content by MRI: time-efficient sodium B1 mapping at clinical field strengths. NMR Biomed. 2016;29(2):129–36. doi: 10.1002/nbm.3292. [DOI] [PubMed] [Google Scholar]
- 109.Tse DH, Wiggins CJ, Ivanov D, Brenner D, Hoffmann J, Mirkes C, Shajan G, Scheffler K, Uludağ K, Poser BA. Volumetric imaging with homogenised excitation and static field at 9.4 T. MAGMA. 2016;29(3):333–45. doi: 10.1007/s10334-016-0543-6. [DOI] [PMC free article] [PubMed] [Google Scholar]
- 110.Thulborn KR, Davis D, Adams H, Gindin T, Zhou J. Quantitative tissue sodium concentration mapping of the growth of focal cerebral tumors with sodium magnetic resonance imaging. Magn Reson Med. 1999;41:351–359. doi: 10.1002/(sici)1522-2594(199902)41:2<351::aid-mrm20>3.0.co;2-h. [DOI] [PubMed] [Google Scholar]
- 111.Thulborn KR, Gindin TS, Davis D, Erb P. Comprehensive MRI Protocol for Stroke Management: Tissue Sodium Concentration as a Measure of Tissue Viability in a Non-Human Primate Model and Clinical Studies. Radiology. 1999;139:26–34. doi: 10.1148/radiology.213.1.r99se15156. [DOI] [PubMed] [Google Scholar]
- 112.Mirkes CC, Hoffmann J, Shajan G, Pohmann R, Scheffler K. High-resolution quantitative sodium imaging at 9.4 Tesla. Magn Reson Med. 2015;73(1):342–51. doi: 10.1002/mrm.25096. [DOI] [PubMed] [Google Scholar]
- 113.Dahlmann A, Kopp C, Linz P, Cavallaro A, Seuss H, Eckardt KU, Luft FC, Titze J, Uder M, Hammon M. Quantitative assessment of muscle injury by (23)Na magnetic resonance imaging. Springerplus. 2016;5(1):661. doi: 10.1186/s40064-016-2193-6. eCollection 2016. [DOI] [PMC free article] [PubMed] [Google Scholar]
- 114.Zaric O, Pinker K, Zbyn S, Strasser B, Robinson S, Minarikova L, Gruber S, Farr A, Singer C, Helbich TH, Trattnig S, Bogner W. Quantitative Sodium MR Imaging at 7 T: Initial Results and Comparison with Diffusion-weighted Imaging in Patients with Breast Tumors. Radiology. 2016;280(1):39–48. doi: 10.1148/radiol.2016151304. [DOI] [PubMed] [Google Scholar]
- 115.Thulborn KR, Lui E, Guntin J, Jamil S, Sun Z, Claiborne TC, Atkinson IC. Quantitative sodium MRI of the human brain at 9.4 T provides assessment of tissue sodium concentration and cell volume fraction during normal aging. NMR Biomed. 2016;29(2):137–43. doi: 10.1002/nbm.3312. [DOI] [PMC free article] [PubMed] [Google Scholar]
- 116.Miller AJ, Joseph PM. The use of power images to perform quantitative analysis on low SNR MR images. Magn Reson Imaging. 1993;11(7):1051–1056. doi: 10.1016/0730-725x(93)90225-3. [DOI] [PubMed] [Google Scholar]
- 117.Koay CG, Basser PJ. Analytically exact correction scheme for signal extraction from noisy magnitude MR signals. J Magn Reson. 2006;179:317–322. doi: 10.1016/j.jmr.2006.01.016. [DOI] [PubMed] [Google Scholar]
- 118.Atkinson IC, Lu A, Thulborn KR. Clinically Constrained Optimization of flexTPI Acquisition Parameters for the Tissue Sodium Concentration Bioscale. Magn Reson Med. 2011;66(4):1089–99. doi: 10.1002/mrm.22908. [DOI] [PMC free article] [PubMed] [Google Scholar]
- 119.Romanzetti SC, Fiege DP, Celik A, Felder J, Shah NJ. Mapping tissue sodium concentration in the human brain: a comparison of MR sequences at 9.4 Tesla. Neuroimage. 2014;96:44–53. doi: 10.1016/j.neuroimage.2014.03.079. [DOI] [PubMed] [Google Scholar]
- 120.Qian Y, Panigrahy A, Laymon CM, Lee VK, Drappatz J, Lieberman FS, Boada FE, Mountz JM. Short-T2 imaging for quantifying concentration of sodium (23 Na) of bi-exponential T2 relaxation. Magn Reson Med. 2014 Jul 30; doi: 10.1002/mrm.25393.. [DOI] [PMC free article] [PubMed] [Google Scholar]
- 121.Lauterbur PC. Image formation by induced local interactions: Examples employing nuclear magnetic resonance. Nature. 1973;242:190–1. [PubMed] [Google Scholar]
- 122.Pipe JG. Basic spin physics. Magn Reson Imaging Clin N Am. 1999;7(4):607–27. [PubMed] [Google Scholar]
- 123.Roberts TP, Mikulis D. Neuro MR: principles. J Magn Reson Imaging. 2007;26(4):823–37. doi: 10.1002/jmri.21029. [DOI] [PubMed] [Google Scholar]
- 124.Grodd W, Klose U. Sodium-MR-imaging of the brain: initial clinical results. Neuroradiology. 1988;30(5):399–407. doi: 10.1007/BF00404105. [DOI] [PubMed] [Google Scholar]
- 125.Turski PA1, Perman WH, Houston L, Winkler SS. Clinical and experimental sodium magnetic resonance imaging. Radiol Clin North Am. 1988;26(4):861–71. [PubMed] [Google Scholar]
- 126.Twieg DB. The k-trajectory formulation of the NMR imaging process with applications in analysis and synthesis of imaging methods. Med Phys. 1983;10(5):610–21. doi: 10.1118/1.595331. [DOI] [PubMed] [Google Scholar]
- 127.Huettel SA, Song AW, McCarthy G. Functional Magnetic Resonance Imaging. Chapters 3–5. Sinauer; Sunderland: 2004. pp. 49–127. [Google Scholar]
- 128.Boada FE, Shen GX, Chang SY, Thulborn KR. Spectrally weighted twisted projection imaging: reducing T2 signal attenuation effects in fast three-dimensional sodium imaging. Magn Reson Med. 1997;38(6):1022–1028. doi: 10.1002/mrm.1910380624. [DOI] [PubMed] [Google Scholar]
- 129.Boada FE, Christensen JD, Gillen JS, Thulborn KR. Three-dimensional projection imaging with half the number of projections. Magn Reson Med. 1997;37(3):470–7. doi: 10.1002/mrm.1910370326. [DOI] [PubMed] [Google Scholar]
- 130.Chesler DA, Vevea M, Boada FE, Reese T, Chang C, Barreére BJ, Liu AM, Thulborn KR. Rapid 3-D reconstruction from 1-D projections for metabolic MR imaging of short T2 species. Proceedings of the 11th Annual Meeting of SMRM; Berlin, Germany. 1992; (Abstract 665) [Google Scholar]
- 131.Stearns CW, Chesler CW, Brownell GL. Three Dimensional Image Reconstruction in the Fourier Domain. IEEE Trans Nucl Sci. 1987;34:374–8. [Google Scholar]
- 132.Gurney PT, Hargreaves BA, Nishimura DG. Design and analysis of a practical 3D cones trajectory. Magn Reson Med. 2006;55:575–582. doi: 10.1002/mrm.20796. [DOI] [PubMed] [Google Scholar]
- 133.Nagel AM, Laun FB, Weber MA, Matthies C, Semmler W, Schad LR. Sodium MRI using a density-adapted 3D radial acquisition technique. Magn Reson Med. 2009;62:1565–1573. doi: 10.1002/mrm.22157. [DOI] [PubMed] [Google Scholar]
- 134.Konstandin S, Nagel AM, Heiler PM, Schad LR. Two-dimensional radial acquisition technique with density adaption in sodium MRI. Magn Reson Med. 2011;65(4):1090–6. doi: 10.1002/mrm.22684. [DOI] [PubMed] [Google Scholar]
- 135.Glover GH, Pauly JM. Projection reconstruction techniques for reduction of motion effects in MRI. Magn Reson Med. 1992;28(2):275–89. doi: 10.1002/mrm.1910280209. [DOI] [PubMed] [Google Scholar]
- 136.Qian Y, Boada FE. Acquisition-weighted stack of spirals for fast high-resolution three-dimensional ultra-short echo time MR imaging. Magn Reson Med. 2008;60:135–145. doi: 10.1002/mrm.21620. [DOI] [PMC free article] [PubMed] [Google Scholar]
- 137.Qian Y, Zhao T, Zheng H, Weimer J, Boada FE. High Resolution Sodium Imaging of Human Brain at 7T. Magn Reson Med. 2012;68(1):227–233. doi: 10.1002/mrm.23225. [DOI] [PMC free article] [PubMed] [Google Scholar]
- 138.Romanzetti S, Halse M, Kaffanke J, Zilles K, Balcom BJ, Shah NJ. A comparison of three SPRITE techniques for the quantitative 3D imaging of the 23Na spin density on a 4T whole-body machine. J Magn Reson. 2006;179(1):64–72. doi: 10.1016/j.jmr.2005.11.007. [DOI] [PubMed] [Google Scholar]
- 139.Pipe JG, Zwart NR, Aboussouan EA, Robison RK, Devaraj A, Johnson KO. A new design and rationale for 3D orthogonally oversampled k-space trajectories. Magn Reson Med. 2011;66(5):1303–11. doi: 10.1002/mrm.22918. [DOI] [PubMed] [Google Scholar]
- 140.Turley DC, Pipe JG. Distributed spirals: a new class of three-dimensional k-space trajectories. Magn Reson Med. 2013;70(2):413–9. doi: 10.1002/mrm.24475. [DOI] [PubMed] [Google Scholar]
- 141.Paling D1, Solanky BS, Riemer F, Tozer DJ, Wheeler-Kingshott CA, Kapoor R, Golay X, Miller DH. Sodium accumulation is associated with disability and a progressive course in multiple sclerosis. Brain. 2013;136(Pt 7):2305–17. doi: 10.1093/brain/awt149. [DOI] [PubMed] [Google Scholar]
- 142.Madelin G, Babb J, Xia D, Regatte RR. Repeatability of Quantitative Sodium Magnetic Resonance Imaging for Estimating Pseudo-Intracellular Sodium Concentration and Pseudo-Extracellular Volume Fraction in Brain at 3 T. PLoS ONE. 2015;10(3):e0118692. doi: 10.1371/journal.pone.0118692.. [DOI] [PMC free article] [PubMed] [Google Scholar]
- 143.Niesporek SC, Hoffmann SH, Berger MC, Benkhedah N, Kujawa A, Bachert P, Nagel AM. Partial volume correction for in vivo (23)Na-MRI data of the human brain. Neuroimage. 2015;112:353–63. doi: 10.1016/j.neuroimage.2015.03.025. [DOI] [PubMed] [Google Scholar]
- 144.Hoffmann SH, Radbruch A, Bock M, Semmler W, Nagel AM. Direct (17)O MRI with partial volume correction: first experiences in a glioblastoma patient. MAGMA. 2014;27(6):579–87. doi: 10.1007/s10334-014-0441-8. [DOI] [PubMed] [Google Scholar]
- 145.Solanky BS, Riemer F, Golay X, Wheeler-Kingshott CA. Sodium quantification in the spinal cord at 3T. Magn Reson Med. 2013;69(5):1201–8. doi: 10.1002/mrm.24696. [DOI] [PubMed] [Google Scholar]
- 146.Hafner S. Fast imaging in liquids and solids with the Back-projection Low Angle ShoT (BLAST) technique. Magn Reson Imaging. 1994;12(7):1047–51. doi: 10.1016/0730-725x(94)91236-p. [DOI] [PubMed] [Google Scholar]
- 147.Madio DP, Lowe IJ. Ultra-fast imaging using low flip angles and FIDs. Magn Reson Med. 1995;34(4):525–9. doi: 10.1002/mrm.1910340407. [DOI] [PubMed] [Google Scholar]
- 148.Idiyatullin D1, Corum C, Park JY, Garwood M. Fast and quiet MRI using a swept radiofrequency. J Magn Reson. 2006;181(2):342–9. doi: 10.1016/j.jmr.2006.05.014. [DOI] [PubMed] [Google Scholar]
- 149.Grodzki DM, Jakob PM, Heismann B. Ultrashort echo time imaging using pointwise encoding time reduction with radial acquisition (PETRA) Magn Reson Med. 2012;67(2):510–8. doi: 10.1002/mrm.23017. [DOI] [PubMed] [Google Scholar]
- 150.Weiger M, Pruessmann KP, Hennel F. MRI with zero echo time: hard versus sweep pulse excitation. Magn Reson Med. 2011;66(2):379–89. doi: 10.1002/mrm.22799. [DOI] [PubMed] [Google Scholar]
- 151.Idiyatullin D, Corum CA, Garwood M. Multi-Band-SWIFT. J Magn Reson. 2015;251:19–25. doi: 10.1016/j.jmr.2014.11.014. [DOI] [PMC free article] [PubMed] [Google Scholar]
- 152.Stobbe R, Beaulieu C. Sodium imaging optimization under specific absorption rate constraint. Magn Reson Med. 2008;59:345–355. doi: 10.1002/mrm.21468. [DOI] [PubMed] [Google Scholar]
- 153.Haacke EM, Brown RW, Thompson MR, Venkatesan R. Magnetic resonance imaging-Physical principles and sequence design. New York: John Wiley & Sons, Inc; 1999. p. 914. [Google Scholar]
- 154.Qian Y, Zhao T, Hue YK, Ibrahim TS, Boada FE. High-resolution spiral imaging on a whole-body 7T scanner with minimized image blurring. Magn Reson Med. 2010;63(3):543–52. doi: 10.1002/mrm.22215. [DOI] [PMC free article] [PubMed] [Google Scholar]
- 155.Konstandin S, Krämer P, Günther M, Schad LR. Sodium magnetic resonance imaging using ultra-short echo time sequences with anisotropic resolution and uniform k-space sampling. Magn Reson Imaging. 2015;33(3):319–27. doi: 10.1016/j.mri.2014.12.007. [DOI] [PubMed] [Google Scholar]
- 156.Mentrup D, Eggers H. Signal decay correction in 2D ultra-short echo time imaging. MAGMA. 2006;19(2):62–70. doi: 10.1007/s10334-006-0028-0. [DOI] [PubMed] [Google Scholar]
- 157.Wang L, Wu Y, Chang G, Chang G, MD, Oesingmann N, Schweitzer ME, MD, Jerschow A, Regatte RR. Rapid Isotropic 3D-Sodium MRI of the Knee Joint In-vivo at 7T. J Magn Reson Imaging: JMRI. 2009;30(3):606–14. doi: 10.1002/jmri.21881. [DOI] [PMC free article] [PubMed] [Google Scholar]
- 158.Seshan V, Sherry AD, Bansal N. Evaluation of triple quantum-filtered 23Na NMR spectroscopy in the in situ rat liver. Magn Reson Med. 1997;38:821–827. doi: 10.1002/mrm.1910380519. [DOI] [PubMed] [Google Scholar]
- 159.Petracca M, Vancea RO, Fleysher L, Jonkman LE, Oesingmann N, Inglese M. Brain intra- and extracellular sodium concentration in multiple sclerosis: a 7 T MRI study. Brain. 2016 Mar;139(Pt 3):795–806. doi: 10.1093/brain/awv386. Epub 2016 Jan 20. [DOI] [PubMed] [Google Scholar]
- 160.Madelin G, Kline R, Walvick R, Regatte RR. A method for estimating intracellular sodium concentration and extracellular volume fraction in brain in vivo using sodium magnetic resonance imaging. Scientific Reports. 2014;4:4763????. doi: 10.1038/srep04763.. [DOI] [PMC free article] [PubMed] [Google Scholar]
- 161.Stobbe R, Beaulieu C. In vivo sodium magnetic resonance imaging of the human brain using soft inversion recovery fluid attenuation. Magn Reson Med. 2005;54(5):1305–10. doi: 10.1002/mrm.20696. [DOI] [PubMed] [Google Scholar]
- 162.Trattnig S, Bogner W, Gruber S, Szomolanyi P, Juras V, Robinson S, Zbýň Š, Haneder S. Clinical applications at ultrahigh field (7T). Where does it make the difference? NMR Biomed. 2015 Mar 12; doi: 10.1002/nbm.3272. [Epub ahead of print] [DOI] [PubMed] [Google Scholar]
- 163.Wiggins GC, Brown R, Lakshmanan K. High-performance radiofrequency coils for (23)Na MRI: brain and musculoskeletal applications. NMR Biomed. 2016;29:96–106. doi: 10.1002/nbm.3379. Epub 2015 Sep 24. [DOI] [PMC free article] [PubMed] [Google Scholar]
- 164.Yan X, Xue R, Zhang X. A monopole/loop dual-tuned RF coil for ultrahigh field MRI. Quant Imaging Med Surg. 2014;4:225–31. doi: 10.3978/j.issn.2223-4292.2014.08.03.. [DOI] [PMC free article] [PubMed] [Google Scholar]
- 165.Bangerter NK, Kaggie JD, Taylor MD, Hadley JR. Sodium MRI radiofrequency coils for body imaging. NMR Biomed. 2016;29:107–18. doi: 10.1002/nbm.3392. Epub 2015 Sep 29. [DOI] [PubMed] [Google Scholar]
- 166.Shajan G, Mirkes C, Buckenmaier K, Hoffmann J, Pohmann R, Scheffler K. Three-layered radio frequency coil arrangement for sodium MRI of the human brain at 9.4 Tesla. Magn Reson Med. 2016;75:906–16. doi: 10.1002/mrm.25666. Epub 2015 Mar 11. [DOI] [PubMed] [Google Scholar]
- 167.Kim JH, Moon CH, Park BW, Furlan A, Zhao T, Bae KT. Multichannel transceiver dual-tuned RF coil for proton/sodium MR imaging of knee cartilage at 3 T. Magn Reson Imaging. 2012;30:562–71. doi: 10.1016/j.mri.2011.12.011. Epub 2012 Jan 30. [DOI] [PubMed] [Google Scholar]
- 168.Zbýň Š, Mlynárik V, Juras V, Szomolanyi P, Trattnig S. Evaluation of cartilage repair and osteoarthritis with sodium MRI. NMR Biomed. 2016;29:206–15. doi: 10.1002/nbm.3280. Epub 2015 Mar 23. [DOI] [PubMed] [Google Scholar]
- 169.Kurhanewicz J, Bok R, Nelson SJ, Vigneron DB. Current and Potential Applications of Clinical 13C MR Spectroscopy. J Nucl Med. 2008;49(3):341–344. doi: 10.2967/jnumed.107.045112. [DOI] [PMC free article] [PubMed] [Google Scholar]
- 170.Hollingworth W, Todd CJ, Bell MI, Arafat Q, Girling S, Karia KR, Dixon AK. The Diagnostic and Therapeutic Impact of MRI: an Observational Multi-centre Study. Clinical Radiology. 2000;55(11):825–831. doi: 10.1053/crad.2000.0546. [DOI] [PubMed] [Google Scholar]
- 171.Kuhl C, Weigel S, Schrading S, Arand B, Bieling H, König R, Tombach B, Leutner C, Rieber-Brambs A, Nordhoff D, Heindel W, Reiser M, Schild HH. Prospective multicenter cohort study to refine management recommendations for women at elevated familial risk of breast cancer: the EVA trial. J Clin Oncol. 2010;28(9):1450–7. doi: 10.1200/JCO.2009.23.0839. [DOI] [PubMed] [Google Scholar]
- 172.Boscia F, Begum G, Pignataro G, Sirabella R, Cuomo O, Casamassa A, Sun D, Annunziato L. Glial Na+-dependent ion transporters in pathophysiological conditions. Glia. 2016 Jul 26; doi: 10.1002/glia.23030. [Epub ahead of print] [DOI] [PMC free article] [PubMed] [Google Scholar]
- 173.Isaksen TJ, Lykke-Hartmann K. Insights into the Pathology of the α2-Na+/K+-ATPase in Neurological Disorders; Lessons from Animal Models. Front Physiol. 2016;7:161. doi: 10.3389/fphys.2016.00161.. [DOI] [PMC free article] [PubMed] [Google Scholar]
- 174.Bøttger P, Doğanl C, Lykke-Hartmann K. Migraine- and dystonia-related disease-mutations of Na+/K+-ATPases: relevance of behavioral studies in mice to disease symptoms and neurological manifestations in humans. Neurosci Biobehav Rev. 2012;36(2):855–71. doi: 10.1016/j.neubiorev.2011.10.005. [DOI] [PubMed] [Google Scholar]
- 175.Heinzen EL, Arzimanoglou A, Brashear A, Clapcote SJ, Gurrieri F, Goldstein DB, Jóhannesson SH, Mikati MA, Neville B, Nicole S, Ozelius LJ, Poulsen H, Schyns T, Sweadner KJ, van den Maagdenberg A, Vilsen B ATP1A3 Working Group. Distinct neurological disorders with ATP1A3 mutations. Lancet Neurol. 2014;13(5):503–514. doi: 10.1016/S1474-4422(14)70011-0. [DOI] [PMC free article] [PubMed] [Google Scholar]
- 176.Eisele P, Konstandin S, Griebe M, Szabo K, Wolf ME, Alonso A, Ebert A, Serwane J, Rossmanith C, Hennerici MG, Schad LR, Gass A. Heterogeneity of acute multiple sclerosis lesions on sodium (23Na) MRI. Mult Scler. 2016;22(8):1040–7. doi: 10.1177/1352458515609430. [DOI] [PubMed] [Google Scholar]
- 177.Zaaraoui W1, Konstandin S, Audoin B, Nagel AM, Rico A, Malikova I, Soulier E, Viout P, Confort-Gouny S, Cozzone PJ, Pelletier J, Schad LR, Ranjeva JP. Distribution of brain sodium accumulation correlates with disability in multiple sclerosis: a cross-sectional 23Na MR imaging study. Radiology. 2012;264(3):859–67. doi: 10.1148/radiol.12112680. [DOI] [PubMed] [Google Scholar]
- 178.Inglese M, Madelin G, Oesingmann N, Babb JS, Stoeckel B, Johnson HJ. Brain tissue sodium concentration in multiple sclerosis: a sodium imaging study at 3 tesla. Brain. 2010;133:847–57. doi: 10.1093/brain/awp334. [DOI] [PMC free article] [PubMed] [Google Scholar]
- 179.Dani KA, Warach S. Metabolic Imaging of Ischemic Stroke: The Present and Future. AJNR Am J Neuroradiol. 2014;35:S37–S43. doi: 10.3174/ajnr.A3789. [DOI] [PubMed] [Google Scholar]
- 180.Asadi H, Williams D, Thornton J. Changing Management of Acute Ischaemic Stroke: the New Treatments and Emerging Role of Endovascular Therapy. Curr Treat Options Neurol. 2016;18(5):20. doi: 10.1007/s11940-016-0403-8.. [DOI] [PubMed] [Google Scholar]
- 181.Mokin M, Rojas H, Levy EI. Randomized trials of endovascular therapy for stroke--impact on stroke care. Nat Rev Neurol. 2016;12(2):86–94. doi: 10.1038/nrneurol.2015.240. [DOI] [PubMed] [Google Scholar]
- 182.Akbik F, Hirsch JA, Cougo-Pinto PT, Chandra RV, Simonsen CZ, Leslie-Mazwi T. The Evolution of Mechanical Thrombectomy for Acute Stroke. Curr Treat Options Cardiovasc Med. 2016;18(5):32. doi: 10.1007/s11936-016-0457-7.. [DOI] [PubMed] [Google Scholar]
- 183.Tatlisumak T. Implication of the recent positive endovascular intervention trials for organizing acute stroke care: European perspective. Stroke. 2015;46(6):1468–73. doi: 10.1161/STROKEAHA.115.008386. [DOI] [PubMed] [Google Scholar]
- 184.Campbell BC. Thrombolysis and Thrombectomy for Acute Ischemic Stroke: Strengths and Synergies. Semin Thromb Hemost. 2016 Jul 29; doi: 10.1055/s-0036-1585078. [Epub ahead of print] [DOI] [PubMed] [Google Scholar]
- 185.An H, Ford AL, Eldeniz C, Chen Y, Vo KD, Zhu H, Powers WJ, Lin W, Lee JM. Reperfusion Beyond 6 Hours Reduces Infarct Probability in Moderately Ischemic Brain Tissue. Stroke. 2016 Jan;47(1):99–105. doi: 10.1161/STROKEAHA.115.010656. Epub 2015 Nov 19. [DOI] [PMC free article] [PubMed] [Google Scholar]
- 186.Vexler ZS, Roberts TP, Derugin N, Kozniewska E, Arieff AI, Kucharczyk J. Mechanisms of brain injury associated with partial and complete occlusion of the MCA in cat. Acta Neurochir Suppl (Wien) 1994;60:211–5. doi: 10.1007/978-3-7091-9334-1_57. [DOI] [PubMed] [Google Scholar]
- 187.Thulborn KR, Gindin TS, Davis D, Erb P. Comprehensive MR imaging protocol for stroke management: tissue sodium concentration as a measure of tissue viability in nonhuman primate studies and in clinical studies. Radiology. 1999;213(1):156–66. doi: 10.1148/radiology.213.1.r99se15156. [DOI] [PubMed] [Google Scholar]
- 188.Thulborn KR, Davis D, Snyder J, Yonas H, Kassam A. Sodium MR imaging of acute and subacute stroke for assessment of tissue viability. Neuroimaging Clin N Am. 2005;15(3):639–53. doi: 10.1016/j.nic.2005.08.003. [DOI] [PubMed] [Google Scholar]
- 189.Boada FE, LaVerde G, Jungreis C, Nemoto E, Tanase C, Hancu I. Loss of Cell Ion Homeostasis and Cell Viability in the Brain: What Sodium MRI Can Tell Us. Curr Top Dev Biol. 2005;70:77–101. doi: 10.1016/S0070-2153(05)70004-1. [DOI] [PubMed] [Google Scholar]
- 190.Boada F, Laverde G, Jungreis C, Nemoto E, Tanase C. Triple/Single quantum filtered sodium MRI of acute brain ischemia. Conf Proc IEEE Eng Med Biol Soc. 2005;1:731–4. doi: 10.1109/IEMBS.2005.1616518. [DOI] [PubMed] [Google Scholar]
- 191.Hussain MS, Stobbe RW, Bhagat YA, Emery D, Butcher KS, Manawadu D, Rizvi N, Maheshwari P, Scozzafava J, Shuaib A, Beaulieu C. Sodium imaging intensity increases with time after human ischemic stroke. Ann Neurol. 2009;66(1):55–62. doi: 10.1002/ana.21648. [DOI] [PubMed] [Google Scholar]
- 192.Boada FE, Qian Y, Nemoto E, Jovin T, Jungreis C, Jones SC, Weimer J, Lee V. Sodium MRI and the Assessment of Irreversible Tissue Damage During Hyper-Acute Stroke. Translational Stroke Research. 2012;3(2):236–245. doi: 10.1007/s12975-012-0168-7. [DOI] [PubMed] [Google Scholar]
- 193.Hacke W, Schwab S, Horn M, Spranger M, De Georgia M, von Kummer R. Malignant middle cerebral artery territory infarction: clinical course and prognostic signs. Arch Neurol. 1996;53:309–15. doi: 10.1001/archneur.1996.00550040037012. [DOI] [PubMed] [Google Scholar]
- 194.Oppenheim C, Samson Y, Manaï R, Lalam T, Vandamme X, Crozier S, Srour A, Cornu P, Dormont D, Rancurel G, Marsault C. Prediction of Malignant Middle Cerebral Artery Infarction by Diffusion-Weighted Imaging. Stroke. 2000;31:2175–2181. doi: 10.1161/01.str.31.9.2175. [DOI] [PubMed] [Google Scholar]
- 195.Cho DY, Chen TC, Lee HC. Ultra-early decompressive craniectomy for malignant middle cerebral artery infarction. Surg Neurol. 2003;60(3):227–32. doi: 10.1016/s0090-3019(03)00266-0. discussion 232–3. [DOI] [PubMed] [Google Scholar]
- 196.Treadwell SD, Thanvi B. Malignant middle cerebral artery (MCA) infarction: pathophysiology, diagnosis and management. Postgrad Med J. 2010;86(1014):235–42. doi: 10.1136/pgmj.2009.094292. [DOI] [PubMed] [Google Scholar]
- 197.Kalia KK, Yonas H. An aggressive approach to massive middle cerebral artery infarction. Arch Neurol. 1993;50(12):1293–7. doi: 10.1001/archneur.1993.00540120010005. [DOI] [PubMed] [Google Scholar]
- 198.Kostov DB, Singleton RH, Panczykowski D, Kanaan HA, Horowitz MB, Jovin T, Jankowitz BT. Decompressive hemicraniectomy, strokectomy, or both in the treatment of malignant middle cerebral artery syndrome. World Neurosurg. 2012;78(5):480–6. doi: 10.1016/j.wneu.2011.12.080. [DOI] [PubMed] [Google Scholar]
- 199.Cheung A, Telaghani CK, Wang J, Yang Q, Mosher TJ, Reichwein RK, Cockroft KM. Neurological recovery after decompressive craniectomy for massive ischemic stroke. Neurocrit Care. 2005;3(3):216–23. doi: 10.1385/NCC:3:3:216. [DOI] [PubMed] [Google Scholar]
- 200.Thulborn KR, Carpenter PA, Just MA. Plasticity of language-related brain function during recovery from stroke. Stroke. 1999;30:749–754. doi: 10.1161/01.str.30.4.749. [DOI] [PubMed] [Google Scholar]
- 201.Stupp R, Mason WP, van den Bent MJ, Weller M, Fisher B, Taphoorn MJ, Belanger K, Brandes AA, Marosi C, Bogdahn U, Curschmann J, Janzer RC, Ludwin SK, Gorlia T, Allgeier A, Lacombe D, Cairncross JG, Eisenhauer E, Mirimanoff RO European Organisation for Research and Treatment of Cancer Brain Tumor and Radiotherapy Groups; National Cancer Institute of Canada Clinical Trials Group. Radiotherapy plus concomitant and adjuvant temozolomide for glioblastoma. N Engl J Med. 2005;352(10):987–96. doi: 10.1056/NEJMoa043330. [DOI] [PubMed] [Google Scholar]
- 202.Stupp R, Hegi ME, Mason WP, van den Bent MJ, Taphoorn MJ, Janzer RC, Ludwin SK, Allgeier A, Fisher B, Belanger K, Hau P, Brandes AA, Gijtenbeek J, Marosi C, Vecht CJ, Mokhtari K, Wesseling P, Villa S, Eisenhauer E, Gorlia T, Weller M, Lacombe D, Cairncross JG, Mirimanoff RO European Organisation for Research and Treatment of Cancer Brain Tumour and Radiation Oncology Groups; National Cancer Institute of Canada Clinical Trials Group. Effects of radiotherapy with concomitant and adjuvant temozolomide versus radiotherapy alone on survival in glioblastoma in a randomised phase III study: 5-year analysis of the EORTC-NCIC trial. Lancet Oncol. 2009;10(5):459–66. doi: 10.1016/S1470-2045(09)70025-7. [DOI] [PubMed] [Google Scholar]
- 203.Galbán CJ, Chenevert TL, Meyer CR, Tsien C, Lawrence TS, Hamstra DA, Junck L, Sundgren PC, Johnson TD, Ross DJ, Rehemtulla A, Ross BD. The parametric response map is an imaging biomarker for early cancer treatment outcome. Nat Med. 2009;15(5):572–6. doi: 10.1038/nm.1919. [DOI] [PMC free article] [PubMed] [Google Scholar]
- 204.Kickingereder P, Radbruch A, Burth S, Wick A, Heiland S, Schlemmer HP, Wick W, Bendszus M, Bonekamp D. MR Perfusion-derived Hemodynamic Parametric Response Mapping of Bevacizumab Efficacy in Recurrent Glioblastoma. Radiology. 2016;279(2):542–52. doi: 10.1148/radiol.2015151172. [DOI] [PubMed] [Google Scholar]
- 205.Ceschin R, Kurland BF, Abberbock SR, Ellingson BM, Okada H, Jakacki RI, Pollack IF, Panigrahy A. Parametric Response Mapping of Apparent Diffusion Coefficient as an Imaging Biomarker to Distinguish Pseudoprogression from True Tumor Progression in Peptide-Based Vaccine Therapy for Pediatric Diffuse Intrinsic Pontine Glioma. AJNR Am J Neuroradiol. 2015;36(11):2170–6. doi: 10.3174/ajnr.A4428. [DOI] [PMC free article] [PubMed] [Google Scholar]
- 206.Yun TJ, Park CK, Kim TM, Lee SH, Kim JH, Sohn CH, Park SH, Kim IH, Choi SH. Glioblastoma treated with concurrent radiation therapy and temozolomide chemotherapy: differentiation of true progression from pseudoprogression with quantitative dynamic contrast-enhanced MR imaging. Radiology. 2015;274(3):830–40. doi: 10.1148/radiol.14132632. [DOI] [PubMed] [Google Scholar]
- 207.McNamara MG, Sahebjam S, Mason WP. Emerging Biomarkers in Glioblastoma. Cancers (Basel) 2013;5(3):1103–1119. doi: 10.3390/cancers5031103. [DOI] [PMC free article] [PubMed] [Google Scholar]
- 208.Li X, Zhu Y, Kang H, Zhang Y, Liang H, Wang S, Zhang W. Glioma grading by microvascular permeability parameters derived from dynamic contrast-enhanced MRI and intratumoral susceptibility signal on susceptibility weighted imaging. Cancer Imaging. 2015;15:4. doi: 10.1186/s40644-015-0039-z.. [DOI] [PMC free article] [PubMed] [Google Scholar]
- 209.Bisdas S, Braun C, Skardelly M, Schittenhelm J, Teo TH, Thng CH, Klose U, Koh TS. Correlative assessment of tumor microcirculation using contrast-enhanced perfusion MRI and intravoxel incoherent motion diffusion-weighted MRI: is there a link between them? NMR Biomed. 2014;27(10):1184–91. doi: 10.1002/nbm.3172. [DOI] [PubMed] [Google Scholar]
- 210.Choi YS, Kim DW, Lee SK, Chang JH, Kang SG, Kim EH, Kim SH, Rim TH, Ahn SS. The Added Prognostic Value of Preoperative Dynamic Contrast-Enhanced MRI Histogram Analysis in Patients with Glioblastoma: Analysis of Overall and Progression-Free Survival. AJNR Am J Neuroradiol. 2015;36(12):2235–41. doi: 10.3174/ajnr.A4449. [DOI] [PMC free article] [PubMed] [Google Scholar]
- 211.Jakubovic R, Zhou S, Heyn C, Soliman H, Zhang L, Aviv R, Sahgal A. The predictive capacity of apparent diffusion coefficient (ADC) in response assessment of brain metastases following radiation. Clin Exp Metastasis. 2016;33(3):277–84. doi: 10.1007/s10585-016-9778-x. [DOI] [PubMed] [Google Scholar]
- 212.Price SJ, Jena R, Burnet NG, Hutchinson PJ, Dean AF, Peña A, Pickard JD, Carpenter TA, Gillard JH. Improved delineation of glioma margins and regions of infiltration with the use of diffusion tensor imaging: an image-guided biopsy study. AJNR Am J Neuroradiol. 2006;27(9):1969–74. [PMC free article] [PubMed] [Google Scholar]
- 213.Vargová L, Homola A, Zámecník J, Tichý M, Benes V, Syková E. Diffusion parameters of the extracellular space in human gliomas. Glia. 2003;42(1):77–88. doi: 10.1002/glia.10204. [DOI] [PubMed] [Google Scholar]
- 214.Zámecník J, Vargová L, Homola A, Kodet R, Syková E. Extracellular matrix glycoproteins and diffusion barriers in human astrocytic tumours. Neuropathol Appl Neurobiol. 2004;30(4):338–50. doi: 10.1046/j.0305-1846.2003.00541.x. [DOI] [PubMed] [Google Scholar]
- 215.Cameron IL, Smith NK, Pool TB, Sparks RL. Intracellular concentration of sodium and other elements as related to mitogenesis and oncogenesis in vivo. Cancer Res. 1980;40(5):1493–500. [PubMed] [Google Scholar]
- 216.Bruehlmeier M, Roelcke U, Bläuenstein P, Missimer J, Schubiger PA, Locher JT, Pellikka R, Ametamey SM. Measurement of the extracellular space in brain tumors using 76Br-bromide and PET. J Nucl Med. 2003;44(8):1210–8. [PubMed] [Google Scholar]
- 217.Thulborn KR, Lu A, Atkinson IC, Damen F, Villano JL. Quantitative sodium MR imaging and sodium bioscales for the management of brain tumors. Neuroimaging Clin N Am. 2009;19(4):615–24. doi: 10.1016/j.nic.2009.09.001.. [DOI] [PMC free article] [PubMed] [Google Scholar]
- 218.Haneder S1, Giordano FA, Konstandin S, Brehmer S, Buesing KA, Schmiedek P, Schad LR, Wenz F, Schoenberg SO, Ong MM. ²³Na-MRI of recurrent glioblastoma multiforme after intraoperative radiotherapy: technical note. Neuroradiology. 2015;57(3):321–6. doi: 10.1007/s00234-014-1468-2. [DOI] [PubMed] [Google Scholar]
- 219.Prentice RL. Surrogate endpoints in clinical trials: definition and operational criteria. Stat Med. 1989;8(4):431–40. doi: 10.1002/sim.4780080407. [DOI] [PubMed] [Google Scholar]
- 220.Berger VW. Does the Prentice criterion validate surrogate endpoints? Stat Med. 2004;23(10):1571–8. doi: 10.1002/sim.1780. [DOI] [PubMed] [Google Scholar]
- 221.Weber MA, Henze M, Tüttenberg J, Stieltjes B, Meissner M, Zimmer F, Burkholder I, Kroll A, Combs SE, Vogt-Schaden M, Giesel FL, Zoubaa S, Haberkorn U, Kauczor HU, Essig M. Biopsy targeting gliomas: do functional imaging techniques identify similar target areas? Invest Radiol. 2010;45(12):755–68. doi: 10.1097/RLI.0b013e3181ec9db0. [DOI] [PubMed] [Google Scholar]
- 222.Bartha R, Megyesi JF, Watling CJ. Low-grade glioma: correlation of short echo time 1H-MR spectroscopy with 23Na MR imaging. AJNR Am J Neuroradiol. 2008;29(3):464–70. doi: 10.3174/ajnr.A0854. [DOI] [PMC free article] [PubMed] [Google Scholar]
- 223.Biller A, Badde S, Nagel A, Neumann JO, Wick W, Hertenstein A, Bendszus M, Sahm F, Benkhedah N, Kleesiek J. Improved Brain Tumor Classification by Sodium MR Imaging: Prediction of IDH Mutation Status and Tumor Progression. AJNR Am J Neuroradiol. 2016;37(1):66–73. doi: 10.3174/ajnr.A4493. [DOI] [PMC free article] [PubMed] [Google Scholar]
- 224.Parsons DW, Jones S, Zhang X, Lin JC, Leary RJ, Angenendt P, Mankoo P, Carter H, Siu IM, Gallia GL, Olivi A, McLendon R, Rasheed BA, Keir S, Nikolskaya T, Nikolsky Y, Busam DA, Tekleab H, Diaz LA, Jr, Hartigan J, Smith DR, Strausberg RL, Marie SK, Shinjo SM, Yan H, Riggins GJ, Bigner DD, Karchin R, Papadopoulos N, Parmigiani G, Vogelstein B, Velculescu VE, Kinzler KW. An integrated genomic analysis of human glioblastoma multiforme. Science. 2008;321(5897):1807–12. doi: 10.1126/science.1164382. [DOI] [PMC free article] [PubMed] [Google Scholar]
- 225.Molenaar RJ. Ion Channels in Glioblastoma. ISRN Neurology. 2011;2011:590249. doi: 10.5402/2011/590249.. [DOI] [PMC free article] [PubMed] [Google Scholar]
- 226.Cong D, Zhu W, Kuo JS, Shaoshan Hu S, Sun D. Ion transporters in brain tumors. Curr Med Chem. 2015;22(10):1171–1181. doi: 10.2174/0929867322666150114151946. [DOI] [PMC free article] [PubMed] [Google Scholar]
- 227.Turner KL, Sontheimer H. Cl and K+ channels and their role in primary brain tumour biology. Philos Trans R Soc Lond B Biol Sci. 2014;369(1638):20130095. doi: 10.1098/rstb.2013.0095. [DOI] [PMC free article] [PubMed] [Google Scholar]
- 228.Thompson EG, Sontheimer H. A role for ion channels in perivascular glioma invasion. Eur Biophys J. 2016 Jul 16; doi: 10.1007/s00249-016-1154-x. [Epub ahead of print] [DOI] [PMC free article] [PubMed] [Google Scholar]
- 229.Heywang-Köbrunner SH1, Hacker A, Sedlacek S. Magnetic resonance imaging: the evolution of breast imaging. Breast. 2013;22(Suppl 2):S77–82. doi: 10.1016/j.breast.2013.07.014. [DOI] [PubMed] [Google Scholar]
- 230.Ouwerkerk R, Jacobs MA, Macura KJ, Wolff AC, Stearns V, Mezban SD, Khouri NF, Bluemke DA, Bottomley PA. Elevated tissue sodium concentration in malignant breast lesions detected with non-invasive 23Na MRI. Breast Cancer Res Treat. 2007;106(2):151–60. doi: 10.1007/s10549-006-9485-4. [DOI] [PubMed] [Google Scholar]
- 231.Jacobs MA, Ouwerkerk R, Wolff AC, Gabrielson E, Warzecha H, Jeter S, Bluemke DA, Wahl R, Stearns V. Monitoring of neoadjuvant chemotherapy using multiparametric, 23Na sodium MR, and multimodality (PET/CT/MRI) imaging in locally advanced breast cancer. Breast Cancer Res Treat. 2011;128(1):119–126. doi: 10.1007/s10549-011-1442-1. [DOI] [PMC free article] [PubMed] [Google Scholar]
- 232.Hausmann D, Konstandin S, Wetterling F, Haneder S, Nagel AM, Dinter DJ, Schönberg SO, Zöllner FG, Schad LR. Apparent diffusion coefficient and sodium concentration measurements in human prostate tissue via hydrogen-1 and sodium- 23 magnetic resonance imaging in a clinical setting at 3T. Invest Radiol. 2012;47(12):677–82. doi: 10.1097/RLI.0b013e318267bc6f. [DOI] [PubMed] [Google Scholar]
- 233.Alzheimer’s Association. Alzheimer's disease facts and figures. Alzheimers Dement 2015. 2015;11(3):332–84. doi: 10.1016/j.jalz.2015.02.003. [DOI] [PubMed] [Google Scholar]
- 234.Schneider LS, Mangialasche F, Andreasen N, Feldman H, Giacobini E, Jones R, Mantua V, Mecocci P, Pani L, Winblad B, Kivipelto M. Clinical trials and late-stage drug development for Alzheimer’s disease: an appraisal from 1984 to 2014. of Intern Med. 2014;275(3):251–283. doi: 10.1111/joim.12191. [DOI] [PMC free article] [PubMed] [Google Scholar]
- 235.Snitz BE, O’Meara S, Carlson MC, Arnold AM, Ives DG, Rapp SR, Saxton J, Lopez OL, Dunn LO, Sink KM, DeKosky ST for Ginkgo Evaluation of Memory (GEM) Study investigators. Ginkgo biloba for Preventing Cognitive Decline in Older Adults: a Randomized Trial. JAMA. 2009;302(24):2663–2670. doi: 10.1001/jama.2009.1913. [DOI] [PMC free article] [PubMed] [Google Scholar]
- 236.Green RC, Schneider LS, Amato DA, Beelen AP, Wilcock G, Swabb EA, Zavitz KH (Tarenflurbil Phase 3 Study Group) Effects of Tarenflurbil on Cognitive Decline and Activities of Daily Living in Patients with Mild Alzheimer’s Disease. AMA. 2009;302(23):2557–2564. doi: 10.1001/jama.2009.1866. [DOI] [PMC free article] [PubMed] [Google Scholar]
- 237.Farlow M, Gracon SI, Hershey LA, Lewis KW, Sadowsky CH, Dolan-Ureno J. A controlled trial of tacrine in Alzheimer's disease. JAMA. 1992;268:2523–2529. [PubMed] [Google Scholar]
- 238.Knapp MJ, Knopman DS, Solomon PR, Pendlebury WW, Davis CS, Gracon SI. A 30-week randomized controlled trial of high-dose tacrine in patients with Alzheimer's disease. JAMA. 1994;271:985–991. [PubMed] [Google Scholar]
- 239.Sano M, Ernesto C, Thomas RG, Klauber MR, Schafer K, Grundman M, Woodbury P, Growdon J, Cotman CW, Pfeiffer E, Schneider LS, Thal LJ for the Members of the Alzheimer's Disease Cooperative Study. A Controlled Trial of Selegiline, Alpha-Tocopherol, or Both as Treatment for Alzheimer's Disease. N Engl J Med. 1997;336:1216–1222. doi: 10.1056/NEJM199704243361704. [DOI] [PubMed] [Google Scholar]
- 240.Wilcock GK, Black SE, Hendrix SB, Zavitz KH, Swabb EA, Laughlin MA Tarenflurbil Phase II Study investigators. Efficacy and safety of tarenflurbil in mild to moderate Alzheimer's disease: a randomised phase II trial. Lancet Neurol. 2008;7(6):483–93. doi: 10.1016/S1474-4422(08)70090-5. [DOI] [PubMed] [Google Scholar]
- 241.Knight MJ, McCann B, Kauppinen RA, Coulthard EJ. Magnetic Resonance Imaging to Detect Early Molecular and Cellular Changes in Alzheimer's Disease. Front Aging Neurosci. 2016 Jun 16;8:139. doi: 10.3389/fnagi.2016.00139. eCollection 2016. [DOI] [PMC free article] [PubMed] [Google Scholar]
- 242.Serrano-Pozo A, Frosch MP, Masliah E, Hyman BT. Neuropathological Alterations in Alzheimer Disease. Cold Spring Harb Perspect Med. 2011;1(1):a006189. doi: 10.1101/cshperspect.a006189.. [DOI] [PMC free article] [PubMed] [Google Scholar]
- 243.Masters CL, Selkoe DJ. Biochemistry of Amyloid β-Protein and Amyloid Deposits in Alzheimer Disease. Cold Spring Harbor Perspectives in Medicine. 2012;2(6):a006262. doi: 10.1101/cshperspect.a006262.. [DOI] [PMC free article] [PubMed] [Google Scholar]
- 244.Braak H, Braak E. Neuropathological staging of Alzheimer-related changes. Acta Neuropathol (Berl) 1991;82:239–259. doi: 10.1007/BF00308809. [DOI] [PubMed] [Google Scholar]
- 245.Braak H, Braak E, Bohl J. Staging of Alzheimer-related cortical destruction. Eur Neurol. 1993;33:403–408. doi: 10.1159/000116984. [DOI] [PubMed] [Google Scholar]
- 246.Braak H, Braak E. Staging of Alzheimer's disease-related neurofibrillary changes. Neurobiol Aging. 1995;16:271–278. doi: 10.1016/0197-4580(95)00021-6. [DOI] [PubMed] [Google Scholar]
- 247.Braak H, Braak E. Frequency of stages of Alzheimer-related lesions in different age categories. Neurobiol Aging. 1997;18:351–357. doi: 10.1016/s0197-4580(97)00056-0. [DOI] [PubMed] [Google Scholar]
- 248.Thal DR, Rüb U, Schultz C, Sassin I, Ghebremedhin E, Del Tredici K, Braak E, Braak H. Sequence of Abeta-protein deposition in the human medial temporal lobe. J Neuropathol Exp Neurol. 2000;59(8):733–48. doi: 10.1093/jnen/59.8.733. [DOI] [PubMed] [Google Scholar]
- 249.Braak H, Braak E, Bohl J, Reintjes R. Age, neurofibrillary changes, A beta-amyloid and the onset of Alzheimer's disease. Neurosci Lett. 1996;210:87–90. doi: 10.1016/0304-3940(96)12668-9. [DOI] [PubMed] [Google Scholar]
- 250.Villemagne VL, Burnham S, Bourgeat P, Brown B, Ellis KA, Salvado O, Szoeke C, Macaulay SL, Martins R, Maruff P, Ames D, Rowe CC, Masters CL Australian Imaging Biomarkers and ifestyle (AIB ) Research Group. Amyloid β deposition, neurodegeneration, and cognitive decline in sporadic Alzheimer’s disease: A prospective cohort study. Lancet Neurol. 2013;12(4):357–67. doi: 10.1016/S1474-4422(13)70044-9. [DOI] [PubMed] [Google Scholar]
- 251.Reiman EM, Quiroz YT, Fleisher AS, Chen K, Velez-Pardos C, Jimenez-Del-Rio M, et al. Brain imaging and fluid biomarker analysis in young adults at genetic risk for autosomal dominant Alzheimer’s disease in the presenilin 1–280A kindred: A case-control study. Lancet Neurol. 2012;11(2):1048. 56. doi: 10.1016/S1474-4422(12)70228-4. [DOI] [PMC free article] [PubMed] [Google Scholar]
- 252.Jack CR, Jr, Wiste HJ, Weigand SD, Knopman DS, Vemuri P, Mielke MM, Lowe V, Senjem ML, Gunter JL, Machulda MM, Gregg BE, Pankratz VS, Rocca WA, Petersen RC. Age, Sex, and APO ε4 ffects on Memory, Brain Structure, and β-Amyloid Across the Adult Life Span. JAMA Neurol. 2015;72(5):511–9. doi: 10.1001/jamaneurol.2014.4821. [DOI] [PMC free article] [PubMed] [Google Scholar]
- 253.Jack CR, Jr, Wiste HJ, Knopman DS, Vemuri P, Mielke MM, Weigand SD, Senjem ML, Gunter JL, Lowe V, Gregg BE, Pankratz VS, Petersen RC. Rates of β-amyloid accumulation are independent of hippocampal neurodegeneration. Neurology. 2014;82(18):1605–12. doi: 10.1212/WNL.0000000000000386. [DOI] [PMC free article] [PubMed] [Google Scholar]
- 254.Jack CR, Jr, Vemuri P, Wiste HJ, Weigand SD, Lesnick TG, Lowe V, Kantarci K, Bernstein MA, Senjem ML, Gunter JL, Boeve BF, Trojanowski JQ, Shaw LM, Aisen PS, Weiner MW, Petersen RC, Knopman DS Alzheimer’s Disease Neuroimaging Initiative. Shapes of the trajectories of 5 major biomarkers of Alzheimer disease. Arch Neurol. 2012;69(7):856–67. doi: 10.1001/archneurol.2011.3405. [DOI] [PMC free article] [PubMed] [Google Scholar]
- 255.Jack CR, Jr, Wiste HJ, Vemuri P, Weigand SD, Senjem ML, Zeng G, Bernstein MA, Gunter JL, Pankratz VS, Aisen PS, Weiner MW, Petersen RC, Shaw LM, Trojanowski JQ, Knopman DS Alzheimer's Disease Neuroimaging Initiative. Brain beta-amyloid measures and magnetic resonance imaging atrophy both predict time-to-progression from mild cognitive impairment to Alzheimer's disease. Brain. 2010;133(11):3336–48. doi: 10.1093/brain/awq277. [DOI] [PMC free article] [PubMed] [Google Scholar]
- 256.Jack CR, Lowe VJ, Weigand SD, Wiste HJ, Senjem ML, Knopman DS, et al. Serial PIB and MRI in normal, mild cognitive impairment and Alzheimer’s disease: Implications for sequence of pathological events in Alzheimer’s disease. Brain. 2009;132:1355–65. doi: 10.1093/brain/awp062. [DOI] [PMC free article] [PubMed] [Google Scholar]
- 257.Haug H, Eggers R. Morphometry of the human cortex cerebri and corpus striatum during aging. Neurobiol Aging. 1991;12(4):336–338. doi: 10.1016/0197-4580(91)90013-a. [DOI] [PubMed] [Google Scholar]
- 258.Resnick SM, Pham DL, Kraut MA, Zonderman AB, Davatzikos C. Longitudinal magnetic resonance imaging studies of older adults: a shrinking brain. J Neurosci. 2003;23(8):3295–3301. doi: 10.1523/JNEUROSCI.23-08-03295.2003. [DOI] [PMC free article] [PubMed] [Google Scholar]
- 259.Schmitz C, Hof PR. Design-based stereology in brain aging research. In: Riddle DR, editor. Brain Aging: Models, Methods, and Mechanisms. Chapter 4. CRC Press Taylor & Francis Group; Boca Raton, FL: 2007. pp. 63–96. [PubMed] [Google Scholar]
- 260.von Bartheld CS, Bahney J, Herculano-Houzel S. The Search for True Numbers of Neurons and Glial Cells in the Human Brain: A Review of 150 Years of Cell Counting. J Comp Neurol. 2016 May 17; doi: 10.1002/cne.24040.. [DOI] [PMC free article] [PubMed] [Google Scholar]
- 261.Pakkenberg B, Pelviga D, Marnera L, Bundgaarda MJ, Gundersenb HJG, Nyengaardb JR, Regeur L. Aging and the human neocortex. Exp Gerontol. 2003;38:95–99. doi: 10.1016/s0531-5565(02)00151-1. [DOI] [PubMed] [Google Scholar]
- 262.Pakkenberg B, Gundersen HJ. Neocortical neuron number in humans: effect of sex and age. J Comp Neurol. 1997;384(2):312–320. [PubMed] [Google Scholar]
- 263.Terry RD, DeTeresa R, Hansen LA. Neocortical cell counts in normal human adult aging. Ann Neurol. 1987;21(6):530–539. doi: 10.1002/ana.410210603. [DOI] [PubMed] [Google Scholar]
- 264.Herculano-Houzel S. The human brain in numbers: a linearly scaled- up primate brain. Front Hum Neurosci. 2009;3:31. doi: 10.3389/neuro.09.031.2009. [DOI] [PMC free article] [PubMed] [Google Scholar]
- 265.Bruno Mota B, Suzana Herculano-Houzel S. All brains are made of this: a fundamental building block of brain matter with matching neuronal and glial masses. Front Neuroanat. 2014;8:127. doi: 10.3389/fnana.2014.00127. [DOI] [PMC free article] [PubMed] [Google Scholar]
- 266.Freeman SH, Kandel R, Cruz L, Rozkalne A, Newell K, Frosch MP, Hedley-Whyte ET, Locascio JJ, Lipsitz L, Hyman BT. Preservation of neuronal number despite age-related cortical brain atrophy in elderly subjects without Alzheimer disease. J Neuropathol Exp Neurol. 2008;67(12):1205–1212. doi: 10.1097/NEN.0b013e31818fc72f. [DOI] [PMC free article] [PubMed] [Google Scholar]
- 267.West MJ. Regionally specific loss of neurons in the aging human hippocampus. Neurobiol Aging. 1993;14(4):287–293. doi: 10.1016/0197-4580(93)90113-p. [DOI] [PubMed] [Google Scholar]
- 268.Mellon EA, Pilkinton DT, Clark CM, Elliott MA, Witschey WR, Borthakur A, Reddy R. Sodium MR imaging detection of mild Alzheimer disease: preliminary study. Am J Neuroradiol. 2009;30(5):978–984. doi: 10.3174/ajnr.A1495. [DOI] [PMC free article] [PubMed] [Google Scholar]
- 269.Knoops AJ, Gerritsen L, Van der Graaf Y, Mali WP, Geerlings MI. Loss of entorhinal cortex and hippocampal volumes compared to whole brain volume in normal aging: the SMART-Medea study. Psychiatr Res. 2012;203(1):31–37. doi: 10.1016/j.pscychresns.2011.12.002. [DOI] [PubMed] [Google Scholar]
- 270.Davies DC, Horwood N, Isaacs SL, Mann DM. The effect of age and Alzheimer’s disease on pyramidal neuron density in the individual fields of the hippocampal formation. Acta Neuropathol. 1992;83:510–517. doi: 10.1007/BF00310028. [DOI] [PubMed] [Google Scholar]
- 271.Graessl A, Ruehle A, Waiczies H, Resetar A, Hoffmann SH, Rieger J, Wetterling F, Winter L, Nagel AM, Niendorf T. Sodium MRI of the human heart at 7.0 T: preliminary results. NMR Biomed. 2015;28(8):967–75. doi: 10.1002/nbm.3338. [DOI] [PubMed] [Google Scholar]
- 272.Ouwerkerk R, Bottomley PA, Solaiyappan M, Spooner A, Tomaselli G, Wu KC, Weiss RG. Tissue sodium concentration in myocardial infarction in humans: A quantitative 23Na MR imaging study. Radiology. 2008;248:88–96. doi: 10.1148/radiol.2481071027. [DOI] [PMC free article] [PubMed] [Google Scholar]
- 273.Jansen MA, Van Emous JG, Nederhoff MG, Van Echteld CJ. Assessment of myocardial viability by intracellular 23Na magnetic resonance imaging. Circulation. 2004;110(22):3457–64. doi: 10.1161/01.CIR.0000148132.15105.0E. [DOI] [PubMed] [Google Scholar]
- 274.Constantinides CD, Gillen JG, BS, Boada FB, Pomper MG, Bottomley PA. Human Skeletal Muscle: Sodium MR Imaging and Quantification Potential Applications in Exercise and Disease. Radiology. 2000;216(2):559–568. doi: 10.1148/radiology.216.2.r00jl46559. [DOI] [PubMed] [Google Scholar]
- 275.Amarteifio E1, Nagel AM, Weber MA, Jurkat-Rott K, Lehmann-Horn F. Hyperkalemic periodic paralysis and permanent weakness: 3-T MR imaging depicts intracellular 23Na overload--initial results. Radiology. 2012 Jul;264(1):154–63. doi: 10.1148/radiol.12110980. Epub 2012 Apr 16. [DOI] [PubMed] [Google Scholar]
- 276.Weber MA, Nagel AM, Marschar AM, Glemser P, Jurkat-Rott K, Wolf MB, Ladd ME, Schlemmer HP, Kauczor HU, Lehmann-Horn F. 7-T 35Cl and 23Na MR Imaging for Detection of Mutation-dependent Alterations in Muscular Edema and Fat Fraction with Sodium and Chloride Concentrations in Muscular Periodic Paralyses. Radiology. 2016 Apr 15;:151617. [Epub ahead of print] [Google Scholar]
- 277.Zöllner FG, Konstandin S, Lommen J, Budjan J, Schoenberg SO, Schad LR, Haneder S. Quantitative sodium MRI of kidney. NMR Biomed. 2016;29(2):197–205. doi: 10.1002/nbm.3274. [DOI] [PubMed] [Google Scholar]
- 278.de Boer A, Hoogduin JM, Blankestijn PJ, Li X, Luijten PR, Metzger GJ, Raaijmakers AJ, Umutlu L, Visser F, Leiner T. 7 T renal MRI: challenges and promises. MAGMA. 2016;29:417–433. doi: 10.1007/s10334-016-0538-3. [DOI] [PMC free article] [PubMed] [Google Scholar]
- 279.Haneder S, Juras V, Michaely HJ, Deligianni X, Bieri O, Schoenberg SO, Trattnig S, Zbyýň Š. In vivo sodium (23Na) imaging of the human kidneys at 7 T: preliminary results. Eur Radiol. 2014;24(2):494–501. doi: 10.1007/s00330-013-3032-6. [DOI] [PubMed] [Google Scholar]
- 280.Steidle G, Graf H, Schick F. Sodium 3-D MRI of the human torso using a volume coil. Magn Reson Imaging. 2004;22(2):171–80. doi: 10.1016/j.mri.2003.08.007. [DOI] [PubMed] [Google Scholar]
- 281.Malzacher M, Kalayciyan R, Konstandin S, Haneder S, Schad LR. Sodium-23 MRI of whole spine at 3 Tesla using a 5-channel receive-only phased-array and a whole-body transmit resonator. Z Med Phys. 2016;26(1):95–100. doi: 10.1016/j.zemedi.2015.03.008. [DOI] [PubMed] [Google Scholar]
- 282.Noebauer-Huhmann IM, Juras V, Pfirrmann CW, Szomolanyi P, Zbyn S, Messner A, Wimmer J, Weber M, Friedrich KM, Stelzeneder D, Trattnig S. Sodium MR imaging of the lumbar intervertebral disk at 7 T: correlation with T2 mapping and modified Pfirrmann score at 3 T--preliminary results. Radiology. 2012;265(2):555–64. doi: 10.1148/radiol.12111920. [DOI] [PubMed] [Google Scholar]
- 283.Insko EK, Clayton DB, Elliott MA. In vivo sodium MR imaging of the intervertebral disk at 4 T. Acad Radiol. 2002;9(7):800–4. doi: 10.1016/s1076-6332(03)80350-1. [DOI] [PubMed] [Google Scholar]
- 284.James JR, Panda A, Lin C, Dydak U, Dale BM, Bansal N. In vivo sodium MR imaging of the abdomen at 3T. Abdom Imaging. 2015;40(7):2272–80. doi: 10.1007/s00261-015-0428-6. [DOI] [PMC free article] [PubMed] [Google Scholar]
- 285.Granot J. Sodium imaging of human body organs and extremities in vivo. Radiology. 1988;167(2):547–50. doi: 10.1148/radiology.167.2.3357970. [DOI] [PubMed] [Google Scholar]
- 286.Bitton R. The economic burden of osteoarthritis. Am J Manag Care. 2009;15(8 Suppl):S230–5. [PubMed] [Google Scholar]
- 287.Kotlarz H1, Gunnarsson CL, Fang H, Rizzo JA. Insurer and out-of-pocket costs of osteoarthritis in the US: evidence from national survey data. Arthritis Rheum. 2009;60(12):3546–53. doi: 10.1002/art.24984. [DOI] [PubMed] [Google Scholar]
- 288.Losina E, Paltiel AD, Weinstein AM, Yelin E, Hunter DJ, Chen SP, Klara K, Suter LG, Solomon DH, Burbine SA, Walensky RP, Katz JN. Lifetime medical costs of knee osteoarthritis management in the United States: impact of extending indications for total knee arthroplasty. Arthritis Care Res (Hoboken) 2015;67(2):203–15. doi: 10.1002/acr.22412. [DOI] [PMC free article] [PubMed] [Google Scholar]
- 289.Ryd L, Brittberg M, Eriksson K, Jurvelin JS, Lindahl A, Marlovits S, Möller P, Richardson JB, Steinwachs M, Zenobi-Wong M. Pre-Osteoarthritis: Definition and Diagnosis of an Elusive Clinical Entity. Cartilage. 2015;6(3):156–165. doi: 10.1177/1947603515586048. [DOI] [PMC free article] [PubMed] [Google Scholar]
- 290.Borthakur A, Mellon E, Niyogi S, Witschey W, Kneeland JB, Reddy R. Sodium and T1ρ MRI for molecular and diagnostic imaging of articular cartilage. NMR Biomed. 2006;19(7):781–821. doi: 10.1002/nbm.1102. [DOI] [PMC free article] [PubMed] [Google Scholar]
- 291.Manzano S, Manzano R, Doblaré M, Doweidar MH. Altered swelling and ion fluxes in articular cartilage as a biomarker in osteoarthritis and joint immobilization: a computational analysis. J R Soc Interface. 2015;12(102):2014–1090. doi: 10.1098/rsif.2014.1090. [DOI] [PMC free article] [PubMed] [Google Scholar]
- 292.Han E, Chen SS, Klisch SM, Sah RL. Contribution of Proteoglycan Osmotic Swelling Pressure to the Compressive Properties of Articular Cartilage. Biophys J. 2011;101(4):916–924. doi: 10.1016/j.bpj.2011.07.006. [DOI] [PMC free article] [PubMed] [Google Scholar]
- 293.Bekkers JE, Creemers LB, Dhert WJA, Saris DBF. Diagnostic Modalities for Diseased Articular Cartilage - From Defect to Degeneration: A Review. Cartilage. 2010;1(3):157–164. doi: 10.1177/1947603510364539. [DOI] [PMC free article] [PubMed] [Google Scholar]
- 294.Shepherd DET, Seedhom BB. Thickness of human articular cartilage in joints of the lower limb. Ann Rheum Dis. 1999;58:27–34. doi: 10.1136/ard.58.1.27. [DOI] [PMC free article] [PubMed] [Google Scholar]
- 295.Ronga M, Angeretti G, Ferraro S, DE Falco G, Genovese EA, Cherubino P. Imaging of articular cartilage: current concepts. Joints. 2014;2(3):137–40. doi: 10.11138/jts/2014.2.3.137. [DOI] [PMC free article] [PubMed] [Google Scholar]
- 296.Choi J-A, Gold G. MR Imaging of Articular Cartilage Physiology. Magnetic resonance imaging clinics of North America. 2011;19(2):249–282. doi: 10.1016/j.mric.2011.02.010. [DOI] [PMC free article] [PubMed] [Google Scholar]
- 297.Jordan CD, McWalter EJ, Monu UD, Watkins RD, Chen W, Bangerter NK, Hargreaves BA, Gold GE. Variability of CubeQuant T1ρ, quantitative D SS T2, and cones sodium MRI in knee cartilage. Osteoarthritis Cartilage. 2014;22(10):1559–67. doi: 10.1016/j.joca.2014.06.001. [DOI] [PMC free article] [PubMed] [Google Scholar]
- 298.Gold GE, Burstein D, Dardzinski B, Lang P, Boada F, Mosher T. MRI of articular cartilage in OA: novel pulse sequences and compositional/ functional markers. Osteoarthritis Cartilage. 2006;14(Suppl A):A76–86. doi: 10.1016/j.joca.2006.03.010. Epub 2006 May 23. Review. [DOI] [PubMed] [Google Scholar]
- 299.Crema MD, Roemer FW, Marra MD, Burstein D, Gold GE, Eckstein F, Baum T, Mosher TJ, Carrino JA, Guermazi A. Articular cartilage in the knee: current MR imaging techniques and applications in clinical practice and research. Radiographics. 2011;31(1):37–61. doi: 10.1148/rg.311105084. [DOI] [PMC free article] [PubMed] [Google Scholar]
- 300.Reddy R, Insko EK, Noyszewski EA, Dandora R, Kneeland JB, Leigh JS. Sodium MRI of human articular cartilage in vivo. Magn Reson Medicine. 1998;39(5):697–701. doi: 10.1002/mrm.1910390505. [DOI] [PubMed] [Google Scholar]
- 301.Zbyýň Š, Mlynárik V, Juras V, Szomolanyi P, Trattnig S. Evaluation of cartilage repair and osteoarthritis with sodium MRI. NMR Biomed. 2016;29(2):206–15. doi: 10.1002/nbm.3280. [DOI] [PubMed] [Google Scholar]
- 302.Correa D, Lietman SA. Articular cartilage repair: Current needs, methods and research directions. Semin Cell Dev Biol. 2016 doi: 10.1016/j.semcdb.2016.07.013. pii: S1084-9521(16)30208-7. [Epub ahead of print] [DOI] [PubMed] [Google Scholar]
- 303.Hammon M, Grossmann S, Linz P, Kopp C, Dahlmann A, Garlichs C, Janka R, Cavallaro A, Luft FC, Uder M, Titze J. 23Na Magnetic Resonance Imaging of the Lower Leg of Acute Heart Failure Patients during Diuretic Treatment. PLoS One. 2015 Oct 26;10(10):e0141336. doi: 10.1371/journal.pone.0141336. eCollection 2015. [DOI] [PMC free article] [PubMed] [Google Scholar]
- 304.Linz P, Santoro D, Renz W, Rieger J, Ruehle A, Ruff J, Deimling M, Rakova N, Muller DN, Luft FC, Titze J, Niendorf T. Skin sodium measured with ²³Na MRI at 7.0 T. NMR Biomed. 2015 Jan;28(1):54–62. doi: 10.1002/nbm.3224. Epub 2014 Oct 18. [DOI] [PubMed] [Google Scholar]
- 305.Kopp C, Linz P, Dahlmann A, Hammon M, Jantsch J, Müller DN, Schmieder RE, Cavallaro A, Eckardt KU, Uder M, Luft FC, Titze J. 23Na Magnetic Resonance Imaging-Determined Tissue Sodium in Healthy Subjects and Hypertensive Patients. Hypertension. 2013;61:635–64. doi: 10.1161/HYPERTENSIONAHA.111.00566. [DOI] [PubMed] [Google Scholar]
- 306.Titze J, Rakova N, Kopp C, Dahlmann A, Jantsch J, Luft FC. Balancing wobbles in the body sodium. Nephrol Dial Transplant. 2016 Jul;31(7):1078–81. doi: 10.1093/ndt/gfv343. Epub 2015 Sep 25. Review. [DOI] [PMC free article] [PubMed] [Google Scholar]
- 307.Titze J. A different view on sodium balance. Curr Opin Nephrol Hypertens. 2015;24(1):14–20. doi: 10.1097/MNH.0000000000000085. [DOI] [PubMed] [Google Scholar]
- 308.Cox TR, Erler JT. Remodeling and homeostasis of the extracellular matrix: implications for fibrotic diseases and cancer. Dis Model Mech. 2011;4(2):165–178. doi: 10.1242/dmm.004077. [DOI] [PMC free article] [PubMed] [Google Scholar]
- 309.Ouwerkerk R, Bleich KB, Gillen JS, Pomper MG, Bottomley PA. Tissue sodium concentration in human brain tumors as measured with 23Na MR imaging. Radiology. 2003;227(2):529–37. doi: 10.1148/radiol.2272020483. [DOI] [PubMed] [Google Scholar]