

Abstract
Vertebrate brains differ in overall size, composition and functional capacities, but the evolutionary processes linking these traits are unclear. Two leading models offer opposing views: the concerted model ascribes major dimensions of covariation in brain structures to developmental events, whereas the mosaic model relates divergent structures to functional capabilities. The models are often cast as incompatible, but they must be unified to explain how adaptive changes in brain structure arise from pre-existing architectures and developmental mechanisms. Here we show that variation in the sizes of discrete neural systems in songbirds, a species-rich group exhibiting diverse behavioural and ecological specializations, supports major elements of both models. In accordance with the concerted model, most variation in nucleus volumes is shared across functional domains and allometry is related to developmental sequence. Per the mosaic model, residual variation in nucleus volumes is correlated within functional systems and predicts specific behavioural capabilities. These comparisons indicate that oscine brains evolved primarily as a coordinated whole but also experienced significant, independent modifications to dedicated systems from specific selection pressures. Finally, patterns of covariation between species and brain areas hint at underlying developmental mechanisms.
Keywords: allometry, brain evolution, concerted, mosaic, songbird
1. Introduction
All vertebrates share a basic hierarchical brain organization, but species vary widely in their overall brain volumes and proportional sizes of different subdivisions and neural systems. Often, variation in brain size and composition are correlated with behaviour, but the evolutionary mechanisms underlying these functional links are unknown. Two hypotheses provide distinct perspectives on how they occur.
The concerted model views the brain as an integrated whole. It emphasizes commonalities between species and proposes that changes in general developmental processes, such as the rate and duration of particular events or the environment in which they occur, are the primary basis for brain evolution [1–4]. Supporting this view, principal components of covariation are remarkably similar between mammals and cartilaginous fishes, two distant vertebrate groups. Nearly all variation (93–96%) in brain subdivision volumes is attributable to differences in overall brain size, and a small but consistent portion (2%) is associated with olfactory and limbic areas [5]. Surprisingly, much of the variation in brain composition across mammals can be explained by only a few developmental events. Brains increase in size mostly by prolonging the duration of neurogenesis, and exponential expansions of precursor pools over time cause disproportionate growth in late-born structures [1]. Additionally, variation in the relative sizes of brain regions is predictable from their neurogenetic timing [6,7], and covariation between brain areas can be explained by shifts in genetic specification boundaries [2,4]. Relatively little variation in brain composition is attributable to niche-specific specializations, and some of it could arise through general experience-dependent plasticity mechanisms rather than genetic divergences in brain specification [8]. According to the concerted model, then, selection for behavioural traits affects brain evolution within the confines of conserved developmental mechanisms that promote computationally efficient structural changes through graceful scaling.
The mosaic model treats the brain as a collection of independent modules. It relates architectural differences to ecological and behavioural variables, and it suggests brains evolve primarily through modifications to functional systems in response to specific selection pressures [9–11]. Support for this idea is found in myriad correlations across diverse taxonomic groups. Size-relative volumes of interconnected brain areas are correlated in mammals [9,12,13] and birds [14,15]. Brain composition is associated with ecological niche occupation and behavioural capacities in mammals [16], birds [17,18] and fishes [19–21]. Residual variation in discrete brain regions is correlated with specific sensory [22–27], motor [28–30] and cognitive abilities [31–33], including from artificial selection [34,35]. Therefore, according to the mosaic model, selection for specific behaviours targets genes that specify characteristics of their underlying brain modules, such as numbers of neurons or intra- and inter-region connectivity [36], and variation in brain composition results from accretion of many isolated changes.
The concerted and mosaic models provide useful frameworks to guide species comparisons. They make different assertions about the degree to which brain evolution is wholesale versus piecemeal and offer distinct functional hypotheses about the mechanisms creating evolvable neural architectures, but they are not mutually exclusive. Here, we explore this dispute by characterizing variation in discrete brain areas with known functional roles across a wide phylogeny of songbirds. Songbirds constitute a large vertebrate radiation with approximately 4500 extant species emerging over 65 million years. Species inhabit diverse ecological niches and exhibit sophisticated behavioural repertoires, including the capacity for learned vocalizations, food hoarding, feeding specializations, tool use, nest building, cooperative breeding and long-distance migration. Moreover, their brains are organized as nuclei, which facilitates identification of distinct areas in all subdivisions. We find that both the concerted and mosaic models accurately predict evolutionary patterns in neural systems of songbirds, underscoring their compatibility and highlighting potential mechanisms that could give rise to niche-specific neural adaptations.
2. Material and methods
Additional methods are described in the electronic supplementary material.
(a). Specimen collection
One to four adult male songbirds of 58 species spanning 20 families were wild-caught with mist nets (electronic supplementary material, table S1). Collections occurred during spring months (April–June) to minimize seasonal variation in nucleus volumes, mostly in Hungary in 1993–1995 and Tompkins County, New York in 2004.
(b). Brain measurements
Brain sections were stained for Nissl material and cytoarchitecture was analysed using light microscopy. We measured volumes of the brain (B), telencephalon (T) and 31 discrete nuclei belonging to five functional systems (figure 1). Auditory system nuclei were ovoidalis (Ov), mesencephalicus lateralis pars dorsalis (MLd), the superior olive (OS), and the cochlear nuclei laminaris (NL) and magnocellularis (NM). Trigeminal nuclei included basorostralis (Bas), spiriformis medialis (SpM), the principal sensory and motor nuclei of the trigeminal nerve (PrV and MV, respectively), the motor nucleus of the facial nerve (nVII) and the lingual portion of the hypoglossal nucleus (nXIIl). Song nuclei were HVC (proper name, including paraHVC), the robust nucleus of the arcopallium (RA), Area X of the striatum, the lateral and medial magnocellular nuclei of the nidopallium (LMAN and MMAN, respectively), uvaeformis (Uva), the dorsomedial nucleus of the intercollicular complex (DM) and the tracheosyringeal portion of the hypoglossal nucleus (nXIIts). Limbic structures were the hippocampus (Hp), septum (Sep) and taeniae of the amygdala (TnA). Visual nuclei included MVL (proper name), entopallium (E, including perientopallial belt), rotundus (Rt), pretectalis (Pt), spiriformis lateralis (SpL), subpretectalis (SP) and the isthmi nuclei semilunaris (SLu), magnocellularis (Imc) and parvocellularis (Ipc). Nucleus and subdivision boundaries were traced from sections with a camera lucida or directly from digital images of the sections. Areas were measured using ImageJ software [37], and volumes were computed by summing the areas and multiplying by the sampling interval. We also measured neuron densities in 11 nuclei from three systems (song: HVC, RA, LMAN, MMAN, nXIIts; limbic: Hp, Sep; visual: E, Rt, SpL, SP) in one specimen of each species (see electronic supplementary material).
Figure 1.
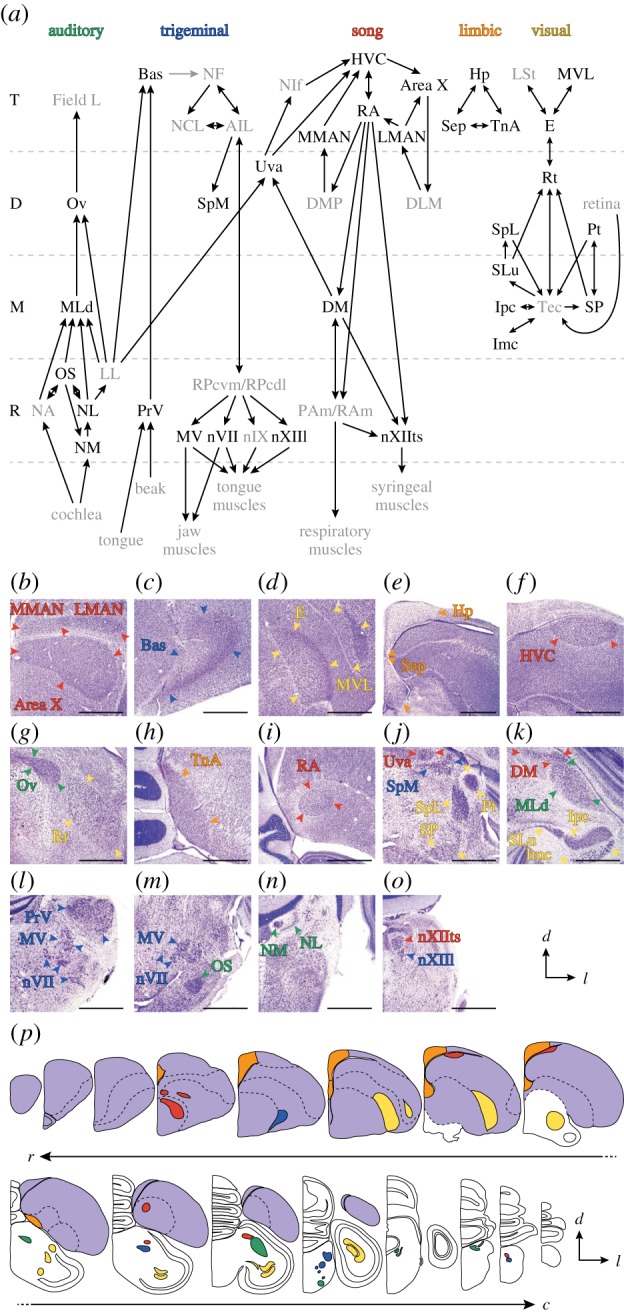
Overview of the brain areas studied here. (a) Major projections between discrete nuclei from five functional systems spanning multiple brain subdivisions (T, telencephalon; D, diencephalon; M, mesencephalon; R, rhombencephalon). Focal nuclei are in black, and additional details are in the electronic supplementary material. (b–o) Examples of Nissl-defined boundaries for each nucleus viewed in the coronal plane. Sections are sorted from rostral to caudal and show one hemisphere. Scale bars equal 1 mm. (p) Traces of equidistant sections from a single brain illustrating approximate locations of each nucleus. The telencephalon is shaded purple.
(c). Beak morphology measurements
We characterized species-typical beak shapes to test for functional associations with the trigeminal system. Beak depth-to-length ratios were measured using ImageJ from digital images of the profiles of five individuals from each species. Depth was measured along a line perpendicular to the commissure at the anterior end of the nostril, and length was measured along the commissure from the anterior end of the nostril to the tip.
(d). Data analysis
Nucleus volumes and neuron numbers were log-transformed prior to all analyses. Unless stated otherwise, statistical tests controlled for species relatedness with standardized independent contrasts computed from a fully resolved molecular phylogeny. When an analysis involved multiple comparisons, significance criteria were adjusted using a false discovery rate of 0.05 [38].
Covariation among nuclei was assessed in several ways. First, the latent structure relating nucleus volumes was described with a factor analysis. Second, the rate and precision of allometric scaling were estimated from pairwise bivariate regressions between nucleus volumes or between nuclear numbers of neurons. We fitted lines using ordinary-least-squares estimation, despite the fact that this approach minimizes error in the dependent variable only, because type II regressions (standardized major axis) were biased by large differences in nucleus volume variability. However, because least-squares lines are not symmetric about the identity line, we compared rates of allometry between telencephalic and non-telencephalic nuclei by constructing two models for each nucleus pair, one with each as the dependent variable. Third, functional associations between nuclei were assessed with multivariate regressions. Variation in the volume or number of neurons in one nucleus was explained as a function of another nucleus after controlling for a size covariate (brain volume minus the sum of all nucleus volumes, B-nuclei). Similar models were constructed to measure covariation between nucleus volumes and beak morphology. Finally, the relative sizes of different nuclei were assessed as standardized residuals from phylogenetically correct regression lines plotted in the original data space [39].
The cellular basis of variation in relative nucleus volumes was assessed with non-phylogenetic hierarchical regressions. Here, the contributions to nucleus volumes made by the number and density of neurons were examined after controlling for overall brain size (B-nuclei) and neuron density or number, respectively. Effects were measured by the sequential increase in R2, which is the proportion of variation explained in standard (but not phylogenetic) models. Results between the approaches were similar, however (r = 0.99).
3. Results
(a). Tests of the concerted model
The concerted model predicts uniformity across species. Consistent with this expectation, a factor analysis exploring the latent structure of covariation between 31 nuclei spanning five functional systems yielded three significant factors that accounted for 80.7% of the total variance (figure 2a). The first factor explained 68.3% of the variance and was general, with 15 nuclei from four systems loading onto it significantly. It related most strongly to the visual system but also described nuclei that scaled closely with most other nuclei (figure 2b; r = 0.73, p = 2.5 × 10⁻⁶). The second factor explained 8.8% of the total variance and was associated with 7/8 song system nuclei, while the third explained 3.6% of the variance and was related to 4/6 trigeminal system nuclei. Correlation coefficients between the rotated axes were 0.57 (1–2), 0.73 (1–3) and 0.64 (2–3).
Figure 2.

Variation within and across systems is mostly shared. (a) Loadings for three latent factors describing covariation among 31 brain nuclei; filled symbols signify significant associations between the respective nucleus and factor (dotted line). Factor 1 (black) was general and covered four systems, factor 2 (dark grey) related to song nuclei, and factor 3 (light grey) related mostly to trigeminal nuclei. (b) Factor 1 captured variation in overall size; its loadings were positively correlated with median R2 values from pairwise nucleus volume correlations (r = 0.73, p = 2.5 × 10⁻⁶; plotted with ±95% CI.). (c) Box-and-whisker plots of R2 values from all bivariate nucleus correlations (n = 30 each), showing that six of eight song nuclei had comparatively weak associations with other nuclei. Nucleus order is the same as for factors. (d) Scaling precision was estimated from the range of residuals in each correlation. Median ranges for most (23/31) nuclei were less than or equal to 5.8-fold.
These results suggested the volumes of most nuclei covaried closely with one another. We quantified pairwise correlations between all nucleus volumes, and the median coefficient of determination explained approximately half or more of the variation in all visual, limbic, auditory, trigeminal and two song nuclei (figure 2c; electronic supplementary material, figure S1; 0.47 ≤ R2 ≤ 0.65). The median ranges of unlogged residuals were less than 5.8-fold for 23 of these 25 nuclei (figure 2d). The six remaining song nuclei, however, were much more variable. Their volumes were predicted poorly by other nuclei (0.21 ≤ median R2 ≤ 0.37) and their unlogged residuals spanned much larger ranges (mean = 9.6-fold). Premotor nuclei HVC and MMAN were especially labile (both median R2 ≤ 0.22), and in some species they deviated from allometric expectations by wide margins (19.2- and 14.7-fold, respectively). Therefore, while most variation in discrete nucleus volumes was attributable to a source shared throughout the brain, many song nuclei did not conform tightly to the same scaling pattern.
The concerted model also predicts greater allometric slopes for brain regions developing later in ontogeny. Neurogenesis in the songbird telencephalon (T) continues well after it ceases in the rest of the brain (∼T) [40,41], therefore we compared scaling rates between T and ∼T nucleus pairs. We contrasted two slopes for each pair (T versus ∼T and ∼T versus T) to ascertain the direction of allometry, and regression line slopes were consistently greater when the T nucleus volume was the dependent variable (figure 3a; Wilcoxon signed-rank test, p = 9.9 × 10⁻²⁷), including when both nuclei belonged to the same system (p = 1.6 × 10⁻⁶). This effect was not due to differences in nucleus volume; although T nuclei were larger than ∼T nuclei (Mann–Whitney U-test, p = 0.001), the ratio between volumes (T/∼T) was inversely related to the ratio between slopes (r = −0.23, p = 0.0005). Moreover, the disparity between T and ∼T scaling was evidently robust throughout the songbird lineage, because the mean absolute values of contrasts were larger for T nuclei than ∼T nuclei at 45/57 nodes of the phylogeny (figure 3b; Wilcoxon signed-rank test, p = 1.3 × 10⁻⁶).
Figure 3.

Telencephalic nuclei scale with positive allometry. (a) Allometric slopes from pairwise T versus ∼T nucleus regressions, computed either with a T nucleus as the dependent variable (y-axis) or a ∼T nucleus as the dependent variable (x-axis). The consistently higher slopes in the former arrangement (p = 9.9 × 10⁻²⁷) indicate pervasive telencephalic hyperallometry. Black symbols indicate correlations between nuclei from the same system, grey dots indicate correlations across them. (b) Absolute contrast magnitudes were greater for T than ∼T nuclei (p = 1.3 × 10⁻⁶) at most nodes in the phylogeny. All pairwise comparisons are in grey, means and standard errors for each node are in black. (c) Allometric slopes from regressions between numbers of neurons in T and ∼T nuclei (p = 0.02); layout and symbols are as above. (d) Slopes of nucleus neuron density as a function of volume (±95% CI.) were shallower for T than ∼T nuclei (p = 0.01), suggesting the rate of T hyperallometry is underestimated by structure volumes. Black lines are medians.
Finally, the volumes of brain structures may not always reflect their numbers of neurons [42], but in our data the scaling difference was robust. We estimated the number of neurons in a subset of nuclei, and allometric scaling rates between nuclear numbers of neurons and volumes were strongly related (r = 0.78, p = 5.3 × 10⁻¹²), and slopes were greater when T nuclei were the dependent variable (figure 3c; Wilcoxon signed-rank test, p = 0.02). Moreover, the analysis of volumes apparently underestimated the true scaling difference between T and ∼T nuclei. Neuron density was inversely related to volume in all nuclei (electronic supplementary material, figure S2), but densities decreased at slower rates in T than ∼T nuclei (figure 3d; Mann–Whitney U-test, p = 0.01).
(b). Tests of the mosaic model
The mosaic model encompasses two phenomena: coordinated changes among functionally related brain regions and large shifts in brain composition that distinguish phylogenetic groups. Consistent with the first process, evolutionary changes in size-relative nucleus volumes were more likely to be correlated within systems (67/92 pairwise correlations with p ≤ 0.01) than across them (19/373) (figure 4; electronic supplementary material, figure S1; Mann–Whitney U-test, p = 3.8 × 10−39). These links were pervasive, with half the non-significant intra-system relations involving three nuclei (DM, 0/7; TnA, 0/2; SpM, 1/5). Moreover, correlative strength depended on the distance between nuclei (figure 5a; two-way ANOVA with system and separation as factors, both p < 0.001), with directly connected regions covarying the most strongly (Tukey–Kramer post hoc tests between 1-nucleus and 3- or 4-nucleus separations, both p < 0.01).
Figure 4.

Phylogeny of the species studied here (electronic supplementary material, references [1–21]). Squares indicate raw brain volume (greyscale) or size-relative nucleus volumes (standardized residuals from regressions against brain volume). Taxonomic families indicated at respective nodes are (a) Acrocephalidae, (b) Locustellidae, (c) Sylviidae, (d) Hirundinidae, (e) Aegithalidae, (f) Alaudidae, (g) Paridae, (h) Emberizidae, (i) Cardinalidae, (j) Parulidae, (k) Icteridae, (l) Fringillidae, (m) Motacillidae, (n) Passeridae, (o) Muscicapidae, (p) Turdidae, (q) Mimidae, (r) Sturnidae, (s) Laniidae and (t) Corvidae. Superfamilies are (x) Sylvioidea, (y) Passeroidea and (z) Muscicapoidea. Nucleus sequence from left to right follows figure 2a: VS (Imc, Rt, Ipc, SP, E, SpL, Pt, SLu, MVL), LS (Hp, Sep, TnA), AS (OS, NL, MLd, Ov, NM), SS (DM, Uva, MMAN, nXIIts, Area X, LMAN, RA, HVC) and TS (SpM, nXIIl, PrV, MV, nVII, Bas).
Figure 5.

Neural systems evolve as modules. (a) Residual variation in nucleus volumes (i.e. differences remaining after controlling for brain size (B-nuclei)) was strongly correlated between nuclei in the same system but not across them (×), and correlative strength decreased as a function of separation between nuclei (p = 0.001). Dotted lines indicate statistical significance (p = 0.01). (b) Pairwise partial correlation coefficients between T nucleus volumes from different systems increased when the size reference was the ∼T versus the rest of the T, but residual volumes of most nucleus pairs remained unrelated to one another (significance lines, p = 0.001 and 0.004). Individual coefficients are in grey, means in black. (c) Correlations between residual numbers of neurons were similar to those for nucleus volumes (significance lines, p = 0.02). (d) Sequential regressions explaining variance in nucleus volume as a function of brain size, neuron number and neuron density. Bars indicate the variation explained when neuron number or density was added to the model last. (e) Beak depth-to-length ratio was correlated with relative volumes of TS nuclei. Here, to approximate the multivariate model described in the text, nucleus volume residuals (relative to brain size) were standardized, the sign of nVII was reversed because it had a negative coefficient, and they were averaged. The regression line is corrected for phylogeny and plotted in original data space; this approximation (R2 = 0.52) performed similarly to the phylogenetic model (R2 = 0.56). (f) Oscine superfamilies gradually diverged in the relative sizes of several systems, including the song, limbic, visual and trigeminal systems. Asterisks indicate significant differences from the overall mean, and lines denote differences between groups.
Likewise, the mosaic model predicts independence between neural systems insofar as they subserve different functions. This expectation was borne out in that the median correlation coefficient from cross-system comparisons was not different from zero (figure 5a; sign test, p = 0.92), and no two systems were associated with one another (although 20/45 auditory-visual nucleus pairs exhibited at least a positive trend, 0.22 < r < 0.41, p < 0.1; electronic supplementary material, figure S1a). We also explored whether associations between systems arose from hyperallometry of the telencephalon (figure 5b). Here, partial correlations between T nuclei were measured using one of two size covariates, the rest of the T (T – sum of all T nucleus volumes) or the non-telencephalic portion of the brain (∼T – sum of all ∼T nucleus volumes). In the first case, only 2/42 partial correlations were significant (both p ≤ 0.001). In the second, associations could have arisen due to general T hyperallometry, and the correlations were in fact greater for all 42 pairs of nuclei, but only six were significant (all p < 0.004). Thus, functional systems appear to have evolved as modules where changes in relative size are coordinated within systems but not between them.
Connectivity-dependent relations also existed between numbers of neurons within nuclei (figure 5c). Intra-system nucleus pairs were generally correlated (14/17 with p ≤ 0.02) while inter-system pairs were not (5/38; Mann–Whitney U-test, p = 1.4 × 10⁻⁸), and correlative strength depended on nuclear separation (two-way ANOVA with separation and system, p = 0.04). Correlations between numbers of neurons were generally weaker than those between volumes (mean difference in r = −0.046; Wilcoxon signed-rank test, p = 0.003), perhaps because volumes are not independent (efferent nuclei include axons of afferent cells) and/or because estimating density introduced additional measurement error. Nonetheless, variation in numbers of neurons was the primary determinant of relative volume for all 11 nuclei (figure 5d). In hierarchical regressions using brain size, number of neurons and neuronal density to explain nucleus volume, the additional variation explained when number of neurons was added last (0.13 ≤ R2 ≤ 0.68) was always greater than that for density (0.02 ≤ R2 ≤ 0.16). The proportion of residual variation explained by neuron numbers ranged from 56.5% (Rt) to 97.6% (HVC) and covaried weakly with neural system (Kruskal–Wallis test, p = 0.03).
System-specific associations also extended to behaviour. First, songbirds are renowned for their diverse and acoustically complex courtship songs. Species vary widely in the number of song elements they produce, ranging from repertoire sizes of one to hundreds of unique syllables, and syllable repertoire size closely parallels the sizes of song motor nuclei relative to each other [30]. Second, some songbirds cache food for later retrieval, and this apparent demand for enhanced spatial memory is associated with enlarged limbic nuclei (Hp and Sep) [31,43]. Only two species in this dataset are known to cache food (black-capped chickadee, Poecile atricapillus; blue jay, Cyanocitta cristata [44]), and both had substantially larger Hp (standardized residuals = 2.8 and 2.1, respectively) and Sep volumes (2.6 and 2.9) than expected for their brain size (figure 4). The long-tailed bushtit (Aegithalos caudatus) also possessed a large hippocampus (2.6). This species has not been reported to hoard food, but it does live in large extended-family groups and breed cooperatively. Both behaviours are unusual among songbirds and could employ cognitive abilities related to Hp function [45], but this remains to be tested.
Third, songbird beak shapes are diverse, are more variable than other skeletal traits [46,47] and reflect trophic ecology: granivores possess deep, short beaks while frugivores and insectivores typically have shallow, long beaks. Depth-to-length ratio accounts for most of the geometric shape variation in Darwin's finches, a population facing intense selection on beak shape [48], and beak depth in granivorous finches is positively correlated with jaw muscle mass, maximum bite force and seed-husking efficiency [49–52]. Here, variation in beak depth-to-length ratio was explained well by the volumes of four trigeminal nuclei (Bas, PrV, MV, nVII) and the size covariate B-nuclei (R2 = 0.56; electronic supplementary material, table S2), but poorly by other systems (all R2 < 0.22). Moreover, this association persisted through several large evolutionary shifts (figures 4 and 5e). Most species from the Passeroidea superfamily had large depth-to-length ratios and large trigeminal nucleus relative volumes compared with Sylvioidea and Muscicapoidea (Mann–Whitney U-tests, both p ≤ 0.0002). But the families Motacillidae (4/4 species) and Parulidae (2/2) appear to have deviated from them independently, possessing both smaller beak ratios and smaller trigeminal nuclei (figure 5e).
Finally, the mosaic model is also invoked to describe punctuated evolution whereby brain compositions change through grade shifts [9,16,53]. In our data, the largest changes in relative nucleus volumes were not especially outsized compared with the rest of the phylogeny. We identified nodes with absolute values of standardized contrasts greater than or equal to 2 s.d. above the mean for each nucleus (0–4 nodes per nucleus). On average, each of these nodes accounted for 6.3% (11.2% maximum) of the total evolutionary change in their respective nucleus, and most (62/78) involved a branch terminating with an extant species. Some differences did accumulate between large taxonomic groups, however (figure 4f). Species in the Passeroidea superfamily had smaller song nuclei and larger trigeminal nuclei than those in Sylvioidea or Muscicapoidea (Mann–Whitney U test, all p ≤ 0.003; the two systems were not inversely related across the entire phylogeny (p = 0.62), however). Additionally, Passeroidea had smaller than average limbic nuclei, Sylvioidea had large visual nuclei, and Muscicapoidea had small visual nuclei (sign test, all p < 0.05). These differences suggest taxonomic groups diverged through relatively small changes to specific neural systems that accumulated over time.
4. Discussion
The concerted and mosaic models differentially emphasize the roles of conservation and adaptation in the evolution of brain forms. Comparing them is difficult because they focus on different aspects of species variation and employ distinct analytical approaches, but their unification is essential to understanding how global and local processes interact as brains evolve. Here, we discuss variation in neural systems across a wide phylogeny of songbirds with respect to three issues: the partitioning of variation in brain composition into general versus specialized factors, the phylogenetic distribution of variance and the implications these patterns make about developmental sources of brain diversification.
(a). Partitioning brain region variance
Songbirds are a large group of diverse species whose lineages have been shaped by varied selection pressures, yet their brain compositions remained quite stable through that evolution. Most (68%) of the variation in volumes of 31 discrete nuclei was explained by a single latent source. Although this size factor was smaller than that for brain subdivisions in mammals and cartilaginous fishes (93–96%) [5], its explanatory power still far exceeded that of other latent variables. The remaining variance, however, did have a strong system-specific component. The second and third latent factors were associated with functional systems and explained nearly 40% of the remaining variance. Relative nucleus volumes covaried within but not across systems due to coordinated changes in their numbers of neurons, and functional correlates were apparent in song, limbic and trigeminal systems. Therefore, the primary source of evolutionary change in nucleus volumes was apparently related to general processes affecting the entire brain, but system-specific selection pressures did cause significant deviations in brain architectures.
(b). Phylogenetic distribution of variance
Phylogenetic comparisons can reveal mechanisms of diversification. In both mammals and cartilaginous fishes, changes in overall brain size conformed to precise, disproportionate scaling differences between subdivisions despite varied selection pressures facing distant lineages [5]. The concerted model proposes that conservation of a common organizational plan is central to species diversifications: evolving brains scale general parameters to maintain core functions while niche-specific deviations augment pre-existing architectures. The mosaic model encompasses more heterogeneous processes. It can refer to large and rapid shifts in brain composition [9,10,16,53] or to piecemeal evolution where modifications to individual regions accumulate to affect brain size and structure (e.g. [34,35]). Both interpretations stress coordination within but independence between functional neural modules, and both predict increasing diversity in brain compositions between increasingly distant species.
As songbird lineages diverged and species inhabited new ecosystems and acquired new behaviours, their brains retained a similar, scalable architecture. Rates of telencephalic nucleus hyperallometry were similar across the three oscine superfamilies, the residual volumes of most nuclei varied by less than sixfold, and there were no apparent grade shifts. The concerted model explicitly predicts a high baseline of consistency between diverse species whereas both iterations of the mosaic model ostensibly expect greater variability. The mosaic model contends that selection pressures acting on specific behaviours and their associated neural structures are strong. But if the dominant evolutionary mechanism was an accumulation of independent and unconstrained changes to functional systems, it seems improbable that discrete nucleus volumes would vary so little across a sample this large. Perhaps the systems measured here experienced stabilizing selection or inconsistent directional pressures over time. Alternatively, weak functional links between modules could prevent runaway changes to any one system. Whatever the case, despite clear evidence for some degree of modularity, the many similarities across distant and diverse species suggest a primary role for concerted mechanisms in brain evolution.
(c). Developmental mechanisms
Much of the controversy surrounding this debate stems from the models' implications about underlying developmental mechanisms. The concerted model links major dimensions of shared variation to general ontogenetic events such as progenitor cell cycle rates, timing of neurogenetic onset, duration of neurogenesis and axonal branching patterns [6,7]. It also advances a role for common plasticity mechanisms in the development of species-typical specializations [3,8]. This is a plausible route for developing brains to incorporate new variation while remaining functional, but the idea is contentious because it implies changes in overall brain size beget changes in subregions, not the other way around.
As in primates [54,55], hyperallometry of telencephalic nuclei relative to subcortical structures in songbirds is related to the timing of neurogenesis. Telencephalic growth occurs in two waves, one in ovo when new neurons are added to the entire brain and another after hatching when neurogenesis occurs in the T almost exclusively [40,41]. Extending brain growth could increase the telencephalon-to-brain fraction through exponential increases in precursors or from disproportionately prolonging the second neurogenetic bout. Perhaps heterochrony explains fine details of brain variation in songbirds as it does in mammals [6,7], but future studies are needed to clarify how general changes in neurogenesis affect the architecture of neural systems.
Few studies have addressed the developmental causes of mosaic evolution [53], particularly its piecemeal interpretation, but the general consensus is that unique sets of genes encode defining characteristics of different brain modules [36]. If true, given that intra-system correlations are pervasive and nuclei can change in size quickly, perhaps one or a few genes coordinate system-wide effects, or mutations affecting one nucleus propagate along a pathway by affecting neuroblast recruitment and/or survival elsewhere [56]. System-specific correlations seem unlikely to result from changes in proliferative zones, because mature nuclei contain neurons originating from distinct progenitor pools and migrating neuroblasts do not appear committed to join specific networks [57,58]. Future studies on nucleus specification and circuit integration will help identify the mechanisms underlying this type of mosaic evolution.
In our data, the song system stands apart from other systems in its immense variability. It is a specialized sensorimotor network dedicated to vocal communication, selection on song has been a major diversifying force, and at least one aspect of song complexity is related to the relative sizes of brain nuclei [30]. The extreme variability of this system could reflect asymmetries in selection, where forces shaping song have been stronger or more consistent over time than pressures on other behaviours, or perhaps song is less constrained than other traits (e.g. metabolic costs of beak growth, receptor density in the retina). There appear to be genetic substrates for selection to target, as the relative sizes of song nuclei are heritable [59], and common genes link birds and mammals capable of vocal learning [60]. Developmental timing may also contribute to its extreme variability. Several song nuclei incorporate new neurons after recruitment to surrounding areas has ceased [40], and its delayed development could make them singularly sensitive to changes in general processes. For example, prolonging or curtailing neurogenesis or altering the neurotrophic environment as brain growth wanes will disproportionately affect the volumes of song nuclei by releasing them from tight allometry and reinforcing intra-system correlations.
5. Conclusion
Comparisons of neural systems across a wide phylogeny of songbirds supported major elements of both the concerted and mosaic models of brain evolution. Most of the variation in brain nucleus volumes was shared between systems, deviations from allometric expectations were generally small, and allometric scaling rates covaried with the developmental sequence. However, neural systems evolved as coordinated modules and the relative sizes of functionally discrete nuclei predicted behavioural capacities, indicating some degree of modularity in brain organization. A unified model centred on the scalable nature of neural systems and the developmental mechanisms giving rise to functional specializations will clarify the forces shaping brain evolution.
Supplementary Material
Supplementary Material
Acknowledgements
We thank Tamás Székely, Jószef Büki, David Airey, Albert DeVoogd and Hedvig Mező for help in the field; Helene Lampe, Li Dongfeng and Carlos Botero for providing specimens; and Zachary Buchan, Dan Sullivan and Joyce Reed for help with histology. We thank Barbara Finlay for valuable discussions and comments on an earlier version of this manuscript. We are grateful to national and local authorities in Hungary and New York for issuing collection permits.
Ethics
All permits were obtained from local and national authorities, and procedures were approved by the Cornell University Institutional Animal Care and Use Committee.
Data accessibility
Raw data are available in the electronic supplementary material, table S1. We used Mesquite v. 2.74 to construct phylogenetic trees [61], the PDAP v. 1.16 module to compute independent contrasts [62], and Matlab and SPSS to perform statistical analyses.
Authors' contributions
J.M.M. and T.J.D. designed the study, collected data, analysed data and wrote the manuscript.
Competing interests
We declare we have no competing interests.
Funding
Funding was provided by a National Science Foundation Graduate Research Fellowship (J.M.M.), a Frank M. Chapman Memorial Fund Award (J.M.M.), an American Ornithologists’ Union Research Grant (J.M.M.), US–Hungarian Joint Scientific Fund 117 (T.J.D.) and National Science Foundation grant no. 0090963 (T.J.D.).
References
- 1.Finlay BL, Darlington RB. 1995. Linked regularities in the development and evolution of mammalian brains. Science 268, 1578–1584. ( 10.1126/science.7777856) [DOI] [PubMed] [Google Scholar]
- 2.Finlay BL, Hersman MN, Darlington RB. 1998. Patterns of vertebrate neurogenesis and the paths of vertebrate evolution. Brain Behav. Evol. 52, 232–242. ( 10.1159/000006566) [DOI] [PubMed] [Google Scholar]
- 3.Finlay BL, Darlington RB, Nicastro N. 2001. Developmental structure in brain evolution. Behav. Brain Sci. 24, 263–308. ( 10.1017/S0140525X01003958) [DOI] [PubMed] [Google Scholar]
- 4.Reep RL, Finlay BL, Darlington RB. 2007. The limbic system in mammalian brain evolution. Brain Behav. Evol. 70, 57–70. ( 10.1159/000101491) [DOI] [PubMed] [Google Scholar]
- 5.Yopak KE, Lisney TJ, Darlington RB, Collin SP, Montgomery JC, Finlay BL. 2010. A conserved pattern of brain scaling from sharks to primates. Proc. Natl Acad. Sci. USA 107, 12 946–12 951. ( 10.1073/pnas.1002195107) [DOI] [PMC free article] [PubMed] [Google Scholar]
- 6.Workman AD, Charvet CJ, Clancy B, Darlington RB, Finlay BL. 2013. Modeling transformations of neurodevelopmental sequences across mammalian species. J. Neurosci. 33, 7368–7383. ( 10.1523/JNEUROSCI.5746-12.2013) [DOI] [PMC free article] [PubMed] [Google Scholar]
- 7.Cahalane DJ, Charvet CJ, Finlay BL. 2014. Modeling local and cross-species neuron number variations in the cerebral cortex as arising from a common mechanism. Proc. Natl Acad. Sci. USA. 111, 17 642–17 647. ( 10.1073/pnas.1409271111) [DOI] [PMC free article] [PubMed] [Google Scholar]
- 8.Anderson ML, Finlay BL. 2014. Allocating structure to function: the strong links between neuroplasticity and natural selection. Front. Hum. Neurosci. 7, 918 ( 10.3389/fnhum.2013.00918) [DOI] [PMC free article] [PubMed] [Google Scholar]
- 9.Barton RA, Harvey PH. 2000. Mosaic evolution of brain structure in mammals. Nature 405, 1055–1058. ( 10.1038/35016580) [DOI] [PubMed] [Google Scholar]
- 10.de Winter W, Oxnard CE. 2001. Evolutionary radiations and convergences in the structural organization of mammalian brains. Nature 409, 710–714. ( 10.1038/35055547) [DOI] [PubMed] [Google Scholar]
- 11.Barton RA. 2007. Evolutionary specialization in mammalian cortical structure. J. Evol. Biol. 20, 1504–1511. ( 10.1111/j.1420-9101.2007.01330.x) [DOI] [PubMed] [Google Scholar]
- 12.Barton RA, Purvis A, Harvey PH. 1995. Evolutionary radiation of visual and olfactory brain systems in primates, bats and insectivores. Phil. Trans. R. Soc. Lond. B 348, 381–392. ( 10.1098/rstb.1995.0076) [DOI] [PubMed] [Google Scholar]
- 13.Whiting BA, Barton RA. 2003. The evolution of the cortico-cerebellar complex in primates: anatomical connections predict patterns of correlated evolution. J. Hum. Evol. 44, 3–10. ( 10.1016/S0047-2484(02)00162-8) [DOI] [PubMed] [Google Scholar]
- 14.Iwaniuk AN, Dean KM, Nelson JE. 2004. A mosaic pattern characterizes the evolution of the avian brain. Proc. R. Soc. Lond. B 271, S148–S151. ( 10.1098/rsbl.2003.0127) [DOI] [PMC free article] [PubMed] [Google Scholar]
- 15.Gutiérrez-Ibáñez CN, Iwaniuk AN, Moore BA, Fernández-Juricic E, Corfield JR, Krilow JM, Kolominsky J, Wylie DR. 2014. Mosaic and concerted evolution in the visual system of birds. PLoS ONE 9, e90102 ( 10.1371/journal.pone.0090102) [DOI] [PMC free article] [PubMed] [Google Scholar]
- 16.Clark DA, Mitra PP, Wang SSH. 2001. Scalable architecture in mammalian brains. Nature 411, 189–193. ( 10.1038/35075564) [DOI] [PubMed] [Google Scholar]
- 17.Burish MJ, Kueh HY, Wang SS.H. 2004. Brain architecture and social complexity in modern and ancient birds. Brain Behav. Evol. 63, 107–124. ( 10.1159/000084313) [DOI] [PubMed] [Google Scholar]
- 18.Iwaniuk AN, Hurd PL. 2005. The evolution of cerebrotypes in birds. Brain Behav. Evol. 65, 215–230. [DOI] [PubMed] [Google Scholar]
- 19.Kotrshal K, Palzenberger M. 1992. Neuroecology of cyprinids: comparative, quantitative histology reveals diverse brain patterns. Environ. Biol. Fish. 33, 135–152. ( 10.1007/BF00002560) [DOI] [Google Scholar]
- 20.Huber R, van Staaden MJ, Kaufman LS, Liem KF. 1997. Microhabitat use, trophic patterns, and the evolution of brain structure in African cichlids. Brain Behav. Evol. 50, 167–182. ( 10.1159/000113330) [DOI] [PubMed] [Google Scholar]
- 21.Yopak KE, Montgomery JC. 2008. Brain organization and specialization in deep-sea chondrichthyans. Brain Behav. Evol. 71, 287–304. ( 10.1159/000127048) [DOI] [PubMed] [Google Scholar]
- 22.Barton RA. 2004. Binocularity and brain evolution in primates. Proc. Natl Acad. Sci. USA 101, 10 113–10 115. ( 10.1073/pnas.0401955101) [DOI] [PMC free article] [PubMed] [Google Scholar]
- 23.Hutcheon JM, Kirsch JAW, Garland T Jr. 2002. A comparative analysis of brain size in relation to foraging ecology and phylogeny in the Chiroptera. Brain Behav. Evol. 60, 165–180. ( 10.1159/000065938) [DOI] [PubMed] [Google Scholar]
- 24.Catania KC. 2000. Cortical organization in insectivora: the parallel evolution of the sensory periphery and the brain. Brain Behav. Evol. 55, 311–321. ( 10.1159/000006666) [DOI] [PubMed] [Google Scholar]
- 25.Kubke MF, Massoglia DP, Carr CE. 2004. Bigger brains or bigger nuclei? Regulating the size of auditory structures in birds. Brain Behav. Evol. 63, 169–180. ( 10.1159/000076242) [DOI] [PMC free article] [PubMed] [Google Scholar]
- 26.Iwaniuk AN, Wylie DR.W. 2007. Neural specialization for hovering in hummingbirds: hypertrophy of the pretectal nucleus lentiformis mesencephali. J. Comp. Neurol. 500, 211–221. ( 10.1002/cne.21098) [DOI] [PubMed] [Google Scholar]
- 27.Carlson BA, Hasan SM, Hollmann M, Miller DB, Harmon LJ, Arnegard ME. 2011. Brain evolution triggers increased diversification of electric fishes. Science 332, 583–586. ( 10.1126/science.1201524) [DOI] [PubMed] [Google Scholar]
- 28.Lemon RN, Griffiths J. 2005. Comparing the function of the corticospinal system in different species: organizational differences for motor specialization? Muscle Nerve 32, 261–279. ( 10.1002/mus.20333) [DOI] [PubMed] [Google Scholar]
- 29.Sherwood CC. 2005. Comparative anatomy of the facial motor nucleus in mammals, with an analysis of neuron numbers in primates. Anat. Rec. A. 287, 1067–1079. ( 10.1002/ar.a.20259) [DOI] [PubMed] [Google Scholar]
- 30.Moore JM, Székely T, Büki J, DeVoogd TJ. 2011. Motor pathway convergence predicts syllable repertoire size in oscine birds. Proc. Natl Acad. Sci. USA 108, 16 440–16 445. ( 10.1073/pnas.1102077108) [DOI] [PMC free article] [PubMed] [Google Scholar]
- 31.Krebs JR, Sherry DF, Healy SD, Perry VH, Vaccarino AL. 1989. Hippocampal specialization of food-storing birds. Proc. Natl Acad. Sci. USA 86, 1388–1392. ( 10.1073/pnas.86.4.1388) [DOI] [PMC free article] [PubMed] [Google Scholar]
- 32.Day LB, Crews D, Wilczynski W. 1999. Relative medial and dorsal cortex volume in relation to foraging ecology in congeneric lizards. Brain Behav. Evol. 54, 314–322. ( 10.1159/000006631) [DOI] [PubMed] [Google Scholar]
- 33.Day LB, Westcott DA, Olster DH. 2005. Evolution of bower complexity and cerebellum size in bowerbirds. Brain Behav. Evol. 66, 62–72. ( 10.1159/000085048) [DOI] [PubMed] [Google Scholar]
- 34.Rehkämper G, Frahm HD, Cnotka J. 2008. Mosaic evolution and adaptive brain component alteration under domestication seen on the background of evolutionary theory. Brain Behav. Evol. 71, 115–126. ( 10.1159/000111458) [DOI] [PubMed] [Google Scholar]
- 35.Kolb EM, Rezende EL, Holness L, Radtke A, Lee SK, Obenaus A, Garland T Jr. 2013. Mice selectively bred for high voluntary wheel running have larger midbrains: support for the mosaic model of brain evolution. J. Exp. Biol. 216, 515–523. ( 10.1242/jeb.076000) [DOI] [PubMed] [Google Scholar]
- 36.Hager R, Lu L, Rosen GD, Williams RW. 2012. Genetic architecture supports mosaic brain evolution and independent brain–body size regulation. Nat. Commun. 3, 1079 ( 10.1038/ncomms2086) [DOI] [PMC free article] [PubMed] [Google Scholar]
- 37.Rasband WS. 2007. ImageJ. Bethesda, MD: US National Institutes of Health; See http://rsb.info.nih.gov/ij/. [Google Scholar]
- 38.Benjamini Y, Krieger AM, Yekutieli D. 2006. Adaptive linear step-up procedures that control the false discovery rate. Biometrika 93, 491–507. ( 10.1093/biomet/93.3.491) [DOI] [Google Scholar]
- 39.Garland T Jr, Ives AR. 2000. Using the past to predict the present: confidence intervals for regression equations in phylogenetic comparative methods. Am. Nat. 155, 346–364. ( 10.1086/303327) [DOI] [PubMed] [Google Scholar]
- 40.Alvarez-Buylla A, Ling CY, Yu WS. 1994. Contribution of neurons born during embryonic, juvenile, and adult life to the brain of adult canaries: regional specificity and delayed birth of neurons in the song-control nuclei. J. Comp. Neurol. 347, 233–248. ( 10.1002/cne.903470207) [DOI] [PubMed] [Google Scholar]
- 41.Charvet CJ, Striedter GF. 2009. Developmental origins of mosaic brain evolution: morphometric analysis of the developing zebra finch brain. J. Comp. Neurol. 514, 203–213. ( 10.1002/cne.22005) [DOI] [PubMed] [Google Scholar]
- 42.Herculano-Houzel S, Manger PR, Kaas JH. 2014. Brain scaling in mammalian evolution as a consequence of concerted and mosaic changes in numbers of neurons and average neuronal cell size. Front. Neuroanat. 8, 77 ( 10.3389/fnana.2014.00077) [DOI] [PMC free article] [PubMed] [Google Scholar]
- 43.Shiflett MW, Gould KL, Smulders TV, DeVoogd TJ. 2002. Septum volume and food-storing behavior are related in parids. J. Neurobiol. 51, 215–222. ( 10.1002/neu.10054) [DOI] [PubMed] [Google Scholar]
- 44.Garamszegi LZ, Eens M. 2004. The evolution of hippocampus volume and brain size in relation to food hoarding in birds. Ecol. Lett. 7, 1216–1224. ( 10.1111/j.1461-0248.2004.00685.x) [DOI] [Google Scholar]
- 45.Sharp SP, McGowan A, Wood MJ, Hatchwell BJ. 2005. Learned kin recognition cues in a social bird. Nature 434, 1127–1130. ( 10.1038/nature03522) [DOI] [PubMed] [Google Scholar]
- 46.Smith TB. 1990. Patterns of morphological and geographic variation in trophic bill morphs of the African finch Pyrenestes. Biol. J. Linn. Soc. 41, 381–414. ( 10.1111/j.1095-8312.1990.tb00842.x) [DOI] [Google Scholar]
- 47.Björklund M. 1991. Patterns of morphological variation among cardueline finches (Fringillidae: Carduelinae). Biol. J. Linn. Soc. 43, 239–248. ( 10.1111/j.1095-8312.1991.tb00596.x) [DOI] [Google Scholar]
- 48.Foster DJ, Podos J, Hendry AP. 2008. A geometric morphometric appraisal of beak shape in Darwin's finches. J. Evol. Biol. 21, 263–275. ( 10.1111/j.1420-9101.2007.01449.x) [DOI] [PubMed] [Google Scholar]
- 49.Smith TB. 1987. Bill size polymorphism and intraspecific niche utilization in an African finch. Nature 329, 717–719. ( 10.1038/329717a0) [DOI] [Google Scholar]
- 50.van der Meij MA.A, Bout RG. 2004. Scaling of jaw muscle size and maximal bite force in finches. J. Exp. Biol. 207, 2745–2753. ( 10.1242/jeb.01091) [DOI] [PubMed] [Google Scholar]
- 51.van der Meij MAA, Bout RG. 2006. Seed husking time and maximal bite force in finches. J. Exp. Biol. 209, 3329–3335. ( 10.1242/jeb.02379) [DOI] [PubMed] [Google Scholar]
- 52.Badyaev AV, Young RL, Oh KP, Addison C. 2008. Evolution on a local scale: developmental, functional, and genetic bases of divergence in bill form and associated changes in song structure between adjacent habitats. Evolution 62, 1951–1964. ( 10.1111/j.1558-5646.2008.00428.x) [DOI] [PubMed] [Google Scholar]
- 53.Charvet CJ, Striedter GF. 2011. Developmental modes and developmental mechanisms can channel brain evolution. Front. Neuroanat. 5, 4 ( 10.3389/fnana.2011.00004) [DOI] [PMC free article] [PubMed] [Google Scholar]
- 54.Collins CE, Leitch DB, Wong P, Kaas JH, Herculano-Houzel S. 2013. Faster scaling of visual neurons in cortical areas relative to subcortical structures in non-human primate brains. Brain Struct. Funct. 218, 805–816. ( 10.1007/s00429-012-0430-5) [DOI] [PMC free article] [PubMed] [Google Scholar]
- 55.Wong P, Peebles JK, Asplund CL, Collins CE, Herculano-Houzel S, Kaas JH. 2013. Faster scaling of auditory neurons in cortical areas relative to subcortical structures in primate brains. Brain Behav. Evol. 81, 209–218. ( 10.1159/000350709) [DOI] [PubMed] [Google Scholar]
- 56.Larson TA, Wang TW, Gale SD, Miller KE, Thatra NM, Caras ML, Perkel DJ, Brenowitz EA. 2013. Postsynaptic neural activity regulates neuronal addition in the adult avian song control system. Proc. Natl Acad. Sci. USA 110, 16 640–16 644. ( 10.1073/pnas.1310237110) [DOI] [PMC free article] [PubMed] [Google Scholar]
- 57.Scott BB, Lois C. 2007. Developmental origin and identity of song system neurons born during vocal learning in songbirds. J. Comp. Neurol. 502, 202–214. ( 10.1002/cne.21296) [DOI] [PubMed] [Google Scholar]
- 58.Scott BB, Gardner T, Ji N, Fee MS, Lois C. 2012. Wandering neuronal migration in the postnatal vertebrate forebrain. J. Neurosci. 32, 1436–1446. ( 10.1523/JNEUROSCI.2145-11.2012) [DOI] [PMC free article] [PubMed] [Google Scholar]
- 59.Airey DC, Castillo-Juarez H, Casella G, Pollak EJ, DeVoogd TJ. 2000. Variation in the volume of zebra finch song control nuclei is heritable: developmental and evolutionary implications. Proc. R. Soc. Lond. B 267, 2099–2104. ( 10.1098/rspb.2000.1255) [DOI] [PMC free article] [PubMed] [Google Scholar]
- 60.Pfenning AR, et al. 2014. Convergent transcriptional specializations in the brains of humans and song-learning birds. Science 346, 1 256 846 ( 10.1126/science.1256846) [DOI] [PMC free article] [PubMed] [Google Scholar]
- 61.Maddison WP, Maddison DR. 2008. Mesquite: a modular system for evolutionary analysis, v2.5. See http://mesquiteproject.org/.
- 62.Garland T Jr, Midford PE, Ives AR. 1999. An introduction to phylogenetically based statistical methods, with a new method for confidence intervals on ancestral values. Am. Zool. 39, 374–388. ( 10.1093/icb/39.2.374) [DOI] [Google Scholar]
Associated Data
This section collects any data citations, data availability statements, or supplementary materials included in this article.
Data Citations
- Maddison WP, Maddison DR. 2008. Mesquite: a modular system for evolutionary analysis, v2.5. See http://mesquiteproject.org/.
Supplementary Materials
Data Availability Statement
Raw data are available in the electronic supplementary material, table S1. We used Mesquite v. 2.74 to construct phylogenetic trees [61], the PDAP v. 1.16 module to compute independent contrasts [62], and Matlab and SPSS to perform statistical analyses.