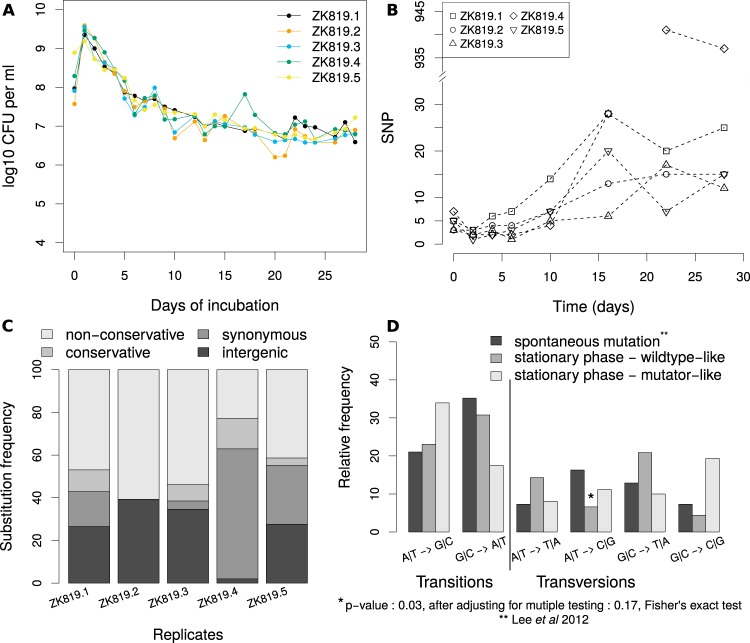
FIG 1 .
Mutational spectrum analysis in prolonged stationary-phase populations in comparison with mutation accumulation lines. (A) Change in population size over time for five replicate populations. (B) Change in observed number of SNPs over time for five replicate populations. (C) Substitution profiles of five replicates. (D) Comparison of BPS spectra from prolonged stationary phase with that reported for spontaneous mutations in a neutrally evolving population.

