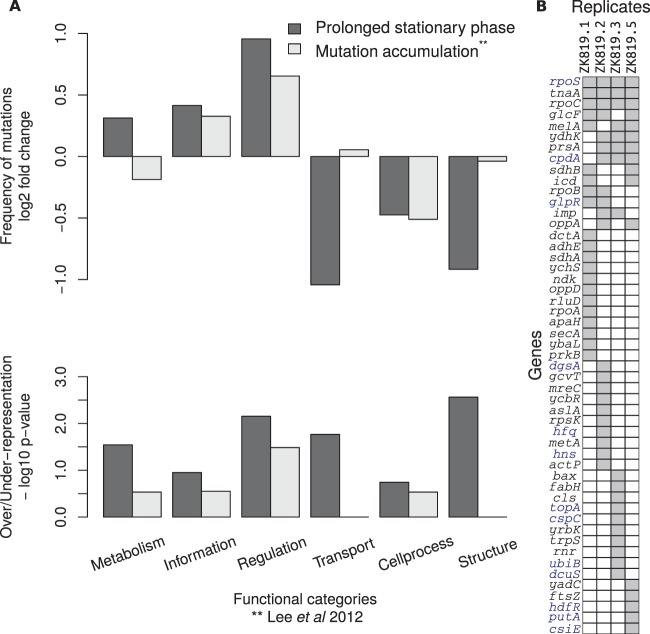
FIG 5 .
Functional bias among mutations observed in prolonged stationary phase. (A) The top plot shows deviation (log2 fold change) from the number of mutations expected in each functional category based on its relative size (total nucleotides) in the genome. The bottom plot shows corresponding −log10 P values (adjusted for multiple testing with Holm-Bonferroni method) for over- and underrepresentation. The “Regulation” category appears to be overrepresented in prolonged stationary phase; no such significant bias was observed for spontaneous mutations under the neutral mutation accumulation experiment of Lee et al. (21). (B) Binary matrix for genes mutated in four replicates; gray marks their presence. The genes highlighted in blue type have regulatory functions.

