ABSTRACT
Cytoplasmic peptidoglycan (PG) precursor levels were determined in methicillin-resistant Staphylococcus aureus (MRSA) after exposure to several cell wall-targeting antibiotics. Three experiments were performed: (i) exposure to 4× MIC levels (acute); (ii) exposure to sub-MIC levels (subacute); (iii) a time course experiment of the effect of vancomycin. In acute exposure experiments, fosfomycin increased UDP-GlcNAc, as expected, and resulted in substantially lower levels of total UDP-linked metabolite accumulation relative to other pathway inhibitors, indicating reduced entry into this pathway. Upstream inhibitors (fosfomycin, d-cycloserine, or d-boroalanine) reduced UDP-MurNAc-pentapeptide levels by more than fourfold. Alanine branch inhibitors (d-cycloserine and d-boroalanine) reduced d-Ala–d-Ala levels only modestly (up to 4-fold) but increased UDP-MurNAc-tripeptide levels up to 3,000-fold. Downstream pathway inhibitors (vancomycin, bacitracin, moenomycin, and oxacillin) increased UDP-MurNAc-pentapeptide levels up to 350-fold and UDP–MurNAc–l-Ala levels up to 80-fold, suggesting reduced MurD activity by downstream inhibitor action. Sub-MIC exposures demonstrated effects even at 1/8× MIC which strongly paralleled acute exposure changes. Time course data demonstrated that UDP-linked intermediate levels respond rapidly to vancomycin exposure, with several intermediates increasing three- to sixfold within minutes. UDP-linked intermediate level changes were also multiphasic, with some increasing, some decreasing, and some increasing and then decreasing. The total (summed) UDP-linked intermediate pool increased by 1,475 μM/min during the first 10 min after vancomycin exposure, providing a revised estimate of flux in this pathway during logarithmic growth. These observations outline the complexity of PG precursor response to antibiotic exposure in MRSA and indicate likely sites of regulation (entry and MurD).
KEYWORDS: peptidoglycan, cell wall, Staphylococcus aureus, MRSA, antibiotic, metabolomics, LC-MS/MS, antibiotic resistance
INTRODUCTION
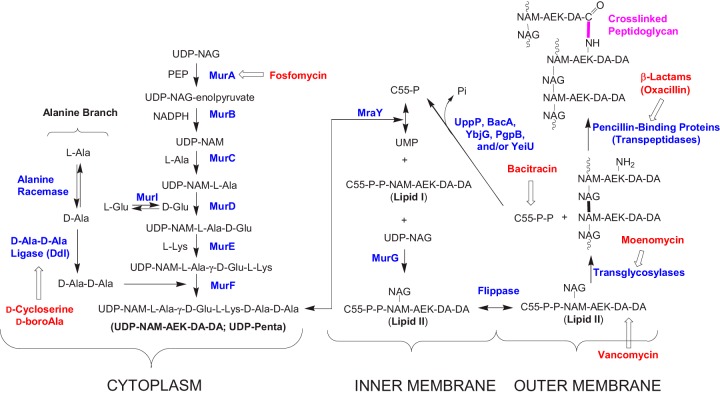
The synthesis of bacterial peptidoglycan (PG) is a complex process requiring a number of steps (1–9) (Fig. 1). The cytoplasmic steps of the pathway culminate in the synthesis of a UDP-MurNAc-pentapeptide intermediate. The peptidoglycan portion of this intermediate is then transferred to a lipid carrier for further elaboration, exported to the outer membrane leaflet, and assembled into mature cell wall peptidoglycan. The core cytoplasmic intermediates are a series of UDP-linked species: UDP-GlcNAc (UDP-NAG), UDP-NAG-enolpyruvate (UDP-EP), UDP-MurNAc (UDP-NAM), UDP–NAM–l-Ala (UDP-Mono), UDP–NAM–l-Ala–d-Glu (UDP-Di), UDP–NAM–l-Ala–γ-d-Glu–l-Lys (UDP-Tri), and UDP–NAM–l-Ala–γ-d-Glu–l-Lys–d-Ala–d-Ala (UDP-Penta). Synthesis of these intermediates also requires several amines associated with this pathway: l-Ala, d-Ala, d-Ala–d-Ala, l-Lys, l-Glu, and d-Glu. This pathway is the target of many antibacterial agents (Fig. 1) and for efforts to develop new antibacterial agents (4, 12–16). The identity of PG pathway intermediates, the enzymes catalyzing their synthesis, and the structural and mechanistic details of these enzymes are well-established (4). However, how this pathway acts as an integrated metabolic unit and how this pathway responds to antibiotics targeting its key steps are areas that have so far received only modest attention (17).
FIG 1.
Basic bacterial peptidoglycan biosynthesis pathway. Most Gram-negative bacteria use meso-diaminopimelic acid in place of l-Lys (10). In S. aureus, lipid I or lipid II is amidated on its γ-d-Glu (position 2) residue (11), and a pentaglycine “bridge” is added to the Nε amino groups of Lys (position 3) in lipid II (10, 11). PEP, phosphoenolpyruvate; AEK, l-Ala-γ-d-Glu-l-Lys.
We recently developed liquid chromatography-tandem mass spectrometry (LC-MS/MS) -based quantitative methods for the UDP-linked intermediates (18, 19) and amine intermediates (19–22) in this pathway. In this study, these methods are used to examine the effects of various antibiotics on cytoplasmic PG metabolite levels in methicillin-resistant Staphylococcus aureus (MRSA). The cell wall-targeting antibiotics selected for this study are well-known inhibitors of bacterial cell wall biosynthesis, with well-established targets. These antibiotics can be divided into three groups: upstream UDP branch inhibitors (fosfomycin), alanine branch inhibitors (d-cycloserine and d-boroalanine), and downstream inhibitors (vancomycin, bacitracin, moenomycin, and oxacillin) (Fig. 1). Fosfomycin inhibits the two UDP-N-acetylglucosamine (UDP-NAG) enolpyruvyl transferases in S. aureus (MurA and MurZ) (23, 24). d-Cycloserine acts through inhibition of either alanine racemase (Alr) or d-Ala–d-Ala ligase (Ddl) depending on the organism. In S. aureus, the growth-inhibiting effects of d-cycloserine are due to inhibition of d-Ala–d-Ala ligase (25), whereas in Escherichia coli, d-cycloserine exerts its effect by inhibition of alanine racemase (20, 26, 27). d-Boroalanine is a synthetic antibacterial agent that acts through inhibition of Ddl (21). Vancomycin, bacitracin, moenomycin, and oxacillin target different late-stage postcytoplasmic steps in the S. aureus PG biosynthesis pathway (Fig. 1). Vancomycin inhibits bacterial PG biosynthesis by complexing with the d-Ala–d-Ala moiety of late PG intermediates (28, 29), bacitracin acts by complexing with the pyrophosphate moiety of undecaprenyl pyrophosphate (C55-P-P in Fig. 1) (30, 31), moenomycin acts by inhibition of peptidoglycan glycosyltransferases (2, 32), and oxacillin acts by inhibition of penicillin-binding proteins (PBPs) (33). MRSA is resistant to oxacillin due to the presence of PBP2a, which provides MRSA with its characteristic β-lactam resistance (34–36). The experiments in this study were performed under both acute (supra-MIC) and subacute (sub-MIC) antibiotic concentration conditions. Control studies were also performed under acute conditions with several non-PG synthesis inhibitors. Finally, the time course for the response of PG metabolite levels to vancomycin exposure was also determined. This study reveals effects of these antibiotics on PG intermediate pool levels and provides an outline of the response of this pathway to cell wall-targeting agents.
RESULTS AND DISCUSSION
Acute antibiotic level effects.
Upon acute (supra-MIC) antibiotic exposure, MRSA growth progressively slowed and completely stopped after ∼90 min (Fig. 2), at which time samples for metabolite analysis were collected. Oxacillin was included as a non-growth-stopping cell wall-targeted antibiotic for comparison, and growth slowed but did not stop after oxacillin addition. The measured levels of both UDP-linked and amine intermediates are summarized in Table 1 for PG biosynthesis-targeting agents and in Table 2 for non-PG biosynthesis-targeting agents.
FIG 2.
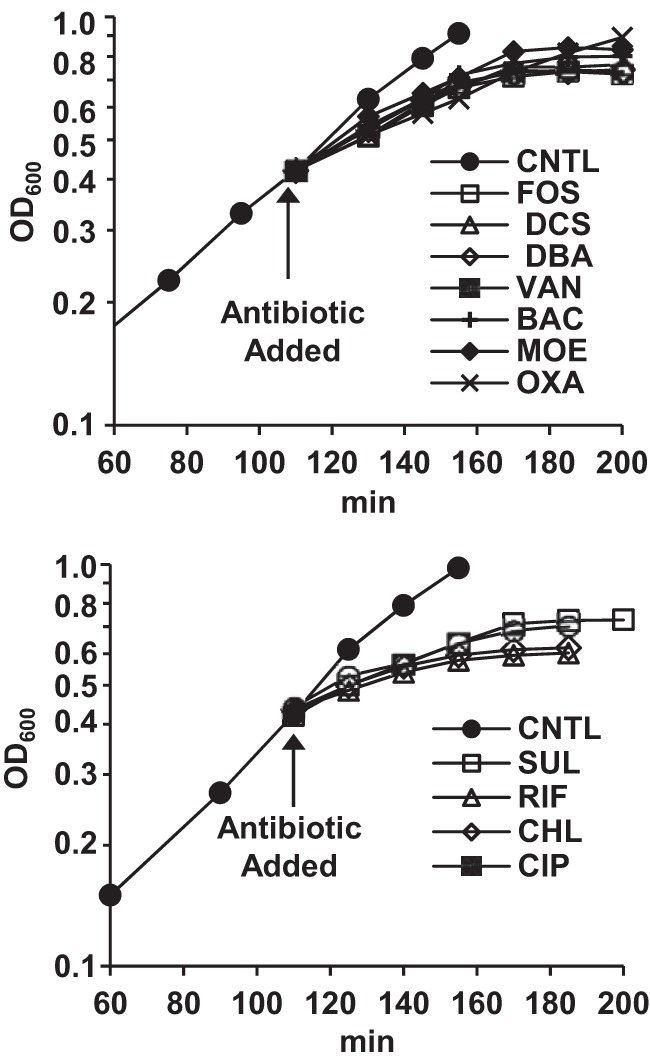
Semilog plots of growth curves (OD600) for control and antibiotic-treated MRSA cultures. (Top) Cell wall-targeted inhibitors. (Bottom) Non-cell wall-targeted inhibitors. Abbreviations: CNTL, control; FOS, fosfomycin; DCS, d-cycloserine; DBA, d-boroalanine; VAN, vancomycin; BAC, bacitracin; MOE, moenomycin; OXA, oxacillin; SUL, sulfamethoxazole; RIF, rifampin; CHL, chloramphenicol; CIP, ciprofloxacin.
TABLE 1.
Cytoplasmic peptidoglycan biosynthesis intermediate levels in MRSA (ATCC 43300) in control and antibiotic-treated samplesa
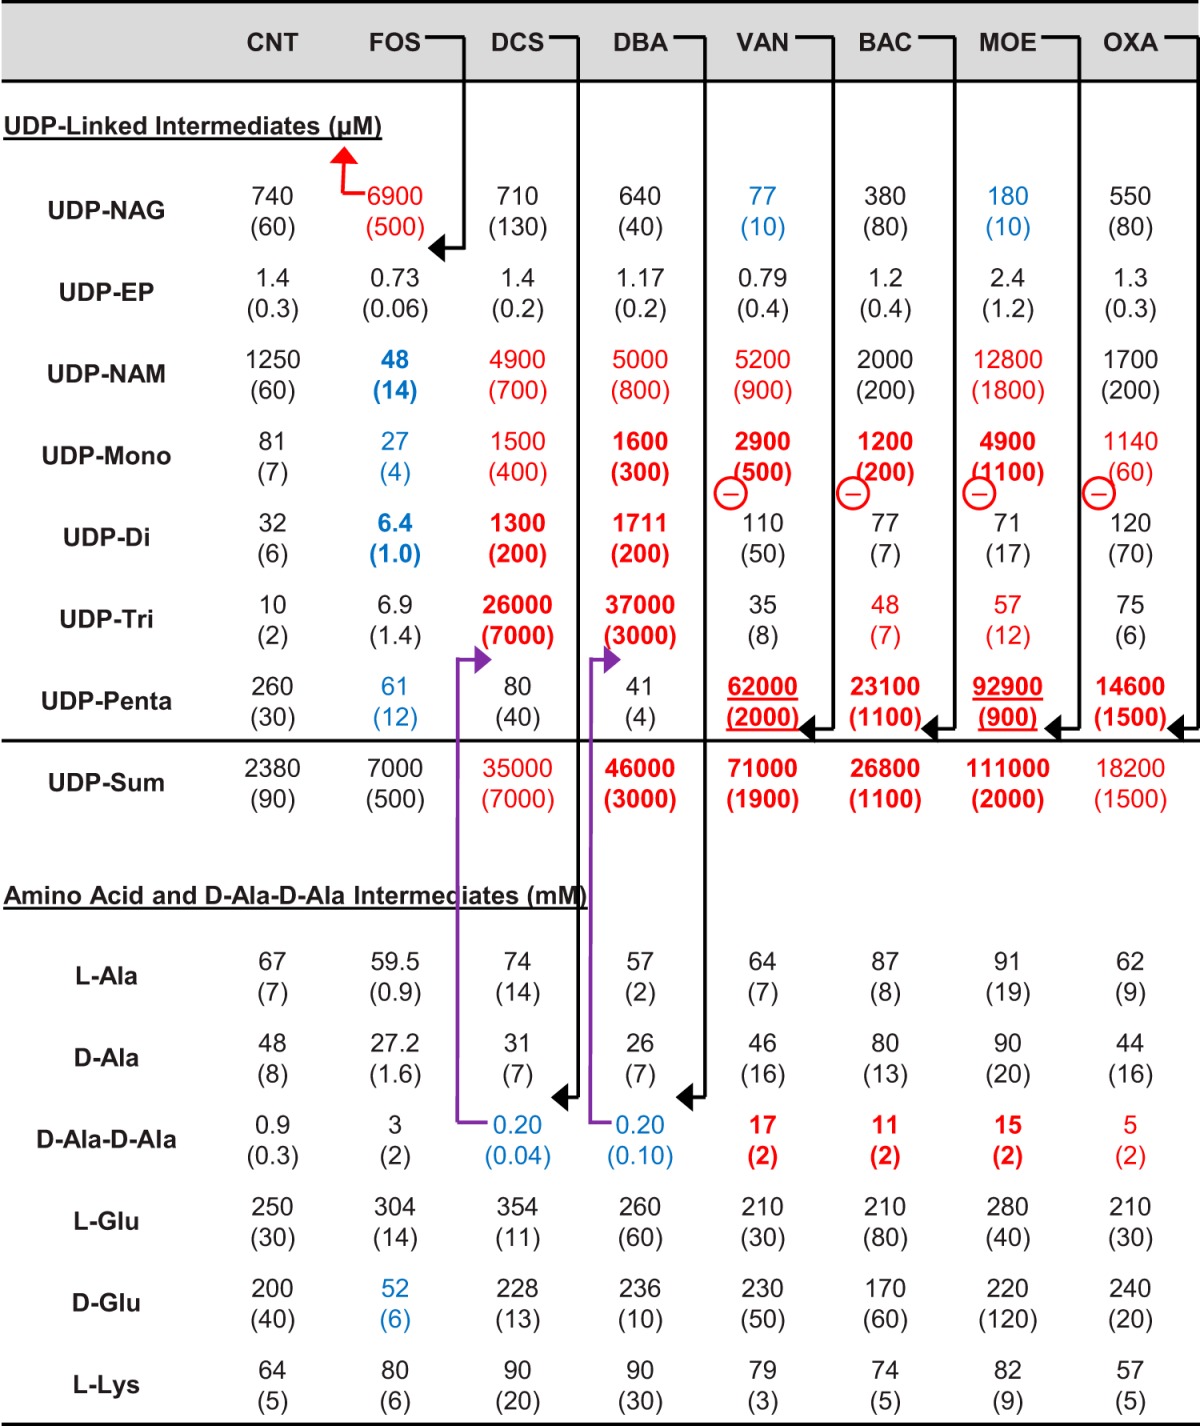
Antibiotic treatments were for 90 min at 4× MIC, except for oxacillin which was sub-MIC. The values in parentheses are standard errors (n = 3). Red values denote substantially (3-fold) increased values, blue values denote substantially (3-fold) decreased values, bold values denote strongly (10-fold) affected values, and underlined values denote very strongly (100-fold) affected values. Black arrows denote the primary step targeted by an agent, purple arrows denote a secondary metabolite level effect, and the red arrow denotes a possible negative regulatory effect of accumulating metabolites. Other inferred sites of negative regulation are denoted with a red circled minus symbol. Antibiotic treatment abbreviations: CNT, control; FOS, fosfomycin; DCS, d-cycloserine; DBA, d-boroalanine; VAN, vancomycin; BAC, bacitracin; MOE, moenomycin; OXA, oxacillin.
TABLE 2.
Effects of non-cell wall-targeted antibiotics on cytoplasmic PG biosynthesis intermediate levels in MRSAa
| Intermediate | Effect of antibiotic on intermediateb: |
|||
|---|---|---|---|---|
| CNT | CHL | SUL | CIP | |
| UDP-linked intermediates (μM) | ||||
| UDP-NAG | 430 (30) | 570 (30) | 650 (100) | 660 (80) |
| UDP-EP | 1.08 (0.13) | 1.30 (0.18) | 1.32 (0.11) | 1.28 (0.09) |
| UDP-NAM | 1,312 (11) | 1,760 (130) | 1,170 (50) | 1,450 (130) |
| UDP-Mono | 100 (20) | 101 (8) | 110 (20) | 174 (14) |
| UDP-Di | 52 (9) | 56 (9) | 62 (8) | 70 (20) |
| UDP-Tri | 4.4 (0.4) | 7.23 (0.03) | 7.0 (1.8) | 6.5 (0.3) |
| UDP-Penta | 407 (6) | 600 (50) | 380 (70) | 510 (90) |
| UDP-Sum | 2,310 (60) | 3,110 (50) | 2,400 (200) | 2,880 (140) |
| Amino acid and d-Ala–d-Ala intermediates (mM) | ||||
| l-Ala | 66 (11) | 60 (30) | 38 (4) | 68 (14) |
| d-Ala | 71 (7) | 60 (20) | 42 (4) | 80 (20) |
| d-Ala–d-Ala | 1.14 (0.02) | 0.89 (0.04) | 0.93 (0.01) | 1.2 (0.2) |
| l-Glu | 230 (20) | 220 (60) | 250 (50) | 180 (20) |
| d-Glu | 230 (40) | 132 (10) | 150 (40) | 160 (30) |
| l-Lys | 61 (9) | 49 (4) | 51 (3) | 62 (11) |
Antibiotic treatments were at 4× MIC.
The values for UPD-linked intermediates are in micromolar concentrations, while the value for the amino acids and d-Ala–d-Ala intermediates are in millimolar concentrations. Antibiotic treatment abbreviations: CNT, control; CHL, chloramphenicol; SUL, sulfamethoxazole; CIP, ciprofloxacin. Values in parentheses are standard errors (n = 2).
Acute 90-min fosfomycin exposure resulted in a 10-fold increase in UDP-NAG and substantial decreases in downstream intermediates—particularly UDP-NAM and UDP-Di (∼25-fold and 5-fold, respectively), as expected given its known mechanism of action. The effect on the level of UDP-Penta (the terminal cytoplasmic intermediate) was modest at a fourfold decrease. These effects are similar to the effects of fosfomycin in E. coli (37). The total amount of PG pathway UDP-linked intermediates did not increase dramatically in fosfomycin-exposed cultures (2-fold increase) compared to the other antibiotics included in this study (up to 50-fold), indicating that entry into the UDP branch of this pathway is substantially decreased by blockade of the MurA/Z-catalyzed step by fosfomycin.
d-Cycloserine or d-boroalanine exposure resulted in a 4-fold decrease in d-Ala–d-Ala, a 4- to 6-fold decrease in UDP-Penta level, and a substantial increase (3,000- to 4,000-fold) in UDP-Tri levels (Table 1). The fact that a modest decrease in d-Ala–d-Ala results in relatively large effects on UDP-linked intermediate levels is consistent with MurF being unable to keep up with the flux along the UDP branch of this pathway at these modestly reduced d-Ala–d-Ala levels. Both d-cycloserine and d-boroalanine resulted in ∼15-fold increases in total PG pathway UDP-linked intermediate levels, indicating that entry into the UDP branch of this pathway is not substantially blocked by these inhibitors. The observed effects of d-cycloserine on UDP-Tri and UDP-Penta levels are consistent with the previously observed effects of d-cycloserine in S. aureus of a >100-fold increase and 3-fold decrease in UDP-Tri and UDP-Penta levels, respectively (38). A common feature of all three upstream inhibitors (fosfomycin, d-cycloserine, and d-boroalanine) is that cessation of cell growth is associated with a reduction of UDP-Penta levels to 15 to 20% of its uninhibited level.
Vancomycin, bacitracin, moenomycin, and oxacillin all target different late PG biosynthesis steps. Examination of the data in Table 1 indicates that all four inhibitors exert similar, but possibly not identical, effects on the levels of PG intermediates. Vancomycin and moenomycin resulted in large increases in UDP-Penta of 200- to 400-fold, bacitracin resulted in a 90-fold increase, and oxacillin resulted in a 50-fold increase. The observation of dramatically increased UDP-Penta is consistent with the known targets of these agents and with prior studies of vancomycin and moenomycin in E. coli (39). Treatment with the continued growth-permitting oxacillin (MIC of >128 μg/ml) reduced the bacterial growth rate by about one-half after initial exposure and resulted in nearly as large an increase in UDP-Penta as did bacitracin. All four of these antibiotics also substantially increased d-Ala–d-Ala levels (6- to 16-fold) and total (summed) UDP-linked intermediate levels (8- to 46-fold). Vancomycin and moenomycin demonstrated higher UDP-Penta accumulations and greater decreases of UDP-NAG levels than bacitracin and oxacillin did.
A recent study by Dorries and coworkers examined global metabolite changes in methicillin-sensitive S. aureus (MSSA) associated with supra-MIC exposure to several antibiotics, including fosfomycin, vancomycin, ciprofloxacin, and ampicillin (17). This study observed relative changes in UDP-linked intermediates upon vancomycin and fosfomycin treatment, generally consistent with the changes observed here (Table 1). However, the study of Dorries and coworkers also observed a substantial increase of UDP-linked intermediates after exposure to ciprofloxacin, a non-cell wall-targeting agent. Another non-cell wall-targeting agent, the protein biosynthesis inhibitor chloramphenicol, has also previously been found to increase the levels of UDP-NAG (6-fold) and UDP-Penta (13-fold) in E. coli (40). The effects of several non-cell wall-targeted inhibitors against MRSA were therefore also assessed in this study (Table 2). These non-cell wall-targeted antibiotics had no significant effects on PG intermediate levels in MRSA, in contrast to the effect noted above for ciprofloxacin in MSSA (17). This difference seems likely due to the difference in S. aureus strains used in the two studies, since this study used an MRSA strain with fairly high resistance to ciprofloxacin (16 μg/ml MIC), whereas the study by Dorries and coworkers used an MSSA strain sensitive to ciprofloxacin (MIC of <1 μg/ml).
Subacute (sub-MIC) effects of antibiotics on PG intermediate levels.
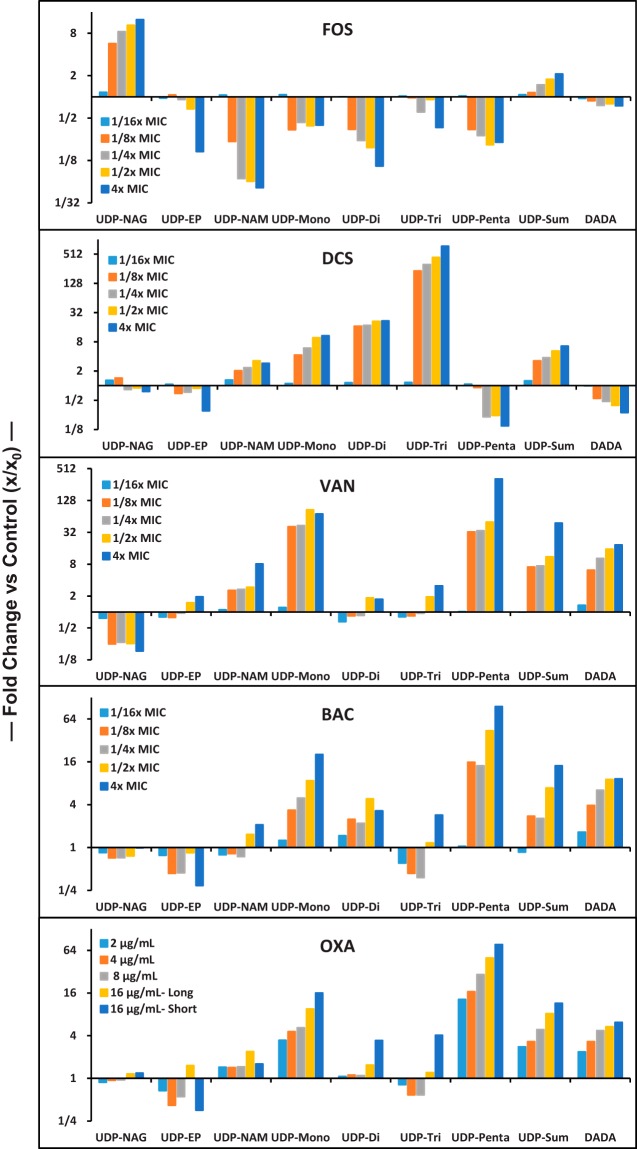
The effect of continuous growth in the presence of subacute (sub-MIC) antibiotic levels was also assessed (Fig. 3). Growth curves for cultures in the presence of sub-MIC antibiotic levels were essentially indistinguishable from uninhibited cultures prior to sample collection (data not shown). Under these conditions, intermediates will progress through this pathway at or close to the same rate (flux) as in uninhibited cells but with key steps partially incapacitated by the presence of antibiotic. Values from the acute (supra-MIC) exposure experiment (Table 1) are also incorporated into Fig. 3. Sub-MIC exposures even at 1/8× MIC showed significant effects for the tested agents. Increasing concentrations further affected intermediate levels toward that observed in the acute exposure experiments. The pattern of PG intermediate level changes observed in the sub-MIC experiments parallel the supra-MIC results summarized in Table 1. While there are strong similarities between vancomycin, bacitracin, and oxacillin in the sub-MIC experiment (Fig. 3), sub-MIC vancomycin exposure is associated with a substantial decrease in UDP-NAG and increase in UDP-Penta, whereas bacitracin and oxacillin had much less effect on these intermediates. Moenomycin is similar to vancomycin in this difference (Table 1), which makes sense since vancomycin and moenomycin target the same PG biosynthesis step (Fig. 1). The supra-MIC and sub-MIC data together indicate a difference in pathway response between vancomycin/moenomycin and bacitracin/oxacillin exposure.
FIG 3.
Dependence of key MRSA PG intermediate levels on sub-MIC antibiotic exposure and comparison with their acute (Table 1) exposure values. MICs are shown on a semilog y axis with a fractional number format. UDP-Sum is the sum of all UDP-linked intermediates, and DADA stands for d-Ala–d-Ala. For OXA exposures, “Long” refers to experiments performed as described for sub-MIC exposure experiments, and “Short” refers to acute (sub-MIC) exposure.
Time-dependent effect of vancomycin on PG metabolite levels in MRSA.
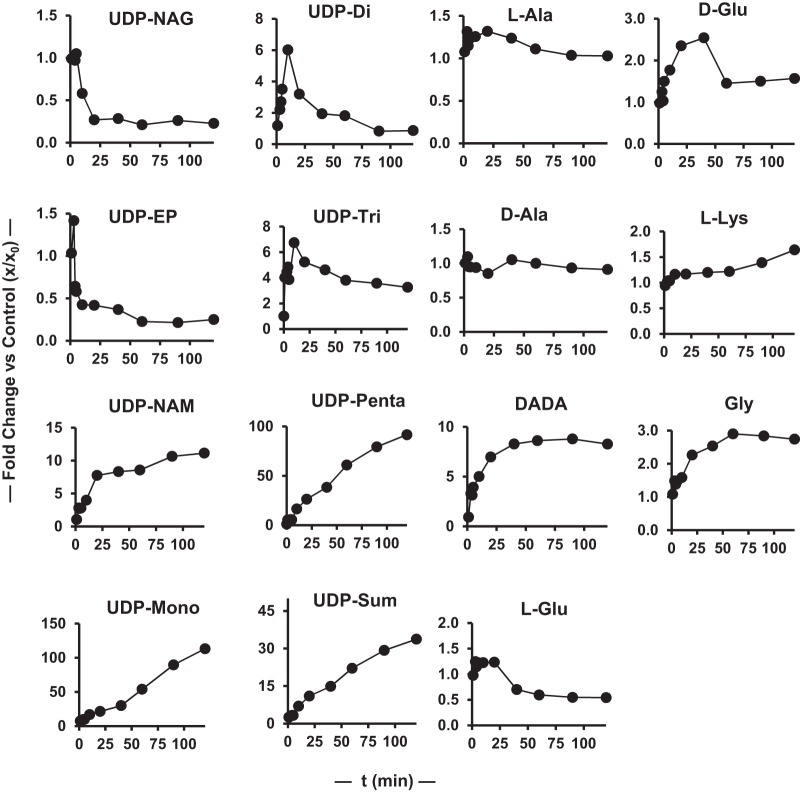
To provide some information on the rate at which PG intermediate levels change in response to antibiotic exposure, a 2-h time course experiment for the effect of vancomycin on these intermediates was obtained (Fig. 4 and 5). The PG intermediate levels at 90 min in this time course experiment closely match the data in Table 1 for 90-min vancomycin treatment. PG metabolite levels change rapidly in response to vancomycin exposure, with severalfold changes occurring in several species in the 1- to 3-min time frame. These changes follow several patterns, with UDP-Mono and UDP-Penta levels increasing constantly, UDP-NAG decreasing monotonically to a new steady-state level after a short lag, UDP-NAM increasing monotonically to a new steady-state level, and UDP-Di and UDP-Tri initially increasing, peaking at 10 min, and then decreasing to new steady-state levels. UDP-EP levels are challenging to quantify given their low levels, but generally the levels are constant after vancomycin treatment in all three experiments (Table 1 and Fig. 3 and 5). The total UDP-linked intermediate pool increased continuously, with some decrease in rate over time, consistent with entry into this pathway being approximately constant over this period. Amine intermediate levels were also generally constant except for d-Ala–d-Ala, which increased at a constant rate after an initial lag. Detailed analysis and interpretation of time course data such as that shown in Fig. 5 will require additional data and the construction of a systems biology model of this pathway. However, it is clear that this pathway exhibits previously unrecognized complexity in its dynamic response to antibiotic exposure.
FIG 4.
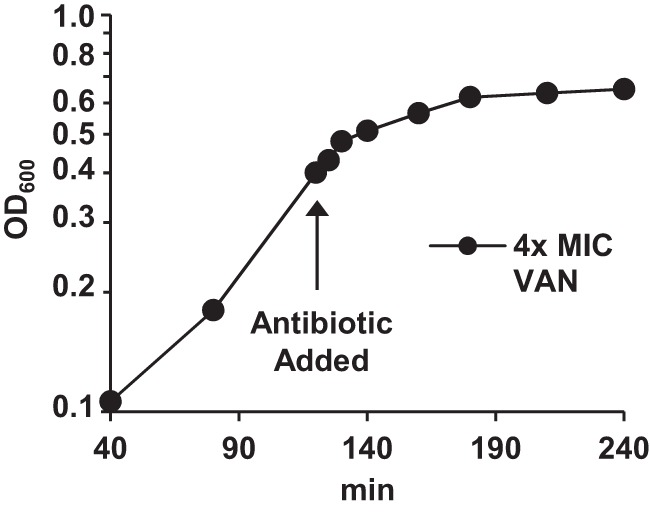
Semilog plot of growth curve for time-dependent effect of vancomycin on MRSA.
FIG 5.
Time dependence of the effect of vancomycin on MRSA PG intermediates plotted as fold changes versus the time zero values. UDP-Sum is the sum of all UDP-linked intermediates.
Pathway flux revisited.
The slow apparent onset of complete growth inhibition by these antibiotics (excluding oxacillin) as measured by turbidity (Fig. 2) indicates that their action is not immediate or that other processes are continuing which allow growth/turbidity to increase for a period after antibiotic addition. However, the effects of added vancomycin on metabolite levels (Fig. 5) are clearly immediate, consistent with the latter explanation for increasing turbidity after antibiotic addition. A metabolic flux rate through this pathway of 690 μM/min was previously estimated based on total PG in S. aureus under uninhibited growth conditions (19). A flux of 690 μM/min over 90 min would provide for an unimpeded accumulation of UDP-linked intermediates of ∼62,000 μM. The total accumulations for acute vancomycin, bacitracin, and moenomycin exposures are higher than this value (Table 1). The time dependence of the accumulation of all UDP-linked intermediates (UDP-Sum) after vancomycin exposure (Fig. 5) demonstrates a rate of UDP-linked metabolite accumulation of 1,475 μM/min over the first 10 min, which is more consistent with the total 90-min accumulations for late-stage PG biosynthesis inhibitors observed in Table 1 than our prior estimate of 690 μM/min (19).
Summary.
The key observations made in this study follow. (i) In contrast to other cell wall-targeted antibiotics, fosfomycin treatment did not result in a substantial accumulation of UDP-linked intermediates (UDP-NAG) that would be expected if entry into the UDP branch of this pathway was uninhibited. This observation indicates that UDP-NAG accumulation directly or indirectly reduces entry into this pathway. (ii) Increased levels of UDP-Penta associated with late-stage inhibitors (vancomycin, moenomycin, bacitracin, and oxacillin) are correlated with an increased level of UDP-Mono and UDP-NAM accumulation without corresponding changes in the levels of UDP-Di and UDP-Tri, suggesting that increased UDP-Penta levels directly or indirectly affect conversion of UDP-Mono to UDP-Di (MurD). This effect was also apparent in the vancomycin time course data (Fig. 5). (iii) While the effects of all four late-stage inhibitors are similar, acute (Table 1) and subacute (Fig. 3) vancomycin and moenomycin exposures caused decreases in UDP-NAG and increases in UDP-Penta that were not apparent with bacitracin and oxacillin exposures. These differences indicate a difference in response to these two groups (vancomycin/moenomycin versus bacitracin/oxacillin) of antibiotics. (iv) Sub-MIC exposure data (Fig. 3) demonstrate that cell wall-targeting agents manifest their effects even at levels well below their MICs without affecting the overall growth rate, and by inference, the PG pathway metabolite flux. (v) The vancomycin exposure time course revealed rapid changes in metabolite levels in response to antibiotic exposure on the 1- to 3-min time scale. The initial increase and then decrease of UDP-Di and UDP-Tri levels is also consistent with some impediment to MurD after inhibition sets in, as inferred also from acute (Table 1) and subacute (Fig. 3) vancomycin exposure. The time course data also provide a revised PG biosynthesis flux estimate of 1,475 μM/min.
MATERIALS AND METHODS
General.
The materials and methods used in this study are the same as described recently for the determination of the baseline levels of cytoplasmic PG intermediates in S. aureus (18, 19). Additional reagents used in this study were moenomycin from Waterstone Tech, ciprofloxacin from Alfa Aesar, and bacitracin, chloramphenicol, and sulfamethoxazole from Sigma-Aldrich. The ATCC 43300 (F-182) strain of methicillin-resistant S. aureus (MRSA) was from the American Type Culture Collection.
Acute (supra-MIC) effects of antibiotics on MRSA.
A 20-ml saturated (stationary-phase) overnight culture of methicillin-resistant S. aureus (ATCC 43300), grown in Mueller-Hinton broth (MH), was used to inoculate 450 ml of MH in a baffled flask. The culture was grown with good agitation at 35°C with a doubling time of 40 min (Fig. 2). When the culture reached an optical density at 600 nm (OD600) of 0.4, 50-ml portions were transferred into 250-ml baffled flasks. Antibiotics were added to these individual flasks at 4× their MICs—with MICs of 4 μg/ml for fosfomycin, 8 μg/ml for d-cycloserine and d-boroalanine, 2 μg/ml for vancomycin, 4 μg/ml for bacitracin, and 1 μg/ml for moenomycin. For oxacillin, which does not stop growth against MRSA (MIC of >128 μg/ml), 16 μg/ml was added to the treatment flask. The non-cell wall-targeting antibiotics ciprofloxacin (DNA gyrase), chloramphenicol (protein biosynthesis), and sulfamethoxazole (folate biosynthesis) were similarly tested for their effects on PG intermediate levels at 4× their MICs (MICs of 16, 8, and 8 μg/ml, respectively) (90-min exposure). Antibiotic-treated cultures were incubated with shaking for approximately two pretreatment doubling times (90 min) until the increase in OD600 was arrested (Fig. 2). Samples (15 ml) from individual experiments were collected in triplicate and prepared for analysis as described below. Experiments were fully replicated to provide standard errors for reported metabolite level values.
Subacute (sub-MIC) effects of antibiotics.
Cultures were grown for an extended period at sub-MIC levels of the tested antibiotic at various concentrations. For each antibiotic, small (5-ml) saturated overnight MRSA cultures containing 0×, 1/16×, 1/8×, 1/4×, and 1/2× MICs of individual antibiotics (fosfomycin, d-cycloserine, vancomycin, bacitracin, and oxacillin) were used to inoculate 50-ml portions of MH into baffled flasks containing the same level of test antibiotic. The cultures were grown until they reached an OD600 of 0.65, and samples (15 ml) were collected in triplicate and prepared for analysis as described below.
Time-dependent effect of vancomycin on PG metabolite levels in MRSA.
A 20-ml saturated overnight bacterial culture of MRSA was used to inoculate 500 ml of MH into a baffled flask. The culture was grown with good agitation and incubation at 35°C with a doubling time before antibiotic addition of 40 min. When the culture reached an OD600 of 0.35, vancomycin (4× MIC) was added. At regular time intervals (0, 1, 2, 3, 4, 5, 10, 20, 40, 60, 90, and 120 min), duplicate 15-ml samples were collected and prepared for analysis as described below.
Preparation of bacterial extracts and quantification of cytoplasmic PG cell wall intermediates.
Bacterial extracts were prepared using filtration-based cell isolation and methanol-based metabolite extraction procedures, and cell wall intermediates were quantified as described previously (18–20, 41). The UDP-glucuronic acid internal standard concentration was reduced to 1 μM in this study. Intracellular analyte concentrations were calculated using a culture-to-cell dry weight (CDW) conversion factor of 250 mg cell (dry weight) (liter of culture)−1 OD600−1 (19, 42) and an internal cell volume of 2 μl/mg cell (dry weight) (43).
ACKNOWLEDGMENTS
This research was supported by a University of Missouri Research Board Grant and funds from the National Institutes of Health (grant AI121903 to W.G.G.).
REFERENCES
- 1.Höltje JV. 1998. Growth of the stress-bearing and shape-maintaining murein sacculus of Escherichia coli. Microbiol Mol Biol Rev 62:181–203. [DOI] [PMC free article] [PubMed] [Google Scholar]
- 2.van Heijenoort J. 2001. Formation of the glycan chains in the synthesis of bacterial peptidoglycan. Glycobiology 11:25R–36R. doi: 10.1093/glycob/11.3.25R. [DOI] [PubMed] [Google Scholar]
- 3.van Heijenoort J. 2007. Lipid intermediates in the biosynthesis of bacterial peptidoglycan. Microbiol Mol Biol Rev 71:620–635. doi: 10.1128/MMBR.00016-07. [DOI] [PMC free article] [PubMed] [Google Scholar]
- 4.Barreteau H, Kovač A, Boniface A, Sova M, Gobec S, Blanot D. 2008. Cytoplasmic steps of peptidoglycan biosynthesis. FEMS Microbiol Rev 32:168–207. doi: 10.1111/j.1574-6976.2008.00104.x. [DOI] [PubMed] [Google Scholar]
- 5.Bouhss A, Trunkfield AE, Bugg TD, Mengin-Lecreulx D. 2008. The biosynthesis of peptidoglycan lipid-linked intermediates. FEMS Microbiol Rev 32:208–233. doi: 10.1111/j.1574-6976.2007.00089.x. [DOI] [PubMed] [Google Scholar]
- 6.Sauvage E, Kerff F, Terrak M, Ayala JA, Charlier P. 2008. The penicillin-binding proteins: structure and role in peptidoglycan biosynthesis. FEMS Microbiol Rev 32:234–258. doi: 10.1111/j.1574-6976.2008.00105.x. [DOI] [PubMed] [Google Scholar]
- 7.Vollmer W, Blanot D, de Pedro MA. 2008. Peptidoglycan structure and architecture. FEMS Microbiol Rev 32:149–167. doi: 10.1111/j.1574-6976.2007.00094.x. [DOI] [PubMed] [Google Scholar]
- 8.Ruiz N. 2015. Lipid flippases for bacterial peptidoglycan biosynthesis. Lipid Insights 8:21–31. doi: 10.4137/LPI.S31783. [DOI] [PMC free article] [PubMed] [Google Scholar]
- 9.Teo AC, Roper DI. 2015. Core steps of membrane-bound peptidoglycan biosynthesis: recent advances, insight and opportunities. Antibiotics (Basel) 4:495–520. doi: 10.3390/antibiotics4040495. [DOI] [PMC free article] [PubMed] [Google Scholar]
- 10.Stranden AM, Ehlert K, Labischinski H, Berger-Bachi B. 1997. Cell wall monoglycine cross-bridges and methicillin hypersusceptibility in a femAB null mutant of methicillin-resistant Staphylococcus aureus. J Bacteriol 179:9–16. doi: 10.1128/jb.179.1.9-16.1997. [DOI] [PMC free article] [PubMed] [Google Scholar]
- 11.Schneider T, Senn MM, Berger-Bachi B, Tossi A, Sahl HG, Wiedemann I. 2004. In vitro assembly of a complete, pentaglycine interpeptide bridge containing cell wall precursor (lipid II-Gly5) of Staphylococcus aureus. Mol Microbiol 53:675–685. doi: 10.1111/j.1365-2958.2004.04149.x. [DOI] [PubMed] [Google Scholar]
- 12.Kotnik M, Anderluh PS, Prezelj A. 2007. Development of novel inhibitors targeting intracellular steps of peptidoglycan biosynthesis. Curr Pharm Des 13:2283–2309. doi: 10.2174/138161207781368828. [DOI] [PubMed] [Google Scholar]
- 13.Schneider T, Sahl HG. 2010. Lipid II and other bactoprenol-bound cell wall precursors as drug targets. Curr Opin Investig Drugs 11:157–164. [PubMed] [Google Scholar]
- 14.Bugg TD, Braddick D, Dowson CG, Roper DI. 2011. Bacterial cell wall assembly: still an attractive antibacterial target. Trends Biotechnol 29:167–173. doi: 10.1016/j.tibtech.2010.12.006. [DOI] [PubMed] [Google Scholar]
- 15.Silver LL. 2013. Viable screening targets related to the bacterial cell wall. Ann N Y Acad Sci 1277:29–53. doi: 10.1111/nyas.12006. [DOI] [PubMed] [Google Scholar]
- 16.Hrast M, Sosic I, Sink R, Gobec S. 2014. Inhibitors of the peptidoglycan biosynthesis enzymes MurA-F. Bioorg Chem 55:2–15. doi: 10.1016/j.bioorg.2014.03.008. [DOI] [PubMed] [Google Scholar]
- 17.Dorries K, Schlueter R, Lalk M. 2014. Impact of antibiotics with various target sites on the metabolome of Staphylococcus aureus. Antimicrob Agents Chemother 58:7151–7163. doi: 10.1128/AAC.03104-14. [DOI] [PMC free article] [PubMed] [Google Scholar]
- 18.Vemula H, Bobba S, Putty S, Barbara JE, Gutheil WG. 2014. Ion-pairing liquid chromatography-tandem mass spectrometry-based quantification of uridine diphosphate-linked intermediates in the Staphylococcus aureus cell wall biosynthesis pathway. Anal Biochem 465:12–19. doi: 10.1016/j.ab.2014.07.024. [DOI] [PubMed] [Google Scholar]
- 19.Vemula H, Ayon NJ, Gutheil WG. 2016. Cytoplasmic peptidoglycan intermediate levels in Staphylococcus aureus. Biochimie 121:72–78. doi: 10.1016/j.biochi.2015.11.017. [DOI] [PubMed] [Google Scholar]
- 20.Jamindar D, Gutheil WG. 2010. A liquid chromatography-tandem mass spectrometry assay for Marfey's derivatives of l-Ala, d-Ala, and d-Ala-d-Ala: application to the in vivo confirmation of alanine racemase as the target of cycloserine in Escherichia coli. Anal Biochem 396:1–7. doi: 10.1016/j.ab.2009.09.006. [DOI] [PubMed] [Google Scholar]
- 21.Putty S, Rai A, Jamindar D, Pagano P, Quinn CL, Mima T, Schweizer HP, Gutheil WG. 2011. Characterization of d-boroAla as a novel broad-spectrum antibacterial agent targeting d-Ala-d-Ala ligase. Chem Biol Drug Des 78:757–763. doi: 10.1111/j.1747-0285.2011.01210.x. [DOI] [PMC free article] [PubMed] [Google Scholar]
- 22.Putty S, Vemula H, Bobba S, Gutheil WG. 2013. A liquid chromatography-tandem mass spectrometry assay for d-Ala-d-Lac: a key intermediate for vancomycin resistance in vancomycin-resistant enterococci. Anal Biochem 442:166–171. doi: 10.1016/j.ab.2013.07.045. [DOI] [PubMed] [Google Scholar]
- 23.Kahan FM, Kahan JS, Cassidy PJ, Kropp H. 1974. The mechanism of action of fosfomycin (phosphonomycin). Ann N Y Acad Sci 235:364–386. doi: 10.1111/j.1749-6632.1974.tb43277.x. [DOI] [PubMed] [Google Scholar]
- 24.Marquardt JL, Siegele DA, Kolter R, Walsh CT. 1992. Cloning and sequencing of Escherichia coli murZ and purification of its product, a UDP-N-acetylglucosamine enolpyruvyl transferase. J Bacteriol 174:5748–5752. doi: 10.1128/jb.174.17.5748-5752.1992. [DOI] [PMC free article] [PubMed] [Google Scholar]
- 25.Strominger JL, Ito E, Threnn RH. 1960. Competitive inhibition of enzymatic reactions by oxamycin. J Am Chem Soc 82:998–999. doi: 10.1021/ja01489a058. [DOI] [Google Scholar]
- 26.Shockman GD. 1959. Reversal of cycloserine inhibition by d-alanine. Proc Soc Exp Biol Med 101:693–695. doi: 10.3181/00379727-101-25064. [DOI] [PubMed] [Google Scholar]
- 27.Lambert MP, Neuhaus FC. 1972. Mechanism of d-cycloserine action: alanine racemase from Escherichia coli W. J Bacteriol 110:978–987. [DOI] [PMC free article] [PubMed] [Google Scholar]
- 28.Nieto M, Perkins HR. 1971. Modifications of the acyl-d-alanyl-d-alanine terminus affecting complex-formation with vancomycin. Biochem J 123:789–803. doi: 10.1042/bj1230789. [DOI] [PMC free article] [PubMed] [Google Scholar]
- 29.Hammes WP, Neuhaus FC. 1974. On the mechanism of action of vancomycin: inhibition of peptidoglycan synthesis in Gaffkya homari. Antimicrob Agents Chemother 6:722–728. doi: 10.1128/AAC.6.6.722. [DOI] [PMC free article] [PubMed] [Google Scholar]
- 30.Stone KJ, Strominger JL. 1971. Mechanism of action of bacitracin: complexation with metal ion and C55-isoprenyl pyrophosphate. Proc Natl Acad Sci U S A 68:3223–3227. doi: 10.1073/pnas.68.12.3223. [DOI] [PMC free article] [PubMed] [Google Scholar]
- 31.Storm DR, Strominger JL. 1974. Binding of bacitracin to cells and protoplasts of Micrococcus lysodeikticus. J Biol Chem 249:1823–1827. [PubMed] [Google Scholar]
- 32.Ostash B, Walker S. 2010. Moenomycin family antibiotics: chemical synthesis, biosynthesis, and biological activity. Nat Prod Rep 27:1594–1617. doi: 10.1039/c001461n. [DOI] [PMC free article] [PubMed] [Google Scholar]
- 33.Frere JM, Page MG. 2014. Penicillin-binding proteins: evergreen drug targets. Curr Opin Pharmacol 18:112–119. doi: 10.1016/j.coph.2014.09.012. [DOI] [PubMed] [Google Scholar]
- 34.Hartman BJ, Tomasz A. 1984. Low-affinity penicillin-binding protein associated with beta-lactam resistance in Staphylococcus aureus. J Bacteriol 158:513–516. [DOI] [PMC free article] [PubMed] [Google Scholar]
- 35.Zapun A, Contreras-Martel C, Vernet T. 2008. Penicillin-binding proteins and beta-lactam resistance. FEMS Microbiol Rev 32:361–385. doi: 10.1111/j.1574-6976.2007.00095.x. [DOI] [PubMed] [Google Scholar]
- 36.Peacock SJ, Paterson GK. 2015. Mechanisms of methicillin resistance in Staphylococcus aureus. Annu Rev Biochem 84:577–601. doi: 10.1146/annurev-biochem-060614-034516. [DOI] [PubMed] [Google Scholar]
- 37.Mengin-Lecreulx D, van Heijenoort J. 1990. Correlation between the effects of fosfomycin and chloramphenicol on Escherichia coli. FEMS Microbiol Lett 54:129–133. doi: 10.1111/j.1574-6968.1990.tb03984.x. [DOI] [PubMed] [Google Scholar]
- 38.Baum EZ, Crespo-Carbone SM, Foleno BD, Simon LD, Guillemont J, Macielag M, Bush K. 2009. MurF inhibitors with antibacterial activity: effect on muropeptide levels. Antimicrob Agents Chemother 53:3240–3247. doi: 10.1128/AAC.00166-09. [DOI] [PMC free article] [PubMed] [Google Scholar]
- 39.Lara B, Mengin-Lecreulx D, Ayala JA, van Heijenoort J. 2005. Peptidoglycan precursor pools associated with MraY and FtsW deficiencies or antibiotic treatments. FEMS Microbiol Lett 250:195–200. doi: 10.1016/j.femsle.2005.07.005. [DOI] [PubMed] [Google Scholar]
- 40.Mengin-Lecreulx D, Siegel E, van Heijenoort J. 1989. Variations in UDP-N-acetylglucosamine and UDP-N-acetylmuramyl-pentapeptide pools in Escherichia coli after inhibition of protein synthesis. J Bacteriol 171:3282–3287. doi: 10.1128/jb.171.6.3282-3287.1989. [DOI] [PMC free article] [PubMed] [Google Scholar]
- 41.Meyer H, Liebeke M, Lalk M. 2010. A protocol for the investigation of the intracellular Staphylococcus aureus metabolome. Anal Biochem 401:250–259. doi: 10.1016/j.ab.2010.03.003. [DOI] [PubMed] [Google Scholar]
- 42.Blake KL, O'Neill AJ, Mengin-Lecreulx D, Henderson PJ, Bostock JM, Dunsmore CJ, Simmons KJ, Fishwick CW, Leeds JA, Chopra I. 2009. The nature of Staphylococcus aureus MurA and MurZ and approaches for detection of peptidoglycan biosynthesis inhibitors. Mol Microbiol 72:335–343. doi: 10.1111/j.1365-2958.2009.06648.x. [DOI] [PubMed] [Google Scholar]
- 43.Mengin-Lecreulx D, Flouret B, van Heijenoort J. 1982. Cytoplasmic steps of peptidoglycan synthesis in Escherichia coli. J Bacteriol 151:1109–1117. [DOI] [PMC free article] [PubMed] [Google Scholar]


