

ABSTRACT
Candida auris is an emerging multidrug-resistant yeast. So far, all but two susceptibility testing studies have examined ≤50 isolates, mostly with the CLSI method. We investigated CLSI and EUCAST MICs for 123 C. auris isolates and eight antifungals and evaluated various methods for epidemiological cutoff (ECOFF) determinations. MICs (in milligrams per liter) were determined using CLSI method M27-A3, and the EUCAST E.Def 7.3. ANOVA analysis of variance with Bonferroni's multiple-comparison test and Pearson analysis were used on log2 MICs (significance at P values of <0.05). The percent agreement (within ±0 to ±2 2-fold dilutions) between the methods was calculated. ECOFFs were determined visually, statistically (using the ECOFF Finder program and MicDat1.23 software with 95% to 99% endpoints), and via the derivatization method (dECOFFs). The CLSI and EUCAST MIC distributions were wide, with several peaks for all compounds except amphotericin B, suggesting possible acquired resistance. Modal MIC, geometric MIC, MIC50, and MIC90 values were ≤1 2-fold dilutions apart, and no significant differences were found. The quantitative agreement was best for amphotericin B (80%/97% within ±1/±2 dilutions) and lowest for isavuconazole and anidulafungin (58%/76% to 75% within ±1/±2 dilutions). We found that 90.2%/100% of the isolates were amphotericin B susceptible based on CLSI/EUCAST methods, respectively (i.e., with MICs of ≤1 mg/liter), and 100%/97.6% were fluconazole nonsusceptible by CLSI/EUCAST (MICs > 2). The ECOFFs (in milligrams per liter) were similar across the three different methods for itraconazole (ranges for CLSI/EUCAST, 0.25 to 0.5/0.5 to 1), posaconazole (0.125/0.125 to 0.25), amphotericin B (0.25 to 0.5/1 to 2), micafungin (0.25 to 0.5), and anidulafungin (0.25 to 0.5/0.25 to 1). In contrast, the estimated ECOFFs were dependent on the method applied for voriconazole (1 to 32) and isavuconazole (0.125 to 4). CLSI and EUCAST MICs were remarkably similar and confirmed uniform fluconazole resistance and variable acquired resistance to the other agents.
KEYWORDS: amphotericin B, azoles, echinocandins, in vitro, antifungal susceptibility testing, Candida auris, ECOFF, MIC
INTRODUCTION
Candida auris, an emerging multidrug-resistant yeast, was first reported as a human pathogen in 2009, after its isolation from the external ear canal of a Japanese patient (1). Since then, many reports have documented its role in candidemia and other deep-seated invasive infections in high-risk patients. Notably, in a short span of 5 years, C. auris has emerged as a significant cause of nosocomial infections in Asia, South Africa, Latin America, the United States, United Kingdom, and more recently in Spain and Israel (1–9). Moreover, isolated cases have been reported in Germany and Norway (10). Genotyping studies have confirmed clonality of nosocomial isolates, in agreement with its high potential for horizontal transmission and of causing outbreaks (4, 5, 11). This has prompted recent releases of alerts from several disease control organizations, including the U.S. Centers for Disease Control and Prevention (CDC), European Centre for Disease Control (ECDC), and Public Health England (PHE) (6, 10, 12). Awareness and knowledge of this organism are important, as misidentification is not uncommon in routine laboratory examinations by many commercial identification methods and, on top of this, falsely high MICs of amphotericin B and caspofungin can be obtained by Vitek 2 susceptibility testing methods (2, 13).
Susceptibility data for Candida auris isolates published to date suggest that this yeast is uniformly characterized by high fluconazole MICs (>16 mg/liter) and variable susceptibility to the other azoles, echinocandins and amphotericin B (13–15). The majority of studies have included a limited number of isolates for susceptibility testing; however, two studies, one from India and another collaborative study undertaken by the CDC, included 90 and 54 isolates, respectively. These two studies reported that 39% and 54% of the C. auris isolates exhibited high MICs for voriconazole (MIC, >1 mg/liter), 16% and 35% had high MICs for amphotericin B (>1 mg/liter), and finally, around 7% of the isolates were found to be echinocandin resistant based on a breakpoint of >2 mg/liter or >4 mg/liter for caspofungin, respectively (5, 13).
So far, the majority of the MIC data for C. auris isolates reported worldwide have been based on the Clinical and Laboratory Standards Institute (CLSI) broth microdilution method, and only a very few, limited to amphotericin B, have been based on the European Committee for Antimicrobial Susceptibility Testing (EUCAST) reference method (16). MICs obtained by the CLSI and EUCAST methods show a good correlation for Candida species and fluconazole and voriconazole in general, whereas MICs obtained by the EUCAST method are typically lower for amphotericin B, anidulafungin, micafungin, and posaconazole (17, 18). Here, we investigated in vitro activities of amphotericin B, azoles, and echinocandins against 123 C. auris isolates by using the EUCAST E.Def 7.3 method and compared the results with those obtained with the CLSI M27-A3 protocol (19, 20). Furthermore, the obtained MIC distributions were used for estimating tentative epidemiological cutoffs (ECOFFs) for C. auris for these compounds, by using the ECOFF Finder program (21), the derivatization method (22), and the visual “eyeball” method. Since the MIC distributions of the present study do not fulfill the recently proposed EUCAST criteria for ECOFF determinations, tentative ECOFFs were determined.
RESULTS
The MICs determined with the CLSI and EUCAST methods for the eight antifungal compounds against C. auris are displayed in Table 1. The MIC distributions spanned 10 or more dilutions for voriconazole, anidulafungin, and micafungin and >5 dilutions for the remaining drugs for both methods, except for amphotericin B evaluation with the EUCAST method. More than one peak was observed for all MIC distributions except that for amphotericin B (the number of peaks could not be evaluated for fluconazole, due to the test concentration range being truncated at the upper end) (Table 1). The modal MIC, geometric mean (GM) MIC, MIC50, and MIC90 values were in agreement for all compounds based on the CLSI and EUCAST endpoints, with a discrepancy not exceeding one 2-fold dilution. Finally, the percent quantitative agreement was highest for amphotericin B and fluconazole (with the caveat that the fluconazole data set was truncated), with 80 and 85% essential agreement within ±1 dilution and 97% and 91% agreement within ±2 dilutions; agreement was lowest for isavuconazole and anidulafungin, both of which resulted in 58% agreement within ±1 dilution and 76% and 75% agreement within ±2 dilutions (Table 2).
TABLE 1.
MIC distributions of antifungal drugs for C. auris isolates (n = 123) tested by using the CLSI and EUCAST methods
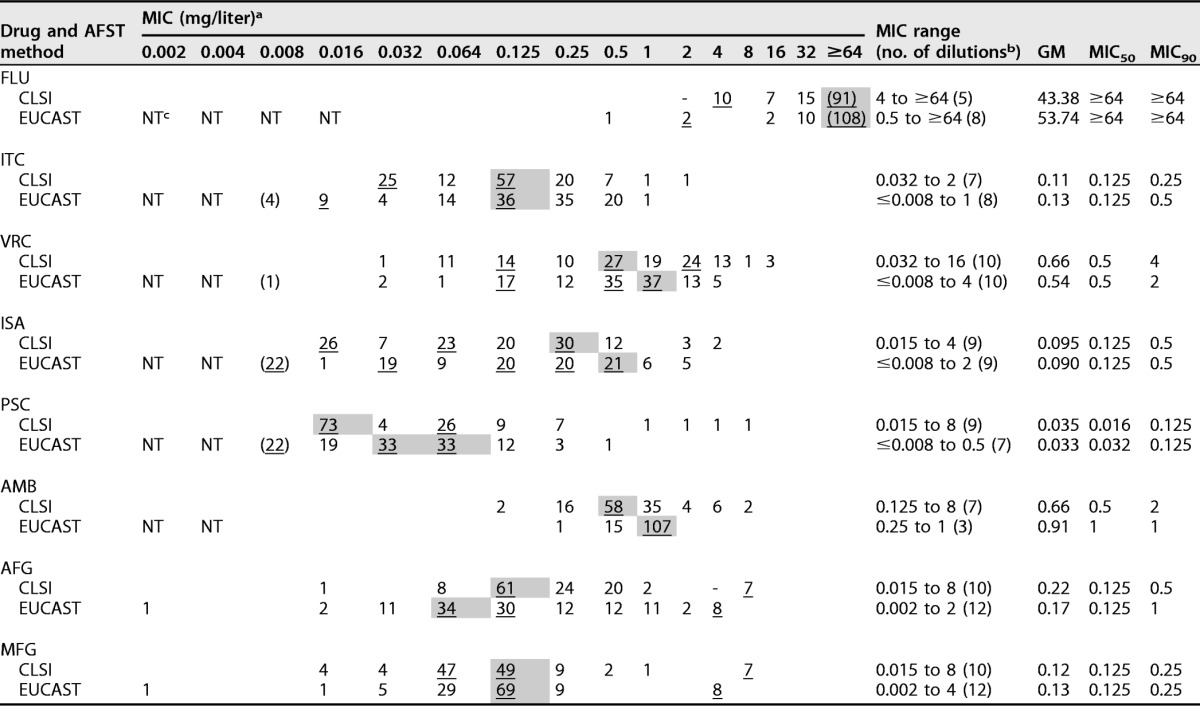
a Modal MICs are indicated with underlined numbers and gray shading, and values in parentheses represent the number of isolates with an MIC equal or less than the MIC indicated due to truncation. Additional peaks are illustrated by underlining.
b The number of dilutions each MIC distribution spanned is given in parentheses.
c NT, not tested.
TABLE 2.
Quantitative agreement between MIC results via CLSI and EUCAST methods for the 23 Candida auris isolates
| Antifungal drug | No. of isolates for which MICs from CLSI and EUCAST methods were identical or within indicated no. of dilution steps |
% quantitative agreement within indicated no. of 2-fold dilutions |
||||||||
|---|---|---|---|---|---|---|---|---|---|---|
| >+2 | +2 | +1 | 0 | −1 | −2 | <−2 | ±0 | ±1 | ±2 | |
| Fluconazole | 8 | 7 | 9 | 91 | 5 | 0 | 3 | 74 | 85 | 91 |
| Itraconazole | 4 | 23 | 31 | 31 | 20 | 11 | 3 | 25 | 67 | 94 |
| Voriconazole | 7 | 7 | 23 | 34 | 25 | 17 | 10 | 28 | 67 | 86 |
| Isavuconazole | 15 | 18 | 18 | 18 | 35 | 5 | 14 | 15 | 58 | 76 |
| Posaconazole | 8 | 19 | 27 | 18 | 34 | 4 | 13 | 15 | 64 | 83 |
| Amphotericin B | 1 | 15 | 47 | 48 | 4 | 5 | 3 | 39 | 80 | 97 |
| Anidulafungin | 23 | 15 | 19 | 23 | 29 | 6 | 8 | 19 | 58 | 75 |
| Micafungin | 2 | 1 | 10 | 48 | 28 | 17 | 16 | 39 | 70 | 85 |
Adopting the non-species-specific clinical breakpoint for fluconazole susceptibility in Candida (MIC ≤ 2 mg/liter), 100% and 97.6% (120/123) of the isolates were nonsusceptible by the CLSI and the EUCAST methods, respectively. Moreover, an MIC of >32 mg/liter (CLSI and EUCAST species-specific breakpoints defining resistance in Candida glabrata) was found for 74.0% (91/123) and 87.8% (108/123) of the C. auris isolates (Table 1). Among the other azoles, posaconazole was the most potent agent in vitro (CLSI GM MIC, 0.035 mg/liter; EUCAST GM MIC, 0.033 mg/liter), followed by isavuconazole (CLSI GM MIC, 0.09 mg/liter; EUCAST GM MIC, 0.01 mg/liter) and itraconazole (CLSI GM MIC, 0.11 mg/liter; EUCAST GM MIC, 0.13 mg/liter) (Table 2).
Amphotericin B GM MICs were 0.66 and 0.91 mg/liter by the CLSI and EUCAST methods, respectively. Adopting the non-species-specific susceptibility breakpoint for amphotericin B (MIC, ≤1 mg/liter), 90.2% (111/123) and 100% of isolates were susceptible by the CLSI and EUCAST methods, respectively. Finally, the in vitro activities of anidulafungin and micafungin were uniform, with GM values between 0.12 and 0.22 mg/liter and modal MIC and MIC50 values in the 0.064- to 0.125-mg/liter range. Of note, however, for both compounds, seven (5.7%) and eight isolates (6.5%), by CLSI and EUCAST testing, respectively, separated from the remaining MIC distribution (Table 1), six isolates of which displayed elevated MICs (≥4 mg/liter) by both methods and for both compounds (4.9%). No statistically significant differences were found when we compared the MICs determined with the two methods. The median (range among isolates) differences between the EUCAST and the CLSI MICs were 0 (−9 to 6) for all drugs except for amphotericin and anidulafungin, for which the median (range) was 1 (−3 to 3) and −1 (−6 to 5). Most (90%) of the differences were within 2 to 3 2-fold dilutions, except for isavuconazole, for which the differences were within 4 2-fold dilutions. Pearson correlation analysis showed statistically significant (P < 0.05) correlations for all drugs expect for posaconazole and amphotericin B. For the other drugs, the Pearson correlation coefficients ranged from 0.359 with anidulafungin to 0.535 with micafungin, indicating overall weak correlations.
ECOFFs were determined statistically with three different endpoint criteria (95%, 97.5%, and 99%), by the derivatization method, and by the visual (eyeball) method. In general, increasing the endpoint criteria for the statistical methods from 95 to 99% led to a an ECOFF approximately one dilution step higher (Table 3). The statistical (with 95% and 97.5% endpoints), derivatization, and eyeball method ECOFFs deviated no more than one dilution step across the different methods for itraconazole (ECOFF range for CLSI/EUCAST, 0.25 to 0.5/0.5 to 1 mg/liter), posaconazole (0.125/0.125 to 0.25 mg/liter), amphotericin B (0.25 to 0.5/1 to 2 mg/liter), and micafungin (0.25 to 0.5 mg/liter). For anidulafungin, this was also true for the CLSI ECOFFs (0.25 to 0.5 mg/liter), whereas slightly greater deviation was seen for the anidulafungin EUCAST ECOFFs (0.25 to 1 mg/liter). In contrast, the estimated ECOFFs were highly dependent on the method applied for voriconazole (1 to 32 mg/liter) and isavuconazole (0.125 to 4 mg/liter) (Table 3). Finally, due to truncation or multiple peaks interfering with determination of the wild-type peak and shape of the distribution, ECOFFs could not be selected visually for several compounds (Table 3).
TABLE 3.
CLSI and EUCAST tentative statistical, derivatization, and visual ECOFFs for Candida auris, using three different endpoints for the statistical methods
| Drug and AFST method | Modal MIC (mg/liter) | Statistical ECOFF at indicated endpointa |
dECOFF via derivatization method | ECOFF via visual eyeball methodb | |||||
|---|---|---|---|---|---|---|---|---|---|
| 95% |
97.5% |
99% |
|||||||
| ECOFF Finder | MicDat1.23 software | ECOFF Finder | MicDat1.23 software | ECOFF Finder | MicDat1.23 software | ||||
| FLC | |||||||||
| CLSI | 64 | NA | 64 | NA | 64 | NA | 64 | 128 | ND |
| EUCAST | 64 | NA | 64 | NA | 64 | NA | 64 | 128 | ND |
| ITC | |||||||||
| CLSI | 0.125 | 0.5 | 0.5 | 0.5 | 0.5 | 1 | 1 | 0.25 | 0.5 |
| EUCAST | 0.125 | 1 | 1 | 1 | 1 | 2 | 2 | 1 | 0.5 |
| VRC | |||||||||
| CLSI | 0.5 | 8 | 8 | 16 | 16 | 32 | 16 | 1 | ND |
| EUCAST | 1 | 4 | 4 | 4 | 4 | 8 | 8 | 2 | ND |
| ISA | |||||||||
| CLSI | 0.25 | 1 | 1 | 2 | 1 | 2 | 2 | 0.5 | ND |
| EUCAST | 0.5 | 0.125 | 2 | 0.25 | 4 | 0.25 | 4 | 1 | 1 |
| POS | |||||||||
| CLSI | 0.016 | 0.125 | 0.125 | 0.125 | 0.125 | 0.25 | 0.25 | 0.125 | ND |
| EUCAST | 0.032/0.64 | 0.125 | 0.125 | 0.25 | 0.25 | 0.25 | 0.25 | 0.125 | 0.25 |
| AMB | |||||||||
| CLSI | 0.5 | 1 | 2 | 2 | 2 | 2 | 2 | 2 | 2 |
| EUCAST | 1 | NA | 1 | NA | 1 | NA | 1 | 2 | 1 |
| AFG | |||||||||
| CLSI | 0.125 | 0.25 | 0.5 | 0.25 | 0.5 | 0.25 | 1 | 0.25 | 0.5 |
| EUCAST | 0.06 | 0.25 | 1 | 0.25 | 1 | 0.5 | 2 | 0.25 | 1 |
| MFG | |||||||||
| CLSI | 0.125 | 0.25 | 0.25 | 0.25 | 0.25 | 0.25 | 0.5 | 0.25 | 0.5 |
| EUCAST | 0.125 | 0.25 | 0.25 | 0.25 | 0.25 | 0.25 | 0.25 | 0.25 | 0.5 |
The statistical ECOFF determination method we used is described in reference 21, and the derivatization ECOFF determination method is described in reference 22. The ECOFF Finder program (21) will soon be freely available at the EUCAST website (www.eucast.org). NA, not available; the ECOFF Finder program could not provide an ECOFF.
ND, not determined; an ECOFF could not be determined by the visual method when distributions were truncated or bi- or trimodal with no clear main wild-type population.
DISCUSSION
The MICs generated by the two methods were overall very similar, as illustrated by the CLSI and EUCAST GMs for all compounds being less than one dilution apart and with overlapping confidence interval (CIs). Only for amphotericin B were the GMs slightly higher for MICs obtained by EUCAST (and CI intervals not overlapping), which led to one-step-higher modal and MIC50 values. However, as the EUCAST MIC range was narrower, this was not accompanied by higher MIC90 or ECOFFs, rendering this difference insignificant. Although large differences (up to 9 2-fold dilutions) were observed for some isolates, the differences for most isolates were within 2 to 3 2-fold dilutions. A general trend between the EUCAST and CLSI MICs could not be found, since weak correlations were observed for all drugs. The quantitative essential agreement between CLSI and EUCAST methods was less optimal, and particularly so for anidulafungin and isavuconazole. The apparent contradiction that, on one hand, the GM and ranges were very similar and, on the other, that quantitative agreement was less optimal, was probably related to the fact that the concentration versus optical density (OD) curves for the majority of cases were less steep in the 50% growth inhibition area for anidulafungin and isavuconazole, complicating precise and reproducible MIC determinations (Fig. 1).
FIG 1.
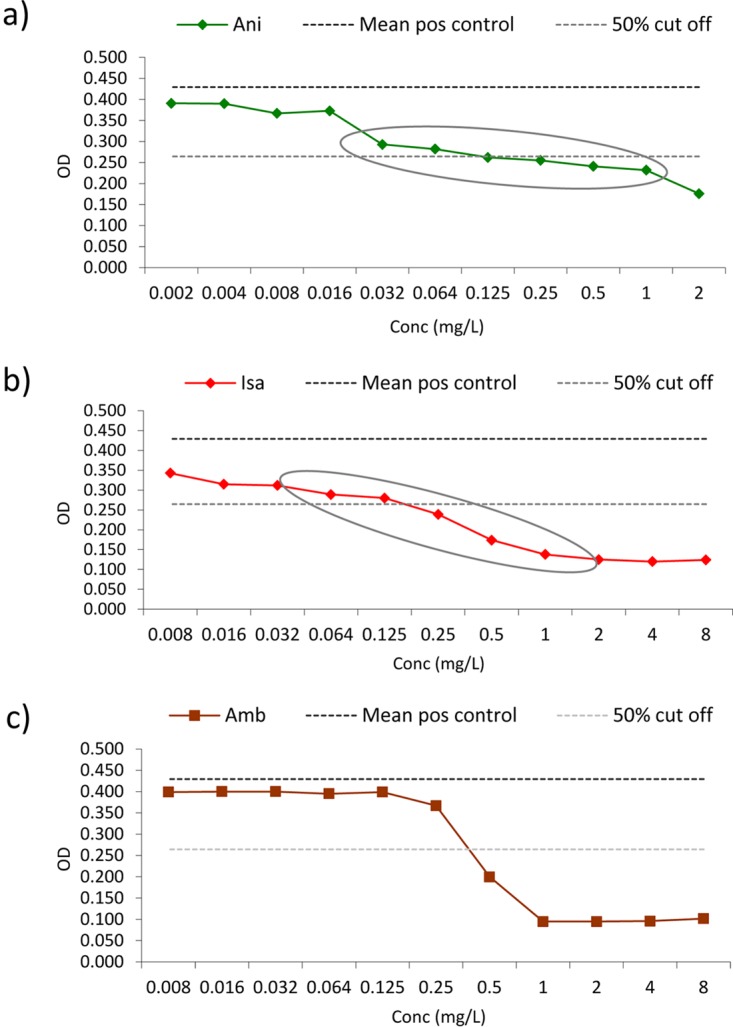
EUCAST spectrophotometer concentration versus OD curves for a C. auris isolate with significant partial growth inhibition over several dilutions (resulting in less steep growth curves), in particular for anidulafungin (a) and isavuconazole (b). (c) For comparison, the amphotericin B inhibition curve is shown. Partial growth inhibition ranges are encircled. Ani, anidulafungin; Isa, isavuconazole; Amb, amphotericin B; mean pos control, the mean positive control line, which corresponds to the mean optical density calculated from 8 replicate drug-free growth control wells (upper dotted line), whereas the 50% cutoff line corresponds to the 50% growth inhibition endpoint after subtracting the background OD (lower dotted line).
Susceptibility categorization of C. auris isolates based on MICs is somewhat arbitrary, because species-specific clinical breakpoints have not yet been established. For fluconazole, non-species-specific Candida spp. breakpoints have been set by EUCAST as well as by CLSI (susceptible, ≤2 mg/liter; resistant, >4 mg/liter), and for amphotericin B a susceptibility breakpoint of ≤1 mg/liter is generally used, although this has not been formally established. When we adopted these breakpoints, our data confirmed previously published findings, suggesting that C. auris is uniformly nonsusceptible to fluconazole (2, 5, 11, 13, 23, 24) and is, in general, susceptible to amphotericin B (2, 3, 11, 23, 24). However, some surveys have reported higher amphotericin B nonsusceptibility rates. Lockhart reported an amphotericin B resistance rate of 35%, which was much higher than the rates found here (9.8% and 0% [by CLSI and EUCAST, respectively]) (5). We speculate that this is more likely due to methodologic issues, as a breakpoint of 1 mg/liter tends to bisect the wild-type population, meaning that only minor technical differences (e.g., a slight loss of amphotericin B potency, differential binding of the pure substance to the plastic trays, etc.) would significantly impact the proportion of MICs that are above the breakpoint. Of note, all but one of the ECOFF values proposed here, with the exception of the CLSI method with amphotericin B, were 2 mg/liter; applying this ECOFF, the non-wild-type rate would be 6.5% in this study and 7.4% (4/54) in the Lockhart et al. study (5), and thus the results are comparable.
For the echinocandins, a 7% resistance rate has previously been reported, based on adoption of a less stringent breakpoint of ≥8 mg/liter for the echinocandins (5). We found echinocandin resistance at the same level when we adopted ≥2, 4, or 8 mg/liter for the anidulafungin and micafungin CLSI testing, and also for EUCAST when we applied ≥4 mg/liter for anidulafungin and ≥0.5, 1, 2, or 4 mg/liter for micafungin; resistant isolates were clearly separated from the main population, suggesting that these isolates harbor significant resistance alterations. Adopting the 0.25 mg/liter ECOFF proposed by the statistical methods and the derivatization method, a significant proportion of the isolates would be deemed non-wild type for anidulafungin (23.6% by CLSI and 26.8% by EUCAST). In contrast, the same frequency (for non-wild type) with micafungin would be 8.1% and 6.5%. It is generally accepted that resistance to the echinocandins is drug class specific, and we believe this discrepancy is caused by the variability in anidulafungin MIC determinations associated with the less-steep growth curves (Fig. 1). Of note, both echinocandin MIC distributions were unimodal, suggesting a low rate of non-wild-type isolates, which would be expected among isolates from India, where these drugs, due to cost issues, are infrequently prescribed.
For itraconazole, voriconazole, posaconazole, and isavuconazole, wide and bi- or trimodal distributions were observed. In general, more than one peak in an MIC distribution may reflect (i) that the isolates belong to more than one species, (ii) use of a poor susceptibility test, or (iii) that a significant proportion of the isolates are not wild-type isolates. Indeed, mixed C. auris and C. glabrata cultures were found initially, but pure cultures were employed followed by repeated testing and molecular identification, ensuring that the presented data strictly represent C. auris. Notably, wide and bi- or trimodal distributions were found for both EUCAST and CLSI methods, although these methods were performed independently in two laboratories experienced in antifungal susceptibility testing. Moreover, azole MIC distributions also spanned 5 to 10 dilutions in a recent study of 54 isolates tested using the CLSI methodology (5). Therefore, it is less likely that the findings can be explained by poor conduct of the testing. In contrast, the possibility that the strain collection is a mix of isolates, with wild-type and non-wild-type susceptibility to the azoles, appears more likely. Lockhart et al. investigated the ERG11 gene among C. auris isolates from three continents and found various alterations corresponding to well-known azole hot spots within the genome of C. albicans, including Y132F, K143R, and F126T in the vast majority of isolates (5). Isolates from South Africa and Venezuela were clonal, and all shared the same erg alteration (F126T in South Africa and Y132F in Venezuela), but the erg11 sequences from Indian isolates included the wild type, the Y132F or the K143R erg11-encoded amino acid sequences, although they were otherwise clonal. Moreover, Ben-Ami et al. demonstrated enhanced ABC-type efflux activity compared to that of C. glabrata, a finding that is in keeping with the multiple ABC- and multidrug resistance-type transporter-encoding genes found in its genome and which suggests that drug efflux may also contribute to azole resistance in C. auris (8, 25). In other Candida species, several azole resistance mechanisms often act in concert, which may lead to different degrees of MIC elevations, depending on the combination of mutations, expression of efflux pumps, target gene upregulation, etc. (26–28). It is currently unknown if this is also the case for these C. auris strains. In such a scenario, bi- and trimodal distributions, as found here, are to be expected. Moreover, if such isolates form the majority of the isolates in a data set, this may lead to a modal MIC representing mutant rather than wild-type isolates per se. In other words, what is perceived as the main population is in fact non-wild type, and any attempt to establish an ECOFF may be an overestimate of the ECOFF for the true wild-type population. A rule of thumb is that the ECOFF for a standard MIC distribution is two 2-fold dilutions higher than the peak of the distribution. Applying this rule on the azole distributions presented here and using the lowest MIC peak would led to ECOFFs that are several 2-fold dilutions below the ones suggested by the various statistical methods and to a lesser degree the dECOFF method. For example, this would have resulted in an ECOFF of 0.5 mg/liter for both CLSI and EUCAST voriconazole MICs rather than the 1 to 32 mg/liter with the CLSI method and 2 to 8 mg/liter with the EUCAST statistical methods.
The traditional method for determining the ECOFF is a visual inspection of MIC histograms and determination of where the wild-type MICs end and the in vitro resistant isolates begin. This method has rightfully been criticized for lacking objectivity and reproducibility, which is particularly true when there is a significant overlap between wild-type and resistant populations. For this reason, statistical methods for determination of ECOFFs have been developed, and a EUCAST discussion document recently released stated that an ECOFF is only to be set when the visual and statistical ECOFFs are no more than one 2-fold dilution apart (http://www.eucast.org/documents/consultations/). The dECOFF mathematical method is based on derivatization of an MIC frequency distribution and calculation of second derivatives and has the advantage of being able to define ECOFFs also for truncated, nonsymmetrical, or multimodal distributions, as seen here for C. auris and amphotericin B with the EUCAST method. In the setting of unimodal wild-type distributions, such as those for amphotericin B, anidulafungin, and micafungin, results with all methods were in agreement, whereas this was not always the case for the azoles, where the visual inspections suggested isolates with mixed susceptibilities might be present. The wild-type distribution in most cases will include 99% of the isolates (http://www.eucast.org/documents/consultations/). This holds true for most drugs, except itraconazole, voriconazole, and isavuconazole, where the eyeball ECOFFs and dECOFFs are lower than the statistical 99% ECOFFs, in line with the hypothesis that this C. auris strain collection contains a significant proportion of isolates that are in fact non-wild type in terms of azole drug susceptibility. Thus, this study supports the notion of requiring visual as well as statistical/mathematical determinations, but we showed no clear advantage of one nonvisual method over another, except that the derivatization method provided more conservative dECOFFs for the compounds against which acquired resistance may be a common feature. Of note, the ECOFFs presented in this study are based on single MIC data for Indian isolates (EUCAST MICs performed in Denmark and CLSI MICs determined in India). For official EUCAST ECOFF/CLSI epidemiological cutoff value determinations, more data from individual laboratories are required, and caution should be taken to avoid overrepresentation of clonal isolates.
In conclusion, we have presented here a direct comparison of EUCAST and CLSI MIC testing methods for a comprehensive C. auris isolate collection. Our findings highlight (a) the uniform fluconazole resistance, (b) a variable susceptibility to the other azoles, potentially due to variable breakpoints being applied but also that the isolates may be a mix of wild type and resistant mutants, and (c) a low acquired resistance rate to amphotericin B and the echinocandins. However, molecular characterization of underlying resistance mechanisms beyond erg11 sequencing is warranted, as are clinical outcome data for wild-type and mutant isolates, in order to establish future clinical breakpoints.
MATERIALS AND METHODS
Fungal isolates.
A total of 123 clinical isolates of C. auris were collected from individual patients in 6 tertiary care hospitals in India from 2010 to 2015. The isolates were mainly from patients with candidemia (blood; n = 100); other specimens (n = 23) from invasive Candida infections included those from tissue, pleural fluid, and a single isolate from pus.
Species identification.
The isolates were subjected to sequencing of the internal transcribed spacer (ITS) region of the ribosomal subunit as described previously, followed by GenBank basic local alignment search tool (BLAST) pairwise sequence alignment (http://www.ncbi.nlm.nih.gov/BLAST/Blast.cgi) (5). Furthermore, all isolates were also identified by using matrix-assisted laser desorption ionization–time of flight mass spectrometry (MALDI-TOF MS) analysis (Bruker Daltonics, Bremen, Germany). Briefly, isolates were subcultured on Sabouraud dextrose agar for 24 h at 37°C. The ethanol-formic acid extraction procedure was performed according to the manufacturer's protocol for the identification of yeast isolates (2, 5). The spectra were analyzed using the Flex Control 3.1 software (Bruker Daltonics, Inc., Billerica, MA, USA) and MALDI Biotyper OC version 3.1 (Bruker Daltonics, Bremen, Germany). The isolates were identified as C. auris when the score was >2 against the C. auris database (in-house and Bruker Daltonics) (2, 5).
Antifungal susceptibility testing.
CLSI and EUCAST antifungal susceptibility testing (AFST) was performed according to the M27-A3/S4 and E.Def 7.3 guidelines (20, 29). MIC testing was performed once but repeated for 10% of the isolates with aberrant inhibition curves or for control purposes. CLSI MIC data have previously been reported for 90/123 isolates (13). Antifungals tested (with sources for the pure substances given in parentheses for CLSI/EUCAST) included the following: amphotericin B (AMB; Sigma, St. Louis, MO, USA/Sigma-Aldrich, Brøndby, Denmark), fluconazole (FLC; Pfizer, Groton, CT, USA/Sigma-Aldrich, Brøndby, Denmark), itraconazole (ITC; Lee Pharma, Hyderabad, India/Sigma-Aldrich, Brøndby, Denmark), voriconazole (VRC; Pfizer, Groton, CT, USA/Pfizer A/S, Ballerup, Denmark), posaconazole (PSC; Merck, Whitehouse Station, NJ, USA), isavuconazole (ISC; Basilea Pharmaceutica, Basel, Switzerland), micafungin (MFG; Astellas, Toyama, Japan), anidulafungin (AFG; Pfizer/Pfizer A/S, Ballerup, Denmark). Drug-free and yeast-free controls were included, and microtiter plates were incubated at 35°C and read visually for the CLSI method and spectrophotometrically (OD at 530 nm) for the EUCAST method after 24 h (20, 29–31). The recommended Candida krusei ATCC 6258 and Candida parapsilosis ATCC 22019 strains were used as quality control strains. The MIC endpoints for azoles and echinocandins were defined as the lowest drug concentration that caused a prominent decrease in visual growth (CLSI) or a reduction to ≤50% of growth (EUCAST) in relation to the controls. For AMB, the MIC was defined as the lowest concentration at which there was full inhibition of visual growth (CLSI) or a reduction to ≤10% of growth (EUCAST) relative to the drug-free control wells.
Comparisons between CLSI and EUCAST results.
The modal MICs (the most commonly reported MIC), GM MICs with 95% CIs, MIC50, MIC90, and ranges were calculated using Prism version 6.00 (GraphPad Software). High off-scale EUCAST MIC results were converted to the next highest concentration, and low off-scale MIC results were left unchanged for comparisons between the two methods. Any statistical differences between GM MIC values obtained by the CLSI and EUCAST methods were investigated using repeated-measures ANOVA on log2 MICs followed by Bonferroni's multiple-comparison test (significance, P < 0.05). Correlations between EUCAST and CLSI log2 MICs were determined via Pearson analysis for the data for each drug. The percentages of absolute (±0 2-fold dilutions) and essential agreement (±1 and ±2 2-fold dilutions) between the EUCAST and the CLSI methods were calculated for each compound.
ECOFF determinations.
ECOFFs are defined as the highest MIC value of the wild-type distribution. The conventional method for determining ECOFFs that might define where wild-type MICs end and in vitro resistant isolates begin is visual inspection of histograms of the MICs for single species (the eyeball method) (21). Additionally, ECOFFs were determined statistically using 95%, 97.5%, and 99% endpoints and the ECOFF Finder program (21), the MicDat1.23 software (Medimatics, Maastricht, Netherlands), and finally using the derivatization method (dECOFFs) by calculating the numerical second derivative at each MIC of the MIC distribution (Prism 4.0; GraphPad Software, San Diego, CA) (22). The second derivative describes the change of the steepness of the MIC distribution function at each MIC. The MICs within the two largest maximum second derivatives of an MIC distribution represent the wild-type distribution, and therefore the upper MIC corresponds to the dECOFF.
ACKNOWLEDGMENTS
We thank Birgit Brandt for excellent technical assistance.
C.S. is supported by a University Grants Commission, India, research fellowship (F.2-15/2003 SA-I).
We declare no conflicts of interest with respect to the current study. Outside this study, M.C.A. has received research grants from Amplyx, Astellas, Basilea, Gilead, and F2G and has received speaker honoraria from Astellas, Basilea, Gilead, MSD, Novartis, and Pfizer over the past 5 years. J.M. has received research grants from Astellas, Gilead, Pfizer, and MSD. C.S., A.P., and A.C. have no potential conflicts to declare.
REFERENCES
- 1.Satoh K, Makimura K, Hasumi Y, Nishiyama Y, Uchida K, Yamaguchi H. 2009. Candida auris sp. nov., a novel ascomycetous yeast isolated from the external ear canal of an inpatient in a Japanese hospital. Microbiol Immunol 53:41–44. doi: 10.1111/j.1348-0421.2008.00083.x. [DOI] [PubMed] [Google Scholar]
- 2.Magobo RE, Corcoran C, Seetharam S, Govender NP. 2014. Candida auris-associated candidemia, South Africa. Emerg Infect Dis 20:1250–1251. doi: 10.3201/eid2007.131765. [DOI] [PMC free article] [PubMed] [Google Scholar]
- 3.Lee WG, Shin JH, Uh Y, Kang MG, Kim SH, Park KH, Jang HC. 2011. First three reported cases of nosocomial fungemia caused by Candida auris. J Clin Microbiol 49:3139–3142. doi: 10.1128/JCM.00319-11. [DOI] [PMC free article] [PubMed] [Google Scholar]
- 4.Calvo B, Melo ASA, Perozo-Mena A, Hernandez M, Francisco EC, Hagen F, Meis JF, Colombo AL. 2016. First report of Candida auris in America: clinical and microbiological aspects of 18 episodes of candidemia. J Infect 73:369–374. doi: 10.1016/j.jinf.2016.07.008. [DOI] [PubMed] [Google Scholar]
- 5.Lockhart SR, Etienne KA, Vallabhaneni S, Farooqi J, Chowdhary A, Govender NP, Colombo AL, Calvo B, Cuomo CA, Desjardins CA, Berkow EL, Castanheira M, Magobo RE, Jabeen K, Asghar RJ, Meis JF, Jackson B, Chiller T, Litvintseva AP. 2017. Simultaneous emergence of multidrug-resistant Candida auris on 3 continents confirmed by whole-genome sequencing and epidemiological analyses. Clin Infect Dis 64:134–140. doi: 10.1093/cid/ciw691. [DOI] [PMC free article] [PubMed] [Google Scholar]
- 6.Public Health England. 2016. Candida auris identified in England. Public Health England, London, England: https://www.gov.uk/government/publications/candida-auris-emergence-in-england/candida-auris-identified-in-england. [Google Scholar]
- 7.Chowdhary A, Voss A, Meis JF. 2016. Multidrug-resistant Candida auris: “new kid on the block” in hospital-associated infections? J Hosp Infect 94:209–212. doi: 10.1016/j.jhin.2016.08.004. [DOI] [PubMed] [Google Scholar]
- 8.Ben-Ami R, Berman J, Novikov A, Bash E, Shachor-Meyouhas Y, Zakin S, Maor Y, Tarabia J, Schechner V, Adler A, Finn T. 23 February 2017. Multidrug-resistant Candida haemulonii and C. auris, Tel Aviv, Israel. Emerg Infect Dis doi: 10.3201/eid2302.161486. [DOI] [PMC free article] [PubMed] [Google Scholar]
- 9.Rudramurthy SM, Chakrabarti A, Paul RA, Sood P, Kaur H, Capoor MR, Kindo AJ, Marak RSK, Arora A, Sardana R, Das S, Chhina D, Patel A, Xess I, Tarai B, Singh P, Ghosh A. 20 February 2017. Candida auris candidaemia in Indian ICUs: analysis of risk factors. J Antimicrob Chemother doi: 10.1093/jac/dkx034. [DOI] [PubMed] [Google Scholar]
- 10.European Centre for Disease Prevention and Control. 2016. Candida auris in healthcare settings, Europe, 19 December 2016. ECDC, Stockholm, Sweden. [Google Scholar]
- 11.Chowdhary A, Sharma C, Duggal S, Agarwal K, Prakash A, Singh PK, Jain S, Kathuria S, Randhawa HS, Hagen F, Meis JF. 2013. New clonal strain of Candida auris, Delhi, India. Emerg Infect Dis 19:1670–1673. doi: 10.3201/eid1910.130393. [DOI] [PMC free article] [PubMed] [Google Scholar]
- 12.Centers for Disease Control and Prevention. 2017. Candida auris. CDC, Atlanta, GA: https://www.cdc.gov/fungal/diseases/candidiasis/candida-auris.html. [Google Scholar]
- 13.Kathuria S, Singh PK, Sharma C, Prakash A, Masih A, Kumar A, Meis JF, Chowdhary A. 2015. Multidrug-resistant Candida auris misidentified as Candida haemulonii: characterization by matrix-assisted laser desorption ionization–time of flight mass spectrometry and DNA sequencing and its antifungal susceptibility profile variability by Vitek 2, CLSI broth microdilution, and Etest method. J Clin Microbiol 53:1823–1830. doi: 10.1128/JCM.00367-15. [DOI] [PMC free article] [PubMed] [Google Scholar]
- 14.Chowdhary A, Anil Kumar V, Sharma C, Prakash A, Agarwal K, Babu R, Dinesh KR, Karim S, Singh SK, Hagen F, Meis JF. 2014. Multidrug-resistant endemic clonal strain of Candida auris in India. Eur J Clin Microbiol Infect Dis 33:919–926. doi: 10.1007/s10096-013-2027-1. [DOI] [PubMed] [Google Scholar]
- 15.Prakash A, Sharma C, Singh A, Kumar Singh P, Kumar A, Hagen F, Govender NP, Colombo AL, Meis JF, Chowdhary A. 2016. Evidence of genotypic diversity among Candida auris isolates by multilocus sequence typing, matrix-assisted laser desorption ionization time-of-flight mass spectrometry and amplified fragment length polymorphism. Clin Microbiol Infect 22:277.e1–e9. doi: 10.1016/j.cmi.2015.10.022. [DOI] [PubMed] [Google Scholar]
- 16.Shin JH, Kim M-N, Jang SJ, Ju MY, Kim SH, Shin MG, Suh SP, Ryang DW. 2012. Detection of amphotericin B resistance in Candida haemulonii and closely related species by use of the Etest, Vitek-2 yeast susceptibility system, and CLSI and EUCAST broth microdilution methods. J Clin Microbiol 50:1852–1855. doi: 10.1128/JCM.06440-11. [DOI] [PMC free article] [PubMed] [Google Scholar]
- 17.Arendrup MC, Garcia-Effron G, Lass-Flörl C, Lopez AG, Rodriguez-Tudela J-L, Cuenca-Estrella M, Perlin DS. 2010. Echinocandin susceptibility testing of Candida species: comparison of EUCAST EDef 7.1, CLSI M27-A3, Etest, disk diffusion, and agar dilution methods with RPMI and IsoSensitest media. Antimicrob Agents Chemother 54:426–439. doi: 10.1128/AAC.01256-09. [DOI] [PMC free article] [PubMed] [Google Scholar]
- 18.Pfaller MA, Castanheira M, Messer SA, Rhomberg PR, Jones RN. 2014. Comparison of EUCAST and CLSI broth microdilution methods for the susceptibility testing of 10 systemically active antifungal agents when tested against Candida spp. Diagn Microbiol Infect Dis 79:198–204. doi: 10.1016/j.diagmicrobio.2014.03.004. [DOI] [PubMed] [Google Scholar]
- 19.Arendrup MC, Meletiadis J, Mouton JW, Guinea J, Cuenca-Estrella M, Lagrou K, Howard SJ. 2016. EUCAST technical note on isavuconazole breakpoints for Aspergillus, itraconazole breakpoints for Candida and updates for the antifungal susceptibility testing method documents. Clin Microbiol Infect 22:571.e1–4. doi: 10.1016/j.cmi.2016.01.017. [DOI] [PubMed] [Google Scholar]
- 20.Clinical and Laboratory Standards Institute. 2008. Reference method for broth dilution antifungal susceptibility testing of yeasts; third information supplement. CLSI document M27-A3. CLSI, Wayne, PA. [Google Scholar]
- 21.Turnidge J, Kahlmeter G, Kronvall G. 2006. Statistical characterisation of bacterial wild-type MIC value distributions and the determination of epidemiological cut-off values. Clin Microbiol Infect 12:418–425. doi: 10.1111/j.1469-0691.2006.01377.x. [DOI] [PubMed] [Google Scholar]
- 22.Meletiadis J, Curfs-Breuker I, Meis JF, Mouton JW. 2017. In vitro antifungal susceptibility testing of Candida isolates with the EUCAST methodology, a new method for ECOFF determination. Antimicrob Agents Chemother 61:e02372-16. doi: 10.1128/AAC.02372-16. [DOI] [PMC free article] [PubMed] [Google Scholar]
- 23.Emara M, Ahmad S, Khan Z, Joseph L, Al-Obaid I, Purohit P, Bafna R. 2015. Candida auris candidemia in Kuwait, 2014. Emerg Infect Dis 21:1091–1092. doi: 10.3201/eid2106.150270. [DOI] [PMC free article] [PubMed] [Google Scholar]
- 24.Ruiz Gaitán AC, Moret A, López Hontangas JL, Molina JM, Aleixandre López AI, Cabezas AH, Mollar Maseres J, Arcas RC, Gómez Ruiz MD, Chiveli MÁ Cantón E, Pemán J. 2017. Nosocomial fungemia by Candida auris: first four reported cases in continental Europe. Rev Iberoam Micol 34:23–27. doi: 10.1016/j.riam.2016.11.002. [DOI] [PubMed] [Google Scholar]
- 25.Chatterjee S, Alampalli SV, Nageshan RK, Chettiar ST, Joshi S, Tatu US. 2015. Draft genome of a commonly misdiagnosed multidrug resistant pathogen Candida auris. BMC Genomics 16:686. doi: 10.1186/s12864-015-1863-z. [DOI] [PMC free article] [PubMed] [Google Scholar]
- 26.Jensen RH, Astvad KMT, Silva LV, Sanglard D, Jørgensen R, Nielsen KF, Mathiasen EG, Doroudian G, Perlin DS, Arendrup MC. 2015. Stepwise emergence of azole, echinocandin and amphotericin B multidrug resistance in vivo in Candida albicans orchestrated by multiple genetic alterations. J Antimicrob Chemother 70:2551–2555. doi: 10.1093/jac/dkv140. [DOI] [PMC free article] [PubMed] [Google Scholar]
- 27.Perlin DS, Shor E, Zhao Y. 2015. Update on antifungal drug resistance. Curr Clin Microbiol Rep 2:84–95. doi: 10.1007/s40588-015-0015-1. [DOI] [PMC free article] [PubMed] [Google Scholar]
- 28.Morio F, Loge C, Besse B, Hennequin C, Le Pape P. 2010. Screening for amino acid substitutions in the Candida albicans Erg11 protein of azole-susceptible and azole-resistant clinical isolates: new substitutions and a review of the literature. Diagn Microbiol Infect Dis 66:373–384. doi: 10.1016/j.diagmicrobio.2009.11.006. [DOI] [PubMed] [Google Scholar]
- 29.Arendrup MC, Cuenca-Estrella M, Lass-Flörl C, Hope WW, European Committee on Antimicrobial Susceptibility Testing Subcommittee on Antifungal Susceptibility Testing. 2012. EUCAST technical note on Aspergillus and amphotericin B, itraconazole, and posaconazole. Clin Microbiol Infect 18:E248–E50. doi: 10.1111/j.1469-0691.2012.03890.x. [DOI] [PubMed] [Google Scholar]
- 30.Pfaller MA, Boyken LB, Hollis RJ, Kroeger J, Messer SA, Tendolkar S, Diekema DJ. 2008. Validation of 24-hour fluconazole MIC readings versus the CLSI 48-hour broth microdilution reference method: results from a global Candida antifungal surveillance program. J Clin Microbiol 46:3585–3590. doi: 10.1128/JCM.01391-08. [DOI] [PMC free article] [PubMed] [Google Scholar]
- 31.Pfaller MA, Boyken LB, Hollis RJ, Kroeger J, Messer SA, Tendolkar S, Diekema DJ. 2011. Validation of 24-hour posaconazole and voriconazole MIC readings versus the CLSI 48-hour broth microdilution reference method: application of epidemiological cutoff values to results from a global Candida antifungal surveillance program. J Clin Microbiol 49:1274–1279. doi: 10.1128/JCM.02437-10. [DOI] [PMC free article] [PubMed] [Google Scholar]