

Abstract
Given that the majority of multi-exon genes generate diverse functional products, it is important to evaluate expression at the isoform level. Previous studies have demonstrated strong gene-level correlations between RNA sequencing (RNA-seq) and microarray platforms, but have not studied their concordance at the isoform level. We performed transcript abundance estimation on raw RNA-seq and exon-array expression profiles available for common glioblastoma multiforme samples from The Cancer Genome Atlas using different analysis pipelines, and compared both the isoform- and gene-level expression estimates between programs and platforms. The results showed better concordance between RNA-seq/exon-array and reverse transcription-quantitative polymerase chain reaction (RT-qPCR) platforms for fold change estimates than for raw abundance estimates, suggesting that fold change normalization against a control is an important step for integrating expression data across platforms. Based on RT-qPCR validations, eXpress and Multi-Mapping Bayesian Gene eXpression (MMBGX) programs achieved the best performance for RNA-seq and exon-array platforms, respectively, for deriving the isoform-level fold change values. While eXpress achieved the highest correlation with the RT-qPCR and exon-array (MMBGX) results overall, RSEM was more highly correlated with MMBGX for the subset of transcripts that are highly variable across the samples. eXpress appears to be most successful in discriminating lowly expressed transcripts, but IsoformEx and RSEM correlate more strongly with MMBGX for highly expressed transcripts. The results also reinforce how potentially important isoform-level expression changes can be masked by gene-level estimates, and demonstrate that exon arrays yield comparable results to RNA-seq for evaluating isoform-level expression changes.
Keywords: RNA-seq, Exon-array, gene expression, alternative splicing, isoform-level expression, cross-platform integration
With each successive discovery in genetics, the true dynamic complexity of the genome has become increasingly apparent, requiring relatively consistent updates to the technical definition of the word ‘gene’ [1]. It is now understood that the majority of human genes produce multiple functional products, or isoforms, primarily through alternative transcription and splicing [2–4]. Different isoforms within the same gene have been shown to participate in different functional pathways [5], and the altered expression of specific isoforms have been associated with numerous diseases [6–10]. Therefore, gene expression studies should strive to evaluate expression at the isoform level or risk ignoring important dynamics that are not discernible at lower resolutions of gene expression. Practically speaking, however, accurately estimating isoform expression is a much more difficult enterprise than quantifying aggregate gene expression, owing to significant sequence fragment ambiguity in overlapping regions between alternative isoforms. Several technology platforms exist for measuring isoform expression, including RNA sequencing (RNA-seq), exon arrays and reverse transcription-quantitative polymerase chain reaction (RT-qPCR) and a litany of analysis tools have been developed that take different probabilistic approaches to ambiguous fragment assignment. Because there are strengths and biases associated with each of these platforms and pipelines, and the robustness of biological study results increases with the inclusion of more microarray and RNA-seq data sets [11, 12], better understanding how isoform expression estimates relate between them could inform future data integration strategies, leading to improvements in the reliability of expression results and the ability to detect various genetic aberrations.
In particular, we are interested in understanding the correlations between RNA-seq and exon-array isoform expression data in humans and their concordance with RT-qPCR measurements depending on the analysis software used. Previous studies have demonstrated strong gene-level correlations between RNA-seq and microarray expression platforms [13–23], but have not studied their relationship at the isoform level.
To assess the correlations between platforms at the isoform level, we performed transcript abundance estimation on raw RNA-seq and exon-array expression profiles from common samples in The Cancer Genome Atlas (TCGA) using a number of exon-array and RNA-seq analysis programs. Abundance estimates were correlated between platforms for each sample, and the results were also compared against RT-qPCR results for a subset of transcripts in glioblastoma multiforme (GBM).
Methods
TCGA data
The study uses 102 GBM tumor and 4 normal brain (organ-specific control) samples from TCGA (http://cancergenome.nih.gov), in which both RNA-seq and exon-array transcriptome quantification were performed (Supplementary Table S1). A subset of 20 lung squamous cell carcinoma (LUSC) tumor-tissue samples from TCGA (Supplementary Table S2) was used for validation of relative expression correlations. The raw expression files, downloaded from the Cancer Genomics Hub (https://cghub.ucsc.edu/), were used as the starting point for all subsequent analyses.
Exon-array transcript abundance estimation
A number of algorithms are available for quantifying individual isoform abundance from exon-array data. Three such programs were tested on the TCGA exon-array data: the Multi-Mapping Bayesian Gene eXpression (MMBGX) method [24], the puma R/Bioconductor package [25] and the Multiple Exon Array Preprocessing (MEAP) method [26]. Each of these algorithms has shown better performance than two other popular tools, PILER and RMA, in their respective studies. Furthermore, these three methods were preferred for their ability to resolve both gene and isoform transcript abundances from exon-array data. Transcripts were quantified according to the Ensembl 70 (GRCh37.p8) reference annotation. Refer to Supplementary Table S3 for version information and execution parameters.
RNA-seq transcript abundance estimation
Reads were aligned and quantified according to the Ensembl 70 (GRCh37.p8) reference annotation. RNA-seq transcript abundances were estimated using the following tools: TopHat/Cufflinks [27], RSEM [28], eXpress [29], Sailfish [30], Salmon [31], Kallisto [32] and IsoformEx [33]. Genome/transcriptome alignments were made using Bowtie2 [34] with paired-end reads, except for IsoformEx, for which Bowtie [35] and only one end of each paired-end read were used. The tools were nearly exclusively run according to their default parameters—refer to Supplementary Table S4 for version and additional parameter information. Although some tools offer additional bias correction options, such options have been shown to have minimal effects on the overall accuracy of abundance estimates [36]. Gene-level estimates were calculated by summing their individual isoform abundances according to Ensembl 70. Because each analysis tool resolves a different number of transcripts for a given sample, abundance estimates must be normalized between tools to generate comparable values. Each output was therefore adjusted as
where T represents the subset of transcripts resolved by all of the programs for a given sample. The geometric means from the four control samples were used as control expression values for calculating fold change. The control values were normalized to each tumor sample according to the corresponding T for better visual approximation of fold change, but because it should not be assumed that the total relative abundance for these subsets are necessarily stable between samples, when determining differential expression, effective read counts and Fragments Per Kilobase Million (FPKM) values adjusted according to Trimmed Mean of M-values (TMM) normalization [37] were used instead. TPMadj values less than 0.001 were discarded as noise (Supplementary Figure S1). Abundance estimates from each program were compared against one another in terms of the number of commonly resolved transcripts and their relative expression estimates. IsoformEx was not evaluated on the LUSC validation data set.
RT-qPCR analysis
The GBM tissue collection, RNA isolation, transcript selection, assay design and RT-qPCR analysis were performed as previously described by Pal et al. [38]. The transcripts included in the RT-qPCR analysis represent the most reliably quantified set of isoforms among those most discriminative between GBM molecular subtypes (neural, proneural, mesenchymal and classical). Despite the superior sensitivity and specificity offered by RT-qPCR, producing highly sensitive splice-specific primers for RT-qPCR can be a challenge [39, 40]. Because isoform specificity was limited for corresponding commercially available TaqMan chemistry-based qPCR assays, care was taken to avoid assays that co-detect transcripts showing low or negative correlation in GBM expression [38].
Expression and fold change correlation analysis
Sample-by-sample correlations between RNA-seq and exon-array estimates were evaluated using Spearman’s correlation (rS) for each RNA-seq analysis program against MMBGX. Spearman’s correlation was preferred to Pearson’s correlation to reduce bias between platforms and diminish the effect of RNA-seq outliers. A subset of MMBGX estimates (4.3% of isoforms, 1.4% of genes) featured combinations of transcripts (e.g. ENST00000025008 + ENST00000435644) from which independent abundances could not be accurately disaggregated. For these results, corresponding combinations were created in the RNA-seq data by linearly summing the abundance estimates for each transcript. For RT-qPCR correlations, TPMadj expression estimates were further normalized by POLR2A expression, which was used as an endogenous control for the RT-qPCR analysis.
Differential expression analysis
Differential gene and isoform expression between tumor and normal samples was determined using the limma R/Bioconductor package [41] on the MMBGX and eXpress results. Differential expression was selected based on fold changes >2.0 and an false discovery rate (FDR)-adjusted p value threshold of 0.05. Estimated transcript counts from RNA-seq were first normalized using TMM normalization [37], and transformed using the voom method [42]. Transcripts with average counts fewer than one per sample were excluded. All 102 tumor samples and 4 organ-specific controls were included in the analysis. Differential expression results from exon array and RNA-seq were then compared to evaluate consistency between platforms in identifying differentially expressed (DE) genes and isoforms. To assess the extent to which isoform-level transcript dynamics are masked at the gene level, genes containing both significantly up- and downregulated isoforms were identified and similarly evaluated.
Results
Exon-array abundance estimation
Gene and isoform abundance estimates were generated from the TCGA GBM exon-array data using the MMBGX method [24], the puma R/Bioconductor package [25] and the MEAP method [26]. The mean expression estimates across all samples were compared with the RT-qPCR data (Supplementary Table S5). While the MEAP results demonstrated the strongest numerical concordance with corresponding RT-qPCR measurements (Spearman rank coefficient, rS = 0.851), it substantially underperformed the other programs in terms of the number of transcripts that were resolved (n = 56 027–56 262). The puma package resolved 121 741 transcripts per sample, and had a relatively low Spearman correlation with RT-qPCR (rS = 0.727). Because MMBGX provided a strong correlation with RT-qPCR (rS= 0.836), quantified the greatest number of transcripts per sample (n = 179 071) and yielded expression distributions that accorded well with those from RNA-seq, it was selected as the tool to be used for the remainder of the study when comparing exon-array results with various RNA-seq expression estimates.
RNA-seq abundance estimation
Transcript abundance estimates were also generated from the TCGA GBM RNA-seq data using the TopHat/Cufflinks [27], RSEM [28], eXpress [29], Sailfish [30], Salmon [31], Kallisto [32] and IsoformEx [33] analysis pipelines. Although each program’s results were limited to the same reference annotation, each method resolved a different number of transcripts per sample (Table 1). Both the number of commonly resolved isoforms and the expression correlations between programs vary significantly, ranging from 58664 to 148026 transcripts and from 0.52 to 0.94, respectively. eXpress resolved the greatest number of transcripts per sample. While RSEM, Kallisto and Cufflinks showed strong correlations among them (rS ≥ 0.9), the other four programs were correlated only moderately (rS = 0.52–0.79).
Table 1.
Correlations between RNA-seq abundance estimates
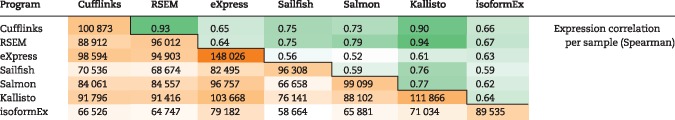 |
Number of overlapping resolved isoforms per sample.
Expression estimates from each of the tested RNA-seq quantification methods were compared with one another. The number of resolved transcripts shared between each pair of methods is shown in the lower-left. The Spearman correlation between each pair of methods is shown in the upper right.
Comparison of gene and isoform expression profiles between platforms
The gene-level expression correlations between RNA-seq and exon-array estimates (MMBGX) observed in this study (median rS = 0.72–0.78) accord with results from previous studies that compared RNA-seq with microarrays [14–20]. For isoform expression estimates, poor correlations were found between RNA-seq and exon array compared with gene-level correlations (Figure 1). The fold change correlations for isoforms were relatively stronger than those for raw expression. At the gene level, however, fold change correlations were lower than expression correlations. This can be primarily attributed to lowly expressed genes with fewer transcripts—when the gene expression results were filtered to exclude lowly expressed genes, then both the expression and fold change correlations improved significantly, with the fold change correlations exceeding the raw expression correlations (Supplementary Figure S2).
Figure 1.

Scatter plots of average expression and fold change (tumor versus normal) estimates between exon array and RNA-seq at both gene and isoform levels. Normalized expression estimates were averaged across samples for each program. RNA-seq estimates were then averaged across programs. Transcripts that were not resolved by a majority of RNA-seq programs were excluded. Transcripts with an average expression TPMadj < log2(0.001) were considered to be not expressed.
In terms of overall isoform-level correlation with MMBGX results, the RNA-seq analysis tools performed fairly consistently, with median correlations ranging from 0.41 to 0.48 rS for raw expression and from 0.40 to 50 rS for fold change values (Figure 2A). Consistent raw expression correlations with an identical relative order between RNA-seq programs were observed using LUSC data (Supplementary Figure S3). eXpress yielded the strongest overall expression and fold-change correlations with MMBGX and resolved the greatest number of common transcripts (Figure 2B). This relatively strong concordance between eXpress and MMBGX appears to be driven by associated, lowly expressed transcripts. While the least abundant quartile of isoforms estimated by eXpress correlated extremely well with MMBGX relative to those of other RNA-seq tools, the most abundant quartile of isoforms from every other program correlated more strongly with MMBGX than did eXpress (Figure 2C). When considering only the most variable set of isoforms, as is sometimes done when selecting relevant genes for cancer subtype identification, correlations between platforms improve dramatically, with eXpress providing the strongest expression correlations with MMBGX (rS = 0.54 and 0.63 for top 5% and 1% most variable isoforms, respectively) and RSEM the strongest fold change correlations (rS = 0.72 and 0.81, respectively) (Supplementary Figure S4). Interestingly, relative isoform-level correlations with MMBGX do not extend accordingly to gene-level estimates (Supplementary Figure S5). For example, while Salmon had one of the lowest average isoform expression correlations with MMBGX (rS = 0.41), it had the highest average expression correlation with MMBGX for genes (rS = 0.78) among the programs tested. Salmon appears to be the most consistent RNA-seq analysis tool in terms of its relation to MMBGX results (SD = 0.026 and 0.037 for isoform expression and fold change correlations, respectively), whereas the correlations between eXpress and MMBGX vary the most between samples (SD = 0.055 and 0.060) (Supplementary Table S6).
Figure 2.

Spearman correlation coefficients between MMBGX and different RNA-seq quantification methods. (A) Box plots summarize the distribution of individual sample correlations with MMBGX estimates according to each RNA-seq tool tested. Median correlation values are shown (n = 102). For each method, correlations were calculated for both raw expression values and fold change values relative to the normal-tissue samples. (B) Average number of commonly resolved isoforms between MMBGX and each RNA-seq method. MMBGX-only transcripts (yellow) included only if in top 50% of transcripts. (C) Correlations between MMBGX and each RNA-seq method for relatively highly expressed (75–100%) and lowly expressed (0–25%) isoforms.
Comparison of differential isoform expression calls between platforms
Because MMBGX and eXpress shared the most commonly resolved transcripts and the strongest overall expression and fold change correlations, their data were used in comparing RNA-seq and exon-array platforms in identifying differential expression between tumor and normal tissue samples. Of the nearly 149 359 transcripts resolved among all samples, roughly 10% (13 207) were consistently identified as DE by both platforms. An additional 23 841 isoforms were DE according to the RNA-seq estimates, and another 5794 isoforms were DE only in the exon-array results (Figure 3B). Therefore, only about 36% of the DE RNA-seq isoforms were also DE according to exon array, while about 70% of the DE exon-array isoforms were likewise DE in the RNA-seq results. There were 81 transcripts that were identified as DE by both platforms, but were inconsistent in terms of their direction of fold change, resulting in a consistency rate of 0.994. At the gene level, 4371 of 33 514 genes (13.0%) were similarly DE according to both platforms, with an additional 3810 genes and 1863 genes identified as DE individually by RNA-seq and exon array, respectively, and 25 genes were inconsistently DE between platforms (Figure 3A).
Figure 3.

Scatter plots of fold changes labeled according to differential expression. Average fold changes (tumor versus normal) between exon array and RNA-seq are plotted and labeled according to whether they were identified as DE. Genes/isoforms identified as DE by both platforms with consistent direction of change are plotted in green. Genes/isoforms identified as DE by only RNA-seq or exon array are plotted in blue and yellow, respectively. Genes/isoforms not identified as DE by either platform are plotted in gray. Genes/isoforms identified as DE by both platforms but with inconsistent directions of change are plotted in red. (A) Gene-level DE. (B) Isoform-level DE.
Changes in splicing patterns or utilization of alternative promoters can alter the relative isoform expression ratios for a given gene without necessarily changing the overall gene expression. To get a better sense of how much gene-level expression measurements mask changes in individual isoform expression, DE genes, with two or more DE isoforms, were counted using the eXpress and MMBGX estimates (Table 2). Although it was rare for genes to feature both significantly up- and downregulated isoforms (about 0.6% of genes identified in RNA-seq or exon array—296 total), only 24% of those genes were identified as DE, compared with the 78% of genes that were identified as DE if they had multiple DE isoforms all regulated in the same direction. Ultimately, for genes in which at least one isoform was identified as DE in RNA-seq or exon array, only about two thirds of those genes were identified as DE at the gene level.
Table 2.
Differential gene expression versus Isoform dynamics
| Platform | Genes | DEG | Genes, ≥1 DEI | DEG, ≥1 DEI | Genes, ≥2 DEI same dir. | DEG, ≥2 DEI same dir. | Genes, ≥2 DEI opp. dir. | DEG, ≥2 DEI opp. dir. |
|---|---|---|---|---|---|---|---|---|
| RNA-seq | 35 441 | 8434 | 11 921 | 8071 (67.7%) | 6353 | 5040 (79.3%) | 128 | 26 (20.3%) |
| Exon array | 49 039 | 6876 | 8560 | 5986 (69.9%) | 3379 | 2841 (84.1%) | 173 | 45 (26.0%) |
| RNA-seq ∩ Exon array | 33 514 | 4371 | 5001 | 3858 (77.1%) | 2486 | 2203 (88.6%) | 5 | 0 (0.0%) |
| RNA-seq ∪ Exon array | 50 963 | 10 939 | 15 480 | 10 199 (65.9%) | 7246 | 5678 (78.4%) | 296 | 71 (24.0%) |
Differential expression was measured in genes (DEG) with one or more DE isoforms (DEI) using the eXpress and MMBGX data, and in genes with two or more DEI according to whether or not any pairs of differentially expressed isoforms featured opposite directions of change within the same gene. The percentages describe the proportion of each category of gene called as DE.
RT-qPCR correlations
The relative abundance estimates from each RNA-seq program were compared with RT-qPCR expression measurements from a subset of 159 transcripts previously selected as GBM subtype classifiers [38] (Figure 4). All programs produced high fold change correlations with the RT-qPCR results (rS = 0.812–0.900), with eXpress demonstrating the strongest concordance with RT-qPCR (rS = 0.900). The MMBGX correlation (rS = 0.836) was comparable with those of the RNA-seq methods. However, the correlations based on expression estimates were quite low (rS = 0.115–0.424), suggesting that fold change normalization eliminated inter-platform distribution discrepancies. Fold change correlations with RT-qPCR were consistent across different levels of RT-qPCR expression for both RNA-seq and exon array (average RNA-seq rS = 0.831 and 0.816 for upper and lower quartiles of RT-qPCR expression, respectively, and MMBGX rS = 0.750 and 0.755 for respective quartiles).
Figure 4.

RT-qPCR correlations. (A) The transcripts included in RT-qPCR analysis, according to their average expression estimates from the RNA-seq and MMBGX exon-array tumor results. (B) The transcripts included in RT-qPCR analysis, according to their average fold change estimates relative to normal brain from the RNA-seq and MMBGX exon-array results. (C) The Spearman correlations and number of shared, resolved transcripts between the various programs tested and the RT-qPCR estimates.
Discussion
Since the advent of next-generation sequencing, gene expression studies have increasingly used RNA-seq to measure gene expression. RNA-seq offers several important advantages over array-based techniques. RNA-seq removes the need for prior knowledge of targeted sequences and offers single-nucleotide resolution, thereby enabling accurate identification of novel isoforms, RNA editing events, allele-specific expression, sequence variants and somatic mutations, all of which have been implicated in cancer development [43–45]. Nevertheless, microarrays are a thoroughly proven technology, and the quality of microarray data has improved significantly over the past two decades [46], including the development of exon arrays, which allow for the differentiation of gene isoforms. Arrays also remain more cost-effective than RNA-seq for standard gene expression profiling in model organisms [14, 47]. Indeed, the majority of existing and newly uploaded data in public gene expression databases such as TCGA and Gene Expression Omnibus [48] and ArrayExpress [49] are still from microarray platforms [15, 17]. Even as RNA-seq surpasses arrays in terms of routine use, the trove of array-based data remains a valuable investment that can be used to compliment new sequencing-based expression studies, particularly because an ideal method of validation remains elusive.
Indeed, a primary challenge in evaluating expression quantification methods is the difficulty of benchmarking on real data, as one cannot know the true abundances of endogenous transcripts. RT-qPCR still serves as the gold-standard method for validating sequencing and array results, although its results can be inconsistent [50, 51]. In this study, certain programs outperformed others in terms of their correspondence with the RT-qPCR results, but the differences were not substantial, and our RT-qPCR subset, despite being highly relevant in GBM, represents only a relatively small sampling of transcripts. The results may therefore change if a different subset of isoforms were selected.
Furthermore, the relative performance of the programs evaluated herein changed significantly according to the criteria being evaluated. eXpress was the most highly correlated with the RT-qPCR and MMBGX results overall, but RSEM was more highly correlated with MMBGX for changes in highly variable transcripts. eXpress appears to be most successful in discriminating lowly expressed transcripts, but IsoformEx and RSEM correlate more strongly with MMBGX for highly expressed transcripts. The relative isoform-level correlations between platforms were also not extended accordingly to gene-level correlations, in which RSEM and Salmon featured the strongest concordance with MMBGX. Ultimately, results like these are exemplary of why it is dubious to declare any existing program as the ‘best’, as they appear to feature different strengths and weakness that call for consideration on a study-by-study basis according to an investigator’s aims. Certainly, if computational resources are a concern, Sailfish, Salmon and Kallisto are in a class of their own relative to the other programs in this study [30–32, 36].
While there are many cancer types in TCGA, only three—GBM, ovarian serous cystadenocarcinoma (OV) and LUSC—feature both exon-array and RNA-seq data. Moreover, GBM is the only tumor type that features same normal (organ-specific control) samples simultaneously quantified by both RNA-seq and exon array in TCGA. We, therefore, choose GBM for this study. The relative RNA-seq and exon-array expression concordances in LUSC were consistent with those for GBM, although additional analysis with valid controls is needed to confirm that the relative fold change concordances are consistent for other cancer types as well. Regardless of the quantification programs used, however, isoform fold change values consistently demonstrated stronger agreement across platforms than did raw expression estimates. This suggests that intra-platform normalization against similar control data reduces discrepancies when subsequently integrating data between different platforms.
How expression data could be integrated between RNA-seq and exon-array platforms inevitably depends on the aims of the corresponding study. Limiting follow-up analysis to isoforms identified as DE by both platforms would reduce the number of false positives, whereas considering all DE isoforms from both platforms would improve study sensitivity. Data integration could also be performed in the context of platform-specific biases. Array probes lack the specificity of sequencing-based techniques, which can result in less accurate estimates for lowly expressed transcripts [21] or present problems when co-detected transcripts are not highly correlated in their patterns of expression [38]. Transcript length bias is also a known feature of RNA-seq [12], and therefore exon-array data could be used to increase power for detecting shorter DE transcripts, but additional study is needed to determine optimal thresholds for integration in terms of platform-specific biases.
Another challenge in gene expression analyses is determining the level of transcript abundance that constitutes biologically relevant expression. In routine expression analyses, heuristics featuring arbitrary thresholds (e.g. FPKM > 1) are often used, although several quantitative methods have recently been developed to distinguish biologically active genes from experimental noise [52, 53]. The similar issue in our study was selecting the RNA-seq expression range to use for calculating isoform expression correlations between platforms. Because of the way certain programs assign uncertainty to read counts and report expression estimates, often expression values are reported that are non-zero but are so close to zero that their logged values result in a significant negative tail of outliers relative to the bulk of the expression distribution. At these lower RNA-seq expression values, correlations between platforms are reduced to noise (rS = −0.09 to 0.05). In their proposed RNA-seq normalization method, Hart et al. [53] set log2(FPKM) values less than −15 as undetected. We found that the correlations and number of transcripts shared between platforms did not improve below TPMadj = log2(0.001) (≅−10) (Supplementary Figure S1), and therefore considered transcripts with adjusted expression estimates below this value to be non-expressed.
Our results reinforce the fact that potentially important, isoform-level genetic changes can be masked by gene-level measurements. Almost a third of genes with at least one DE isoform in the RNA-seq or exon-array results were not likewise classified as DE. Even when considering genes with ≥2 DE isoforms in both RNA-seq and exon array, thereby corresponding to stronger differential signals, >10% of these genes were not identified as DE. In cases where DE isoforms within the same gene were dis-regulated in opposite directions of change, it was much more unlikely for those genes to be called as DE. These cases were rare, however, especially when considering genes in both RNA-seq and exon array, for which there were only five identified. These genes should be studied further in the context of GBM to evaluate their relevancy and determine why many more were identified in RNA-seq or exon-array estimates, but not in both. Importantly, the extent to which DE isoforms within the same gene are dis-regulated in opposite directions and the associated relevance likely depend on cancer type.
This study focuses on correlations between RNA-seq and exon-array estimates, but differential isoform expression can also be evaluated using exon-junction arrays, which feature probes that span exon–exon junctions. Exon-junction arrays are commonly used for the analysis of alternative splicing [54, 55], and while exon arrays have several advantages over exon-junction arrays [56], exon-junction arrays can be more informative in isoform de-convolution [57–59]. Exon junction information can also be applied in RNA-seq-based isoform quantification, as with TopHat/Cufflinks [27, 60] and IsoformEx [33]. Although exon-array quantification using MMBGX produced comparable estimates to those from RNA-seq in this study, incorporation of exon junction information may result in improved array-based isoform expression estimates.
Given the inconsistencies in isoform quantification and the lack of an ideal method of validation against real data, integrating isoform expression data across methods and platforms might be a prudent strategy for improving the confidence of expression study results. This study demonstrates how using exon arrays to quantify isoform abundance produces comparable results to sequencing-based estimates, how normalizing against controls before integrating data across platforms improves complementarity, and how the preference for one RNA-seq quantification algorithm should depend on individual study parameters. With a better understanding on the relationship between exon-array- and sequencing-based results, future isoform expression studies can increase their returns by incorporating data from both platforms.
Key Points
Gene expression studies should strive to evaluate expression at the isoform level or risk masking important expression dynamics.
Exon-array expression analysis can yield comparable results to RNA-seq pipelines for evaluating isoform-level expression changes, suggesting that integrating isoform expression data across platforms and pipelines may improve the reliability of expression estimates. Accurate integration of isoform-level expression data across platforms and pipelines will, however, depend on the availability of normal (tissue or organ specific) control samples within each platform and tumor type.
While eXpress achieved the highest correlation with the RT-qPCR and exon-array (MMBGX) results overall, RSEM was more highly correlated with MMBGX for changes in highly variable transcripts. eXpress appears to be most successful in discriminating lowly expressed transcripts, but IsoformEx and RSEM correlate more strongly with MMBGX for highly expressed transcripts.
Isoform fold change values consistently demonstrate stronger agreement across platforms than raw expression estimates, suggesting that fold change normalization against a control is an important step for integrating expression data across platforms. Further, fold change correlations with RT-qPCR were consistent across different levels of RT-qPCR expression for both RNA-seq and exon-array platforms.
eXpress demonstrated the highest overall concordance with exon-array and RT-qPCR estimates, but the preference for one RNA-seq quantification algorithm should depend on individual study parameters.
Supplementary data
Supplementary data are available online at http://bib.oxfordjournals.org/.
Supplementary Material
Acknowledgment
We thank the anonymous reviewers for their feedback, which greatly improved the manuscript. The availability of TCGA data (access to controlled data is obtained through dbGAP; Project ID # 4988) for this study is gratefully acknowledged.
Funding
This work was supported by the National Library of Medicine of the National Institutes of Health (Award Number R01LM011297 to R.D.). M.D. is partially supported by NRSA fellowship T32 DK007169 during the study. The content is solely the responsibility of the authors and does not necessarily represent the official views of the National Institutes of Health.
Matthew Dapas is a PhD Candidate at Northwestern University. He is working on developing novel statistical data mining techniques for studying rare variants in complex diseases.
Manoj Kandpal received his PhD in ChBE from the National University of Singapore and is now a Postdoctoral Researcher at Northwestern University. He is working on isoform-level sequencing data analysis related to cancers.
Yingtao Bi is a Research Assistant Professor at Northwestern University. His general expertise is in the areas of statistical data mining, statistical computing and Bayesian statistics.
Ramana V. Davuluri is a Professor in Preventive Medicine and the Director of the Cancer Informatics Core of Robert H. Lurie Comprehensive Cancer Center. His research group works at the interface of Translational Bioinformatics and Cancer Genomics.
References
- 1. Gerstein MB, Bruce C, Rozowsky JS, et al. What is a gene, post-ENCODE? History and updated definition. Genome Res 2007;17(6):669–81. [DOI] [PubMed] [Google Scholar]
- 2. Pal S, Gupta R, Kim H, et al. Alternative transcription exceeds alternative splicing in generating the transcriptome diversity of cerebellar development. Genome Res 2011;21(8):1260–72. [DOI] [PMC free article] [PubMed] [Google Scholar]
- 3. Pan Q, Shai O, Lee LJ, et al. Deep surveying of alternative splicing complexity in the human transcriptome by high-throughput sequencing. Nat Genet 2008;40(12):1413–15. [DOI] [PubMed] [Google Scholar]
- 4. Wang ET, Sandberg R, Luo S, et al. Alternative isoform regulation in human tissue transcriptomes. Nature 2008;456(7221):470–6. [DOI] [PMC free article] [PubMed] [Google Scholar]
- 5. Khoury MP, Bourdon JC.. p53 Isoforms: an Intracellular Microprocessor? Genes Cancer 2011;2(4):453–65. [DOI] [PMC free article] [PubMed] [Google Scholar]
- 6. Tazi J, Bakkour N, Stamm S.. Alternative splicing and disease. Biochim Biophys Acta 2009;1792(1):14–26. [DOI] [PMC free article] [PubMed] [Google Scholar]
- 7. Botta A, Malena A, Tibaldi E, et al. MBNL142 and MBNL143 gene isoforms, overexpressed in DM1-patient muscle, encode for nuclear proteins interacting with Src family kinases. Cell Death Dis 2013;4:e770. [DOI] [PMC free article] [PubMed] [Google Scholar]
- 8. Twine NA, Janitz K, Wilkins MR, et al. Whole transcriptome sequencing reveals gene expression and splicing differences in brain regions affected by Alzheimer's disease. PLoS One 2011;6(1):e16266. [DOI] [PMC free article] [PubMed] [Google Scholar]
- 9. Birzele F, Voss E, Nopora A, et al. CD44 isoform status predicts response to treatment with anti-CD44 antibody in cancer patients. Clin Cancer Res 2015;21(12):2753–62. [DOI] [PubMed] [Google Scholar]
- 10. Zhang Y, Chen K, Sloan SA, et al. An RNA-sequencing transcriptome and splicing database of glia, neurons, and vascular cells of the cerebral cortex. J Neurosci 2014;34(36):11929–47. [DOI] [PMC free article] [PubMed] [Google Scholar]
- 11. Zhu Q, Wong AK, Krishnan A, et al. Targeted exploration and analysis of large cross-platform human transcriptomic compendia. Nat Methods 2015;12(3):211–4. [DOI] [PMC free article] [PubMed] [Google Scholar]
- 12. Oshlack A, Wakefield MJ.. Transcript length bias in RNA-seq data confounds systems biology. Biol Direct 2009;4:14. [DOI] [PMC free article] [PubMed] [Google Scholar]
- 13. Wang C, Gong B, Bushel PR, et al. The concordance between RNA-seq and microarray data depends on chemical treatment and transcript abundance. Nat Biotechnol 2014;32(9):�926–32. [DOI] [PMC free article] [PubMed] [Google Scholar]
- 14. Zhao S, Fung-Leung WP, Bittner A, et al. Comparison of RNA-Seq and microarray in transcriptome profiling of activated T cells. PLoS One 2014;9(1):e78644. [DOI] [PMC free article] [PubMed] [Google Scholar]
- 15. Guo Y, Sheng Q, Li J, et al. Large scale comparison of gene expression levels by microarrays and RNAseq using TCGA data. PLoS One 2013;8(8):e71462. [DOI] [PMC free article] [PubMed] [Google Scholar]
- 16. Perkins JR, Antunes-Martins A, Calvo M, et al. A comparison of RNA-seq and exon arrays for whole genome transcription profiling of the L5 spinal nerve transection model of neuropathic pain in the rat. Mol Pain 2014;10:7. [DOI] [PMC free article] [PubMed] [Google Scholar]
- 17. Uziela K, Honkela A.. Probe region expression estimation for RNA-Seq data for improved microarray comparability. PLoS One 2015;10(5):e0126545. [DOI] [PMC free article] [PubMed] [Google Scholar]
- 18. Arino J, Casamayor A, Perez JP, et al. Assessing differential expression measurements by highly parallel pyrosequencing and DNA microarrays: a comparative study. OMICS 2013;17(1):53–9. [DOI] [PMC free article] [PubMed] [Google Scholar]
- 19. Su Z, Li Z, Chen T, et al. Comparing next-generation sequencing and microarray technologies in a toxicological study of the effects of aristolochic acid on rat kidneys. Chem Res Toxicol 2011;24(9):1486–93. [DOI] [PubMed] [Google Scholar]
- 20. Marioni JC, Mason CE, Mane SM, et al. RNA-seq: an assessment of technical reproducibility and comparison with gene expression arrays. Genome Res 2008;18(9):1509–17. [DOI] [PMC free article] [PubMed] [Google Scholar]
- 21. Raghavachari N, Barb J, Yang Y, et al. A systematic comparison and evaluation of high density exon arrays and RNA-seq technology used to unravel the peripheral blood transcriptome of sickle cell disease. BMC Med Genomics 2012;5:28. [DOI] [PMC free article] [PubMed] [Google Scholar]
- 22. Liu S, Lin L, Jiang P, et al. A comparison of RNA-Seq and high-density exon array for detecting differential gene expression between closely related species. Nucleic Acids Res 2011;39(2):�578–88. [DOI] [PMC free article] [PubMed] [Google Scholar]
- 23. Trost B, Moir CA, Gillespie ZE, et al. Concordance between RNA-sequencing data and DNA microarray data in transcriptome analysis of proliferative and quiescent fibroblasts. R Soc Open Sci 2015;2(9):150402. [DOI] [PMC free article] [PubMed] [Google Scholar]
- 24. Turro E, Lewin A, Rose A, et al. MMBGX: a method for estimating expression at the isoform level and detecting differential splicing using whole-transcript Affymetrix arrays. Nucleic Acids Res 2010;38(1):e4. [DOI] [PMC free article] [PubMed] [Google Scholar]
- 25. Liu X, Gao Z, Zhang L, et al. puma 3.0: improved uncertainty propagation methods for gene and transcript expression analysis. BMC Bioinformatics 2013;14:39. [DOI] [PMC free article] [PubMed] [Google Scholar]
- 26. Chen P, Lepikhova T, Hu Y, et al. Comprehensive exon array data processing method for quantitative analysis of alternative spliced variants. Nucleic Acids Res 2011;39(18):�e123. [DOI] [PMC free article] [PubMed] [Google Scholar]
- 27. Trapnell C, Williams BA, Pertea G, et al. Transcript assembly and quantification by RNA-Seq reveals unannotated transcripts and isoform switching during cell differentiation. Nat Biotechnol 2010;28(5):511–15. [DOI] [PMC free article] [PubMed] [Google Scholar]
- 28. Li B, Dewey CN.. RSEM: accurate transcript quantification from RNA-Seq data with or without a reference genome. BMC Bioinformatics 2011;12:323. [DOI] [PMC free article] [PubMed] [Google Scholar]
- 29. Roberts A, Pachter L.. Streaming fragment assignment for real-time analysis of sequencing experiments. Nat Methods 2013;10(1):71–3. [DOI] [PMC free article] [PubMed] [Google Scholar]
- 30. Patro R, Mount SM, Kingsford C.. Sailfish enables alignment-free isoform quantification from RNA-seq reads using lightweight algorithms. Nat Biotechnol 2014;32(5):462–4. [DOI] [PMC free article] [PubMed] [Google Scholar]
- 31. Patro R, Duggal G, Kingsford C.. Accurate, fast, and model-aware transcript expression quantification with Salmon. bioRxiv 2015. doi: 10.1101/021592.
- 32. Bray N, Pimentel H, Melsted P, et al. Near-optimal RNA-Seq quantification. ArXiv e-prints. 2015;1505:2710. http://adsabs.harvard.edu/abs/2015arXiv150502710B (1 May 2015, date last accessed).
- 33. Kim H, Bi Y, Pal S, et al. IsoformEx: isoform level gene expression estimation using weighted non-negative least squares from mRNA-Seq data. BMC Bioinformatics 2011;12:305. [DOI] [PMC free article] [PubMed] [Google Scholar]
- 34. Langmead B, Salzberg SL.. Fast gapped-read alignment with Bowtie 2. Nat Methods 2012;9(4):357–9. [DOI] [PMC free article] [PubMed] [Google Scholar]
- 35. Langmead B, Trapnell C, Pop M, et al. Ultrafast and memory-efficient alignment of short DNA sequences to the human genome. Genome Biol 2009;10(3):R25. [DOI] [PMC free article] [PubMed] [Google Scholar]
- 36. Kanitz A, Gypas F, Gruber AJ, et al. Comparative assessment of methods for the computational inference of transcript isoform abundance from RNA-seq data. Genome Biol 2015;16:150. [DOI] [PMC free article] [PubMed] [Google Scholar]
- 37. Robinson MD, Oshlack A.. A scaling normalization method for differential expression analysis of RNA-seq data. Genome Biol 2010;11(3):R25. [DOI] [PMC free article] [PubMed] [Google Scholar]
- 38. Pal S, Bi Y, Macyszyn L, et al. Isoform-level gene signature improves prognostic stratification and accurately classifies glioblastoma subtypes. Nucleic Acids Res 2014;12:305. [DOI] [PMC free article] [PubMed] [Google Scholar]
- 39. Shulzhenko N, Smirnova AS, Morgun A, et al. Specificity of alternative splice form detection using RT-PCR with a primer spanning the exon junction. Biotechniques 2003;34(6):�1244–9. [DOI] [PubMed] [Google Scholar]
- 40. Brosseau JP, Lucier JF, Lapointe E, et al. High-throughput quantification of splicing isoforms. RNA 2010;16(2):442–9. [DOI] [PMC free article] [PubMed] [Google Scholar]
- 41. Ritchie ME, Phipson B, Wu D, et al. limma powers differential expression analyses for RNA-sequencing and microarray studies. Nucleic Acids Res 2015;43(7):e47. [DOI] [PMC free article] [PubMed] [Google Scholar]
- 42. Law CW, Chen Y, Shi W, et al. voom: precision weights unlock linear model analysis tools for RNA-seq read counts. Genome Biol 2014;15(2):R29. [DOI] [PMC free article] [PubMed] [Google Scholar]
- 43. Vogelstein B, Papadopoulos N, Velculescu VE, et al. Cancer genome landscapes. Science 2013;339(6127):1546–58. [DOI] [PMC free article] [PubMed] [Google Scholar]
- 44. Okumura N, Yoshida H, Kitagishi Y, et al. Alternative splicings on p53, BRCA1 and PTEN genes involved in breast cancer. Biochem Biophys Res Commun 2011;413(3):395–9. [DOI] [PubMed] [Google Scholar]
- 45. Curia MC, De Iure S, De Lellis L, et al. Increased variance in germline allele-specific expression of APC associates with colorectal cancer. Gastroenterology 2012;142(1):�71–7.e71. [DOI] [PMC free article] [PubMed] [Google Scholar]
- 46. Malone JH, Oliver B.. Microarrays, deep sequencing and the true measure of the transcriptome. BMC Biology 2011;9:34. [DOI] [PMC free article] [PubMed] [Google Scholar]
- 47. Mantione KJ, Kream RM, Kuzelova H, et al. Comparing bioinformatic gene expression profiling methods: microarray and RNA-Seq. Med Sci Monit Basic Res 2014;20:138–42. [DOI] [PMC free article] [PubMed] [Google Scholar]
- 48. Edgar R, Domrachev M, Lash AE.. Gene Expression Omnibus: NCBI gene expression and hybridization array data repository. Nucleic Acids Res 2002;30(1):207–10. [DOI] [PMC free article] [PubMed] [Google Scholar]
- 49. Brazma A, Parkinson H, Sarkans U, et al. ArrayExpress–a public repository for microarray gene expression data at the EBI. Nucleic Acids Res 2003;31(1):68–71. [DOI] [PMC free article] [PubMed] [Google Scholar]
- 50. Bustin SA. Why the need for qPCR publication guidelines?–The case for MIQE. Methods 2010;50(4):217–26. [DOI] [PubMed] [Google Scholar]
- 51. Consortium SM-I. A comprehensive assessment of RNA-seq accuracy, reproducibility and information content by the Sequencing Quality Control Consortium. Nat Biotechnol 2014;32(9):903–14. [DOI] [PMC free article] [PubMed] [Google Scholar]
- 52. George NI, Chang CW.. DAFS: a data-adaptive flag method for RNA-sequencing data to differentiate genes with low and high expression. BMC Bioinformatics 2014;15:92. [DOI] [PMC free article] [PubMed] [Google Scholar]
- 53. Hart T, Komori HK, LaMere S, et al. Finding the active genes in deep RNA-seq gene expression studies. BMC Genomics 2013;14:778. [DOI] [PMC free article] [PubMed] [Google Scholar]
- 54. Clark TA, Sugnet CW, Ares M Jr.. Genomewide analysis of mRNA processing in yeast using splicing-specific microarrays. Science 2002;296(5569):907–10. [DOI] [PubMed] [Google Scholar]
- 55. Hallegger M, Llorian M, Smith CW.. Alternative splicing: global insights. FEBS J 2010;277(4):856–66. [DOI] [PubMed] [Google Scholar]
- 56. Kwan T, Benovoy D, Dias C, et al. Heritability of alternative splicing in the human genome. Genome Res 2007;17(8):�1210–18. [DOI] [PMC free article] [PubMed] [Google Scholar]
- 57. Hiller D, Jiang H, Xu W, et al. Identifiability of isoform deconvolution from junction arrays and RNA-Seq. Bioinformatics 2009;25(23):3056–9. [DOI] [PMC free article] [PubMed] [Google Scholar]
- 58. Shen S, Warzecha CC, Carstens RP, et al. MADS+: discovery of differential splicing events from Affymetrix exon junction array data. Bioinformatics 2010;26(2):268–9. [DOI] [PMC free article] [PubMed] [Google Scholar]
- 59. Seok J, Xu W, Davis RW, et al. RASA: Robust Alternative Splicing Analysis for human transcriptome arrays. Sci Rep 2015;5:11917. [DOI] [PMC free article] [PubMed] [Google Scholar]
- 60. Trapnell C, Pachter L, Salzberg SL.. TopHat: discovering splice junctions with RNA-Seq. Bioinformatics 2009;25(9):1105–11. [DOI] [PMC free article] [PubMed] [Google Scholar]
Associated Data
This section collects any data citations, data availability statements, or supplementary materials included in this article.