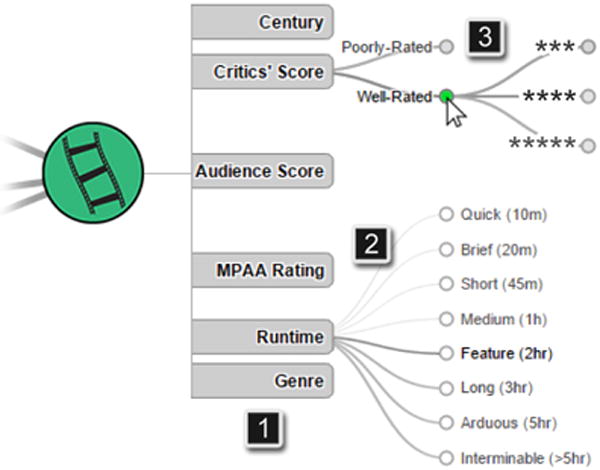
Figure 5.

To investigate the feature space, VISAGE visualizes node features with a tree view. Hierarchical node features can be clicked to hide or show levels of the hierarchy (3). The edges denote the density of the target feature in the current results. The darker edges in (2) mean more results have that attribute value. When a user adds a condition by clicking a node it is highlighted in green, as in (3). If the current node is a result or a starred node, that nodes attributes will be highlighted in blue.
