

Abstract
Background
Influenza vaccination coverage in the US is lower than the recommended Healthy People 2020 threshold, especially among older African Americans. This analysis explores the complex relationship among neighborhood-level factors, socio behavioral influences, and influenza vaccination outcomes among older African Americans.
Methods
We analyzed data from 221 Black/African American participants’ age ≥50 years living in Atlanta, Georgia. Generalized Estimating Equations for linear and logistic models assessed associations among socio demographic factors, census-tract neighborhood characteristics, and reported 2012–2013 seasonal influenza vaccination receipt, controlling for correlations among individuals within the same census tracts. Evaluated environmental factors included neighborhood deprivation indicators such as vacant housing percentage, vehicle availability, area violent crimes, and racial/ethnic composition.
Results
Reported greater influenza immunization uptake was significantly associated with older age ≥65 years [OR=1.05, p=0.04], positive vaccination attitudes [OR=5.30, p<0.01], having health insurance [OR=14.37, p=0.03], lower perceived neighborhood security [OR=0.51, p=0.02], and lower neighborhood vehicle ownership [OR=1.07, p=0.04], a proxy for neighborhood affluence and transportation ease. Having a post-secondary education was significantly associated with both positive perceived neighborhood security [β=0.28, p=0.02] and positive vaccination attitudes [β=0.27, p=0.02].
Conclusion
The findings provide evidence for distal neighborhood-level influences on influenza vaccination uptake among older African Americans. Lower vehicle ownership and lower perceived neighborhood security influenced seasonal influenza immunizations. Those who perceived personal risk, based on reported neighborhood security, displayed intent to obtain the seasonal influenza vaccine. Further investigation of multilevel, socio geographic factors is therefore warranted to more effectively address suboptimal influenza vaccine coverage among this population.
Keywords: Influenza vaccination, Immunization, Socio ecological model, Health disparities, African americans
Introduction
Despite a Healthy People 2020 goal that aims for 90% influenza vaccination coverage for those over age 65 [1,2], vaccine coverage remains suboptimal for older adults with an estimated 60% coverage rate among Medicare beneficiaries. Lower coverage rates are particularly alarming as influenza-related illnesses result in considerable morbidity and mortality in this segment of the U.S. population each year [3–8]. This phenomenon is particularly persistent for those ≥65 years already suffering with chronic diseases or infections that are therefore highly vulnerable to severe influenza-related illness [9,10]. During the 2012–2013 influenza season, the rate of hospitalization among influenza cases for older persons ≥65 years was about 280/100,000, compared to about 30/100,000 among younger populations (≤64 years) [5].
Even more concerning is that influenza immunization coverage also remains particularly low among older racial and ethnic minorities who disproportionately bear more severe influenza-related outcomes, including hospitalizations and complications [5,9,11–13]. In the 2011–2012 influenza seasons, self-reported vaccination coverage was 33% for non-Hispanic blacks, compared to 42% for non-Hispanic whites [8]. These estimates point to a mounting problem of health disparities arising from immunization under coverage. Racial minorities, especially blacks, have reported less favorable attitudes toward influenza vaccination [14–16]. The factors contributing to their attitude formation include a lack of perceived influenza susceptibility and lower confidence in vaccine effectiveness [14–16]. Thus, improving vaccine uptake among older African Americans is critical to reduce morbidity and mortality and lessen illness-related disparities caused by under vaccination [15,17–19].
Many studies have explored factors influencing vaccination uptake, including delay and refusal reasoning [20–23]. However, most have focused on childhood influenza immunization and issues pertaining to influenza acceptance, delay, and refusal among special populations such as pregnant women [13,24–26]. Fewer have focused on the factors contributing to older populations’ acceptance of influenza vaccines, and issues concerning disparities arising from under immunization of racially and ethnically diverse populations [27–29]. Moreover, there is scant evidence beyond individual knowledge, attitudes, and beliefs to account for influencers of vaccine uptake and immunization intentions reported in this specific group.
Aggregated results from studies with other non-elderly populations suggest there are multiple levels of influence resulting in vaccination outcomes for which the socio ecological framework has been a useful explanatory model [30,31]. This model describes proximate and distal influences on immunization behavior including those policy or societal level, followed by those at the community-level inclusive of organizational, neighborhood, and social network levels, and those situated at the individual and interpersonal (dyadic) levels. [30]. Other immunization studies with younger persons have demonstrated a combined influence of individual-level factors such as age, sex, race/ ethnicity, employment, frequency of physician visits in relation to geographic area of residence on influenza vaccination uptake [3,13,32,33]. 7,13,14,16 Among younger persons living in rural Georgia and Montreal, Canada, potential barriers to immunization include personal factors such as lower educational attainment and income levels and presence of concurrent medical conditions, combined with structural challenges such as a lack of health insurance and a lack of transportation to vaccination clinics [14,30].
Very few studies have examined effects related to the built environment on influenza vaccine uptake. Previous studies of 2009 H1N1 influenza vaccination have used material and social deprivation indices constructed with census data inclusive of variables such as the proportion of persons lacking a high school diploma, the unemployment rate, average income, and percentages of individuals living alone, widowed, separated, divorced, or in single-parent households [32]. These findings revealed that neighborhoods that scored high on the deprivation scale and had high numbers of foreign-born residents had reduced 2009 H1N1 influenza vaccination rates [32].
There is a dearth of information on the interaction of neighborhood- and individual-level characteristics and their influence on influenza immunization specifically among older African Americans. Neighborhood-level analysis adds to our understanding of how and why some communities experience lower vaccination coverage than others. Thus, this study offers an important contribution as it focuses on exploring these interactions to improve vaccination uptake among one of the most vulnerable groups in the community.
Materials and Methods
Study design and sample
The data were collected from a cohort of 221 African Americans recruited in metropolitan Atlanta, Georgia [34]. Our methods for recruitment have been previously reported [35]. For this study, we included all persons who met the inclusion criteria including being black/African American over the age of 50 years and an attendee of one of six Atlanta-area African American churches used for recruitment. All subjects gave informed consent before participating in this research.
Measures
Variables of interest included socio demographics, attitudes and perceptions, neighborhood-level factors, and vaccination outcomes. Variables were organized into groups based on the socio ecological framework. On the individual level, we measured socio demographic factors such as age, sex, education level, employment status, and health insurance status. Influenza vaccination receipt was measured by a ‘yes’ or ‘no’ based on responses given to whether they received the 2012–2013 seasonal influenza vaccination.
We measured age as a continuous variable. Annual income was measured in $20,000 increments from $20,000 to $100,000. We collapsed other variables, including health insurance as ‘insured’ and ‘uninsured’, education level as ‘high school graduate or less’ and ‘beyond high school,’ and unemployment as ‘employed’ and ‘unemployed,’ with disabled and retired persons categorized as ‘unemployed.’
Using exploratory factor analysis with Varimax rotation, we constructed measures of attitudes toward vaccination and perceived neighborhood security. The underlying items comprising these indices were measured on 5-point Likert scales, constructed so that higher scores indicated either more favorable attitudes towards vaccination or greater perceived neighborhood security (Tables 1A and 1B).
Table 1A.
Neighborhood Security Scale Descriptive Statistics for Factor Scales, Factor Loadings, Alpha Reliability Estimates, and Subscale Items (n=217) 1=‘Not at All’, 5=‘Extremely’
| Factor (α =0.863, 4 items) | Mean | SD | Min | Max | Factor Loading |
|---|---|---|---|---|---|
| 1: How safe do you feel in your daily life? | 4.08 | 0.793 | 1 | 5 | 0.883 |
| 2: Do you feel you are living in a safe and secure environment? | 3.85 | 0.946 | 1 | 5 | 0.881 |
| 4: How comfortable is the place where you live? | 4.00 | 0.959 | 1 | 5 | 0.844 |
| 5: How easily are you able to get good medical care? | 4.13 | 0.963 | 1 | 5 | 0.775 |
| Removed from analysis | |||||
| 3: How much do you worry about your safety and security? | 2.25 | 1.088 | 1 | 5 | – |
Table 1B.
Vaccination Attitudes Scale Descriptive Statistics for Factor Scales, Factor Loadings, Alpha Reliability Estimates, and Subscale Items (n=211)
| Factor (α = 0.790, 5 items) | Mean | SD | Min | Max | Factor Loading |
|---|---|---|---|---|---|
| 1: My body can protect itself against vaccine diseases. | 3.17 | 0.988 | 1 | 5 | 0.554 |
| 2: I worry that getting the flu shot would give me the flu. | 2.98 | 1.267 | 1 | 5 | 0.843 |
| 3: I would be less likely to get a flu vaccine if it gave me symptoms such as tiredness or fever. | 2.58 | 1.053 | 1 | 5 | 0.657 |
| 4: Immunizations can actually lead to illness. | 3.10 | 1.044 | 1 | 5 | 0.803 |
| 5: I doubt whether vaccines really work. | 3.41 | 1.074 | 1 | 5 | 0.737 |
Our tables display the factor loading information for the two measures of attitudes and perceptions wherein we set each minimal scale item loading at ≥0.50 to ensure discreteness of construct measures. Subsequently, these scales were combined into a single index score for each of the two measures using the average response to each question.
Neighborhood-level variables were obtained from census-level data. We gathered 2010 crime statistics, measured as the rate of violent crimes per 1000 by census tract [36]. Other neighborhood-level variables included percentage of residents of black/African American race, percentage of households without vehicles available, percentage of vacant households, and a neighborhood deprivation index.
Neighborhood deprivation index
A neighborhood deprivation index (NDI) was constructed specifically for the census tracts of the participants in the study [37]. The index was originally developed by Messer et al. using principle component analysis of relevant neighborhood variables extracted from census data in the year 2000 [37]. Factor loading scores were calculated for each variable in the index and then standardized to a mean of zero and standard deviation of one.
We constructed our Atlanta-specific neighborhood deprivation index using the same variables as the original index: percentage of female headed households with dependents, unemployment rate, percentage of households under the poverty line, percentage of households receiving public assistance, percentage of households with income under $30,000, percentage of crowded households (defined as greater than one person per room), percentage of males in management and professional positions, and the percentage of population with less than high school education [37].
Data from the 2010 and 2012 US Census were used for each census tract in the nine counties where study participants resided. The income cutoff of $30,000 used by Messer was changed to $35,000 to account for inflation from 2000 to 2012. The standardized index weights were multiplied by the participants’ census tract’s values for each of the eight NDI variables, and then summed to create one NDI score. This score was treated as a continuous variable in our analyses.
Statistical modeling
All data analyses were performed using IBM SPSS statistics, version 22 (IBM Corp., Armonk, NY). Descriptive statistics were computed for each variable of interest, and correlations between pairs of the predictor variables were calculated. We carried out bivariate analyses for the association of each variable with the outcome of influenza vaccination.
Using the evidence from previous literature, along with the socio ecological model, we selected variables of interest to be included as facilitators of influenza vaccination. The covariates included in the models were chosen a priori, guided by previous findings and the socio ecological model. We hypothesized that the variables of interest would work in conjunction with or through each other in order to influence vaccination decisions. Because of this, we separated the variables into pathway levels; the first level was socio demographics: age, sex, health insurance status, education level, violent crime rates, percentage of residents of black race, percentage of households without vehicles available, percentage of vacant households, and the neighborhood deprivation index; the second level contained attitudes and perceptions: attitudes toward vaccination, and perceived neighborhood security; and the third level was the influenza vaccination outcome (Figure 1). Within this model, level one variable can affect the level three outcome either directly, or through the intermediate level two variables. For each level two variable, only the direct effect on the level three outcomes is estimated. Separate models were constructed to understand the associations between the levels of variables within the larger pathway model.
Figure 1.
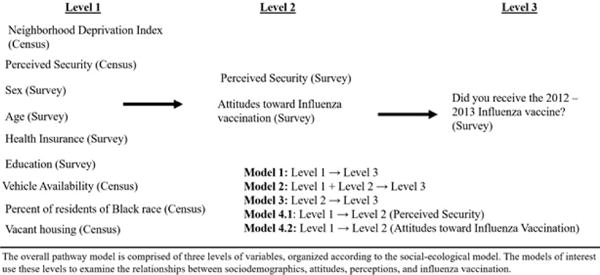
Hypothesized associations between multilevel characteristics and influenza vaccination.
Because we were exploring the effect of neighborhood-level variables on individuals, we accounted for possible uncaptured correlations between individuals in the same census tracts using Generalized Estimating Equations (GEE). The census tract was used the subject (clustering) variable. The hypothesized neighborhood-level correlations between individuals were assumed to be equal; hence we chose an exchangeable correlation structure for these models.
Model 1 assessed the socio demographics as facilitators of influenza vaccination, Model 2 combined the socio demographics with perceptions and attitudes to examine associations with influenza vaccination, Model 3 determined the effect of perceptions and attitudes directly on vaccination status, and Models 4.1 and 4.2 used socio demographics as predictors of the perceptions and attitudes. We specified the appropriate form of regression based on the type of outcome variable: the identity link was used for continuous outcomes, while the logit link was used for binary outcomes.
Results
Sample characteristics
Of the 221 participants ages 50–89 years, 46% (n= 95) reported that they had received 2012–2013 influenza immunizations. Consistent with documented coverage rates, 54% (n=113) did not get vaccinated (Table 2). Our sample included mostly women (78.3%, n=173) and many held at least a high school diploma (94%, n=208), but were mostly not working due to disability, retirement, or other reasons (67%, n=143). The study population comprised 9 Atlanta area counties and 123 different census tracts. A large proportion of individuals (69 persons) were the only ones in their census tract, while 31 census tracts held two people each. The remaining 23 census tracts each contained between two and eight individuals.
Table 2.
Participant characteristics and influenza vaccination factors (n=221)
| Study Population (Total %) | |
|---|---|
| Demographics | |
| Sex | |
| Male | 48 (21.7) |
| Female | 173 (78.3) |
| Age (missing: 3) | |
| 50–64 years | 114 (55.3) |
| 65+ years | 92 (44.7) |
| Health Insurance Status (missing: 15) | |
| Insured | 187 (84.6) |
| Uninsured | 19 (8.6) |
| Education | |
| High School graduate or less | 79 (35.7) |
| Beyond High School | 142 (64.3) |
| Employment (missing: 8) | |
| Employed (full or part time) | 70 (32.9) |
| Unemployed (includes retired and disabled) | 143 (67.2) |
| Received 2012–2013 Seasonal Influenza Immunization | |
| Yes | 95 (45.7) |
| No | 113 (54.3) |
| Individual Perceptions and Attitudes | |
| Perceived Security Mean Score (missing: 4) | 4.0 [0.8] |
| Attitudes about Vaccinations Mean Score (missing: 10) | 3.0 [0.9] |
| Neighborhood Characteristics | |
| Percentage of residents of black race (missing: 4) | 71.8 [26.7] |
| Percent of vacant houses (missing: 3) | 14.6 [9.0] |
| Percent without vehicles available (missing: 17) | 4.5 [5.3] |
| Violent Crime Rates per 1000 (missing: 51)* | 32.2 [27.4] |
Violent crime rates were only available for select census tracts. Multiple imputation of missing data based on associations with the other variables of interest was used to generate adequate data for analysis.
Neighborhood-level results indicated that participants lived in census tracts with a high mean percentage of black residents (71.8%), though the percentage varied greatly across census tracts. The percentage of vacant households was on average 15%, and an average 5% of census tract residents did not own or lease vehicles.
Bivariate analyses
The association between each predictor variable of interest and influenza vaccination revealed that age 65 and older was significantly associated with receiving the influenza vaccination [OR=2.4, p<0.01] (Table 3). Possession of health insurance [OR=17.8, p<0.01] and a positive attitude toward vaccination [OR=4.3, p<0.01] were both associated with influenza vaccination. Older age (as a continuous variable) was associated with vaccination [OR=1.07, p<0.01], and did not show evidence of poor fit according to the Hosmer-Lemeshow test [p=0.76]. We therefore treated age as continuous in further modeling. The other variables of interest were not found to have significant bivariate associations with influenza vaccination receipt.
Table 3.
Bivariate Analysis: Distribution of Descriptive Variables by Vaccination Outcome
| Outcome | Yes | No | Total | Percent vaccinated | OR (95% CI) | p-value |
|---|---|---|---|---|---|---|
| Did you get the 2012–2013 flu vaccine? | 95 | 113 | 208 | 45.67 | – | – |
| Demographics | ||||||
| Sex | ||||||
| Male (ref) | 20 | 25 | 45 | 44.44 | – | – |
| Female | 75 | 88 | 163 | 46.01 | 1.06 (0.55, 2.07) | 0.99 |
| Age | ||||||
| 50–64 (ref) | 41 | 73 | 114 | 35.96 | – | – |
| 65+ | 53 | 39 | 92 | 57.61 | 2.42 (1.38, 4.25) | <0.01* |
| Health Insurance Status | ||||||
| Uninsured (ref) | 1 | 18 | 19 | 5.26 | – | – |
| Insured | 92 | 93 | 185 | 49.73 | 17.81 (2.33, 136.15) | <0.01* |
| Education | ||||||
| High School graduate or less (ref) | 33 | 42 | 75 | 44.00 | – | – |
| Beyond High School | 62 | 71 | 133 | 46.60 | 1.11(0.63, 1.96) | 0.72 |
| Employment | ||||||
| Employed (full time, part time) (ref) | 25 | 43 | 68 | 36.76 | – | – |
| Unemployed/retired/disabled | 68 | 65 | 133 | 51.13 | 1.79(0.99, 3.28) | 0.06 |
| Individual Perceptions and Attitudes | ||||||
| Perceived Security | 0.91 (0.64, 1.30) | 0.61 | ||||
| Attitudes about Vaccinations | 4.31 (2.74, 6.78) | <0.01* | ||||
| Neighborhood Characteristics | ||||||
| Percentage of residents of black race | 1.00 (0.99, 1.01) | 0.62 | ||||
| Percent of vacant houses | 1.01 (0.98, 1.04) | 0.63 | ||||
| Percent without vehicles available | 1.03 (0.97, 1.09) | 0.31 | ||||
| Violent Crime Rates | 1.00 (0.99, 1.01) | 0.70 | ||||
| Neighborhood Deprivation Index | 1.00 (1.00, 1.00) | 0.28 |
The association of this variable with the outcome is significant at the α=0.05
Pathway models
We constructed models analyzing the associations among variables of interest (Tables 4A and 4B). Model 1 explains the direct effect of socio demographic variables on the outcome of influenza vaccination. In this model, older age [OR=1.06, p=0.01] and health insurance status [OR=13.13, p=0.02] were significantly associated with influenza vaccination when adjusting for all other socio demographic variables, as was a lower neighborhood percentage of vehicles available [OR=1.07, p=0.04].
Table 4A.
Pathway models of influenza vaccination with neighborhood and individual effects
| Model | Outcome | Covariates | OR (95%CI) | p-value |
|---|---|---|---|---|
| 1 | Receive the 2012–2013 influenza vaccine? (Y/N) | Neighborhood deprivation index | 0.92 (0.66, 1.28) | 0.61 |
| Violent Crime Rates | 0.99 (0.98, 1.00) | 0.33 | ||
| Sex | 1.00 (0.52, 2.03) | 0.92 | ||
| Age | 1.06 (1.02, 1.11) | 0.01* | ||
| Percent without vehicles available | 1.07 (1.00, 1.13) | 0.04* | ||
| Percent of residents of black race | 1.01 (0.99, 1.02) | 0.18 | ||
| Percent of vacant houses | 0.99 (0.95, 1.04) | 0.68 | ||
| Health Insurance Status | 13.13 (1.57, 110.06) | 0.02* | ||
| Education | 1.20 (0.65, 2.20) | 0.56 | ||
| 2 | Receive the 2012–2013 influenza vaccine? (Y/N) | Neighborhood deprivation index | 0.89 (0.59, 1.35) | 0.59 |
| Violent Crime Rates | 0.99 (0.98, 1.01) | 0.39 | ||
| Sex | 1.04 (0.46, 2.37) | 0.93 | ||
| Age | 1.05 (1.00, 1.10) | 0.04* | ||
| Percent without vehicles available | 1.11 (1.02, 1.19) | 0.01* | ||
| Percent of residents of black race | 1.01 (0.99, 1.02) | 0.19 | ||
| Percent of vacant houses | 0.99 (0.93, 1.05) | 0.76 | ||
| Health Insurance Status | 14.37 (1.21, 169.69) | 0.03* | ||
| Education | 1.08 (0.55, 2.11) | 0.83 | ||
| Perceived Security Mean Score | 0.51 (0.29, 0.91) | 0.02* | ||
| Attitudes about Vaccinations Mean Score | 5.30 (2.85, 9.85) | <0.01* | ||
| 3 | Receive the 2012–2013 influenza vaccine? (Y/N) | Perceived Security Mean Score | 0.60 (0.37, 0.98) | 0.04* |
| Attitudes about Vaccinations Mean Score | 5.05 (2.97, 8.58) | <0.01* |
The association of this variable with the outcome is significant at α=0.05, controlling for the other variables in the model
Table 4B.
Pathway models of neighborhood and individual effects
| Model | Outcome | Covariates | Estimate (95%CI) | p-value |
|---|---|---|---|---|
| 1 | Perceived Security Mean Score | Neighborhood deprivation index | −0.23 (−0.37, −0.10) | <0.01* |
| Violent Crime Rates | 0.001 (−0.004, 0.006) | 0.73 | ||
| Sex | 0.11 (−0.17, 0.38) | 0.45 | ||
| Age | 0.01 (−0.003, 0.03) | 0.11 | ||
| Percent without vehicles available | −0.001 (−0.03, 0.03) | 0.96 | ||
| Percent of residents of black race | −0.001 (−0.005, 0.003) | 0.71 | ||
| Percent of vacant houses | 0.009 (−0.007, 0.03) | 0.27 | ||
| Health Insurance Status | 0.14 (−0.20, 0.48) | 0.42 | ||
| Education | 0.28 (0.06, 0.51) | 0.02* | ||
| 2 | Attitudes about Vaccinations Mean Score | Neighborhood deprivation index | −0.08 (−0.27, 0.11) | 0.43 |
| Violent Crime Rates | 0.00 (−0.007, 0.007) | 0.97 | ||
| Sex | −0.01 (−0.27, 0.24) | 0.94 | ||
| Age | 0.02 (0.01, 0.04) | 0.01* | ||
| Percent without vehicles available | −0.01 (−0.04, 0.02) | 0.36 | ||
| Percent of residents of black race | 0.00 (−0.01, 0.01) | 0.91 | ||
| Percent of vacant houses | 0.003 (−0.02, 0.02) | 0.79 | ||
| Health Insurance Status | 0.27 (−0.93, 0.63) | 0.14 | ||
| Education | 0.27 (0.04, 0.51) | 0.02* |
The association of this variable with the outcome is significant at α=0.05, controlling for the other variables in the model
Model 2 was the association between these socio demographics in combination with vaccination attitudes and neighborhood safety perceptions, with the vaccination outcome. Statistical significance was found for older age [OR=1.05, p=0.04], lower perceived neighborhood security [OR=0.51, p=0.02], lower availability of vehicles per household [OR=1.11, p=0.01], having health insurance [OR=14.37, p=0.03], and a greater score for attitudes toward influenza vaccination [OR=5.30, p<0.01].
Model 3, the associations of vaccination attitudes and perceived security alone with the influenza vaccination outcome shows both lower perceived security [OR=0.60, p=0.04] and higher scores for attitudes toward vaccinations [OR=5.05, p<0.01] to be associated with influenza vaccination.
Models 4.1 and 4.2 contained the socio demographic variables as associated with the outcome of either perceived security or vaccination attitudes. A lower neighborhood deprivation score [β=−0.23, p<0.01] and having more than a high school education [β=0.28, p=0.02] were significantly associated with higher perceived security. Having more than a high school education [β=0.02, p=0.01] and older age [β=0.27, p=0.02] was significantly associated with positive attitudes toward vaccinations.
Discussion
This study adds to the body of literature examining the effects of the built environment on vaccination decisions among our cohort of older African American participants. The results from the pathway models demonstrated important direct and indirect effects of neighborhood-level characteristics on seasonal influenza vaccination while considering previously described individual-level variables [14,32].
We identified age as having an influential role on influenza vaccination. Notably, older age (≥65 years) was significantly associated with receipt of the influenza vaccine in 2012–2013, even when adjusting for sex as well as the neighborhood-level factors. The models that included immunization attitudes, older age (≥65 years), health insurance status, vehicle ownership, and perceived neighborhood security resulted in significant associations. Controlling for attitudes toward vaccinations and perceived neighborhood security (along with the other socio demographics), age remained significantly associated with vaccination, with the odds of vaccination increasing with age. Such “dose response” results have also been shown in previous studies wherein increased age, increased vaccine knowledge and lowered vaccination costs result in greater odds of vaccination [38].
Although the study population was restricted to those over 50, being older than 65 years has a relationship with health-seeking behavior. Previous studies have reported similar findings wherein older age could be related to greater adherence to health behaviors, greater awareness of age-related risks and complications, or more reliance and accountability on other family members for healthcare [22]. Thus, family members’ influence, forms of social support, or some other difference in healthcare attitudes or access may be contributing to this result.
The models assessing intermediate influencers of the factors associated with vaccination reinforced that higher education is associated with positive perceptions of neighborhood security after adjustment for neighborhood crime. Higher education is also associated with positive attitudes toward vaccines. Perceptions of neighborhood security and safety coincide with the actual amount of deprivation that exists in that area.
Health insurance also had a large measure of effect on influenza vaccination, with insured persons having 14 times higher odds of influenza vaccination than uninsured persons, even when adjusting for all other socio demographics, attitudes, and perceptions. Perceived security was also associated with vaccination among those with similar vaccine attitudes and socio demographics, though the odds of vaccination decreased with increasing feelings of safety, an opposite relationship than what was hypothesized based on previous literature [14]. However, previous studies have found significant associations of vaccination with security and safety of the vaccination location, but not necessarily the individual’s place of residence [32]. Alternatively, it may be that as personal risk perception of environmental threats increases, the need for (vaccine-related) health protection also increases.
The same opposite effect is observed with the percentage of vehicles available, a proxy for neighborhood affluence and ease of transportation. A possible explanation is that neighborhoods with low vehicle ownership may have greater availability of public transportation. In general, older individuals may rely on Medicare to cover preventive services such as influenza vaccinations, which may act as a motivator to vaccinate in spite of these other factors, further evidenced by the observed effect of health insurance on vaccination outcomes. These models describe possible pathways by which area-level variables influence individual characteristics and behaviors, which are worth further exploration. Similar effects have been noted in studies examining physical frailty and other non-vaccination outcomes with geriatric populations [39,40].
Our analysis provides a unique perspective of aspects that influence influenza vaccination among older African Americans, and employs the use of neighborhood-level variables to understand mechanisms behind the decisions to receive the vaccine or not, factors that previously have not been fully explored in relation to vaccination decisions. Future studies could further explore these relationships by considering perceived security around the vaccination location, or including factors such as social support, which plays an important role in the health and well-being of elderly persons [39,40]. Including current vaccination status as a result of previous vaccinations, called status quo bias, would also be useful [30,38].
Future public health programs aimed at increasing vaccine coverage among older minorities will benefit from this study as it reveals the distal influence of the built environment on individual actions. Influenza vaccination programs will be able to more effectively target those with fewer resources by circumventing barriers such as ease of access to clinics. Additionally, the study suggests that continued awareness-building promotion of the benefits of immunizations for persons in this age group will enhance the lack of knowledge and thus foster more positive attitudes toward vaccinations.
Limitations
Our sample size of 221 was sufficient for the scope of the analysis that yielded interesting findings yet it is important to recognize that this secondary analysis of data gathered originally for a randomized control trial uses cross-sectional data did not allow us to infer causal relationships. We acknowledge the possibility of social desirability bias with self-reported influenza vaccination status, however other studies have shown that the sensitivity and specificity of self-reported vaccination status can be very high [41]. Thus, we recognize that although this form of bias may be present, it is not likely to have substantially altered our findings or interpretations.
Conclusions
This study reveals direct and distal effects of neighborhood and individual-level factors that may influence vaccination decisions in communities. The findings reveal that older age, perceptions of neighborhood security, health insurance, vehicle availability, and positive attitudes toward vaccinations, had a role in influenza vaccination decisions among older African Americans. Thus, the findings can inform possible socio structural interventions to improve vaccination access for this highly vulnerable population.
Acknowledgments
Support for this study was provided by the National Institutes of Health (5R03AG042831). The authors wish to thank Dr. K. Sullivan for providing assistance and revisions during the analysis and writing process. Special thanks to Dr. Hannah Cooper and Ms. Danielle Haley for providing violent crime statistics for use in this analysis, and Dr. Michael Kramer for providing the neighborhood deprivation index reference. We acknowledge Ms. Sahithi Boggavarapu for her contribution to survey development. We are grateful to all persons involved from the churches and community in this study including Drs. Candice Richardson, Cathy Hogan, Letitia Presley-Cantrell, Jessie Legros, Branden Evans, Charles Burton, Michael McHenry, Don Rubin, Pastor Devon Ward, Elders Brian Green, Robert Dinkins, Gary and Sandra Reddish, Ms. Donna Tate, Mr. Nathaniel Smith, and Mr. Patrick Kelly. Lastly, we acknowledge the “Dose of Hope” church members for voluntarily participating in this research; use of these data has aided in an understanding of the relationships between their neighborhood and individual data and vaccination decisions.
References
- 1.Margine I, Krammer F. Animal models for influenza viruses: implications for universal vaccine development. Pathogens. 2014;3:845–874. doi: 10.3390/pathogens3040845. [DOI] [PMC free article] [PubMed] [Google Scholar]
- 2.Administration Influenza (Flu) Antiviral Drugs and Related Information 2015 [Google Scholar]
- 3.O’Malley AS, Forrest CB. Immunization disparities in older Americans: determinants and future research needs. Am J Prev Med. 2006;31:150–158. doi: 10.1016/j.amepre.2006.03.021. [DOI] [PubMed] [Google Scholar]
- 4.Gasparini R, Amicizia D, Lai PL, Panatto D. Clinical and socioeconomic impact of seasonal and pandemic influenza in adults and the elderly. Hum Vaccin Immunother. 2012;8:21–28. doi: 10.4161/hv.8.1.17622. [DOI] [PubMed] [Google Scholar]
- 5.Flu View. Laboratory-Confirmed Influenza Hospitalizations 2015 [Google Scholar]
- 6.Levy NS. Disparities in the severity of influenza illness: a descriptive study of hospitalized and non-hospitalized novel H1N1 influenza-positive patients in New York City: 2009–2010 influenza Seasons. J Public Health Manag Pract. 2013;19:16–24. doi: 10.1097/PHH.0b013e31824155a2. [DOI] [PubMed] [Google Scholar]
- 7.Skarbinski J. Hospitalized patients with 2009 pandemic influenza A (H1N1) virus infection in the United States–September–October 2009. Clin Infect Dis. 2011;52:S50–S59. doi: 10.1093/cid/ciq021. [DOI] [PubMed] [Google Scholar]
- 8.Lu PJ, O’Halloran A, Bryan L, Kennedy ED, Ding H, et al. Trends in racial/ethnic disparities in influenza vaccination coverage among adults during the 2007–08 through 2011–12 seasons. Am J Infect Control. 2014;42:763–769. doi: 10.1016/j.ajic.2014.03.021. [DOI] [PMC free article] [PubMed] [Google Scholar]
- 9.Rothberg MB, Haessler SD, Brown RB. Complications of viral influenza. Am J Med. 2008;121:258–264. doi: 10.1016/j.amjmed.2007.10.040. [DOI] [PMC free article] [PubMed] [Google Scholar]
- 10.Figaro MK, Belue R. Prevalence of influenza vaccination in a high-risk population: impact of age and race. J Ambul Care Manage. 2005;28:24–29. doi: 10.1097/00004479-200501000-00004. [DOI] [PubMed] [Google Scholar]
- 11.Louie JK, Acosta M, Winter K, Jean C, Gavali S, et al. Factors associated with death or hospitalization due to pandemic 2009 influenza A(H1N1) infection in California. JAMA. 2009;302:1896–1902. doi: 10.1001/jama.2009.1583. [DOI] [PubMed] [Google Scholar]
- 12.Ortiz JR, Neuzil KM, Shay DK, Rue TC, Neradilek MB, et al. The burden of influenza-associated critical illness hospitalizations. Crit Care Med. 2014;42:2325–2332. doi: 10.1097/CCM.0000000000000545. [DOI] [PMC free article] [PubMed] [Google Scholar]
- 13.Tam K, Yousey-Hindes K, Hadler JL. Influenza-related hospitalization of adults associated with low census tract socioeconomic status and female sex in New Haven County, Connecticut, 2007–2011. Influenza Other Respir Viruses. 2014;8:274–281. doi: 10.1111/irv.12231. [DOI] [PMC free article] [PubMed] [Google Scholar]
- 14.Charland KM. Clinic accessibility and clinic-level predictors of the geographic variation in 2009 pandemic influenza vaccine coverage in Montreal, Canada. Influenza Other Respir Viruses. 2014;8:317–328. doi: 10.1111/irv.12227. [DOI] [PMC free article] [PubMed] [Google Scholar]
- 15.Wooten KG, Wortley PM, Singleton JA, Euler GL. Perceptions matter: beliefs about influenza vaccine and vaccination behavior among elderly white, black and Hispanic Americans. Vaccine. 2012;30:6927–6934. doi: 10.1016/j.vaccine.2012.08.036. [DOI] [PubMed] [Google Scholar]
- 16.Orr N, Elliott MN, Burkhart Q, Haviland A, Weinick RM. Racial/Ethnic differences in Medicare experiences and immunization: the role of disease burden. Med Care. 2013;51:823–831. doi: 10.1097/MLR.0b013e31829c8d77. [DOI] [PubMed] [Google Scholar]
- 17.Elam-Evans LD, Yankey D, Singleton JA, Kolasa M, Centers for Disease Control and Prevention (CDC) National, state, and selected local area vaccination coverage among children aged 19–35 months - United States, 2013. MMWR Morb Mortal Wkly Rep. 2014;63:741–748. [PMC free article] [PubMed] [Google Scholar]
- 18.Viboud C, Bjørnstad ON, Smith DL, Simonsen L, Miller MA, et al. Synchrony, waves, and spatial hierarchies in the spread of influenza. Science. 2006;312:447–451. doi: 10.1126/science.1125237. [DOI] [PubMed] [Google Scholar]
- 19.Wenger JB, Naumova EN. Seasonal synchronization of influenza in the United States older adult population. PLoS One. 2010;5:e10187. doi: 10.1371/journal.pone.0010187. [DOI] [PMC free article] [PubMed] [Google Scholar]
- 20.Frew PM. An extended model of reasoned action to understand the influence of individual- and network-level factors on African Americans’ participation in HIV vaccine research. Prev Sci. 2010;11:207–218. doi: 10.1007/s11121-009-0162-9. [DOI] [PMC free article] [PubMed] [Google Scholar]
- 21.Fisher WA. Understanding human papillomavirus vaccination intentions: comparative utility of the theory of reasoned action and the theory of planned behavior in vaccine target age women and men. J Sex Med. 2013;10:2455–2464. doi: 10.1111/jsm.12211. [DOI] [PubMed] [Google Scholar]
- 22.Johnson DR, Nichol KL, Lipczynski K. Barriers to adult immunization. Am J Med. 2008;121:S28–35. doi: 10.1016/j.amjmed.2008.05.005. [DOI] [PubMed] [Google Scholar]
- 23.Ernsting A, Lippke S, Schwarzer R, Schneider M. Who participates in seasonal influenza vaccination? Past behavior moderates the prediction of adherence. Adv Prev Med. 2011;2011:148934. doi: 10.4061/2011/148934. [DOI] [PMC free article] [PubMed] [Google Scholar]
- 24.Fell DB, Sprague AE, Liu N, Yasseen AS, 3rd, Wen SW, et al. H1N1 influenza vaccination during pregnancy and fetal and neonatal outcomes. Am J Public Health. 2012;102:e33–40. doi: 10.2105/AJPH.2011.300606. [DOI] [PMC free article] [PubMed] [Google Scholar]
- 25.Iwasa T, Wada K. Reasons for and against receiving influenza vaccination in a working age population in Japan: a national cross-sectional study. BMC Public Health. 2013;13:647. doi: 10.1186/1471-2458-13-647. [DOI] [PMC free article] [PubMed] [Google Scholar]
- 26.Ambrose CS, Levin MJ, Belshe RB. The relative efficacy of trivalent live attenuated and inactivated influenza vaccines in children and adults. Influenza Other Respir Viruses. 2011;5:67–75. doi: 10.1111/j.1750-2659.2010.00183.x. [DOI] [PMC free article] [PubMed] [Google Scholar]
- 27.Belmin J. Improving the vaccination coverage of geriatric populations. J Comp Pathol. 2010;142(Suppl 1):S125–128. doi: 10.1016/j.jcpa.2009.10.019. [DOI] [PubMed] [Google Scholar]
- 28.Dee DL, Bensyl DM, Gindler J, Truman BI, Allen BG, et al. Racial and ethnic disparities in hospitalizations and deaths associated with 2009 pandemic Influenza A (H1N1) virus infections in the United States. Ann Epidemiol. 2011;21:623–630. doi: 10.1016/j.annepidem.2011.03.002. [DOI] [PubMed] [Google Scholar]
- 29.Monto AS, Ansaldi F, Aspinall R, McElhaney JE, Montaño LF, et al. Influenza control in the 21st century: Optimizing protection of older adults. Vaccine. 2009;27:5043–5053. doi: 10.1016/j.vaccine.2009.06.032. [DOI] [PubMed] [Google Scholar]
- 30.Kumar S, Quinn SC, Kim KH, Musa D, Hilyard KM, et al. The social ecological model as a framework for determinants of 2009 H1N1 influenza vaccine uptake in the United States. Health Educ Behav. 2012;39:229–243. doi: 10.1177/1090198111415105. [DOI] [PMC free article] [PubMed] [Google Scholar]
- 31.Frew PM, Archibald M, Hixson B, del Rio C. Socioecological influences on community involvement in HIV vaccine research. Vaccine. 2011;29:6136–6143. doi: 10.1016/j.vaccine.2011.06.082. [DOI] [PMC free article] [PubMed] [Google Scholar]
- 32.Brien S, Kwong JC, Charland KM, Verma AD, Brownstein JS, et al. Neighborhood determinants of 2009 pandemic A/ H1N1 influenza vaccination in Montreal, Quebec, Canada. Am J Epidemiol. 2012;176:897–908. doi: 10.1093/aje/kws154. [DOI] [PMC free article] [PubMed] [Google Scholar]
- 33.Lowcock EC, Rosella LC, Foisy J, McGeer A, Crowcroft N. The social determinants of health and pandemic H1N1 2009 influenza severity. Am J Public Health. 2012;102:e51–58. doi: 10.2105/AJPH.2012.300814. [DOI] [PMC free article] [PubMed] [Google Scholar]
- 34.Frew PM, Omer SB, Parker K, Bolton M, Schamel J, et al. Delivering a “dose of hope”: a faith-based program to increase older african americans’ participation in clinical trials. JMIR Res Protoc. 2015;4:e64. doi: 10.2196/resprot.4072. [DOI] [PMC free article] [PubMed] [Google Scholar]
- 35.Frew PM, Omer SB, Parker K, Bolton M, Schamel J, et al. Delivering a “dose of hope”: a faith-based program to increase older african americans’ participation in clinical trials. JMIR Res Protoc. 2015;4:e64. doi: 10.2196/resprot.4072. [DOI] [PMC free article] [PubMed] [Google Scholar]
- 36.Cooper HL. The aftermath of public housing relocations: relationships between changes in local socioeconomic conditions and depressive symptoms in a cohort of adult relocaters. J Urban Health. 2014;91:223–241. doi: 10.1007/s11524-013-9844-5. [DOI] [PMC free article] [PubMed] [Google Scholar]
- 37.Messer LC, Laraia BA, Kaufman JS, Eyster J, Holzman C, et al. The development of a standardized neighborhood deprivation index. J Urban Health. 2006;83:1041–1062. doi: 10.1007/s11524-006-9094-x. [DOI] [PMC free article] [PubMed] [Google Scholar]
- 38.Tsutsui Y, Benzion U, Shahrabani S, Din GY. A policy to promote influenza vaccination: a behavioral economic approach. Health Policy. 2010;97:238–249. doi: 10.1016/j.healthpol.2010.05.008. [DOI] [PubMed] [Google Scholar]
- 39.Cramm JM, Nieboer AP. Relationships between frailty, neighborhood security, social cohesion and sense of belonging among community-dwelling older people. Geriatr Gerontol Int. 2013;13:759–763. doi: 10.1111/j.1447-0594.2012.00967.x. [DOI] [PubMed] [Google Scholar]
- 40.Levasseur M, Généreux M. Importance of proximity to resources, social support, transportation and neighborhood security for mobility and social participation in older adults: results from a scoping study. BMC Public Health. 2015;15:503. doi: 10.1186/s12889-015-1824-0. [DOI] [PMC free article] [PubMed] [Google Scholar]
- 41.Mac Donald R. Validation of self-report of influenza and pneumococcal vaccination status in elderly outpatients. American Journal of Preventive Medicine. 1999;16:173–177. doi: 10.1016/s0749-3797(98)00159-7. [DOI] [PubMed] [Google Scholar]