Abstract
The purpose our study was to determine the protective effects of mitochondria division inhibitor 1 (Mdivi1) in Alzheimer’s disease (AD). Mdivi1 is hypothesized to reduce excessive fragmentation of mitochondria and mitochondrial dysfunction in AD neurons. Very little is known about whether Mdivi1 can confer protective effects in AD. In the present study, we sought to determine the protective effects of Mdivi1 against amyloid-β (Aβ)- and mitochondrial fission protein, dynamin-related protein 1 (Drp1)-induced excessive fragmentation of mitochondria in AD progression. We also studied preventive (Mdivi1+Aβ42) and intervention (Aβ42+Mdivi1) affects against Aβ42 in N2a cells. Using real-time RT-PCR and immunoblotting analysis, we measured mRNA and protein levels of mitochondrial dynamics, mitochondrial biogenesis and synaptic genes. We also assessed mitochondrial function by measuring H202, lipid peroxidation, cytochrome oxidase activity, and mitochondrial ATP. MTT assays were used to assess the cell viability. Aβ42 was found to impair mitochondrial dynamics, lower mitochondrial biogenesis, lower synaptic activity, and lower mitochondrial function. On the contrary, Mdivi1 enhanced mitochondrial fusion activity, lowered fission machinery, and increased biogenesis and synaptic proteins. Mitochondrial function and cell viability were elevated in Mdivi1-treated cells. Interestingly, Mdivi1 pre- and post-treated cells treated with Aβ showed reduced mitochondrial dysfunction, and maintained cell viability, mitochondrial dynamics, mitochondrial biogenesis, and synaptic activity. The protective effects of Mdivi1 were stronger in N2a+Aβ42 pre-treated with Mdivi1, than in N2a+Aβ42 cells than Mdivi1 post-treated cells, indicating that Mdivi1 works better in prevention than treatment in AD like neurons.
Keywords: Mitochondrial division inhibitor 1, Amyloid-β, Synaptic pathology, Mitochondrial dysfunction, Dynamin-related protein 1, Mitochondrial dynamics, Mitochondrial fission
Introduction
Alzheimer’s disease (AD) is a progressive, age-dependent illness, characterized by the progressive decline of memory, cognitive function, and changes in behavior and personality [1–4]. Currently, over 46.8 million people worldwide, including 5.4 million Americans, live with AD-related dementia, and this number is estimated to increase to 131.5 million by 2050 [5]. AD-related dementia has huge economic consequences, with the total worldwide medical cost of dementia in 2015 estimated at $818 billion. By 2018, AD, including AD-related dementia, is expected to become a trillion-dollar disease [5]. With lifespan increasing in humans, AD is headed towards becoming the major health concern of elderly persons. Currently, there are no drugs or agents that can delay disease progression in elderly individuals and in patients with AD. Further, there are no definitive peripheral biomarkers that indicate disease in its early stages so that effective therapeutics can be initiated.
AD is largely associated with synaptic damage, mitochondrial structural and functional changes, inflammatory responses, hormonal imbalance, cell cycle changes, and neuronal loss [6–8]. In addition, there are 2 major pathological hallmarks: intracellular neurofibrillary tangles and extracellular amyloid-β (Aβ) deposits in the learning and memory regions of brain [3,9]. Genetic mutations in APP, PS1, and PS2 genes cause about 1–2% of the total number of AD cases. Several factors contribute to late-onset AD, including lifestyle, diet, environmental exposure, stroke, traumatic brain injury and multiple genetic variants in genetic loci, including sortilin-related receptor 1 gene clusterin, the complement component receptor 1, CD2AP, CD33, EPHA1, and MS4A4/MS4A6E genes and the ApoE4 genotype [7–8].
Recently, several lines evidence suggest that mitochondrial abnormalities are largely involved in AD progression: 1) several studies found increased free radical production, lipid peroxidation, oxidative DNA damage, oxidative protein damage, and decreased ATP production in postmortem AD brains, compared to brains from age-matched healthy subjects [10–14]; in AD transgenic mice; and in cell lines that express mutant APP or cells treated with Aβ [15–16], 2) studies of mitochondrial enzyme activities found decreased levels of cytochrome oxidase activity, pyruvate dehydrogenase, and α-ketodehydrogenase in fibroblasts, lymphoblasts, and postmortem brains from AD patients, compared to neurons, fibroblasts, and lymphoblasts from age-matched healthy subjects [16], 3) mitochondrial DNA changes were higher in postmortem brain tissue from AD patients and aged-matched healthy subjects, compared to DNA changes in postmortem brain tissue from young, healthy subjects, suggesting that the accumulation of mitochondrial DNA in AD pathogenesis is age-related [17–18], 4) several groups investigated mitochondrial gene expressions in postmortem AD brains and in brain specimens from AD transgenic mice [19–21]. They found mitochondrially encoded genes abnormally expressed in the brains AD patients and AD mice. A recent, time-course global gene expression study in an AD mouse model (Tg2576) and age-matched non-transgenic littermates revealed an up-regulation of mitochondrial genes in the Tg2576 mice, suggesting that mitochondrial metabolism is impaired by mutant APP/Aβ and that the up-regulation of mitochondrial genes may be a compensatory response to mutant APP/Aβ [20]; further, Manczak and colleagues found an abnormal expression of mitochondrially encoded genes in postmortem AD brains compared to the brains of healthy subjects, suggesting impaired mitochondrial metabolism in AD [22], 5) recent mitochondrial studies in brain tissue from AD patients and neuronal cells expressing mutant APP found that Aβ fragments mitochondria and causes structural changes in neurons from AD patients [21,23–27].
Recent Aβ and mitochondrial studies found impaired mitochondrial dynamics (excessive mitochondrial fragmentation and reduced fusion) in AD postmortem brains and AD cell and mouse models [21,23–25,26–31]. Further, recent studies from our lab revealed that Aβ interacts with Drp1, with a subsequent increase in free radical production, which in turn activates Drp1 and Fis1, and causes excessive mitochondrial fragmentation, defective transport of mitochondria to synapses, low synaptic ATP, and synaptic dysfunction in AD neurons [21,24]. Given the increase in free radical production and excessive fragmentation in mitochondria that are involved in AD, we hypothesize that drugs capable of reducing free radicals or decreasing excessive mitochondrial fragmentation may be effective therapeutic approaches to treat AD.
Excessive mitochondrial fragmentation is well documented in neurodegenerative diseases, including Alzheimer’s, Parkinson’s, and Huntington’s, leading to impaired mitochondrial dynamics, defective axonal transport, low synaptic ATP and, ultimately, synaptic damage [32,33]. Based on excessive mitochondrial fragmentation, impaired mitochondrial dynamics, defective axonal transport, low synaptic ATP, and synaptic damage that are present in AD, it has been proposed that mitochondrial division inhibitors are potential candidates to treat excessive mitochondrial fragmentation and its associated factors in AD progression and pathogenesis.
To identify mitochondrial fission inhibitors, several groups have independently screened chemical libraries and have found several inhibitors: Mdivi 1 [34], Dynasore [35], and P110 [36]. Among these, Mdivi 1 has been extensively investigated with experimental rodent models of epilepsy and seizures [37], ischemia/reperfusion injury [38–41], oxygen glucose deprivation [42], and such conditions as aggregation of endosomes and vesicle fusion during exocytosis [43]. In all of these diseased states and conditions, Mdivi 1 was found to have beneficial effects on affected tissues and cells, by reducing excessive mitochondrial fission and maintaining the fission-fusion balance in mitochondria and the normal functioning of cells.
Mdivi1 is a cell-permeable, selective mitochondrial fission inhibitor; its molecular weight is 353.22. It inhibits GTPase Drp1 activity by blocking the self-assembly of Drp1, resulting in reversible formation of elongated and tubular mitochondria in wild-type cells [34]. However, it is unclear whether Mdivi1 reduces Aβ-induced excessive mitochondrial fragmentation, maintains and/or enhances mitochondrial function and synaptic activities in Aβ-treated N2a cells.
In the present study, we sought to determine the protective effects of Mdivi1 against Aβ-induced excessive mitochondrial fragmentation and synaptic toxicities in mouse neuroblastoma (N2a) cells. Using Aβ42 peptide and Mdivi1 and mouse neuroblastoma (N2a) cells, 1) we measured mRNA and protein levels of mitochondrial fission and fusion genes, biogenesis genes, and synaptic genes; 2) we assessed mitochondrial function by measuring H2O2, lipid peroxidation, cytochrome oxidase activity, and mitochondrial ATP; and 3) and we determined the cell viability.
Materials and Methods
Chemicals and Reagents
The Aβ42 peptide was purchased from Anaspec (Fremont, CA, USA); Mdivi1 was purchased from Sigma-Aldrich Chemical Company (City, CA, USA); and N2a cells were purchased from American Type Culture Collection (ATCC) (Manassas, VA, USA). Dulbecco’s Modified Eagle Medium (DMEM) and Minimum Essential Medium (MEM), penicillin/streptomycin, Trypsin-EDTA, and fetal bovine serum were purchased from GIBCO (Gaithersberg, MD, USA).
Tissue culture work
The N2a cells were grown for 3 days in a serum-free medium (1:1 mixture of DMEM and OptiMEM, plus penicillin and streptomycin [Invitrogen, Carlsbad, CA, USA]) until the cells developed neuronal processes. As shown in Figure 1, these cells were used for 5 groups - one control group and 4 treatment groups: 1) untreated N2a cells (the control group), 2) N2a cells treated (incubated) with the Aβ42 peptide (Aβ42 treatment group; 20 μM final concentration) for 6 hrs, 3) N2a cells treated with Mdivi1 for 24 hrs (Mdivi1 treatment group, 20 μM final concentration), 4) N2a cells treated with the Aβ42 peptide for 6 hrs then treated with Mdivi1 for 24 hrs (Aβ42+Mdivi1 treatment group), and 5) N2a cells treated with Mdivi1 for 24 hrs and then treated with the Aβ42 peptide for 6 hrs (Mdivi1+Aβ42 treatment group). As shown in Figure 1, we performed 4 independent cell cultures and treatments for all experiments (n=4).
Figure 1.
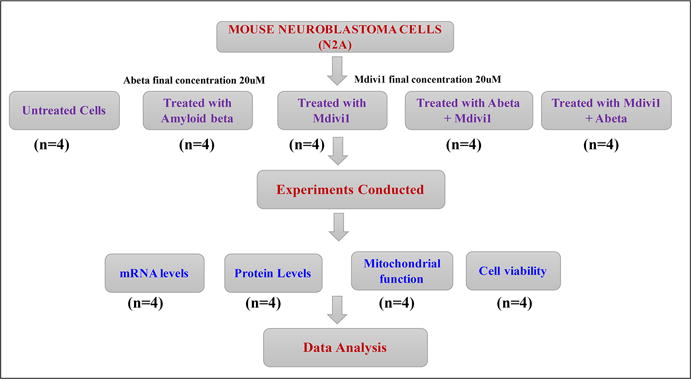
Experimental design of Mdivi1 and Aβ42 treatments in mouse neuroblastoma (N2a) cells.
The N2a cells from all 5 groups (4 treatment groups and 1 control group) were harvested, and their cell pellets were collected and used for quantitative real-time RT-PCR, immunoblotting analysis of mitochondrial and synaptic proteins, and mitochondrial functional assays for hydrogen peroxide production, lipid peroxidation, cytochrome c oxidase activity, and MTT determination. Isolated mitochondria from N2a cells from all 5 groups were used to determine mitochondrial ATP as described in Reddy et al. [6]. As shown in Figure 1, we performed 4 independent cell cultures and treatments for each parameter – levels of mRNA, proteins, mitochondrial functional assays for lipid peroxidation, cytochrome c oxidase activity, ATP production, and cell viability.
Quantitative real-time RT-PCR
Using the reagent TriZol (Invitrogen), total RNA was isolated from cell pellets from the 5 N2a cell groups (Figure 1). Using primer express software (Applied Biosystems, Carlsbad, CA, USA), we designed the oligonucleotide primers for the housekeeping genes β-actin, GAPDH, mitochondrial structural genes, fission genes (Drp1, Fis1), fusion genes (MFN1, MFN2, Opa1), biogenesis genes (PGC1α, Nrf1, Nrf2, TFAM), and synaptic genes (synaptophysin and PSD95) (see Table 1 for primer sequences and amplicon sizes). Using SYBR-Green chemistry-based quantitative real-time RT-PCR, mRNA expressions of the above-mentioned genes were measured, as described by Manczak and Reddy [44].
Table 1.
Summary of quantitative real-time RT-PCR oligonucleotide primers used in measuring mRNA expression in mitochondrial dynamics, mitochondrial biogenesis, and synaptic genes in in N2a cells treated with Aβ42, Mdivi1+Aβ42, Aβ42+Mdivi1 relative to untreated N2a cells
| Gene | DNA Sequence (5′-3′) | PCR Product Size |
|---|---|---|
| Mitochondrial Dynamics Genes | ||
| Drp1 | Forward Primer ATGCCAGCAAGTCCACAGAA | 86 |
| Reverse Primer TGTTCTCGGGCAGACAGTTT | ||
| Fis1 | Forward Primer CAAAGAGGAACAGCGGGACT | 95 |
| Reverse Primer ACAGCCCTCGCACATACTTT | ||
| MFN1 | Forward Primer GCAGACAGCACATGGAGAGA | 83 |
| Reverse Primer GATCCGATTCCGAGCTTCCG | ||
| MFN2 | Forward Primer TGCACCGCCATATAGAGGAAG | 78 |
| Reverse Primer TCTGCAGTGAACTGGCAATG | ||
| Opa1 | Forward Primer ACCTTGCCAGTTTAGCTCCC | 82 |
| Reverse Primer TTGGGACCTGCAGTGAAGAA | ||
| Mitochondrial Biogenesis Genes | ||
| PGC1α | Forward Primer GCAGTCGCAACATGCTCAAG | 83 |
| Reverse Primer GGGAACCCTTGGGGTCATTT | ||
| Nrf1 | Forward Primer AGAAACGGAAACGGCCTCAT | 96 |
| Reverse Primer CATCCAACGTGGCTCTGAGT | ||
| Nrf2 | Forward Primer ATGGAGCAAGTTTGGCAGGA | 96 |
| Reverse Primer GCTGGGAACAGCGGTAGTAT | ||
| TFAM | Forward Primer TCCACAGAACAGCTACCCAA | 84 |
| Reverse Primer CCACAGGGCTGCAATTTTCC | ||
| Synaptic Genes | ||
| Synaptophysin | Forward Primer CTGCGTTAAAGGGGGCACTA | 81 |
| Reverse Primer ACAGCCACGGTGACAAAGAA | ||
| PSD95 | Forward Primer CTTCATCCTTGCTGGGGGTC | 90 |
| Reverse Primer TTGCGGAGGTCAACACCATT | ||
| Housekeeping Genes | ||
| Beta Actin | Forward Primer AGAAGCTGTGCTATGTTGCTCTA | 91 |
| Reverse Primer TCAGGCAGCTCATAGCTCTTC | ||
| GAPDH | Forward Primer TTCCCGTTCAGCTCTGGG | 59 |
| Reverse Primer CCCTGCATCCACTGGTGC | ||
The mRNA transcript level was normalized against β-actin and the GAPDH at each dilution. The standard curve was the normalized mRNA transcript level, plotted against the log-value of the input cDNA concentration at each dilution. To compare β-actin, GAPDH, and relative quantification was performed according to the (CT) method (Applied Biosystems). Briefly, this method involved averaging triplicate samples, which were taken as the CT values for β-actin, GAPDH, and neuroprotective markers. β-actin normalization was used in the present study because the β-actin CT values were similar for the control and the 4 treatment groups in terms of mitochondrial dynamics, biogenesis, and synaptic genes. The ΔCT-value was obtained by subtracting the average β-actin CT value from the average CT-value of the synaptic mitochondrial ETC genes and the mitochondrial structural genes. The ΔCT of untreated cells was used as the calibrator. The fold change was calculated according to the formula 2^−(Δ ΔCT), where ΔΔCT is the difference between ΔCT and the ΔCT calibrator value. To determine the statistical significance of mRNA expression, the CT value differences between the untreated cells and other experimental groups of cells were used in relation to β-actin normalization. Statistical significance was calculated, using one-way ANOVA. Fold changes of mRNA were compared 2 ways - comparison 1, untreated N2a cells with 1) N2a+Mdivi1, 2) N2a+Aβ42, 3) N2a+Aβ42+Mdivi1, 4) N2a+Mdivi1+Aβ42, and comparison 2, N2a+Aβ42 with 1) N2a+Aβ42+Mdivi1and 2) N2a+Mdivi1+Aβ42.
Immunoblotting analysis
To determine the effects of Mdivi1 and Aβ42 at the protein levels of mitochondrial dynamics and biogenesis and synaptic genes that exhibited altered mRNA expression, we performed immunoblotting analyses of protein lysates isolated from cell pellets of all 5 groups of cells (Figure 1), as described in Reddy et al. [6]. Twenty μg of protein was resolved from each group of cells on a 4–12% Nu-PAGE gel (Invitrogen). The resolved proteins were transferred to nylon membranes (Novax Inc., San Diego, CA, USA) and were then incubated for 1 hour at room temperature with a blocking buffer (5% dry milk dissolved in a TBST buffer). The PVDF membranes were incubated overnight with primary antibodies (see Table 2) and washed 3 times with a TBST buffer at 10-minute intervals. They were then incubated for 2 hours with appropriate secondary antibodies, followed by 3 additional washes at 10-minute intervals. Mitochondrial and synaptic proteins were detected with cheminilumniscence reagents (Pierce Biotechnology, Rockford, IL, USA), and the bands from immunoblots were quantified on a Kodak scanner, following manufacturer’s instructions (ID Image Analysis Software, Kodak Digital Science, Kennesaw, GA, USA), and the gel images were analyzed from gel images captured with a Kodak digital science CD camera. The lanes were marked to define the positions and specific regions of the bands. An ID fine-band command was used to locate and to scan the bands in each lane and to record the readings.
Table 2.
Summary of antibody dilutions and conditions used in the immunoblotting analysis of mitochondrial dynamics, mitochondrial biogenesis, and synaptic proteins in N2a cells treated with Aβ42, Mdivi1+Aβ42, Aβ42+Mdivi1 relative to untreated N2a cells
| Marker | Primary Antibody – Species and Dilution | Purchased from Company, City & State | Secondary Antibody, Dilution | Purchased from Company, City & State |
|---|---|---|---|---|
| Drp1 | Rabbit Polyclonal 1:500 | Novus Biological, Littleton, CO | Donkey Anti-rabbit HRP 1:10,000 | GE Healthcare Amersham, Piscataway, NJ |
| Fis1 | Rabbit Polyclonal 1:500 | MBL International Corporation-life. Woburn, MA | Donkey Anti-rabbit HRP 1:10,000 | GE Healthcare Amersham, Piscataway, NJ |
| Mfn1 | Rabbit Polyclonal 1:400 | Novus Biological, Littleton, CO | Donkey Anti-rabbit HRP 1:10,000 | GE Healthcare Amersham, Piscataway, NJ - |
| Mfn2 | Rabbit Polyclonal 1:400 | Abcam, Cambridge, MA | Donkey Anti-rabbit HRP 1:10,000 | GE Healthcare Amersham, Piscataway, NJ |
| OPA1 | Rabbit Polyclonal 1:500 | Novus Biological, Littleton, CO | Donkey anti-rabbit HRP 1:10,000 | GE Healthcare Amersham, Piscataway, NJ |
| SYN | Rabbit Monoclonal 1:400 | Abcam, Cambridge, MA | Donkey Anti-rabbit HRP 1:10,000 | GE Healthcare Amersham, Piscataway, NJ |
| PSD95 | Rabbit Monoclonal 1:300 | Abcam, Cambridge, MA | Donkey Anti-rabbit HRP 1:10,000 | GE Healthcare Amersham, Piscataway, NJ |
| PGC1α | Rabbit Polyclonal 1:500 | Novus Biological, Littleton, CO | Donkey Anti-rabbit HRP 1:10,000 | GE Healthcare Amersham, Piscataway, NJ |
| Nrf1 | Rabbit Polyclonal 1:300 | Santa Cruz Biotechnology, Inc. Dallas, TX | Donkey Anti-rabbit HRP 1:10,000 | GE Healthcare Amersham, Piscataway, NJ |
| Nrf2 | Rabbit Polyclonal 1:300 | Novus Biological, Littleton, CO | Donkey Anti-rabbit HRP 1:10,000 | GE Healthcare Amersham, Piscataway, NJ |
| TFAM | Rabbit Polyclonal 1:300 | Novus Biological, Littleton, CO | Donkey Anti-rabbit HRP 1:10,000 | GE Healthcare Amersham, Piscataway, NJ |
| B-actin | Mouse Monoclonal 1:500 | Sigma-Aldrich, St Luis, MO | Sheep Anti-mouse HRP 1:10,000 | GE Healthcare Amersham, Piscataway, NJ |
Measurement of soluble Aβ42 levels in untreated N2a cells and N2a cells treated with Mdivi1
The cell pellets were washed several times with PBS buffer and washed pellets were used and measured soluble Aβ42 levels in the N2a cells+Aβ42, Aβ42+Mdivi1, and Mdivi1+Aβ42 treatment groups following method described in Manczak et al [23]. Briefly, protein lysates from untreated control N2a cells and lysates from 4 treatment groups were homogenized in a Tris-buffered saline (pH 8.0) containing protease inhibitors (20 mg/ml pepstatin A, aprotinin, phophsoramidon, and leupeptin; 0.5 mM phenylmethanesulfonyl fluoride and 1 mM ethyleneglycol-bis(flaminoethyl ether)-NN tetraacetic acid). Samples were sonicated briefly and centrifuged at 10,000 g for 20 min at 4°C. The soluble fraction was used to determine the soluble Aβ by ELISA. For each sample, Aβ1–40 and Aβ1–42 were measured with commercial colorimetric ELISA kits (Biosource International, Camarillo, CA, USA) that were specific for each species. A 96-well plate reader was used, following the manufacturer’s instructions. Each sample was run in duplicate. Protein concentrations of the homogenates were determined following the BSA method, and Aβ was expressed as pg Aβ/mg protein.
Mitochondrial functional assays
H2O2 production
Using an Amplex® Red H2O2 assay kit (Molecular Probes, Eugene, OR, USA), H2O2 production was measured using cell pellets, as described in Manczak and Reddy [44]. Briefly, H2O2 production was measured in the protein lysates prepared from cell pellets of control untreated N2a cells and 4 treatment groups (Figure 1). A BCA protein assay kit (Pierce Biotechnology) was used to estimate protein concentration. The reaction mixture contained mitochondrial proteins (μg/μl), Amplex Red reagents (50 μM), horseradish peroxidase (0.1 U/ml), and a reaction buffer (1X). The mixture was incubated at room temperature for 30 minutes, followed by spectrophotometer readings of fluorescence (570 nm). Finally, H2O2 production was determined, using a standard curve equation expressed in nmol/μg mitochondrial protein. H2O2 levels were compared 2 ways – comparison 1, untreated N2a cells with 1) N2a+Mdivi1, 2) N2a+Aβ42, 3) N2a+Aβ42+Mdivi1, 4) N2a+Mdivi1+Aβ42, and comparison 2, N2a+Aβ42 with 1) N2a+Aβ42+Mdivi1and 2) N2a+Mdivi1+Aβ42.
Lipid peroxidation assay
Lipid peroxidates are unstable indicators of oxidative stress in the brain. The final product of lipid peroxidation is 4-hydroxy-2-nonenol (HNE), which was measured in the N2a cell lysates prepared from cell pellets of control and treatment groups. We used an HNE-His ELISA kit (Cell BioLabs, Inc., San Diego, CA, USA), as described in Manczak and Reddy [44]. Briefly, freshly prepared protein as added to a 96-well protein binding plate and incubated overnight at 4°C. The protein then washed 3 times with a buffer. After the last wash, the anti-HNE-His antibody was added to the protein in the wells, incubated for 2 hours at room temperature, and then washed again 3 times. The samples were then incubated with a secondary antibody conjugated with peroxidase for 2 hours at room temperature, followed by incubation with an enzyme substrate. Optical density was measured (at 450nm) to quantify the level of HNE. Lipid peroxidation levels were compared 2 ways – comparison 1, untreated N2a cells with 1) N2a+Mdivi1, 2) N2a+Aβ42, 3) N2a+Aβ42+Mdivi1, 4) N2a+Mdivi1+Aβ42, and comparison 2, N2a+Aβ with 1) N2a+Aβ42+Mdivi1and 2) N2a+Mdivi1+Aβ42.
Cytochrome c oxidase activity
Cytochrome oxidase activity was measured in each of the 5 groups of N2a cells. Enzyme activity was assayed spectrophotometrically using a Sigma Kit (Sigma–Aldrich) following manufacturer’s instructions. Briefly, 2 μg protein lysate was added to 1.1 ml of a reaction solution containing 50 μl 0.22 mM ferricytochrome c that was fully reduced by sodium hydrosulphide, Tris–HCl (pH 7.0), and 120 mM potassium chloride. The decrease in absorbance at 550 mM was recorded for 1-min reactions at 10-sec intervals. Cytochrome oxidase activity was measured according to the following formula: mU/mg total mitochondrial protein = (A/min sample – (A/min blank) × 1.1 mg protein × 21.84). The protein concentrations were determined following the BCA method. Cytochrome oxidase activity levels were compared 2 ways – comparison 1, untreated N2a cells with 1) N2a+Mdivi1, 2) N2a+Aβ42, 3) N2a+Aβ42+Mdivi1, 4) N2a+Mdivi1+Aβ42, and comparison 2, N2a+Aβ42 with 1) N2a+Aβ42+Mdivi1and 2) N2a+Mdivi1+Aβ42.
ATP levels
ATP levels were measured in N2a cell mitochondria from the treatment groups using an ATP determination kit (Molecular Probes). A bioluminescence assay was used, based on the reaction of ATP with recombinant firefly luciferase and its substract luciferin. Luciferase catalyzes the formation of light from ATP and luciferin. It is the emitted light that is linearly related to the concentration of ATP, which is measured with a luminometer. ATP levels were measured from mitochondrial pellets using a standard curve method. ATP levels were compared 2 ways – comparison 1, untreated N2a cells with 1) N2a+Mdivi1, 2) N2a+Aβ42, 3) N2a+Aβ42+Mdivi1, 4) N2a+Mdivi1+Aβ42, and comparison 2, N2a+Aβ42 with 1) N2a+Aβ42+Mdivi1and 2) N2a+Mdivi1+Aβ42.
Statistical considerations
Statistical analyses were conducted for mitochondrial structural and functional parameters in the N2a cells from the 5 experimental groups, using one-way ANOVA with Dunnett correction. The parameters included H2O2, cytochrome oxidase activity, lipid peroxidation, ATP production, and cell viability. To determine the effect of Mdivi1 on N2a cells, in the absence and presence of Aβ42, we analyzed and compared data in 2 ways – comparison 1, untreated N2a cells with 1) N2a+Mdivi1, 2) N2a+Aβ42, 3) N2a+Aβ42+Mdivi1, 4) N2a+Mdivi1+Aβ42, and comparison 2, N2a+Aβ with 1) N2a+Aβ+Mdivi1 (curative) and 2) N2a+Mdivi1+Aβ42 (preventive).
Results
mRNA expressions of mitochondrial dynamics genes
Amyloid-β42 treatment
In the N2a cells treated with Aβ42 compared to untreated N2a cells, mRNA expression levels were significantly higher: in the fission Drp1 by 1.4 fold (P=0.02) and Fis1 by 1.4 fold (P=0.03) (Table 3). In contrast, mRNA expression levels of mitochondrial fusion genes were lower but not significant - Mfn1 by −1.2 fold, Mfn2 by −1.3 fold, and Opa1 by −1.2 fold. These findings indicate the presence of abnormal mitochondrial dynamics in cells treated with Aβ.
Table 3.
mRNA fold changes in N2a cells treated with Aβ42 and Mdivi1
| Genes | mRNA fold changes compare with untreated cells | mRNA fold changes compare with Aβ42 treated cells | ||||
|---|---|---|---|---|---|---|
| Mdivi1 | Aβ42 | Aβ42+Mdivi1 | Mdivi1+ Aβ42 | Aβ42+Mdiv1 | Mdivi1+Aβ42 | |
| Mitochondrial Structural genes | ||||||
| Drp1 | −1.5* | 1.4* | −1.2 | −1.1 | −1.5* | −1.5* |
| Fis1 | −1.3 | 1.4* | −1.2 | −1.2 | −1.7* | −1.6* |
| Mfn1 | 1.3 | −1.2 | 1.3 | 2.1* | 1.6* | 2.6** |
| Mfn2 | 1.2 | −1.3 | 1.2 | 1.7* | 1.6* | 2.2* |
| OPA1 | 1.2 | −1.2 | 1.0 | 1.9* | 1.3 | 2.3* |
| Mitochondrial Biogenesis Genes | ||||||
| PGC1α | 2.2* | −5.8** | 1.4 | 1.1 | 8.1*** | 6.5** |
| Nrf1 | 2.2* | −2.0* | 1.0 | 1.3 | 2.0* | 2.7** |
| Nrf2 | 1.6* | −2.1* | 1.0 | 1.3 | 2.0* | 2.7** |
| TFAM | 1.5* | −2.5* | 1.2 | 1.3 | 2.9** | 3.2** |
| Synaptic Genes | ||||||
| Synaptophysin | 1.3 | −1.4* | 1.2 | 1.7* | 1.5* | 2.2* |
| PSD95 | 5.1** | −2.6* | 4.8** | 1.5* | 8.6*** | 3.8** |
P≤ 0.05
P≤ 0.005
P≤ 0.0005
Mdivi1
The mRNA levels of N2a cells treated with Mdiv1 were significantly lower in the fission genes Drp1 (1.5-fold decrease, P=0.01 and Fis1 (1.3-fold decrease) and higher for the fusion genes Mfn1 by 1.3 fold, Mfn2 by 1.2 fold, and Opa1 by 1.2 fold (Table 3).
Treatment with Aβ42 and Mdivi1
In the N2a cells treated with Aβ42 and then treated with Mdivi1, the mRNA levels were unchanged for Drp1 and Fis1 and for Mfn1, Mfn2 and Opa1 and CypD, compared to the mRNA levels of untreated N2a cells (Table 3). The mRNA levels of N2a cells treated with Mdivi1 and then treated with Aβ42 did were significantly higher for the fusion genes Mfn1 by 2.1 fold (P=0.01), Mfn2 by 1.7 fold (P=0.03), and Opa1 by 1.9 fold (P=0.01) (Table 3).
Mitochondrial biogenesis genes
Aβ42
To determine the effects of Aβ42 and Mdivi1 on mitochondrial biogenesis genes, mRNA expression levels of PGC1α, Nrf1, Nrf2, and TFAM genes were measured. Significantly lower mRNA expressions were found in the biogenesis genes from N2a cells treated with Aβ42 relative to the mRNA expression level of untreated cells: – PGC1α by 5.8 fold (P=0.001), Nrf1 by 2.0 fold (P=0.01), Nrf2 by 2.1 fold (P=0.01), and TFAM by 2.5 fold (P=0.01) (Table 3).
Mdivi1
mRNA levels were significantly increased for PGC1α by a 2.2-fold (P=0.01), Nrf1 by a 2.2 fold (P=0.01), Nrf2 by 1.6 fold (P=0.03), and TFAM by a 1.5 fold (P=0.03) in Mdivi-treated cells relative to untreated cells (Table 3). These observations indicate that Mdivi1 increases mitochondrial biogenesis activity.
Aβ42+Mdivi1
In cells treated with Aβ42 first and then treated with Mdivi1, mRNA expression levels were unchanged for Nrf1, Nrf2 and only slightly higher for PGC1α (by 1.4 fold) and TFAM (1.2 fold) (Table 3).
Mdivi1+Aβ42
In cells treated with Mdivi1 and then treated with Aβ42, levels of mRNA expression were slightly higher for biogenesis genes: PGC1α by 1.1 fold, Nrf1 by 1.3 fold, Nrf2 by 1.3, and TFAM by 1.3 (Table 3). These results suggest that Mdivi1 treatment prevented Aβ42-induced biogenesis toxicity.
Synaptic genes
Aβ42
In cells treated with Aβ42 compared to untreated cells, mRNA expression levels were lower for synaptophysin by 1.4 fold (P=0.04) and PSD95 by 2.6 fold (P=0.004), indicating that Aβ42 reduces synaptic activity (Table 3).
Mdivi1
mRNA levels were significantly higher for PSD95 5.1 fold (P=0.004) and higher for synaptophysin by 1.3 fold in the Mdivi1-treated cells (Table 3). These findings indicate that Mdivi1 boosts synaptic activity in healthy cells.
Aβ42 +Mdivi1
In cells treated with Aβ42 and then treated with Mdivi1, mRNA levels were significantly higher for PSD95 by 4.8 fold (P=0.001) and slightly higher for synaptophysin 1.2 fold (Table 3). These observations suggest that Mdivi1 rescued synaptic activity from Aβ42-induced toxicity.
Mdivi1+Aβ
In cells treated with Mdivi1 and then treated with Aβ42, significantly higher mRNA expression levels were found for synaptophysin by1.7 fold (P=0.01) and PSD95 by 1.5 fold (P=0.04) (Table 3), indicating that Mdivi1 prevented Aβ42-induced synaptic activity.
Comparison to Aβ42-treated N2a cells
As shown in Table 3, mRNA expression levels of fission genes were lower in N2a cells treated with Aβ42+Mdivi1 (Drp1 by 1.5 fold, P=0.03; Fis1 by 1.7 fold, P=0.02), and with Mdivi1+Aβ42 (Drp1 by 1.5 fold, P=0.02; Fis1 by 1.6 fold, P=0.03) relative to the expression levels of fission genes in N2a cells treated only with Aβ42. In contrast, fusion genes were higher in the N2a cells treated with Aβ42+Mdivi1 (Mfn1 by 1.6 fold, P=0.04; Mfn2 by 1.6 fold, P=0.03; Opa1 by 1.3) and Mdivi1+Aβ42 (Mfn1 by 2.6 fold, P=0.003; Mfn2 by 2.2 fold, P=0.01; Opa1 by 2.3 fold, P=0.002) than the N2a cells treated only with Aβ42.
Mitochondrial biogenesis genes were greater in the N2a cells treated with Aβ42+Mdivi1 (PGC1α by 8.1 fold, P=0.0001; Nrf1 by 2.0 fold, P=0.01, Nrf2 by 2.0 fold, P=0.01, TFAM by 2.9 fold, P=0.004) and Mdivi1+Aβ42 (PGC1α by 6.5 fold, P=0.001; Nrf1 by 2.7 fold, P=0.003; Nrf2 by 2.7 fold, P=0.004; TFAM by 3.2 fold, P=0.002) than in the N2a cells treated only with Aβ42, indicating that Mdivi1 increases Aβ42-induced reduced biogenesis activity. Similarly, synaptic genes were greater in N2a cells treated with Aβ42+Mdivi1 (synaptophysin by 1.5 fold, P=0.04 and PSD95 by 8.6 fold, P=0.0002) and Mdivi1+Aβ42 (synaptophysin 2.2 fold, P=0.01 and PSD95 by 3.8 fold, P=0.003) than in N2a cells treated only with Aβ42 (Table 3).
Immunoblotting analysis
To determine the effects of Aβ42 and Mdiv1 on mitochondrial proteins, we quantified mitochondrial proteins in 3 independent treatments of N2a cells with Aβ42, Mdivi1, Aβ42+Mdivi1, and Mdivi1+ Aβ42.
Comparison to untreated N2a cells
In N2a cells treated with Aβ42, significantly higher increased proteins levels were found for Drp1 (P=0.04) and Fis1 (P=0.01) (Figure 2A and 2B) compared to untreated N2a cells. In contrast, significantly lower levels of Mfn1 (P=0.001), Mfn2 (P=0.001), and Opa1 (P=0.001) were found in N2a cells treated with Aβ42. Significantly lower levels of PGC1α (P=0.001), Nrf1 (P=0.01) and Nrf2 (P=0.02) were also found in the Aβ42-treated N2a cells (Figure 2A and 2C), similar to synaptophysin (P=0.01) and PSD95 (P=0.01), which were significantly lower in the Aβ42 treated N2a cells, compared to untreated N2a cells (Figure 2A and 2D).
Figure 2.
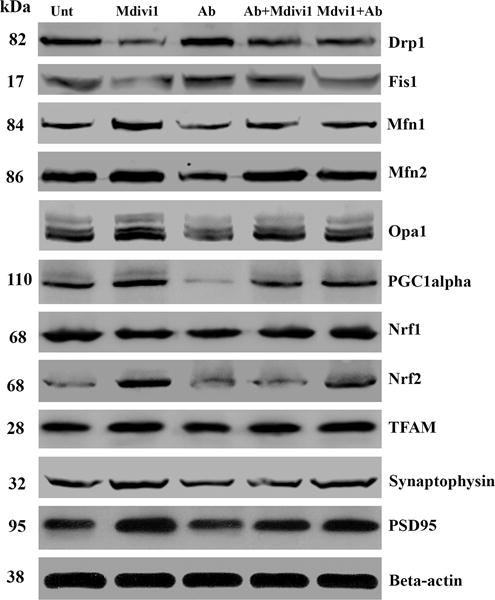
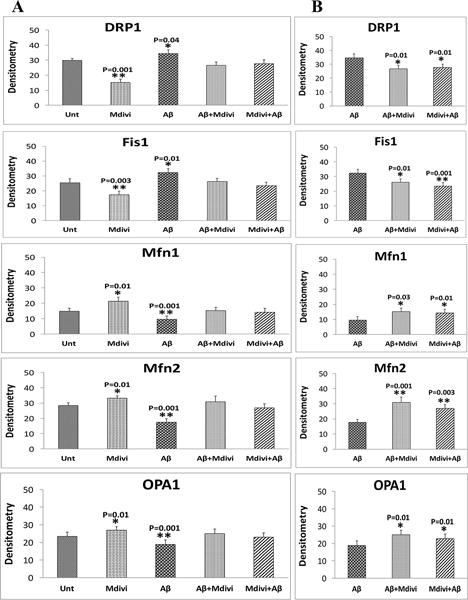
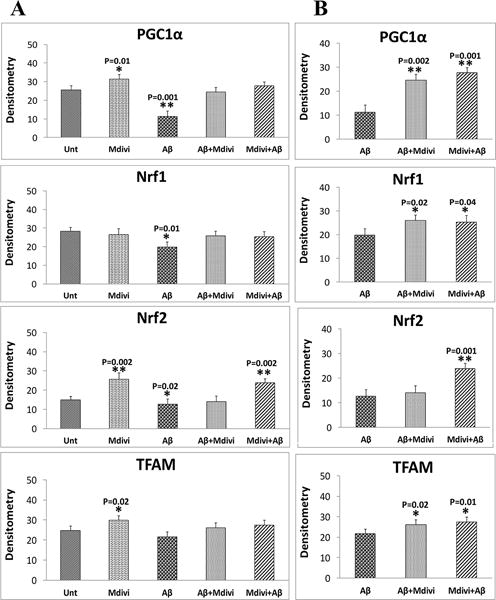
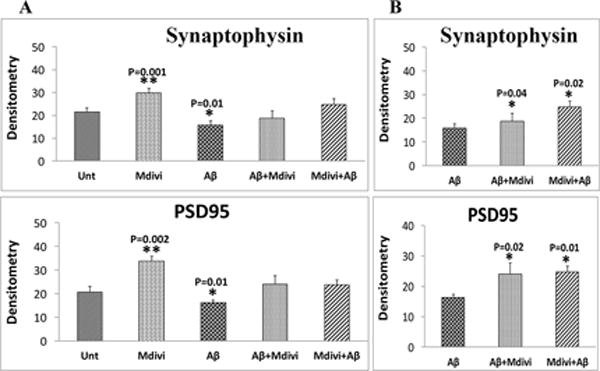
Immunoblotting analysis of mitochondrial dynamics, mitochondrial biogenesis and synaptic proteins. Figure 2A shows a representative immunoblot of N2a cells treated with Aβ42, Mdivi1, Aβ42+Mdivi1, and Mdivi1+Aβ42 relative to untreated cells. Figure 2B presents data from a quantitative densitometry analysis of mitochondrial dynamics proteins. Figure 2C presents data from a quantitative densitometry analysis of mitochondrial biogenesis proteins. Figure 2D presents data from a quantitative densitometry analysis of synaptic proteins.
Drp1 (P=0.001) and Fis1 (P=0.003) protein levels were significantly lower, in contrast to Mfn1 (P=0.01), Mfn2 (P=0.01) and OPA1 (P=0.01) protein levels were significantly higher in N2a cells treated with Mdivil (Figure 2A and 2B). Interestingly, PGC1α (P=0.01), Nrf2 (P=0.002), and TFAM (P=0.02) were also significantly higher in Mdivi1-treated cells (Figure 2A and 2C), suggesting increased biogenesis activity. Levels of synaptophysin (P=0.001) and PSD95 (P=0.002) were significantly higher in Aβ-treated cells than were they in untreated N2a cells (Figure 2A and 2D).
Unchanged protein level for Drp1 and Fis1 were in N2a cells treated with Aβ42+Mdivi1, compared to levels of these proteins in untreated N2a cells (Figure 2A and 2B). Also unchanged protein levels for Drp1 and Fis1 were found in the N2a cells treated with Mdivi1+Aβ42 treated cells, compared to levels of these proteins in untreated N2a cells (Figure 2A and 2B). Overall, these findings suggest that Mdivi1 reduces fission activity in the N2a cells, and Mdivi1 enhances fusion and biogenesis activities in the presence of Aβ42.
Comparison to Aβ42-treated cells
As shown in Figure 2A and 2B, significantly lower levels of Drp1 (P=0.01) and Fis1(P=0.01) were found in N2a cells treated with Aβ42+Mdivi1 relative to Aβ42 treated N2a cells, and significantly lower levels of proteins (Drp1, P=0.01; Fis1, P=0.001) were found in N2a cells treated with Mdivi1+Aβ42 relative to the Aβ42-treated N2a cells. In contrast, significantly higher levels of Mfn1 (P=0.03), Mfn2 (P=0.001), and Opa1 (0.01) were found in N2a cells treated with Aβ42+Mdivi1 relative to Aβ42 treated N2a cells and significantly higher levels of Mfn1 (P=0.01), Mfn2 (P=0.003) and Opa1 (P=0.01) were also found in Mdivi1+Aβ42-treated N2a cells relative to Aβ42 treated N2a cells.
Also significantly higher levels of PGC1α (P=0.002), Nrf1 (P=0.02) and TFAM (P=0.02) were found in N2a cells treated with Aβ42+Mdivi1 relative to Aβ42 treated N2a cells, similar to PGC1α (P=0.001), Nrf1 (P=0.04), Nrf2 (P=0.001), and TFAM (P=0.01) N2a cells that were treated with Mdivi1+ β42 (Figure 2A and 2C), indicating that Mdivi1 enhances biogenesis in the presence of Aβ42. Likewise, levels of synaptophysin and PSD95 were significantly higher in the N2a cells treated with Aβ42+Mdivi1 (P=0.04 and P=0.02, respectively) as were they when treated with Mdivi1+Aβ42 (P=0.02 and P=0.01 respectively), compared to the Aβ42 treated cells (Figure 2A and 2D). These results indicate that Mdivi1 treatment enhances synaptic activity in the presence of Aβ42.
Mdivi1 and levels of Aβ42
To determine whether Mdivi1 lowers Aβ42 levels in N2a cells, using Sandwich ELISA we measured Aβ42 levels in N2a cells treated with Aβ42+Mdivi1 (curative) and Mdivi1+Aβ42 (preventive). As shown in Figure 3, significantly lower levels of Aβ42 levels were found in the N2a cells treated with Aβ42+Mdivi1 (P=0.01) and with Mdivi1+Aβ (P=0.04), compared to N2a cells treated only with Aβ42.
Figure 3. Amyloid-β42 levels.
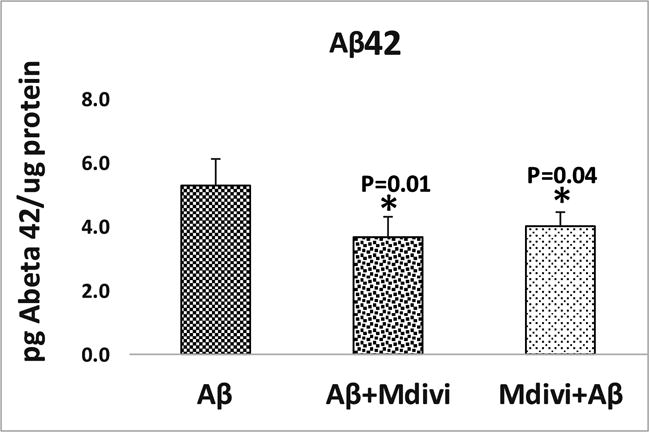
Significantly reduced levels of Aβ42 levels were found in the N2a cells treated with Aβ42+Mdivi1 (P=0.01) and with Mdivi1+Aβ (P=0.04) relative to N2a cells treated only with Aβ42.
These observations indicate that Mdivi1 reduces Aβ42 levels via mitochondrial dynamics pathway since Aβ42 was found to be lower in Mdivi1+Aβ42 and Aβ42+Mdivi1 proteins, regardless of the sequence of treatment, as long as Mdivi1 was involved in the treatment. Also, since Aβ42 were found to be higher in N2a cells, regardless of the sequence of treatment, as long as Mdivil was involved in the treatment, mitochondrial fragmentation lowered, as did the level of free radicals.
Mitochondrial function
Parameters of mitochondrial function were studied in Aβ-treated N2a cells (n=4) to determine whether affects mitochondrial function and whether Mdivi1 confers preventive effects on Mdivi1 in the presence or absence of the Aβ42 peptide. The parameters included H2O2 production, cytochrome oxidase activity, lipid peroxidation, ATP production, and cell viability. We compared the data 2 ways – in comparison 1 - untreated N2a cells with Mdivi1, Aβ42, Mdivi1+Aβ42 and Mdivi1+Aβ42 (preventive) and in comparison 2 – Aβ42 with Aβ42+Mdivi1 and Mdivi1+Aβ42 (curative).
H2O2 production
In comparison 1 - as shown in Figure 4, image A, significantly increased levels of H2O2 were found in mitochondria from N2a cells treated with Aβ42 (P=0.003), but H2O2 levels were unchanged in mitochondria isolated from cells treated with Aβ42+Mdivi1 and Mdivi1+Aβ42. H2O2 levels significantly lower in Aβ+Mdivi1 (P=0.003) and Mdivi1+Aβ (P=0.003) than N2a+Aβ42 cells. These results suggest that Mdivi1 reduces H2O2 levels in the presence of Aβ42 in N2a cells (Figure 4-image B).
Figure 4. Hydrogen peroxide levels.
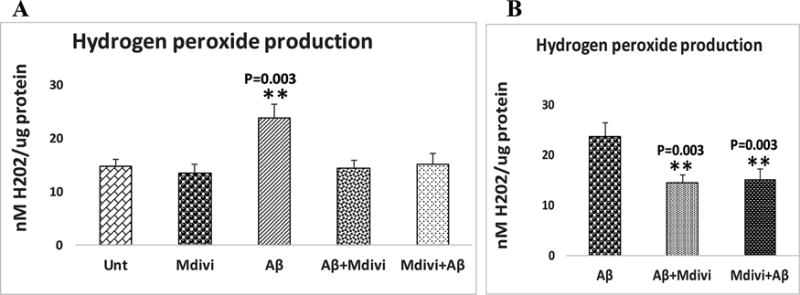
Hydrogen peroxide levels were analyzed in 2 ways: (A) the untreated N2a cells were compared with N2a cells treated Aβ42, Mdivi1, Aβ42+Mdivi1, and Mdivi1+ Aβ42, and (B) Aβ42-treated N2a cells were compared to N2a cells treated with Aβ42+Mdivi1 and Mdivi1+ Aβ42.
Lipid peroxidation
To determine whether Aβ affects lipid peroxidation in N2a cells that underwent Aβ42 incubation, 4-hydroxy-2-nonenol, an indicator of lipid peroxidation, was measured. Significantly higher levels of lipid peroxidation (P=0.003) were found in the treated (Figure 5, image A) relative to the untreated N2a cells. However, significantly lower levels of lipid peroxidation (P=0.04) were found in the Mdivi1-treated N2a cells relative to cells that were not treated with Aβ42. Significantly lower levels of lipid peroxidation were found in N2a cells treated with Aβ42+Mdivi1 (P=0.01) and Mdivi1+Aβ42 (P=0.02) relative to N2a cells treated only with Aβ42. These findings suggest that Aβ42 increases lipid peroxidation, on the contrary Mdivi1 reduces lipid peroxidation in N2a cells. Further, Mdivi1 reduces lipid peroxidation in the presence of Aβ42.
Figure 5. Lipid peroxidation levels.
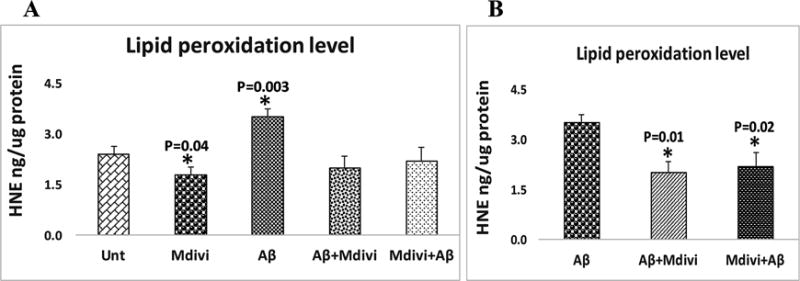
Lipid peroxidation levels were analyzed in 2 ways: (A) the untreated N2a cells were compared with N2a cells treated Aβ42, Mdivi1, Aβ42+Mdivi1, and Mdivi1+ Aβ42, and (B) Aβ42-treated N2a cells were compared to the N2a cells treated with Aβ42+Mdivi1 and Mdivi1+ Aβ42.
Cytochrome c oxidase activity
Significantly lower levels of cytochrome oxidase activity were found in N2a cells treated with Aβ42 (P=0.01) (Figure 6, image A). However, increased levels of were found in the Mdivi1, Aβ42+Mdivi1, and Mdivi1+Aβ treated N2a cells, but levels were not significant. As shown in Figure 6, image B, significantly increased cytochrome oxidase activity was found in the N2a cells treated with Aβ42+Mdivi1 (P=0.02) and Mdivi1+Aβ (P=0.01) compared cells treated with Aβ42 alone, indicating that Mdivi1 prevent toxic effects of Aβ42 on cytochrome oxidase activity.
Figure 6. Cytochrome c oxidase activity levels.
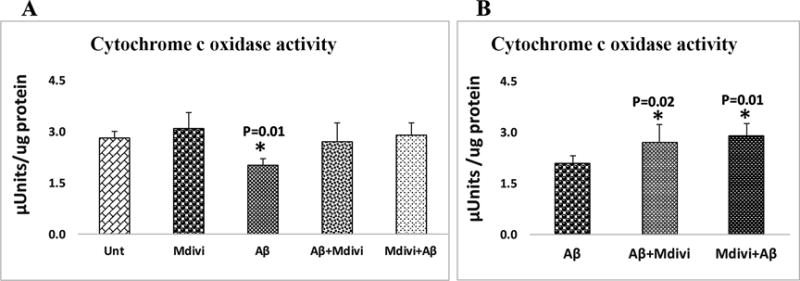
Cytochrome c oxidase activity levels were analyzed in 2 ways: (A) the untreated N2a cells were with N2a cells treated Aβ42, Mdivi1, Aβ42+Mdivi1 and Mdivi1+ Aβ42, and (B) the Aβ42-treated N2a cells were compared to the N2a cells treated with Aβ42+Mdivi1 and Mdivi1+ Aβ42.
ATP production
Significantly lower levels of ATP were found in N2a cells that were treated with Aβ42 (P=0.01) (Figure 7, image A). Significantly increased levels of ATP were found in N2a cells treated with Mdivi1 alone (P=0.01) (Figure 7, image A). Significantly higher ATP levels were found in the N2a cells treated with Aβ42+Mdivi1 (P=0.03) and Mdivi1+Aβ42 (P=0.04), indicating that Mdivi1 enhances ATP levels in the presence of Aβ42 (Figure 7, image B).
Figure 7. Mitochondrial ATP levels.
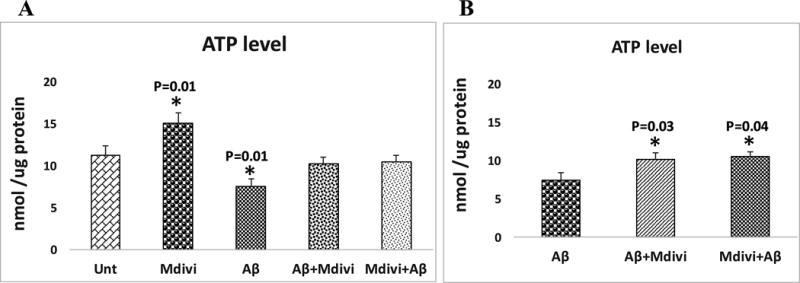
Mitochondrial ATP levels were analyzed in 2 ways: (A) the untreated N2a cells were compared with N2a cells treated with Aβ42, Mdivi1, Aβ42+Mdivi1, and Mdivi1+ Aβ42, and (B) the Aβ42-treated N2a cells were compared to N2a cells treated with Aβ42+Mdivi1 and Mdivi1+ Aβ42.
Cell viability
Significantly lower levels of cell viability were found in N2a cells treated with Aβ42 (0.01) (Figure 8, image A), but cell viability was significantly higher in N2a cells treated with Mdivi1 (P=0.01). As shown in Figure 8, image B, cell viability was also higher in the N2a cells treated with Aβ+Mdivi1 (P=0.01) and Mdivi1+Aβ42 (P=0.02) relative to N2a+Aβ42, indicating that Mdivi1 prevents a decrease in cell viability that Aβ causes.
Figure 8. Cell viability.

Cell viability levels were analyzed in 2 ways: (A) the untreated N2a cells were compared with N2a cells treated Aβ42, Mdivi1, Aβ42+Mdivi1, and Mdivi1+Aβ42, and (B) the Aβ42-treated N2a cells were compared to N2a cells treated with Aβ42+Mdivi1 and Mdivi1+Aβ42.
N2a cells treated with Aβ42 were found to impair mitochondrial dynamics (increased fission and decreased fusion), reduced biogenesis, and decreased synaptic activity and mitochondrial function. On the other hand, Mdivi1 reduced fission machinery and enhanced fusion activity and also increased biogenesis and synaptic proteins. Mitochondrial function and cell viability were elevated in Mdivi1 treated cells. Interestingly, N2a cells treated with Mdivi1 and Aβ42 (Mdiv1+Aβ42 and Aβ42+Mdiv1) showed reduced mitochondrial dysfunction and maintained cell viability, mitochondrial dynamics, mitochondrial biogenesis, and synaptic activity
Discussion
The protective effects of Mdivi1 were stronger in pre-treated cells than post-treated cells - in other words, Mdivi1 works better in prevention than treatment in AD like neurons. In the current study, impaired mitochondrial dynamics was evident in the Aβ42-treated N2a cells (Table 3). These findings agree with earlier studies [23,35–26,45] in which increased mitochondrial fission and reduced fusion were reported. Mitochondrial biogenesis genes were reduced in Aβ42-treated cells, indicating that Aβ42 reduces biogenesis activity. Synaptic activity was significantly reduced in Aβ42 treated N2a cells. Protein data confirmed mRNA changes, suggesting that Aβ42 affects both mRNA and proteins of mitochondria and synapses in AD like neurons. On the other hand, in cells treated with Mdivi1 – mitochondrial biogenesis and synaptic genes were increased and mitochondrial fission genes were reduced and fusion genes were increased, indicating that Mdivi1 treatment is beneficial to cells. Further, when we compared mRNA and protein data of N2a cells+Aβ42 with ‘Aβ42+Mdivi1 (curative)’ and ‘Mdivi1+Aβ42 (prevention)’, protective effects of preventive were stronger than Mdivi1- In other words, in the presence of Aβ42 in N2a cells, treatment of Mdivi1 before Aβ42 treatment did stronger than after Aβ42 followed by Mdivi1 treatment (see Table 3). These observations strongly suggest that Mdivi1 prevents mitochondrial structural, biogenesis and synaptic genes from expressing abnormally. Overall, Mdivi1 protects mitochondrial structure and mitochondrial function by regulating mitochondrial fission and fusion genes in AD.
Aβ42 levels were lower in N2a cells treated with Mdivi1. Interestingly, Mdivi1 reduces Aβ42 in both pre- and post-Mdivi1 treated cells in the presence of Aβ42. Based on current study findings, it appears that Mdivi1 may reduce excessive mitochondrial fragmentation and increase mitochondrial fusion activity, leading to reduced production of mitochondria-generated excessive free radicals, increased cell viability, and maintained mitochondrial/neuronal function. The toxicity caused by Aβ42 [16,20,46] is expected to be reduced by Mdivi1 treatment in N2a cells. However, further research is still needed to understand how Mdivi1 reduces Aβ42 levels in N2a cells.
In the current study, we found mitochondrial function and cell viability were reduced in Aβ42 treated cells. These observations concur with previous studies on Aβ-induced defective mitochondrial function and cell viability [6,23,26,45–49]. On the other hand, Mdivi1-treated cells exhibited enhanced mitochondrial function – increased mitochondrial ATP, cytochrome oxidase activity and cell viability, and reduced free radicals and oxidative stress. These observations strongly suggest that Mdivi1 reduces cellular toxicity and boosts mitochondrial function.
Our purpose was to determine the protective effects of Mdivi1, particularly ‘reduced fragmentation of mitochondria’ and increased and/or maintained mitochondrial function and cell viability in the presence of Aβ42 in cells. We measured mitochondrial functional parameters and cell viability in N2a cells treated with Mdivi1 in the presence or absence of Aβ42. As described in the results section, Aβ42-induced excessive mitochondrial fragmentation and defective mitochondrial function and cell viability were reversed in Mdivi1-treated cells. The reversal effect was stronger in Mdivi1 pre-treated cells than Mdivi1 post-treated cells (see Table 3), indicating that Mdivi1 acts as strong preventive drug for AD. These findings are consistent with mitochondrial and synaptic gene-expression and protein data. In the presence of Aβ42, Mdivi1 reduced free radicals and lipid peroxidation, and increased mitochondrial ATP and cytochrome oxidase activity and cell viability. Thus, all of our data point to Mdivi1 protecting cells from Aβ42 toxicity.
Our observations need further support from AD mice studies – meaning Mdivi1 treatment in AD mice from early on, meaning before mice develop toxic Aβ42 peptide and cognitive deficits and also in disease progression stage – where AD mice developed Aβ peptides and deposits and cognitive impairments.
In summary, our data indicate that Mdivi1 treatment confers protective effects against Aβ42-induced mitochondrial and synaptic toxicities in N2a cells. Findings from our study may have implications for other neurological diseases, such as Huntington’s [50–53], Parkinson’s [54–56], multiple sclerosis [57], and ALS [58], in which excessive mitochondrial fragmentation is present.
Acknowledgments
The research reported on, in this article was supported by NIH grants AG042178 and AG047812 and the Garrison Family Foundation.
References
- 1.Reddy PH, Manczak M, Mao P, Calkins MJ, Reddy AP, Shirendeb U. Amyloid-beta and mitochondria in aging and Alzheimer’s disease: implications for synaptic damage and cognitive decline. J Alzheimers Dis. 2010;20:S499–512. doi: 10.3233/JAD-2010-100504. [DOI] [PMC free article] [PubMed] [Google Scholar]
- 2.Mattson MP. Pathways towards and away from Alzheimer’s disease. Nature. 2004;430:631–639. doi: 10.1038/nature02621. [DOI] [PMC free article] [PubMed] [Google Scholar]
- 3.LaFerla FM, Green KN, Oddo S. Intracellular amyloid-beta in Alzheimer’s disease. Nat Rev Neurosci. 2007;8:499–509. doi: 10.1038/nrn2168. [DOI] [PubMed] [Google Scholar]
- 4.Swerdlow RH. Pathogenesis of Alzheimer’s disease. Clin Interv Aging. 2007;2:347–59. [PMC free article] [PubMed] [Google Scholar]
- 5.World Alzheimer’s Report. 2015 https://www.alz.co.uk/research/WorldAlzheimerReport2015.pdf.
- 6.Reddy PH, Manczak M, Yin X, Grady MC, Mitchell A, Kandimalla R, Kuruva CS. Protective effects of a natural product, curcumin, against amyloid β induced mitochondrial and synaptic toxicities in Alzheimer’s disease. J Investig Med. 2016;64:1220–1234. doi: 10.1136/jim-2016-000240. [DOI] [PMC free article] [PubMed] [Google Scholar]
- 7.Reddy PH, Tripathi R, Troung Q, Tirumala K, Reddy TP, Anekonda V, Shirendeb UP, Calkins MJ, Reddy AP, Mao P, et al. Abnormal mitochondrial dynamics and synaptic degeneration as early events in Alzheimer’s disease: implications to mitochondria-targeted antioxidant therapeutics. Biochim Biophys Acta. 2012;1822:639–649. doi: 10.1016/j.bbadis.2011.10.011. [DOI] [PMC free article] [PubMed] [Google Scholar]
- 8.Mao P, Reddy PH. Aging and amyloid beta-induced oxidative DNA damage and mitochondrial dysfunction in Alzheimer’s disease: implications for early intervention and therapeutics. Biochim Biophys Acta. 2011;1812:1359–1370. doi: 10.1016/j.bbadis.2011.08.005. [DOI] [PMC free article] [PubMed] [Google Scholar]
- 9.Selkoe DJ. Alzheimer’s disease: genes, proteins, and therapy. Physiol Rev. 2001;81:741–766. doi: 10.1152/physrev.2001.81.2.741. [DOI] [PubMed] [Google Scholar]
- 10.Gibson GE, Sheu KF, Blass JP. Abnormalities of mitochondrial enzymes in Alzheimer disease. J Neural Transm (Vienna) 1998;105:855–870. doi: 10.1007/s007020050099. [DOI] [PubMed] [Google Scholar]
- 11.Parker WD, Jr, Filley CM, Parks JK. Cytochrome oxidase deficiency in Alzheimer’s disease. Neurology. 1990;40:1302–1303. doi: 10.1212/wnl.40.8.1302. [DOI] [PubMed] [Google Scholar]
- 12.Maurer I, Zierz S, Möller HJ. A selective defect of cytochrome c oxidase is present in brain of Alzheimer disease patients. Neurobiol Aging. 2000;21:455–462. doi: 10.1016/s0197-4580(00)00112-3. [DOI] [PubMed] [Google Scholar]
- 13.Smith MA, Perry G, Richey PL, Sayre LM, Anderson VE, Beal MF, Kowall N. Oxidative damage in Alzheimer’s. Nature. 1996;382:120–121. doi: 10.1038/382120b0. [DOI] [PubMed] [Google Scholar]
- 14.Devi L, Prabhu BM, Galati DF, Avadhani NG, Anandatheerthavarada HK. Accumulation of amyloid precursor protein in the mitochondrial import channels of human Alzheimer’s disease brain is associated with mitochondrial dysfunction. J Neurosci. 2006;26:9057–9068. doi: 10.1523/JNEUROSCI.1469-06.2006. [DOI] [PMC free article] [PubMed] [Google Scholar]
- 15.Manczak M, Anekonda TS, Henson E, Park BS, Quinn J, Reddy PH. Mitochondria are a direct site of Abeta accumulation in Alzheimer’s disease neurons: implications for free radical generation and oxidative damage in disease progression. Hum Mol Genet. 2006;15:1437–1449. doi: 10.1093/hmg/ddl066. [DOI] [PubMed] [Google Scholar]
- 16.Reddy PH, Beal MF. Amyloid beta, mitochondrial dysfunction and synaptic damage: implications for cognitive decline in aging and Alzheimer’s disease. Trends Mol Med. 2008;14:45–53. doi: 10.1016/j.molmed.2007.12.002. [DOI] [PMC free article] [PubMed] [Google Scholar]
- 17.Lin MT, Simon DK, Ahn CH, Kim LM, Beal MF. High aggregate burden of somatic mtDNA point mutations in aging and Alzheimer’s disease brain. Hum Mol Genet. 2002;11:133–145. doi: 10.1093/hmg/11.2.133. [DOI] [PubMed] [Google Scholar]
- 18.Coskun PE, Beal MF, Wallace DC. Alzheimer’s brains harbor somatic mtDNA control-region mutations that suppress mitochondrial transcription and replication. Proc Natl Acad Sci U S A. 2004;101:10726–1031. doi: 10.1073/pnas.0403649101. [DOI] [PMC free article] [PubMed] [Google Scholar]
- 19.Chandrasekaran K, Giordano T, Brady DR, Stoll J, Martin LJ, Rapoport SI. Impairment in mitochondrial cytochrome oxidase gene expression in Alzheimer disease. Brain Res Mol Brain Res. 1994;24:336–340. doi: 10.1016/0169-328x(94)90147-3. [DOI] [PubMed] [Google Scholar]
- 20.Reddy PH, McWeeney S, Park BS, Manczak M, Gutala RV, Partovi D, Jung Y, Yau V, Searles R, Mori M, Quin JF. Gene expression profiles of transcripts in amyloid precursor protein transgenic mice: up-regulation of mitochondrial metabolism and apoptotic genes is an early cellular change in Alzheimer’s disease. Hum Mol Genet. 2004;13:1225–1240. doi: 10.1093/hmg/ddh140. [DOI] [PubMed] [Google Scholar]
- 21.Manczak M, Calkins MJ, Reddy PH. impaired mitochondrial dynamics and abnormal interaction of amyloid beta with mitochondrial protein Drp1 in neurons from patients with Alzheimer’s disease: implications for neuronal damage. Hum Mol Genet. 2011;20:2495–2509. doi: 10.1093/hmg/ddr139. [DOI] [PMC free article] [PubMed] [Google Scholar]
- 22.Manczak M, Park BS, Jung Y, Reddy PH. Differential expression of oxidative phosphorylation genes in patients with Alzheimer’s disease: implications for early mitochondrial dysfunction and oxidative damage. Neuromolecular Med. 2004;5:147–162. doi: 10.1385/NMM:5:2:147. [DOI] [PubMed] [Google Scholar]
- 23.Manczak M, Mao P, Calkins MJ, Cornea A, Reddy AP, Murphy MP, Szeto HH, Park B, Reddy PH. Mitochondria-targeted antioxidants protect against amyloid-beta toxicity in Alzheimer’s disease neurons. J Alzheimers Dis. 2010;20(Suppl 2):S609–S631. doi: 10.3233/JAD-2010-100564. [DOI] [PMC free article] [PubMed] [Google Scholar]
- 24.Calkins MJ, Reddy PH. Assessment of newly synthesized mitochondrial DNA using BrdU labeling in primary neurons from Alzheimer’s disease mice: Implications for impaired mitochondrial biogenesis and synaptic damage. Biochim Biophys Acta. 2011;1812:1182–1189. doi: 10.1016/j.bbadis.2011.04.006. [DOI] [PMC free article] [PubMed] [Google Scholar]
- 25.Calkins MJ, Manczak M, Mao P, Shirendeb U, Reddy PH. Impaired mitochondrial biogenesis, defective axonal transport of mitochondria, abnormal mitochondrial dynamics and synaptic degeneration in a mouse model of Alzheimer’s disease. Hum Mol Genet. 2011;20:4515–4529. doi: 10.1093/hmg/ddr381. [DOI] [PMC free article] [PubMed] [Google Scholar]
- 26.Wang X, Su B, Siedlak SL, Moreira PI, Fujioka H, Wang Y, Casadesus G, Zhu X. Amyloid-beta overproduction causes abnormal mitochondrial dynamics via differential modulation of mitochondrial fission/fusion proteins. Proc Natl Acad Sci U S A. 2008;105:19318–19323. doi: 10.1073/pnas.0804871105. [DOI] [PMC free article] [PubMed] [Google Scholar]
- 27.Wang X, Su B, Lee HG, Li X, Perry G, Smith MA, Zhu X. Impaired balance of mitochondrial fission and fusion in Alzheimer’s disease. J Neurosci. 2009;29:9090–9103. doi: 10.1523/JNEUROSCI.1357-09.2009. [DOI] [PMC free article] [PubMed] [Google Scholar]
- 29.Manczak M, Kandimalla R, Fry D, Sesaki H, Reddy PH. Protective Effects of Reduced Dynamin-related Protein 1 Against Amyloid Beta-induced Mitochondrial Dysfunction and Synaptic Damage in Alzheimer’s Disease. Hum Mol Genet. 2016 doi: 10.1093/hmg/ddw330. in press. [DOI] [PMC free article] [PubMed] [Google Scholar]
- 30.Kandimalla R, Manczak M, Fry D, Suneetha Y, Sesaki H, Reddy PH, Suneetha Y, Sesaki H, Reddy PH. Reduced Dynamin-related Protein 1 Protects Against Phosphorylated Tau-induced Mitochondrial Dysfunction and Synaptic Damage in Alzheimer’s Disease. Hum Mol Genet. 2016 doi: 10.1093/hmg/ddw312. in press. [DOI] [PMC free article] [PubMed] [Google Scholar]
- 31.Trushina E, Nemutlu E, Zhang S, Christensen T, Camp J, Mesa J, Siddiqui A, Tamura Y, Sesaki H, Wengenack TM, Dzeja PP, Poduslo JF. Defects in mitochondrial dynamics and metabolomic signatures of evolving energetic stress in mouse models of familial Alzheimer’s disease. PLoS One. 2012;7:e32737. doi: 10.1371/journal.pone.0032737. [DOI] [PMC free article] [PubMed] [Google Scholar]
- 32.Reddy PH. Increased mitochondrial fission and neuronal dysfunction in Huntington’s disease: implications for molecular inhibitors of excessive mitochondrial fission. Drug Discov Today. 2014;19:951–955. doi: 10.1016/j.drudis.2014.03.020. [DOI] [PMC free article] [PubMed] [Google Scholar]
- 33.Reddy PH. Inhibitors of mitochondrial fission as a therapeutic strategy for diseases with oxidative stress and mitochondrial dysfunction. J Alzheimers Dis. 2014;40:245–256. doi: 10.3233/JAD-132060. [DOI] [PMC free article] [PubMed] [Google Scholar]
- 34.Cassidy-Stone A, Chipuk JE, Ingerman E, Song C, Yoo C, Kuwana T, Kurth MJ, Shaw JT, Hinshaw JE, Green DR, Nunnari J. Chemical inhibition of the mitochondrial division dynamin reveals its role in Bax/Bak-dependent mitochondrial outer membrane permeabilization. Dev Cell. 2008;14:193–204. doi: 10.1016/j.devcel.2007.11.019. [DOI] [PMC free article] [PubMed] [Google Scholar]
- 35.Macia E, Ehrlich M, Massol R, Boucrot E, Brunner C, Kirchhausen T. Dynasore, a cell-permeable inhibitor of dynamin. Dev Cell 2006. 2008;10:839–850. doi: 10.1016/j.devcel.2006.04.002. [DOI] [PubMed] [Google Scholar]
- 36.Qvit N, Qi X, Su YC, Mochly-Rosen D. A novel Drp1 inhibitor diminishes aberrant mitochondrial fission and neurotoxicity. J Cell Sci. 2013;126:789–802. doi: 10.1242/jcs.114439. [DOI] [PMC free article] [PubMed] [Google Scholar]
- 37.Qiu X, Cao L, Yang X, Zhao X, Liu X, Han Y, Xue Y, Jiang H, Chi Z. Role of mitochondrial fission in neuronal injury in pilocarpine-induced epileptic rats. Neuroscience. 2013;245:157–165. doi: 10.1016/j.neuroscience.2013.04.019. [DOI] [PubMed] [Google Scholar]
- 38.Ong SB, Subrayan S, Lim SY, Yellon DM, Davidson SM, Hausenloy DJ. Inhibiting mitochondrial fission protects the heart against ischemia/reperfusion injury. Circulation. 2010;121:2012–2022. doi: 10.1161/CIRCULATIONAHA.109.906610. [DOI] [PubMed] [Google Scholar]
- 39.Zhang X, Yan H, Yuan Y, Gao J, Shen Z, Cheng Y, Shen Y, Wang RR, Wang X, Hu WW, Wang G, Chen Z. Cerebral ischemia-reperfusion-induced autophagy protects against neuronal injury by mitochondrial clearance. Autophagy. 2013;9:1321–33. doi: 10.4161/auto.25132. [DOI] [PubMed] [Google Scholar]
- 40.Park SW, Kim KY, Lindsey JD, Dai Y, Heo H, Nguyen DH, Ellisman MH, Weinreb RN, Ju WK. A selective inhibitor of drp1, mdivi-1, increases retinal ganglion cell survival in acute ischemic mouse retina. Invest Ophthalmol Vis Sci. 2011;52:2837–2843. doi: 10.1167/iovs.09-5010. [DOI] [PMC free article] [PubMed] [Google Scholar]
- 41.Xie N, Wang C, Lian Y, Zhang H, Wu C, Zhang Q. A selective inhibitor of Drp1, mdivi-1, protects against cell death of hippocampal neurons in pilocarpine-induced seizures in rats. Neurosci Lett. 2013;545:64–68. doi: 10.1016/j.neulet.2013.04.026. [DOI] [PubMed] [Google Scholar]
- 42.Wappler EA, Institoris A, Dutta S, Katakam PV, Busija DW. Mitochondrial dynamics associated with oxygen-glucose deprivation in rat primary neuronal cultures. PLoS One. 2013;8:e63206. doi: 10.1371/journal.pone.0063206. [DOI] [PMC free article] [PubMed] [Google Scholar]
- 43.Chlystun M, Campanella M, Law AL, Duchen MR, Fatimathas L, Levine TP, Gerke V, Moss SE. Regulation of mitochondrial morphogenesis by annexin A6. PLoS One. 2013;8:e53774. doi: 10.1371/journal.pone.0053774. [DOI] [PMC free article] [PubMed] [Google Scholar]
- 44.Manczak M, Reddy PH. Mitochondrial division inhibitor 1 protects against mutant huntingtin-induced abnormal mitochondrial dynamics and neuronal damage in Huntington’s disease. Hum Mol Genet. 2015;24:7308–7325. doi: 10.1093/hmg/ddv429. [DOI] [PMC free article] [PubMed] [Google Scholar]
- 45.Silva DF, Selfridge JE, Lu J, E L, Roy N, Hutfles L, Burns JM, Michaelis EK, Yan S, Cardoso SM, Swerdlow RH. Bioenergetic flux, mitochondrial mass and mitochondrial morphology dynamics in AD and MCI cybrid cell lines. Hum Mol Genet. 2013;22:3931–3946. doi: 10.1093/hmg/ddt247. [DOI] [PMC free article] [PubMed] [Google Scholar]
- 46.Reddy PH. Amyloid precursor protein-mediated free radicals and oxidative damage: implications for the development and progression of Alzheimer’s disease. J Neurochem. 2006;96:1–13. doi: 10.1111/j.1471-4159.2005.03530.x. [DOI] [PubMed] [Google Scholar]
- 47.Aleardi AM, Benard G, Augereau O, Malgat M, Talbot JC, Mazat JP, Letellier T, Dachary-Prigent J, Solaini GC, Rossignol R. Gradual alteration of mitochondrial structure and function by beta-amyloids: importance of membrane viscosity changes, energy deprivation, reactive oxygen species production, and cytochrome c release. J Bioenerg Biomembr. 2005;37:207–225. doi: 10.1007/s10863-005-6631-3. [DOI] [PubMed] [Google Scholar]
- 48.Casley CS, Canevari L, Land JM, Clark JB, Sharpe MA. Beta-amyloid inhibits integrated mitochondrial respiration and key enzyme activities. J Neurochem. 2002;80:91–100. doi: 10.1046/j.0022-3042.2001.00681.x. [DOI] [PubMed] [Google Scholar]
- 49.Casley CS, Land JM, Sharpe MA, Clark JB, Duchen MR, Canevari L. Beta-amyloid fragment 25–35 causes mitochondrial dysfunction in primary cortical neurons. Neurobiol Dis. 2005;10:258–267. doi: 10.1006/nbdi.2002.0516. [DOI] [PubMed] [Google Scholar]
- 50.Shirendeb U, Reddy AP, Manczak M, Calkins MJ, Mao P, Tagle DA, Reddy P. Abnormal mitochondrial dynamics, mitochondrial loss and mutant huntingtin oligomers in Huntington’s disease: implications for selective neuronal damage. Hum Mol Genet. 2011;20:1438–55. doi: 10.1093/hmg/ddr024. [DOI] [PMC free article] [PubMed] [Google Scholar]
- 51.Shirendeb UP, Calkins MJ, Manczak M, Anekonda V, Dufour B, McBride JL, Mao P, Reddy PH. Mutant huntingtin’s interaction with mitochondrial protein Drp1 impairs mitochondrial biogenesis and causes defective axonal transport and synaptic degeneration in Huntington’s disease. Hum Mol Genet. 2012;21:406–420. doi: 10.1093/hmg/ddr475. [DOI] [PMC free article] [PubMed] [Google Scholar]
- 52.Song W, Chen J, Petrilli A, Liot G, Klinglmayr E, Zhou Y, Poquiz P, Tjong J, Pouladi MA, Hayden MR, Masliah E, Ellisman M, Rouiller I, Schwarzenbacher R, Bossy B, Perkins G, Bossy-Wetzel E. Mutant huntingtin binds the mitochondrial fission GTPase dynamin-related protein-1 and increases its enzymatic activity. Nat Med. 2011;17:377–382. doi: 10.1038/nm.2313. [DOI] [PMC free article] [PubMed] [Google Scholar]
- 53.Yin X, Manczak M, Reddy PH. Mitochondria-targeted molecules MitoQ and SS31 reduce mutant huntingtin-induced mitochondrial toxicity and synaptic damage in Huntington’s disease. Hum Mol Genet. 2016;25:1739–1753. doi: 10.1093/hmg/ddw045. [DOI] [PMC free article] [PubMed] [Google Scholar]
- 54.Wang H, Song P, Du L, Tian W, Yue W, Liu M, Li D, Wang B, Zhu Y, Cao C, Zhou J, Chen Q. Parkin ubiquitinates Drp1 for proteasome-dependent degradation: implication of dysregulated mitochondrial dynamics in Parkinson disease. J Biol Chem. 286:11649–11658. doi: 10.1074/jbc.M110.144238. [DOI] [PMC free article] [PubMed] [Google Scholar]
- 55.Wang X, Yan MH, Fujioka H, Liu J, Wilson-Delfosse A, Chen SG, Perry G, Casadesus G, Zhu X. LRRK2 regulates mitochondrial dynamics and function through direct interaction with DLP1. Hum Mol Genet. 2012;21:1931–1944. doi: 10.1093/hmg/dds003. [DOI] [PMC free article] [PubMed] [Google Scholar]
- 56.Stafa K, Tsika E, Moser R, Musso A, Glauser L, Jones A, Biskup S, Xiong Y, Bandopadhyay R, Dawson VL, Dawson TM, Moore DJ. Functional interaction of Parkinson’s disease-associated LRRK2 with members of the dynamin GTPase superfamily. Hum Mol Genet. 2014;23:2055–2077. doi: 10.1093/hmg/ddt600. [DOI] [PMC free article] [PubMed] [Google Scholar]
- 57.Sadeghian M, Mastrolia V, Rezaei Haddad A, Mosley A, Mullali G, Schiza D, Sajic M, Hargreaves I, Heales S, Duchen MR, Smith KJ. Mitochondrial dysfunction is an important cause of neurological deficits in an inflammatory model of multiple sclerosis. Sci Rep. 2016;6:33249. doi: 10.1038/srep33249. [DOI] [PMC free article] [PubMed] [Google Scholar]
- 58.Magrané J, Sahawneh MA, Przedborski S, Estévez ÁG, Manfredi G. Mitochondrial dynamics and bioenergetic dysfunction is associated with synaptic alterations in mutant SOD1 motor neurons. J Neurosci. 2012;32:229–242. doi: 10.1523/JNEUROSCI.1233-11.2012. [DOI] [PMC free article] [PubMed] [Google Scholar]


