

Abstract
Methylglyoxal (MG) is a highly reactive dicarbonyl compound involved in the formation of advanced glycation endproducts (AGE). Levels of MG are elevated in patients with type-2 diabetes mellitus (T2DM), and AGE have been implicated in the progression of diabetic complications. The antihyperglycemic drug metformin (MF) has been suggested to be a scavenger of MG. The present work examined and characterized unequivocally the resulting scavenged product from the metformin–MG reaction. The primary product was characterized by 1H, 13C, 2D-HSQC, and HMBC NMR and tandem mass spectrometry. X-ray diffraction analysis determined the structure of the metformin and MG-derived imidazolinone compound as (E)-1,1-dimethyl-2-(5-methyl-4-oxo-4,5-dihydro-1H-imidazol-2-yI)guanidine (IMZ). A LC-MS/MS multiple reaction monitoring method was developed to detect and quantify the presence of IMZ in metformin-treated T2DM patients. Urine from >90 MF-treated T2DM patients was analyzed, with increased levels of MF directly correlating with elevations in IMZ. Urinary MF was detected in the range of 0.17 μM to 23.0 mM, and simultaneous measurement of IMZ concentrations were in the range of 18.8 nM to 4.3 μM. Since plasma concentrations of MG range from 40 nM to 4.5 μM, the level of IMZ production may be of therapeutic significance. Thus, in addition to lowering hepatic gluconeogenesis, metformin also scavenges the highly reactive MG in vivo, thereby reducing potentially detrimental MG protein adducts, with subsequent reductions in diabetic complications.
Graphical abstract
INTRODUCTION
Methylglyoxal (MG) is a highly reactive dicarbonyl found at elevated levels in the plasma of patients with type-2 diabetes mellitus (T2DM).1 MG forms adducts with susceptible amino acid residues on proteins, in particular, cysteine, lysine, and arginine.2 The reaction of MG with arginine is of interest due to the highly stable nature of the reaction product; upon reaction with arginine, MG forms a cyclized hydroimidazolone (MG-HI).3 This reaction results in the addition of 54 Da to arginine with the concomitant loss of positive charge. MG-HI modifications occur on a number of plasma proteins,4,5 and this advanced glycation end product (AGE), along with numerous others, has been implicated in the progression of T2DM complications.6,7
Metformin is a first-line T2DM therapy, with its primary role in lowering hyperglycemia due to suppression of hepatic gluconeogenesis.8 Metformin is unique among antihyperglycemic agents, as it lowers the risk of diabetes-related end points, diabetes-related death, myocardial infarction, and stroke relative to that of other glucose-lowering medications.9 Metformin is also unique in that it is linked to lower levels of AGEs.10,11 While it is possible that AGE reduction is coupled exclusively to lowered glucose levels, increased metabolism of MG by glyoxalase, and direct scavenging, have both been postulated as mechanisms for this effect.12,13
Metformin scavenging of reactive dicarbonyls, and in particular of MG, has been previously explored.10,12,14,15 Metformin is similar in structure to aminoguanidine, a known scavenger of MG. While aminoguanidine is unapproved, metformin is prescribed in one out of every two prescriptions for non-insulin antihyperglycemic therapy (60.4 million prescriptions written in 2012 in the United States). Whether the reaction between metformin and MG is a factor in reducing overall AGE burden remains to be determined, but given that plasma concentrations of metformin are ~10 μM and in excess of reported plasma concentrations of MG, this mechanism may be of therapeutic relevance.16
In the current work, we explored the chemistry of the metformin—MG reaction in detail and performed thorough structural characterization of the product(s). A brief report on the kinetics and mechanism of the metformin and MG reaction suggested that a mixture of hydroimidazolone structural isomers and tautomers form.15 A seven-membered triazepinone ring primary reaction product was postulated14 (Figure 1D) based on mass spectrometry and 13C and 1H NMR analyses. We now report that the primary product is a five-membered imidazolinone metabolite, not the previously theorized triazepinone derivative.14 Following the unequivocal identification of the metabolite, we developed a high-throughput LC-MS/MS multiple-reaction monitoring (MRM)-based assay for analysis of urinary samples from metformin-treated T2DM patients. We report rapid detection and quantitation of the imidazolinone metabolite in urine samples of T2DM patients currently treated with the drug metformin. The imidazolinone metabolite merits further study with respect to any potential pharmacological activity, in particular, at the imidazoline receptor.
Figure 1.
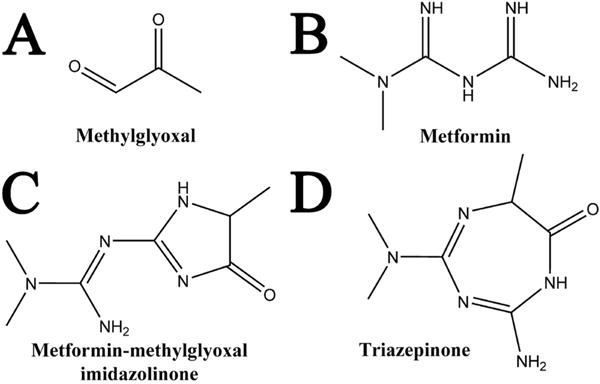
Relevant structures for the metformin–methylglyoxal reaction. Methylglyoxal (A) and metformin (B), when reacted together form a product of 183.22 Da. The structure of this product, as shown in the present work, is a metformin–methylglyoxal imidazolinone (C), though it had been previously reported as a triazepinone (D).
EXPERIMENTAL SECTION
Metformin hydrochloride [1,1-dimethylbiguanide hydrochloride] was obtained from Santa Cruz Biotechnology (Santa Cruz, CA). Methylglyoxal (40%) was purchased from Sigma-Aldrich.
Synthesis of Metformin–MG Product
Metformin–MG synthesis was slightly modified from Ruggiero-Lopez et al.14 Metformin hydrochloride salt was added to 5 mL of Milli-Q water at 4°C to a final concentration of 200 mM. Sodium hydroxide was added to the solution to a final concentration of 200 mM. Subsequently, 1.7 mL of 40% MG solution (Sigma-Aldrich) was added to the metformin solution and stirred at 4°C for 1 h followed by 4 h at 20°C. The resulting precipitate was filtered through Whatman 1 paper, dried, and stored under desiccation. Fresh solutions prepared in methanol were used for subsequent analysis.
Characterization of Metformin–MG Product
The melting point was determined on a TA Q1000 differential scanning calorimeter. Tandem mass spectrometry was performed using an Agilent 6490 triple-quadrupole instrument. The maximal UV absorbance for the compound was determined with a BioSpec-mini (Shimadzu Biotech, Kyoto, Japan).
Nuclear Magnetic Resonance of Product
The sample was dissolved in 0.7 mL of DMSO-d6, and data were acquired on a Bruker DRX-600 spectrometer at 25°C using a Nalorac 5 mm inverse HCN probe. 1H chemical shifts are referenced to residual solvent (DMSO-d5) at 2.49 ppm, and 13C chemical shifts are referenced to solvent (DMSO-d6) at 39.5 ppm. The 2D gradient heteronuclear multiple-bond correlation spectroscopy (HMBC)17 spectrum was acquired in magnitude mode with 2048 real data points in t2 and 540 points in t1, using 8 scans per FID. 1H, 13C, and full HMBC spectra can be found in Supporting Information Figures S1–S3.
Structure and Chemical Shift Calculations
Using Gaussian03, geometry optimization in the gas phase was performed with B3LYP/6-31G(d), followed by GIAO NMR parameter calculation using B3LYP/6-31+G(d,p) with implicit solvent. The chemical shifts of 13C nuclei were calculated from computed isotropic shielding using a linear model with parameters of slope −0.96 and intercept 190.0155.18
Crystallization and XRD
The synthesized product (16 μg) was dissolved at room temperature in 2:1 dimethylformamide/acetonitrile. The solvent was allowed to slowly evaporate over a period of weeks, and a clear, crystalline precipitate was formed.
The clear colorless crystals were characterized by X-ray diffraction (XRD) analysis. Single crystals of C7H13N5O were analyzed. A suitable crystal was selected and analyzed on a Bruker APEX-II CCD diffractometer. The crystals were elongated plates and diffracted well, but diffraction was streaky. The molecule crystallizes in the centrosymmetric, monoclinic space group P21/n with one molecule in the asymmetric unit and four in the unit cell. The structure refined well (final R1 = 0.0471). The crystal was kept at 150.0 K during data collection. Using Olex2,19 the structure was solved with the XT20 structure solution program using direct methods and refined with the ShelXL20 refinement package using least squares minimization.
Quantitative Analysis of the Imidazolinone Metformin Metabolite in Human Urine by Multiple Reaction Monitoring LC-MS/MS
An Agilent (Palo Alto, CA) 1260 liquid chromatograph was utilized for achieving gradient separation using an Agilent ZORBAX Hilic Plus (2.1 × 50 mm) column with a 1.8 μm particle size held at 30°C throughout the separation. A 5 μL injection of urine diluted 1:200 in Milli-Q water and snap filtered (SINGLE StEP eXtreme Filter Vial 0.2 μm PVDF; Thomson, Oceanside, CA) was used for all samples. A binary gradient consisting of 15 mM ammonium acetate in water (A) and acetonitrile (B) at a flow rate of 300 μL/min was used. The initial gradient consisted of 95% B, which was held for 1 min. After this, a linear gradient was maintained to achieve 35% B at 9 min, which was held for another minute. At 10 min, another linear change was applied to get to the initial condition of 95% B at 11 min. A post-time of 3 min was used to re-equilibrate the column before the next analysis. The total analysis time was 14 min per sample.
Mass spectrometry was performed using an Agilent 6490 triple-quadrupole mass spectrometer with an electrospray ionization (ESI) source. Two kinds of optimizations were performed for the mass spectrometer: (i) compound-specific optimization and (ii) source-dependent optimization. Compound parameters were optimized by first preparing the standards (metformin and synthesized metformin— MG metabolite) at 500 μg/mL in methanol and diluting to approximately 1 μg/mL in water. This standard was directly infused into the mass spectrometer in MS scan mode to identify the precursor mass in both positive and negative ionization modes. Subsequently, the mass spectrometer was operated in product ion scan mode and the most abundant product ions were selected. Five product ions for metformin were identified and used in the analysis (Table 1), whereas four product ions were monitored for the metformin–MG reaction product. This is higher than usual, but added to the specificity of identification of both compounds, which was the goal. Once the product ions were determined, the collision energy (CE) and cell accelerator voltage (CAV) were optimized for each transition. The analyte transitions, optimized compound parameters, and retention times are shown in Table 1. Subsequently, the mass spectrometer parameters were optimized by using the Agilent Source Optimizer software to obtain optimal conditions. All data analysis and processing was performed using the Agilent MassHunter (ver. 6.00) software. Details of the mass spectrometer operating conditions are presented in Supporting Information Table S9.
Table 1.
Optimized Parameters for MRM Assaya
| compound | cell accelerator voltage (V) | retention time (min) | polarity | precursor ion mass | product ion mass | collision energy (V) |
|---|---|---|---|---|---|---|
| metformin | 7 | 7.55 | positive | 130.2 | 113.2 | 13 |
| 85.0 | 10 | |||||
| 71.2 | 20 | |||||
| 60.0 | 13 | |||||
| 43.1 | 65 | |||||
| metformin–MG imidazolinone | 7 | 2.45 | positive | 184 | 113.0 | 16 |
| 71.2 | 28 | |||||
| 68.2 | 44 | |||||
| 44.1 | 36 | |||||
| metformin-d6 | 7 | 7.60 | positive | 136.2 | 77.2 | 24 |
| 59.9 | 8 |
Optimized parameters for multiple reaction monitoring of metformin, metformin–MG imidazolinone, and metformin–d6.
Human Sample Collection, Handling, and Storage
All subjects provided informed consent. Human Subjects Protection Program at The University of Arizona granted study approval under the project title: Proteomic and Metabolomic Biomarker Investigation of Type 2 Diabetes (project number 07-0812-01). Subjects were recruited from University Medical Center, Southern Arizona VA Health System, UPH-Kino, and El Rio diabetes and primary care clinics. Male and female subjects recruited into the study included non-diabetic, pre-type-2 diabetic, and diabetic patients, ages 19–84. Diabetic patients within the cohort ranged from newly diagnosed to >20 years with the disease. Patients remained on normal medications throughout the study, including metformin. Urine samples were collected from subjects who were instructed to fast overnight. The majority of the urine samples were single time point spot collections and were stored at −80°C in 1 mL aliquots. The total time between urine collection and sample storage was less than 1 h. For 24 h urine collection, samples were pooled over the 24 h period and were stored at −80°C in 25 mL tubes.
Human Sample Selection and Preparation
Urine samples from patients noted to be on metformin treatment were selected from our cohort. These samples were snap thawed in a water bath and diluted from between 1:50 and 1:5000 in 25 nM metformin-d6 in H2O. Samples were snap-filtered with a 0.2 μm PVDF filter prior to analysis (SINGLE StEP eXtreme Filter Vial, Thomson Instrument Company). Samples were analyzed on the developed MRM method in triplicate. During the analysis, samples were held in the autosampler at 4°C. An aliquot of each sample (1 mL) was sent to an outside laboratory for determination of urinary creatinine and specific gravity levels.
Statistical Analysis of Cohort Data
All data was imported and analyzed in GraphPad Prism 6. The r2 value was calculated from the Pearson correlation coefficient derived from the least-squares linear regression fitting of the data. To determine if the slope was significantly different than zero, extra sum of squares F test was performed and a p-value was derived from this F test. In order to prevent interpretation error, the linear regression was not forced through the origin.
RESULTS
Characterization of Metformin–MG Product
The product of the metformin–MG reaction matched the description from Ruggiero-Lopez et al.14 Differential scanning calorimetry (DSC) revealed an initial melting point of 246.5°C and a maximal melting point of 248.7 °C. Maximal UV absorbance was observed at 256.5 nm. MS/MS showed fragmentation from a parent ion of 184.0 to products of 166.7, 138.9, 113.1, 85.9, 70.9, 56.0, and 44.0.
NMR Analysis and Interpretation
The 1H spectrum in DMSO-d6 shows a CH–CH3 spin system with chemical shifts consistent with an alanine fragment (Supporting Information Figure S1). A broadened N–CH3 singlet with integral 6H corresponds to an N,N-dimethyl fragment with a barrier to rotation. A broad singlet at 7.83 ppm is typical of an amide HN proton, and two very broad singlets at 7.35 and 9.40 ppm suggest an NH2 group with hindered rotation (slow exchange broadening). The reaction of metformin and MG was expected to yield either a five-membered ring product, 1, or a seven-membered ring product, 2 (Figure 2).
Figure 2.
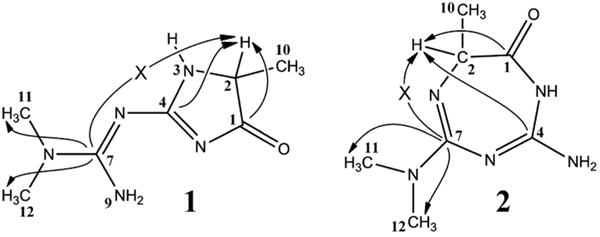
Two possible structures for the metformin–methylglyoxal reaction product. Carbon numbering from structure 1 was transferred to analogous positions in structure 2 for ease of comparison. Continuous arrows indicate selected observed HMBC correlations; arrows marked with an × correspond to HMBC correlations that are not observed.
The 2D-HMBC spectrum of the reaction product in DMSO-d6 (Figure 3) shows correlation of the N–CH3 proton singlet (H11/H12) with the quaternary 13C peak at 159.73 ppm, corresponding to C7 in structure 1. The corresponding position in structure 2 is given the same number, C7. No HMBC correlation is observed between the quartet at 3.600 ppm in the 1H spectrum (H2) and the C7 carbon shift (arrow marked with × in Figure 2). Such a correlation is expected for structure 2 (3 bonds) but not for structure 1 (5 bonds). The other two quaternary carbon peaks (C1 and C4) are correlated to H2, with a distance of 3 bonds (C4) and 2 bonds (C1) in structure (l) but a distance of 4 bonds (C4) and 2 bonds (C1) in structure 2. HMBC correlations are commonly observed only for 2 and 3 bond distances, so structure 2 is ruled out. All NMR data and assignments for structure 1 are shown in Table 2.
Figure 3.
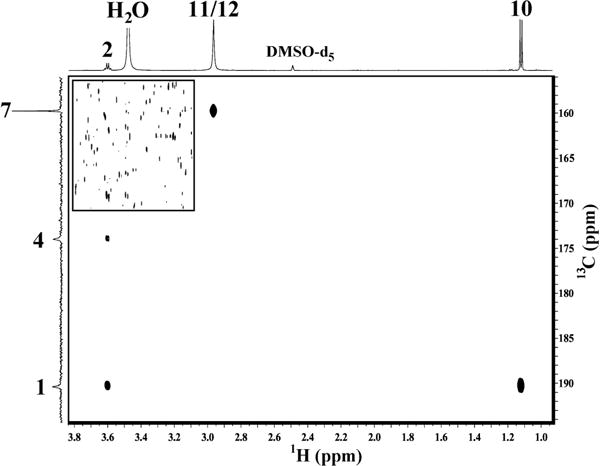
2D-HMBC of the metformin–MG product indicates a non-triazepinone-based compound. Lower (F1 downfield) region of the 2D-HMBC spectrum of the metformin–methylglyoxal reaction product in DMSO-d6. In the inset (upper left), the contour threshold is reduced to show the noise floor. The signal-to-noise ratio of the H11/12 peak in an F2 trace at C7 is greater than 1000:1, with no detectable peak at H2.
Table 2.
HMBC NMR of the Metformin–MG Reaction Producta
| position | 1H ppm | mult | J | integral | 13C ppm | HMBC |
|---|---|---|---|---|---|---|
| 1 | 190.23 | |||||
| 2 | 3.600 | q | 7.0 | 1H | 53.19 | c1,4,10 |
| 3 | 7.830 | br s | 1H | |||
| 4 | 173.92 | |||||
| 7 | 159.73 | |||||
| 9a | 7.35 | very br s | 1H | |||
| 9b | 9.40 | very br s | 1H | |||
| 10 | 1.121 | d | 7.0 | 3H | 17.63 | c1,2 |
| 11/12 | 2.964 | s | 6H | 36.86 | c7,12/11 |
Chemical shifts, multiplicity, J couplings, and HMBC correlations for the metformin–methylglyoxal reaction product. Positions correspond to the structure diagram in Figure 1. Abbreviations: mult, multiplet; s, singlet; d, doublet; q, quartet; br, broad.
The quaternary carbon peak at 190.23 ppm is assigned to C1, the carbonyl carbon connected to the CH–CH3 fragment, based on HMBC correlation to the H10 (methyl doublet) peak in the 1H spectrum. This chemical shift is more typical of a ketone carbonyl (190–220 ppm) than an amide carbonyl (170–180 ppm). Quantum-chemical calculations of 13C chemical shifts were performed on structures 1 and 2 using Guassian03, resulting in a prediction of 190.60 ppm for C1 in structure 1 and 173.42 ppm for C1 in structure 2 (Table 3). The reason for this unusual 13C chemical shift for an amide carbonyl is very likely conjugation with the extended π system (N–C4–N–C7) in structure 1, which is not present in structure 2. The predictions closely match the observed chemical shifts at all positions for structure 1, but they show significant differences for structure 2, especially at C1 and C4.
Table 3.
Differences in Chemical Shifts Expected for Metformin–MG Possible Productsa
| position | 13C observed (ppm) | calcd. (structure 1) | calcd. (structure 2) |
|---|---|---|---|
| 1 | 190.23 | 190.60 | 173.42 |
| 2 | 53.19 | 57.33 | 62.19 |
| 4 | 173.92 | 173.75 | 145.36 |
| 7 | 159.73 | 159.02 | 155.72 |
| 10 | 17.63 | 17.27 | 13.94 |
| 11,12 | 36.86 | 33.60 | 37.00 |
Observed 13C chemical shifts compared to calculated values for structures 1 and 2 of Figure 1.
Structural Determination by XRD
Analysis of the clear colorless crystal determined the structure as a five-membered imidazole compound of the empirical formula C7H13N5O with a molecular weight of 183.22 (Figure 1C). Placement of double bonds by the software Mercury ultimately led to the conclusive determination of the structure as (E)-1,1-dimethyl-2-(5-methyl-4-oxo-4,5-dihydro-1H-imidazol-2-yl)guanidine (IMZ; Figure 4). Additional data regarding X-ray diffraction can be found in Tables S1–S8, and the elucidated structure has been deposited in the Cambridge Crystallographic Data Centre with the deposition number CCDC 1445047.
Figure 4.
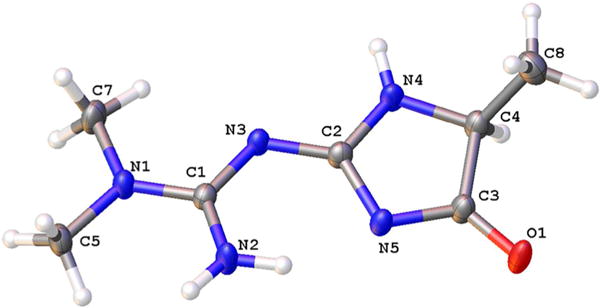
The metformin–methylglyoxal reaction product, as determined by X-ray diffraction. Molecule was determined with displacement ellipsoids at the 50% probability level.
An extensive network of hydrogen bonding was observed connecting the molecules. As a result, the double bonds observed between C1/N3 and C2/N5 are slightly longer than would have been expected, and the single bonds between C1/N2 and C2/N3 are shorter than expected. These data imply some delocalization is present in the molecule, which may account for some of the difficulty in peak assignment of the initial 1H and 13C NMR spectra.
LC-MS/MS MRM Analysis
The detection limit for metformin based on the lowest standard is 0.38 ng/mL, and the linear range was determined to be between 1.5 and 1600 ng/mL, determined by linear regression with an r2 fit of 0.9986. A smaller calibration curve for imidazolinone of 39 pg/mL to 80 ng/mL was used, as concentrations were not found to be higher in 1:50 dilutions of urine samples. A detection limit of 39 pg/mL for imidazolinone (213 pM) based on a signal-to-noise (S/N) of greater than 3 was determined. An isotope-dilution method was used for quantification of metformin using metformin-d6. Matrix spike recovery with the synthetic compound was used to verify quantification of the imidazolinone. This spike method indicated no loss of detection of the compound due to matrix or instrument. A representative parent to daughter transition for each of the three compounds monitored is shown in Figure 5. All of the MRM transitions developed and monitored are presented in Table 1.
Figure 5.
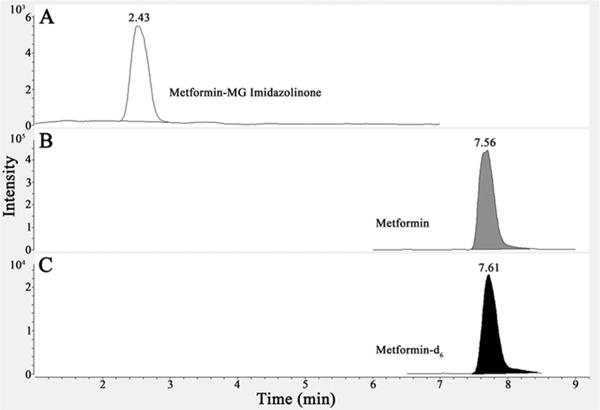
LC-MS/MS MRM identification of the imidazolinone product. Three parent compounds, metformin–MG imidazolinone (A), metformin (B), and metformin-d6 (C), are monitored in a metformin-treated T2DM urine sample. Multiple fragment peaks, as detailed in Table 2, are monitored, though only one representative peak is shown for each compound in the figure. The retention time is indicated at the top of each peak.
Metformin-Treated Patient Samples
The developed method was used to analyze 92 urine samples obtained from patients with T2DM prescribed metformin. One sample represented a replicate from the same patient collected during a follow-up visit, whereas another sample represented a 24 h urine collection from the same patient from whom a spot collection had been previously obtained. In total, 92 urine samples from 71 different patients were analyzed (Supporting Information Table S10).
Both specific gravity and creatinine were utilized to normalize urine analyte levels. However, there is evidence that creatinine excretion may be altered in patients with diabetes due to renal insufficiency,21 and this led to the decision to use specific gravity as the method for normalization of urinary analyte levels. In many cases, elevated specific gravity did not correlate with elevations in creatinine; normalization was therefore highly variable between the two methods.
Transitions specific to metformin were monitored, in addition to IMZ signals, within the developed MRM assay. Monitoring for both the precursor and the reaction product allowed for verification of patient compliance, thereby eliminating compliance as a confounding variable in this study. Ten of the patient urine samples contained no metformin, and in none of these samples was IMZ detected. In 10 other samples containing the lowest amounts of metformin, no IMZ was observed.
Concentrations between 0 and 23 mM metformin were detected in patient urine. The large variation in metformin concentrations is probably due to a combination of differences in patient dose and differences in the time of urine collection postdose. The high value is consistent with what would be expected should an entire dose of metformin be eliminated unchanged via renal excretion.22
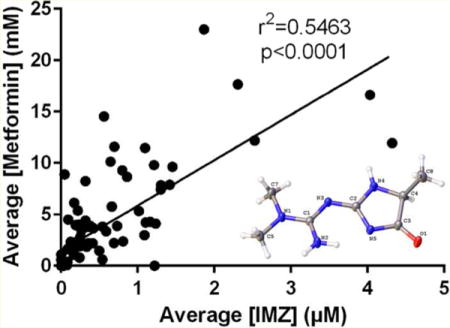
When detected, IMZ values ranged from 18.77 nM IMZ/specific gravity to μ.32 pM IMZ/specific gravity (Figure 6). Normalized to creatinine, the range was 2.47 nmol IMZ/mg creatinine to 400.04 nmol IMZ/mg creatinine. IMZ was never detected when metformin was not found to be present. The assay indicated a statistically significant r2 value calculated from the linear correlation between metformin and IMZ levels within the samples. The positive linear correlation had an r2 = 0.5463 with a significance of p < 0.0001 (Figure 7). Pooling urine samples collected over 24 h provided a stronger positive r2 value of IMZ concentrations relative to metformin. A statistically significant (p < 0.0001) positive trend was observed for the pooled samples, with r2 = 0.7348 (Figure 8). Urinary metformin concentrations ranged between 0.17 μM and 23.0 mM, with simultaneous determinations of IMZ concentrations ranging between 18.8 nM and 4.3 μM. Thus, levels of IMZ are ~6000 times lower than metformin concentrations, indicating that just 0.167% of metformin is trapped as the MG adduct.
Figure 6.
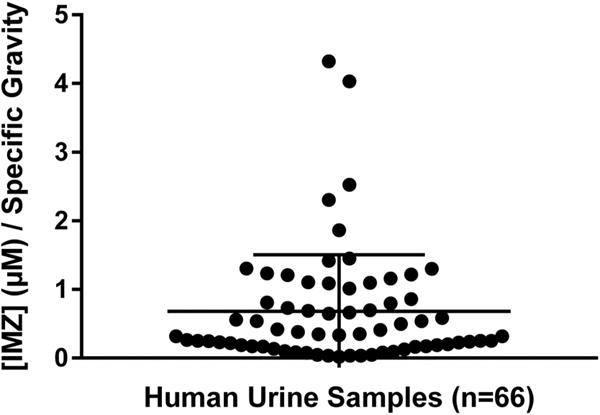
The mean concentration of IMZ detected following MRM analysis of 66 compliant metformin-treated T2DM human urine samples was in the range of 18.8 nM to 4.3 μM/specific gravity. These 66 samples represent all samples in which IMZ was detected. Sample UUU was removed from this analysis as it may have represented a false positive result. The vertical bar represents the calculated mean ± standard deviation (0.6796 ± 0.8251 μM/specific gravity).
Figure 7.
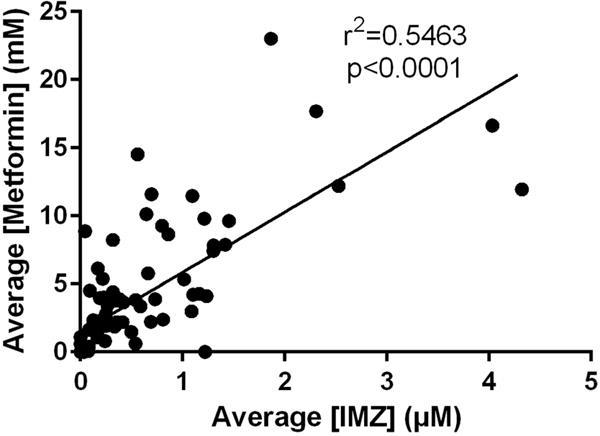
IMZ levels correlate significantly with metformin concentrations. MRM analysis of 92 metformin-treated T2DM human urine samples demonstrates that mean IMZ concentrations have a statistically significant r2 value (r2 = 0.5463; p < 0.0001) with metformin concentrations. Samples were analyzed in triplicate, and the mean value was utilized.
Figure 8.
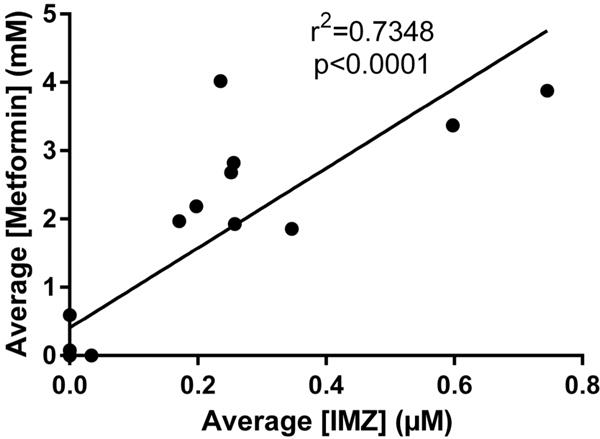
Twenty-four hour urine sample collection indicates stronger IMZ linearity with metformin. MRM analysis of eighteen 24 h urine sample collections from metformin-treated T2DM patients demonstrates that mean IMZ concentrations have a statistically significant r2 value (r2 = 0.7348; p < 0.0001) with metformin concentrations. Samples were analyzed in triplicate, and the mean value was utilized.
DISCUSSION
Previous work exploring the role of metformin in reducing MG concentrations identified the primary product of the metformin–MG reaction as a seven-membered, triazepinone-based structure (Figure 1D).14 While this structure may indeed exist, on the basis of the prior data14 we comprehensively explored the metformin–MG scavenging mechanism and determined that the triazepinone is not the predominant reaction product. The anticipated instability of the seven-membered triazepinone ring and discord with other similar types of reactions raised our concern. In particular, one of the primary products resulting from the reaction of MG with arginine is MG-HI, a hydroimidazolone five-membered ring.3 The similarity in structure between metformin and arginine led to the inference that a five-membered ring was the more likely product of the metformin–MG reaction. Moreover, the data supporting the triazepinone-based structure lacked crystallographic support, but it did not conclusively eliminate the possibility of a five-membered ring reaction product. Further analytical studies were therefore conducted to definitively elucidate the structure. Our data unequivocally identifies the primary metformin–MG reaction product as a five-membered imidazolinone, (E)-1,1-dimethyl-2-(5-methyl-4-oxo-4,5-dihydro-1H-imidazol-2-yl)guanidine. While the MS/MS data and 1H and 13C NMR data (Supporting Information) are consistent with that of the Ruggiero-Lopez et al. study,14 2D-HMBC NMR data provided the first insight that the structure is not, in fact, a seven-membered ring. Analysis of the HMBC spectrum revealed the absence of an expected correlation based on the triazepinone structure outlined (Figure 3). X-ray diffraction, following crystallization, revealed the structure of the metformin–MG reaction product as the IMZ compound identified herein.
The current work therefore outlines, for the first time, a rapid, comprehensive method for simultaneously assaying metformin and the metformin–MG scavenged IMZ metabolite in urine from metformin-treated T2DM patients. IMZ was readily detectable in the range of 18.8 nM to 4.3 μM via the LC-MS/MS MRM assay from urine samples of patients. Simultaneous measurements of metformin concentrations were in the range of 0.17 μM to 23.0 mM. IMZ was also detectable in a plasma sample (from the patient with the highest urinary concentration of IMZ), analyzed at a 1:1000 dilution, suggesting that the method can be expanded to other biological matrices. The formation of IMZ is metformin concentration-dependent, as evidenced by the significant positive r2 value calculated from the linear correlation between drug concentrations and IMZ levels. The levels of IMZ detected may be therapeutically significant (see below), as reported plasma concentrations of MG range from 40 nM to 4.5 μM,25–29 thus providing further indication of metformin’s scavenging capabilities.
Lowering circulating levels of reactive dicarbonyls, such as MG, represents a viable therapeutic strategy for decreasing diabetic complications, but targeted pharmacological sequestration of MG and other reactive dicarbonyls has not been pursued. While drugs such as aminoguanidine possess dicarbonyl scavenging properties, no drug has been successfully developed to specifically scavenge dicarbonyls as a therapeutic strategy for diabetes. However, the present data reveal that the widely used first-line antihyperglycemic drug metformin effectively scavenges MG, and presumably other similar dicarbonyls, thereby potentially lowering the overall dicarbonyl toxicant load. Identification of a metformin–MG scavenged product reveals that metformin possesses a potential secondary mechanism of lowering the AGEs and MG burden. While it remains likely that the primary mechanism of AGE reduction following metformin treatment occurs via improved glycemic control, the unique structure of metformin also facilitates a direct scavenging mechanism to directly eliminate MG from the body. Although the rate of the reaction between metformin and MG may be relatively slow,15 the prolonged presence of metformin in blood at concentrations as high as 15 μM, and in excess of plasma [MG], would suggest that this mechanism contributes to the reduction of MG levels in humans. We emphasize that the current human samples are from a study that was not designed specifically for the examination of metformin-derived MG adducts and therefore variability in the amount of metformin prescribed, patient compliance, and spot collection of urine all present obstacles for the further analysis of the data.
Definitive identification of the 183 Da metformin–MG reaction product as a five-membered imidazolinone ring, rather than as a triazepinone, may also have significant therapeutic implications. Recent work revealed that ligand activation of the imidazoline receptor (I1R) enhances insulin action in PC12 cells.23 The novel I1R agonist S43126 (2-[4′-methoxyphenyl]-4,5-dihydro-1H-imidazole) and the known antihypertensive and I1R agonist moxonidine are both capable of engaging this phenomenon. Moreover, moxonidine normalizes plasma insulin levels in an animal model and improves glucose uptake in peripheral cells.24 The metformin–MG imidazolinone identified herein therefore warrants further study with respect to its pharmacokinetic and potential pharmacodynamic properties, its ability to exhibit ligand activity at I1R, and whether insulin sensitivity may be enhanced as a result.
In summary, the mechanism(s) of metformin’s efficacy in reducing diabetic complications appear to be multifaceted. Thus, in addition to lowering hepatic gluconeogenesis, metformin also scavenges the highly reactive MG, forming an IMZ metabolite in vivo and thereby reducing potentially detrimental MG protein adducts, which may contribute to a reduction in diabetic complications. More controlled future studies should aid in assessing the extent to which IMZ plays in reducing AGEs. The potential pharmacological properties of IMZ also deserve further investigation. Finally, a priority for future studies should be an accurate determination of MG in plasma and urine, which should assist in interpreting the significance of the correlation between MG concentrations and IMZ formation identified in this study (Figure 7).
Supplementary Material
Acknowledgments
We would like to thank Dr. Sue Roberts (University of Arizona, Department of Chemistry) for analyzing and determining the crystal structure of the imidazolinone compound. Additionally, we would like to thank Dr. Stephen Franklin for his assistance with the DSC of the compound.
Funding
This work was supported by the National Institutes of Health, National Institute of Diabetes and Digestive and Kidney Diseases R24DK090958 (S.S.L.), National Institute of Environmental Health Sciences, P30 ES006694 Pilot Project (S.S.L.), T32 ES007091 (O.R.K.), and Arizona Biomedical Research Commission 1115 (S.S.L.).
ABBREVIATIONS
- MG
methylglyoxal
- T2DM
type-2 diabetes mellitus
- AGEs
advanced glycation endproducts
- MF
metformin
- IMZ
(E)-1,1-dimethyl-2-(5-methyl-4-oxo-4,5-dihydro-1H-imidazol-2-yl)-guanidine
- MG-HI
methylglyoxal-derived hydroimidazolone
- MRM
multiple-reaction monitoring
- HMBC
heteronuclear multiple-bond correlation spectroscopy
- XRD
X-ray diffraction
- ESI
electrospray ionization
- CE
collision energy
- CAV
cell accelerator voltage
- DSC
differential scanning calorimetry
- I1R
imidazoline receptor
Footnotes
Supporting Information
The Supporting Information is available free of charge on the ACS Publications website at DOI: 10.1021/acs.chemres-tox.5b00497.
Crystal data and structure refinement for metformin–MG imidazolinone (Table S1); fractional atomic coordinates and equivalent isotropic displacement parameters (Table S2); anisotropic displacement parameters (Table S3); bond lengths (Table S4); bond angles (Table S5); hydrogen bonds (Table S6); torsion angles (Table S7); hydrogen atom coordinates and isotropic displacement parameters (Table S8); optimized mass spectrometer conditions (Table S9); determined concentrations of IMZ and metformin using MRM assay (Table S10); 1H spectrum of compound 1 in DMSO-d6 at 25°C (Figure S1); 13C spectrum of compound 1 in DMSO-d6 at 25°C (Figure S2); HMBC spectrum of compound 1 in DMSO-d6 at 25 °C (Figure S3); and proposed mass spectrometry fragmentation pattern of IMZ compound (Figure S4) (PDF)
Notes
The authors declare no competing financial interest.
References
- 1.Kalapos MP. Where does plasma methylglyoxal originate from? Diabetes Res Clin Pract. 2013;99:260–271. doi: 10.1016/j.diabres.2012.11.003. [DOI] [PubMed] [Google Scholar]
- 2.Lo TW, Westwood ME, McLellan AC, Selwood T, Thornalley PJ. Binding and modification of proteins by methylglyoxal under physiological conditions. A kinetic and mechanistic study with N alpha-acetylarginine, N alpha-acetylcysteine, and N alpha-acetyllysine, and bovine serum albumin. J Biol Chem. 1994;269:32299–32305. [PubMed] [Google Scholar]
- 3.Ahmed N, Thornalley PJ, Dawczynski J, Franke S, Strobel J, Stein G, Haik GM. Methylglyoxal-derived hydroimidazolone advanced glycation end-products of human lens proteins. Invest Ophthalmol Visual Sci. 2003;44:5287–5292. doi: 10.1167/iovs.03-0573. [DOI] [PubMed] [Google Scholar]
- 4.Kimzey MJ, Yassine HN, Riepel BM, Tsaprailis G, Monks TJ, Lau SS. New site(s) of methylglyoxal-modified human serum albumin, identified by multiple reaction monitoring, alter warfarin binding and prostaglandin metabolism. Chem-Biol Interact. 2011;192:122–128. doi: 10.1016/j.cbi.2010.09.032. [DOI] [PMC free article] [PubMed] [Google Scholar]
- 5.Thornalley PJ, Battah S, Ahmed N, Karachalias N, Agalou S, Babaei-Jadidi R, Dawnay A. Quantitative screening of advanced glycation endproducts in cellular and extracellular proteins by tandem mass spectrometry. Biochem J. 2003;375:581–592. doi: 10.1042/BJ20030763. [DOI] [PMC free article] [PubMed] [Google Scholar]
- 6.Beisswenger PJ, Drummond KS, Nelson RG, Howell SK, Szwergold BS, Mauer M. Susceptibility to diabetic nephropathy is related to dicarbonyl and oxidative stress. Diabetes. 2005;54:3274–3281. doi: 10.2337/diabetes.54.11.3274. [DOI] [PubMed] [Google Scholar]
- 7.Brownlee M. Biochemistry and molecular cell biology of diabetic complications. Nature. 2001;414:813–820. doi: 10.1038/414813a. [DOI] [PubMed] [Google Scholar]
- 8.Kim YD, Park KG, Lee YS, Park YY, Kim DK, Nedumaran B, Jang WG, Cho WJ, Ha J, Lee IK, Lee CH, Choi HS. Metformin inhibits hepatic gluconeogenesis through AMP-activated protein kinase-dependent regulation of the orphan nuclear receptor SHP. Diabetes. 2008;57:306–314. doi: 10.2337/db07-0381. [DOI] [PubMed] [Google Scholar]
- 9.UK Prospective Diabetes Study (UKPDS) Group. Effect of intensive blood-glucose control with metformin on complications in overweight patients with type 2 diabetes (UKPDS 34) Lancet. 1998;352:854–865. [PubMed] [Google Scholar]
- 10.Beisswenger P, Ruggiero-Lopez D. Metformin inhibition of glycation processes. Diabetes Metab. 2003;29:6S95–103. doi: 10.1016/s1262-3636(03)72793-1. [DOI] [PubMed] [Google Scholar]
- 11.Kiho T, Kato M, Usui S, Hirano K. Effect of buformin and metformin on formation of advanced glycation end products by methylglyoxal. Clin Chim Acta. 2005;358:139–145. doi: 10.1016/j.cccn.2005.02.012. [DOI] [PubMed] [Google Scholar]
- 12.Beisswenger PJ. Methylglyoxal in diabetes: link to treatment, glycaemic control and biomarkers of complications. Biochem Soc Trans. 2014;42:450–456. doi: 10.1042/BST20130275. [DOI] [PubMed] [Google Scholar]
- 13.Kender Z, Fleming T, Kopf S, Torzsa P, Grolmusz V, Herzig S, Schleicher E, Racz K, Reismann P, Nawroth PP. Effect of metformin on methylglyoxal metabolism in patients with type 2 diabetes. Exp Clin Endocrinol Diabetes. 2014;122:316–319. doi: 10.1055/s-0034-1371818. [DOI] [PubMed] [Google Scholar]
- 14.Ruggiero-Lopez D, Lecomte M, Moinet G, Patereau G, Lagarde M, Wiernsperger N. Reaction of metformin with dicarbonyl compounds. Possible implication in the inhibition of advanced glycation end product formation. Biochem Pharmacol. 1999;58:1765–1773. doi: 10.1016/s0006-2952(99)00263-4. [DOI] [PubMed] [Google Scholar]
- 15.Battah S, Ahmed N, Thornalley PJ. Kinetics and mechanism of the reaction of metformin with methylglyoxal. Int Congr Ser. 2002;1245:355–356. [Google Scholar]
- 16.Hampp C, Borders-Hemphill V, Moeny DG, Wysowski DK. Use of antidiabetic drugs in the U.S., 2003–2012. Diabetes Care. 2014;37:1367–1374. doi: 10.2337/dc13-2289. [DOI] [PubMed] [Google Scholar]
- 17.Summers MF, Marzilli LG, Bax A. Complete proton and carbon-13 assignments of coenzyme B12 through the use of new two-dimensional NMR experiments. J Am Chem Soc. 1986;108:4285–4294. [Google Scholar]
- 18.Lodewyk MW, Siebert MR, Tantillo DJ. Computational prediction of 1H and 13C chemical shifts: a useful tool for natural product, mechanistic, and synthetic organic chemistry. Chem Rev. 2012;112:1839–1862. doi: 10.1021/cr200106v. [DOI] [PubMed] [Google Scholar]
- 19.Dolomanov OV, Bourhis LJ, Gildea RJ, Howard JAK, Puschmann H. OLEX2: A complete structure solution, refinement and analysis program. J Appl Crystallogr. 2009;42:339–341. [Google Scholar]
- 20.Sheldrick GM. A short history of SHELX. Acta Crystallogr, Sect A: Found Crystallogr. 2008;64:112–122. doi: 10.1107/S0108767307043930. [DOI] [PubMed] [Google Scholar]
- 21.Yassine H, Kimzey MJ, Galligan MA, Gandolfi AJ, Stump CS, Lau SS. Adjusting for urinary creatinine overestimates arsenic concentrations in diabetics. CardioRenal Med. 2012;2:26–32. doi: 10.1159/000334225. [DOI] [PMC free article] [PubMed] [Google Scholar]
- 22.Sirtori CR, Franceschini G, Galli-Kienle M, Cighetti G, Galli G, Bondioli A, Conti F. Disposition of metformin (N,N-dimethylbiguanide) in man. Clin Pharmacol Ther. 1978;24:683–693. doi: 10.1002/cpt1978246683. [DOI] [PubMed] [Google Scholar]
- 23.Tesfai J, Crane L, Baziard-Mouysset G, Kennedy W, Edwards LP. Novel I1-imidazoline S43126 enhance insulin action in PC12 cells. Pharmacol Rep. 2011;63:1442–1449. doi: 10.1016/s1734-1140(11)70708-3. [DOI] [PubMed] [Google Scholar]
- 24.Edwards LP, Brown-Bryan TA, McLean L, Ernsberger P. Pharmacological properties of the central antihypertensive agent, moxonidine. Cardiovasc Ther. 2012;30:199–208. doi: 10.1111/j.1755-5922.2011.00268.x. [DOI] [PubMed] [Google Scholar]
- 25.Dhar A, Desai K, Liu J, Wu L. Methylglyoxal, protein binding and biological samples: are we getting the true measure? J Chromatogr B: Anal Technol Biomed Life Sci. 2009;877:1093–1100. doi: 10.1016/j.jchromb.2009.02.055. [DOI] [PubMed] [Google Scholar]
- 26.Khuhawar MY, Zardari LA, Laghari AJ. Capillary gas chromatographic determination of methylglyoxal from serum of diabetic patients by precolumn derivatization with 1,2-diamonopropane. J Chromatogr B: Anal Technol Biomed Life Sci. 2008;873:15–19. doi: 10.1016/j.jchromb.2008.04.048. [DOI] [PubMed] [Google Scholar]
- 27.Rabbani N, Thornalley PJ. Glyoxalase in diabetes, obesity and related disorders. Semin Cell Dev Biol. 2011;22:309–317. doi: 10.1016/j.semcdb.2011.02.015. [DOI] [PubMed] [Google Scholar]
- 28.Rabbani N, Thornalley PJ. Dicarbonyl proteome and genome damage in metabolic and vascular disease. Biochem Soc Trans. 2014;42:425–432. doi: 10.1042/BST20140018. [DOI] [PubMed] [Google Scholar]
- 29.Thornalley PJ, Rabbani N. Assay of methylglyoxal and glyoxal and control of peroxidase interference. Biochem Soc Trans. 2014;42:504–510. doi: 10.1042/BST20140009. [DOI] [PubMed] [Google Scholar]
Associated Data
This section collects any data citations, data availability statements, or supplementary materials included in this article.