Abstract
The ethylene-forming enzyme (EFE) from Pseudomonas syringae pv. phaseolicola PK2 is a member of the mononuclear non-heme Fe(II)- and 2-oxoglutarate (2OG)-dependent oxygenase superfamily. This enzyme is reported to simultaneously catalyze the conversion of 2OG into ethylene plus three CO2 and the Cδ hydroxylation of L-arginine (L-Arg) while oxidatively decarboxylating 2OG to form succinate and carbon dioxide. A new plasmid construct for expression in recombinant Escherichia coli cells allowed for the purification of large amounts of EFE with greater activity than previously recorded. A variety of assays were used to quantify and confirm the identity of the proposed products, including the first experimental demonstration of L-Δ1-pyrroline-5-carboxylate and guanidine derived from 5-hydroxyarginine. Selected L-Arg derivatives could induce ethylene formation without undergoing hydroxylation, demonstrating that ethylene production and L-Arg hydroxylation activities are not linked. Similarly, EFE utilizes the alternative α-keto acid 2-oxoadipate as a co-substrate (forming glutaric acid) during the hydroxylation of L-Arg, with this reaction unlinked from ethylene formation. Kinetic constants were determined for both the ethylene formation and L-Arg hydroxylation reactions. Anaerobic UV-visible difference spectra were used to monitor the binding of Fe(II) and substrates to the enzyme. Based on our results and what is generally known about EFE and Fe(II)/2OG-dependent oxygenases, an updated model for the reaction mechanism is presented.
Graphical abstract
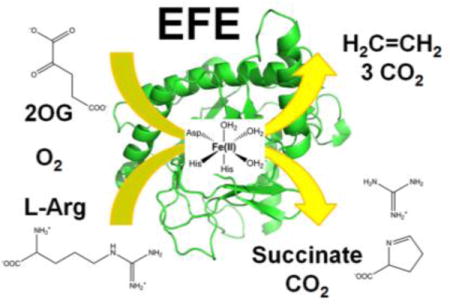
Ethylene gas is widely used as a building block in the production of various plastics, detergents, surfactants, antifreeze, solvents, and other important industrial materials. Over 140 million metric tons per year of ethylene are produced worldwide and its demand is projected to increase in the coming years.1 Natural gas serves as the primary feedstock of ethylene, which is formed by processes including steam cracking of naphtha and thermal cracking of ethane.2 These production methods lead to high emissions into the atmosphere of carbon dioxide and other greenhouse gases;2 therefore, alternative sustainable methods for ethylene production from renewable sources are being sought.
The biological production of ethylene occurs in plants and certain microbes. Ethylene is a plant hormone that plays an important role in growth and development.3 To synthesize ethylene, plants utilize a pathway that transforms L-methionine to S-adenosyl-L-methionine using S-adenosyl-L-methionine synthetase, cyclizes this intermediate to 1-aminocyclopropane-1-carboxylic acid (ACC) using ACC synthase, and converts ACC to ethylene, CO2, and HCN using ACC oxidase.4 In Escherichia coli and Cryptococcus albidus, ethylene is produced from 2-oxo-4-methylthiobutyric acid (the derivative of methionine following transamination) by an NADH:Fe(III)-EDTA oxidoreductase.5, 6 Plant-associated microbes such as the bacteria Pseudomonas syringae and Ralstonia solanacearum or the fungus Penicillium digitatum have been reported to synthesize ethylene via an alternative process involving the ethylene-forming enzyme (EFE).7, 8 This member of the Fe(II)/2-oxoglutarate (2OG)-dependent oxygenase superfamily9 uses Fe(II), 2OG, oxygen, and L-Arg for the synthesis of ethylene. Of particular interest, recombinant organisms producing EFE have been promoted for developing ethylene as a biofuel.10–13
Biochemical characterization of the reaction catalyzed by EFE is most advanced for the enzyme from Pseudomonas syringae pv. phaseolicola PK2, in work that was carried out a quarter century ago.14–17 Those early studies showed that ethylene is derived from 2OG,14 demonstrated the requirement of L-Arg for ethylene formation,17 reported that L-Arg was consumed, and suggested (without providing any experimental evidence) that L-Δ1-pyrroline-5-carboxylate (P5C) and guanidine were produced by oxidation of L-Arg.16 This early work led to a proposed dual-circuit reaction mechanism (Scheme 1) with two molecules of 2OG converted to ethylene for each 2OG used for hydroxylation of L-Arg.16 It was suggested (without supporting evidence) that L-Arg binds first, that 2OG then forms a Schiff base with the bound amino acid, that this complex provides three ligands to the metallocenter with two additional ligands derived from side chains of the protein, and that a peroxo intermediate is used for both the ethylene-forming and L-Arg hydroxylation reactions. Several aspects of this scheme are inconsistent with recent advances in our mechanistic understanding of the Fe(II)/2OG oxygenases.9, 18 Furthermore, a recent study reported a homology model of EFE that, along with site-directed mutagenesis results, allowed for the putative identification of three amino acid side chain ligands (H189, D191, and H268) to the metal.19
Scheme 1.
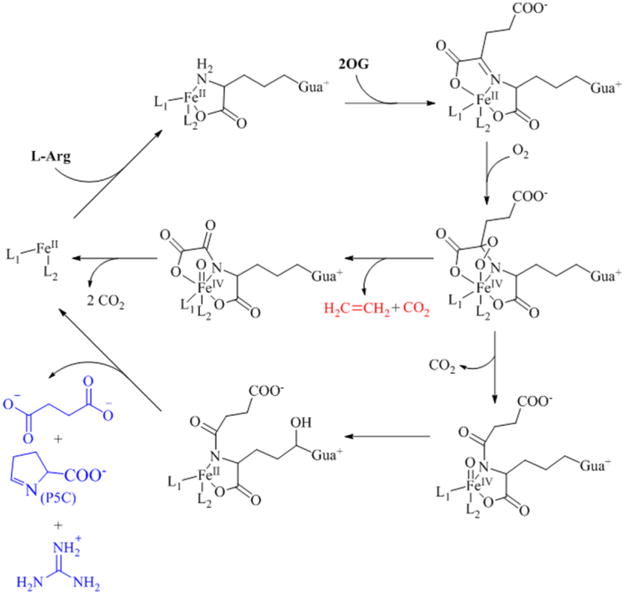
Previously Proposed Dual Circuit Mechanism of EFE
Members of the Fe(II)/2OG-dependent oxygenases typically catalyze the oxidative decarboxylation of the co-substrate, 2OG, concomitant with achieving one of various types of oxidative transformations of a primary substrate.18 We suggest that EFE catalyzes such a reaction, with L-Arg undergoing hydroxylation at the Cδ position as 2OG is converted to succinate and CO2 (Scheme 2, top); however, this enzyme also transforms 2OG into ethylene and CO2 (Scheme 2, bottom). The latter reaction has not been reported for any other family member, including other Fe(II)/2OG-dependent oxygenases that utilize L-Arg for a substrate such as VioC that hydroxylates L-Arg at Cβ to generate (3S)-hydroxy-Arg during the biosynthesis of viomycin;20 Qcn18 and Cya18, that catalyze the dehydrogenation of L-Arg at Cγ-Cδ to form L-(E)-4,5-dehydroarginine during biosynthesis of the antitumor antibiotics quinocarcin and SF-1739;21 and OrfP, that catalyzes the double hydroxylation of L-Arg forming (3R,4R)-dihydroxy-L-Arg during the biosynthesis of streptothricin F.22
Scheme 2.
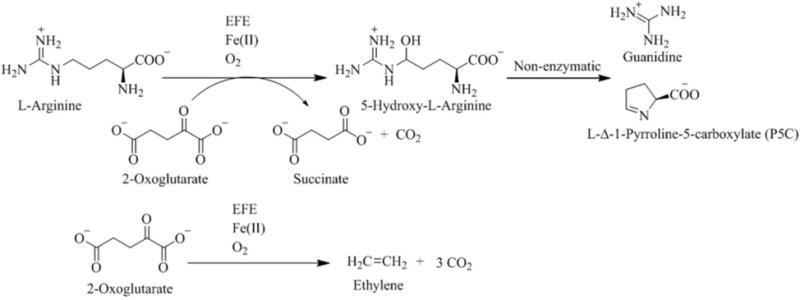
Reactions Catalyzed by the Ethylene Forming Enzyme (EFE)
In an effort to further characterize EFE from P. syringae pv. phaseolicola PK2, we have developed a new construct for its expression in E. coli. Purification of the histidine-tagged protein and subsequent cleavage of the tag resulted in large yields of highly active enzyme. We show that the ethylene-forming reaction is not intrinsically linked to L-Arg hydroxylation by two methods: selected L-Arg derivatives can induce ethylene formation without themselves being metabolized, and 2-oxoadipate (2OA), as an alternative co-substrate of EFE, allows for hydroxylation of L-Arg without formation of ethylene. These substrate analogue studies also reveal a third reaction catalyzed by the enzyme, the oxidative decarboxylation of 2OG in the presence of ascorbate. Kinetic constants for each of the substrates were obtained. Lastly, anaerobic UV-visible difference spectra were used to obtain Kd values for Fe(II) and substrate binding.
EXPERIMENTAL PROCEDURES
Plasmid Construction
A pUC19-derived plasmid containing the EFE gene (pUC19-efe-His6) was kindly provided by Jianping Yu (National Renewable Energy Laboratory) and used as a template for the polymerase chain reaction (PCR) with Q5 High fidelity DNA polymerase (New England BioLabs). The following primers (Integrated DNA Technologies, Inc.) were used for the PCR: forward 5′- GGG AAT TCC ATATGA CCA ATT TGC AAA CTT TTG AAT TAC CC -3′ and reverse 5′- CGC GGATCC TTA GCT ACC AGT AGC GCG AGT GTC ACT GTATTT TTT CAA ATC TTC CAG ATG -3′. The PCR product was digested with NdeI and BamHI restriction enzymes and ligated into a modified pET28a+ vector with codons for an N-terminal His6 tag and a tobacco etch virus (TEV) protease cleavage site (and carrying kanamycin resistance). After the plasmid was verified by DNA sequencing (RTSF Genomics Core at Michigan State University), it was transformed into E. coli BL21 Gold (DE3) cells (Agilent Technologies).
Protein Production and Purification
A single colony of the strain described above was used to inoculate 50 mL of Luria Broth medium that was supplemented with kanamycin (50 μg/mL) and grown overnight at 37 °C with constant shaking. The next day, 1 L of Terrific Broth supplemented with 50 μg/mL of kanamycin was inoculated with 10 mL of the overnight culture. The cells were grown at 37 °C with constant shaking until the optical density at 600 nm reached ~0.8 – 1.0, cooled to 20 °C, induced with isopropyl β-D-1-thiogalactopyranoside to a final concentration of 0.2 mM, and incubated overnight at this temperature (typically for 16 – 18 h). The next day, the culture was harvested by centrifugation at 6,130 g, 4 °C, for 10 min. The cells were frozen in liquid nitrogen and stored at −80 °C until further usage.
The cell pellet was thawed, resuspended in buffer A (50 mM NaH2PO4, pH 8.0, 500 mM NaCl, 10 mM imidazole) and lysed by sonication on ice using a Branson Sonifier 450 (30 sec on/30 sec off cycles at 30% duty cycle for a total process time of 10 min). Cell debris was removed by centrifugation at 34,220 g and 4 °C for 20 min. Clarified lysate was applied to a 10 mL nickel-nitrilotriacetic acid (Ni-NTA) agarose column (Qiagen), unbound proteins were eluted with 100 mL of buffer A, and the His6-EFE protein was eluted with 50 mL buffer B (buffer A adjusted to 250 mM imidazole).
The desired protein fractions obtained from the Ni-NTA purification were transferred to a 10 kDa molecular-weight-cut-off Amicon Ultra-15 centrifugal filter unit (EMD Millipore) for concentration and buffer exchange into 50 mM NaH2PO4, pH 8.0, and 500 mM NaCl. For His-tag removal by proteolytic cleavage, the concentrated protein was incubated with His7-TEV238Δ protease for 16–18 h at 4 °C with gentle stirring. The His7-TEV238Δ protease was produced and purified using a published protocol.23 Following overnight digestion, the EFE and TEV protease mixture was applied to the 10 mL Ni-NTA column which had been equilibrated with buffer A, and the flow-through fractions were pooled, concentrated, and dialyzed overnight into 25 mM 4-(2-hydroxyethyl)-1-piperazineethanesulfonic acid (HEPES) buffer, pH 8.0, containing 1 mM ethylenediaminetetraacetic acid (EDTA) and 1 mM dithiothreitol (DTT). Glycerol was added to a final concentration of 5%, and the sample was flash-frozen in liquid nitrogen and stored at −80 °C.
Protein Analysis Methods
The purity of the obtained protein was assessed by sodium dodecyl sulfate-polyacrylamide gel electrophoresis (SDS-PAGE) on a 12% gel and stained with Coomassie brilliant blue. Protein concentrations were determined by the Bradford Assay (Bio-Rad) using bovine serum albumin as the standard protein.
The native size of the protein was examined by size exclusion chromatography coupled to multi-angle light scattering (SEC-MALS) detection. This analysis was performed at room temperature using a HiLoad 16/600 Superdex 75 prep grade (GE Healthcare Life Sciences) connected to a Wyatt MiniDawn TREOS Multi-Angle Static Light Scattering detector coupled to a Wyatt Optilab T-rEX refractive index detector. Data were analyzed using Astra 6 software (Wyatt Technology Corp.). 1 mL of 2.8 mg/mL protein was loaded onto the column and eluted in 25 mM HEPES buffer, pH 8.0, containing 100 mM NaCl, at a flow rate of 0.3 mL/min.
The protein size also was determined by electrospray ionization-mass spectrometry (ESI-MS). Protein samples from three independent purifications were prepared to a final concentration of 5 μM in 25 mM Tris(hydroxymethyl)aminomethane (Tris) buffer, pH 8.0, containing 1 mM DTT. The protein samples (10 μL) were injected onto a Waters Acquity ultra performance liquid chromatography system (UPLC) coupled to a Waters Xevo G2-S QTof mass spectrometer. Separation was achieved by using a BetaBasic CN 10 mm × 1-mm column (5 μm particle size; Thermo Scientific), a mobile phase of 0.1% formic acid, and a 15 min gradient of increasing acetonitrile at 30 °C. Protein masses were calculated from the ESI-MS spectra using an advanced maximum entropy-based procedure included in the Micromass MassLynx software package.
Assays for Quantifying Substrate Consumption and Product Formation
The standard assay was performed at 25 ± 1°C in 10 × 16 mm Vacutainer glass tubes (Becton Dickinson). EFE (252 nM) was incubated in 2 mL of 10 mM NH4HCO3 buffer, pH 7.5, containing 0.5 mM 2OG, 0.5 mM L-Arg or L-Arg derivative, 0.2 mM (NH4)2Fe(SO4)2, and 0.4 mM L-ascorbic acid with gentle shaking. The reactions were terminated at designated time points with 0.1 mL of 20% formic acid. Ethylene formation was measured by withdrawing 0.25 mL of the headspace (or 1 mL for the L-Arg derivatives) with a Hamilton gastight syringe and injecting it into a gas chromatograph (GC; Shimadzu GC-8A) equipped with a flame ionization detector and a Porapak N-packed column (80/100 mesh, 2 m by 1/8 in.). The instrument was calibrated using known concentrations of ethylene (SCOTTY Analyzed Gases, 99.5%).
After the ethylene measurement, the rubber septa from the tubes were removed and the reaction mixtures were supplemented with L-phenylalanine to a final concentration of 498 μM to serve as an internal standard for the LC-MS analysis. The concentrations of remaining L-Arg or L-Arg derivative and guanidine were determined by LC-MS using a Waters Quattro Micro API mass spectrometer coupled to a Shimadzu LC-20AD HPLC and SIL-5000 autosampler. Separation was achieved by injecting 10 μL of sample onto a Symmetry C18 column (100 mm × 2.1 mm, 3.5 μm particle size; Waters) operated at 30 °C using a mobile phase of 1 mM aqueous perfluoropentanoic acid at a flow rate of 0.3 mL/min with increasing concentrations of acetonitrile (or methanol for detection of guanidine) over 6 min. The ESI-MS analysis was performed using the positive single-ion monitoring mode.
The concentrations of succinate and remaining 2OG were determined by using a Waters 1525 Binary HPLC pump coupled to a Waters 2414 Refractive Index detector and a Waters 2487 Dual λ Absorbance detector. An aliquot of the reaction (200 μL) was injected onto an Aminex HPX-87H column (300 mm × 7.8 mm, Bio-Rad). Separation was achieved by using an isocratic gradient with 4 mM H2SO4 at a flow rate of 0.6 mL/min for 30 min at 60 °C. Concentrations were determined by comparison to standard curves prepared with authentic 2OG and succinate.
Concentrations of P5C were determined by derivatization with 2-aminobenzaldehyde24. An aliquot (0.5 mL) of the reaction was mixed with 0.5 mL of 10 mM 2-aminobenzaldehyde in 40% ethanol. The samples were then incubated at 37 °C for 20 min to develop the yellow adduct and the absorbance was measured at 440 nm, using an extinction coefficient of 2.58 mM−1 cm−1.
For the reaction of EFE with 2OA and L-Arg, the protein (504 nM) was incubated in 2 mL of 10 mM NH4HCO3 buffer, pH 7.5, containing 0.3 mM 2OA, 0.5 mM L-Arg, 0.2 mM (NH4)2Fe(SO4)2, and 0.4 mM L-ascorbic acid at 25 °C with gentle shaking. The reactions were terminated at designated time points with 0.1 mL of 20% formic acid and supplemented with the internal standard, L-phenylalanine, to a final concentration of 498 μM. The concentrations of 2OA and glutarate were determined by HPLC as described above, but with a mobile phase of 12 mM H2SO4 and using a standard curve that was generated with known concentrations of authentic 2OA and glutarate. In these studies, L-Arg and guanidine were measured by LC-MS, and the concentrations of P5C were determined by derivatization with 2-aminobenzaldehyde.
For pH dependence studies, the following buffers were used: sodium acetate (pH 4.5–5.5), 2-(N-morpholino)ethanesulfonic acid (MES; pH 5.5–6.5), HEPES (pH 6.5–8.0), bis-Tris propane (pH 7.5–9.0), and 2-(cyclohexylamino)ethanesulfonic acid (CHES; pH 9.0–10.0). The assay (2 mL) consisted of 40 mM buffer, at the pH indicated, containing EFE (505 nM), 0.5 mM 2OG, 0.5 mM L-Arg, 0.2 mM (NH4)2Fe(SO4)2, and 0.4 mM L-ascorbic acid with gentle shaking. The reactions were terminated at designated time points with 0.1 mL of 0.5 M HCl acid. Ethylene, succinate, P5C, and remaining 2OG were measured as described above.
Steady-State Kinetics
A typical 1 mL assay reaction used 25–125 nM EFE in 40 mM HEPES buffer, pH 7.5, containing 0.2 mM (NH4)2Fe(SO4)2, 0.4 mM L-ascorbic acid, and appropriate concentrations of 2OG and L-Arg. Kinetic parameters for 2OG and L-Arg were determined by keeping the concentration of one substrate constant at 500 μM while varying the concentrations of the other substrate (0 – 640 μM). The reactions were terminated at designated time points by injecting 0.1 mL of 0.5 M HCl. Subsequently, 1 mL of the headspace was withdrawn and analyzed by GC for ethylene as described above.
For measuring P5C formation, the reactions were terminated with 0.1 mL of 3.6 M HCl and the samples were derivatized with 2% ninhydrin.25, 26 Specifically, 0.25 mL of 2% ninhydrin in water was added to each sample and the mixtures were heated to 100 °C for 15 min, cooled, and centrifuged at 3234 g for 10 min at 4 °C. In each case, the supernatant was decanted, the red pigment resuspended in 1 mL of 50 mM Tris buffer (pH 8.0)/47.5% ethanol to form a blue complex, and the absorbance measured at 620 nm using an extinction coefficient of 1.96 × 10⁵ M−1 cm−1 for the P5C-ninhydrin colored adduct.26
To obtain the kinetic constants for the EFE-catalyzed reaction of 2OA and L-Arg, the standard assay was performed at 25 ± 1°C in 2.0 mL micro-centrifuge tubes. The 1 mL assay reaction consisted of 378 nM EFE in 40 mM HEPES buffer, pH 7.5, containing 0.2 mM (NH4)2Fe(SO4)2, 0.4 mM L-ascorbic acid, and appropriate concentrations of 2OA and L-Arg. Kinetic parameters for 2OA and L-Arg were determined by keeping the concentration of one substrate constant at 500 μM and varying the concentration of the other substrate (0 – 620 μM). The reactions were terminated at designated time points with 0.1 mL of 3.6 M HCl, P5C was derivatized with ninhydrin, and concentrations of the P5C-ninhydrin adduct were determined as described above.
One unit of enzyme activity was defined as the amount catalyzing the formation of 1 nmol of product (ethylene or P5C) per min under the specified reaction conditions. The initial velocity data were fitted by non-linear regression analysis using the Michaelis-Menten model in GraphPad Prism 7.
Anaerobic Difference Spectra
To obtain ultraviolet-visible (UV-vis) difference spectra under anaerobic conditions, all stock solutions were prepared in serum vials that were sealed with butyl rubber stoppers. The solutions were prepared in 25 mM HEPES buffer, pH 8.0, made anaerobic by several rounds of vacuum degassing and flushing with argon using a Schlenk line, and supplemented with 2 mM sodium dithionite. Hamilton gastight syringes that had been flushed with sodium dithionite and anaerobic buffer were used to transfer reagents to 1.5 mL quartz cuvettes (1 cm path length) that had been sealed with a stopper and made anaerobic as described for the reagents. The conditions for each of the spectra are described in the figures. Spectra were recorded at 25 °C on a Shimadzu UV-2600 spectrometer equipped with a Shimadzu TCC temperature controlled cell holder. The difference spectra were obtained by subtraction of the EFE/Fe(II) spectrum. Kd values were obtained by fitting the difference absorbances corresponding to the λmax of the observed electronic transitions to the following equations
where Aobs is the observed absorption, Amax is the maximal absorption, [EL] is the concentration of the enzyme-ligand complex, n is the number of ligands bound per enzyme, [ET] is the total enzyme concentration, Kd is the apparent ligand affinity, and [LT] is the total ligand concentration. The Kd values were derived from these equations using non-linear regression fitting (GraphPad Prism 7).
RESULTS
Protein Production and Purification
To obtain large amounts of EFE and to facilitate its purification, we created a new expression construct for use in E. coli. The recombinant cells produced EFE with a cleavable His6 tag at the N-terminus of the protein, denoted His6-EFE. The His6-EFE protein was synthesized in cells grown at 20 °C, purified by immobilized metal affinity chromatography, treated with TEV protease to cleave the tag, and the tag-free EFE was isolated by re-chromatography on the affinity resin. Following dialysis in buffer containing EDTA, we obtained ~20 mg per liter of culture of >90% pure apoprotein (Figure S1A). SDS-PAGE analysis provided an estimated protein mass of 40 kDa; a more precise determination was achieved by analyzing the purified apoprotein using ESI-MS which showed a single species with m/z of 39,670 Da (data not shown), corresponding well with the expected mass of 39,669 Da. The oligomerization state of EFE was investigated by SEC-MALS which revealed a monodisperse peak with a molecular mass of 39,370 Da (Figure S1B) indicating that EFE exists primarily as a monomer in solution.
EFE Activity Assays
We investigated the enzymatic activity of our recombinant EFE by approximately replicating the published assay conditions.16 Extended incubation of EFE in 40 mM HEPES buffer (pH 7.5) with 0.5 mM 2OG, 0.5 mM L-Arg, 0.2 mM Fe(II), 1 mM ascorbate, and 10 mM L-His led to the complete consumption of 2OG and production of ethylene and succinate in ~2:1 ratio (Figure 1A), which is in agreement with the reported ratio.16 Systematic omission of the reaction components demonstrated that neither the reductant nor L-His were essential for EFE activity, in contrast to prior assertions,17 but 2OG, L-Arg, and Fe(II) were required for ethylene production (Figure 1A). Even though the presence of a reducing agent was not necessary for the reaction, we included L-ascorbic acid (0.4 mM) in subsequent assays to minimize the oxidation of Fe(II) to Fe(III). The pH dependence of the EFE reaction was investigated over a pH range of 4.5–10.0 (Figure 1B). EFE exhibited the greatest activity between pH 6.0 and 8.5, and the ratio of ethylene to succinate was maintained at ~2:1 throughout the pH range used for the studies. With the employed standard assay conditions in this study, EFE exhibited a specific activity for ethylene formation of 2193 ± 120 U/mg, which is more than 3-fold greater than the previously reported value of 660 U/mg.15 We attribute this increased activity to the much more rapid purification protocol, the isolation of apoprotein that is unable to undergo oxidative inactivation reactions that may occur with the holoprotein, and other features of working with E. coli cells containing recombinant DNA compared to the prior isolation of EFE from the native microorganism.
Figure 1.
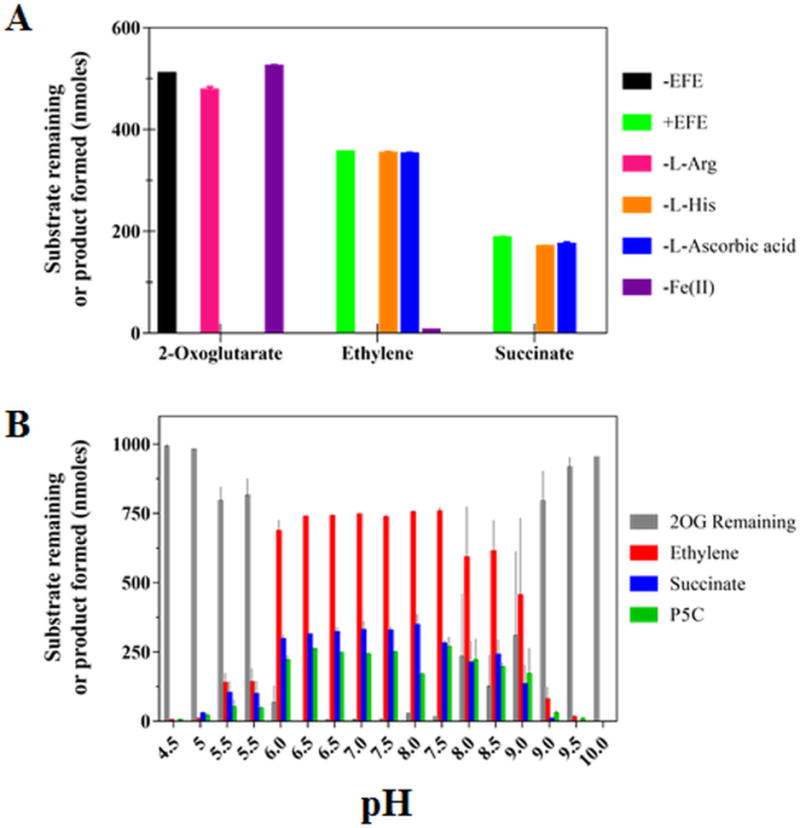
Enzymatic activity of EFE. (A) Components essential for the EFE reaction. EFE (254 nM, except for the EFE-free control sample) was incubated in 1 mL of 40 mM HEPES buffer, pH 7.5, containing (except where the component was eliminated) 0.5 mM 2OG, 0.5 mM L-Arg, 10 mM L-His, 0.2 mM Fe(II), and 1 mM L-ascorbic acid, followed by analysis of the remaining 2OG and production of ethylene and succinate. (B) pH dependence of the EFE reaction. A 2 mL reaction in 40 mM buffer (sodium acetate, pH 4.5–5.5, MES, pH 5.5–6.5, HEPES, pH 6.5–8.0, bis-Tris propane, pH 7.5–9.0, and CHES, pH 9.0–10) contained EFE (505 nM), 0.5 mM 2OG, 0.5 mM L-Arg, 0.2 mM (NH4)2Fe(SO4)2, and 0.4 mM L-ascorbic acid. The reactions were incubated at 25 °C for 80 min, terminated with HCl, and assessed for the remaining 2OG and production of ethylene, succinate, and P5C. Error bars the represent standard errors for n = 2.
We next examined the time dependence of the reaction while further characterizing the reaction stoichiometry and confirming the reported products (Figure 2). Under the conditions used, 2OG was completely consumed while only about 40% of the L-Arg was transformed. The extent of L-Arg consumption correlated well with the amounts of P5C, guanidine, and succinate that were formed. Significantly, these results represent the first reported experimental evidence for the formation of P5C (assayed by using both 2-aminobenzaldehyde and ninhydrin assays, as well as being detected by LC-MS) and guanidine (measured by LC-MS) during the reaction catalyzed by EFE. Our measurements demonstrate that the amount of ethylene produced is more than twice the levels of succinate, P5C, or guanidine generated, contrasting with the stated integer ratio of two in the published work.16
Figure 2.
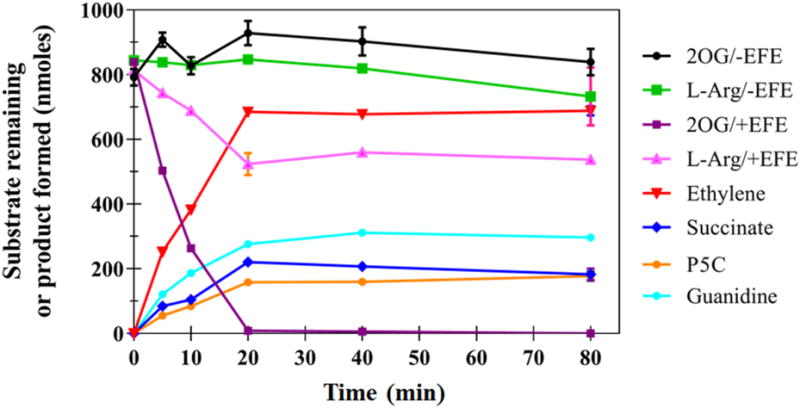
Representative time course of the EFE enzymatic reaction showing product formation and remaining substrates. The 2 mL reaction mixture consisted of 252 nM EFE, 0.5 mM 2OG, 0.5 mM L-Arg, 0.2 mM Fe(II), and 0.4 mM L-ascorbic acid in 10 mM NH4HCO3, pH 7.5 at 25 °C. Error bars represent the standard errors for n = 2.
Kinetic Constants
We investigated the kinetic parameters for utilization of both substrates by EFE, measuring the formation of ethylene and P5C in the presence of varied concentrations of 2OG and L-Arg (Table 1). Under the employed assay conditions, EFE exhibited a KM of 57 ± 4 μM and a kcat of 124 ± 11 min−1 for 2OG when measuring ethylene formation (Figure S2A). For L-Arg, a KM of 50 ± 7 μM and a kcat of 2.9 ± 0.3 min−1 were obtained when the formation of P5C was measured (Figure S3) versus a KM of 37 ± 2 μM and a kcat of 129 ± 4 min−1 when ethylene was measured (Figure S2B). These ethylene-based values differ from those reported in the literature for the utilization of 2OG and L-Arg by EFE (KM 13 or 18 μM and KM of 18 μM, respectively, with a kcat of 30 min−1); the kinetics of P5C formation were not reported in the earlier studies.15, 27 In terms of catalytic efficiency, EFE exhibits a better efficiency for transforming 2OG and L-Arg to ethylene (kcat/KM of ~2.18 μM−1 min−1 and 3.49 μM−1 min−1, respectively) than for converting L-Arg to P5C (kcat/KM of 0.058 μM−1 min−1), consistent with these transformations representing distinct activities.
Table 1.
EFE Kinetic Parameters for the formation of ethylene and P5C from metabolism of 2OG and L-Arg
| Substrate | KM (μM) | kcat (min−1) | kcat/KM (μM−1 min−1) |
|---|---|---|---|
| 2OGa | 57 ± 4 | 124 ± 11 | 2.18 |
| L-Arga | 37 ± 2 | 129 ± 4 | 3.49 |
| L-Argb | 50 ± 7 | 2.9 ± 0.3 | 0.058 |
Assessed by ethylene formation.
Assessed by P5C production.
Utilization of L-Arg Analogues
Several L-Arg analogues (Figure 3A) were tested for their abilities to stimulate the production of ethylene and to undergo transformation by EFE. Of the eight compounds tested, six (Nγ-hydroxy-L-arginine, L-canavanine, L-argininamide, agmatine, L-homoarginine, and L-ornithine) yielded detectable levels of ethylene (Figure 3B), with Nγ-hydroxy-L-Arg exhibiting ~15% of the levels measured for L-Arg and the other analogues generating 0.1–1% of the ethylene levels produced by the authentic substrate. These results for L-canavanine differ from a prior study that reported ethylene formation at 12% the level measured for L-Arg.15 Furthermore, the earlier study reported no ethylene production from L-ornithine while the other compounds were not previously tested.15 The prior study had not commented on transformations (hydroxylation) of the L-Arg analogues, whereas we found no evidence for metabolism of these compounds by LC-MS. Of additional interest, we detected succinate in the reactions for each of the L-Arg analogues, ranging from 20–40% of the concentration obtained in the presence of L-Arg, suggesting that these compounds stimulate EFE to catalyze oxidative decarboxylation of 2OG that is uncoupled from substrate turnover, presumably using ascorbic acid to return the enzyme to its resting state. Such results are consistent with the binding of these L-Arg derivatives to the EFE active site in a configuration allowing for both the low level transformation of 2OG into ethylene and for oxidative decarboxylation, but not for them to undergo hydroxylation.
Figure 3.
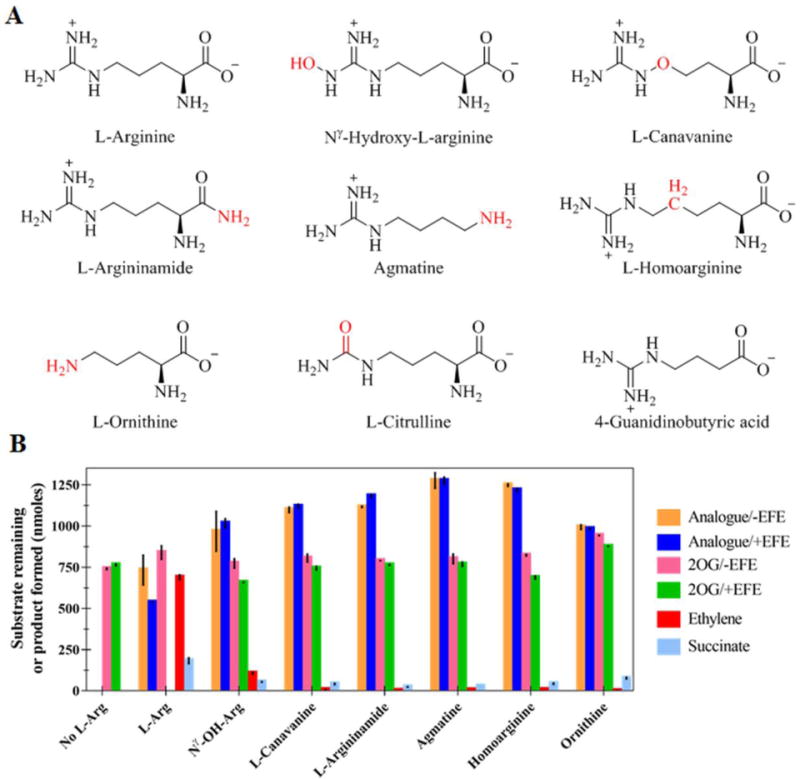
Reactions of EFE in the presence of various L-Arg analogues. (A) Structures of the L-Arg derivatives with differences from L-Arg highlighted in red. (B) Concentrations of 2OG remaining or ethylene and succinate produced after the reaction (or the no-enzyme controls) for various L-Arg analogues and a no-analogue control. Solutions (2 mL) containing 0.5 mM 2OG, 0.5 mM L-Arg analogue, 0.2 mM Fe(II), 0.4 mM L-ascorbic acid, and (when present) 252 nM EFE in 10 mM NH4HCO3 buffer, pH 7.5 were incubated at 25 °C for 80 min and terminated with formic acid. Error bars represent standard errors for n = 2.
Utilization of Alternative 2-Oxo Acids
We tested whether EFE could use other α-keto acids (2-oxoadipate, 2-oxovalerate, 2-oxobutyrate, pyruvate, and oxalate) to generate ethylene or to hydroxylate L-Arg. Of these compounds, only 2-oxoadipate (2OA), containing an extra methylene unit compared to 2OG, was a substrate for EFE. The consumption of substrates and formation of products were followed over time for EFE consumption of 2OA and L-Arg (Figure 4). Unlike the reaction with 2OG, no ethylene was produced from 2OA. Furthermore, the rate of consumption of 2OA was much less than noted for 2OG. Analysis by HPLC revealed the appearance of a new product (data not shown) corresponding to the decarboxylation product of 2OA, i.e. glutarate. The decarboxylation of 2OA was accompanied by the consumption of L-Arg and the production of P5C and guanidine, all with similar stoichiometries (Scheme 3). The kinetic parameters for the 2OA-dependent reaction were assessed by measuring the formation of P5C (Table 2). A KM of 31 ± 4 μM and kcat of 0.25 ± 0.02 min−1 were determined when varying the concentrations of 2OA. For varied L-Arg, we obtained a KM of 71 ± 11 μM with a kcat of 0.27 ± 0.01 min−1. The KM values for 2OA and L-Arg are similar to the values obtained when 2OG and L-Arg were examined (Table 1), but the kcat for the reaction using 2OA/L-Arg is about 1/10 of that for the 2OG/L-Arg hydroxylation reaction.
Figure 4.
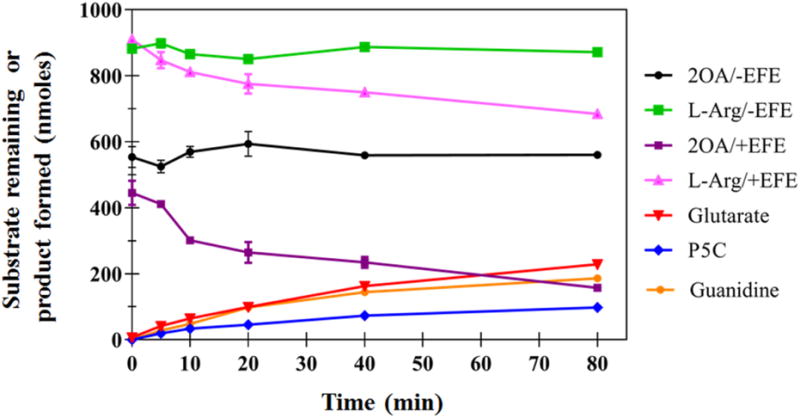
Activity of EFE with the alternative oxo-acid substrate, 2OA. The remaining substrates and the formation of products are shown for a representative time course during a 2 mL reaction containing 504 nM EFE, 0.3 mM 2OA, 0.5 mM L-Arg, 0.2 mM Fe(II), and 0.4 mM L-ascorbic acid in 10 mM NH4HCO3, pH 7.5, at 25 °C. Error bars represent standard errors for n = 2.
Scheme 3.

EFE-Catalyzed L-Arg Hydroxylation Driven by Oxidative Decarboxylation of 2OA
Table 2.
EFE Kinetic Parameters for L-Arg hydroxylation using 2OA
| Substratea | KM (μM) | kcat (min−1) | kcat/KM (μM−1 min−1) |
|---|---|---|---|
| 2OA | 31 ± 4 | 0.25 ± 0.02 | 0.008 |
| L-Arg | 71 ± 11 | 0.27 ± 0.01 | 0.004 |
Assessed by P5C formation.
Anaerobic Difference Spectra
We used UV-vis difference spectroscopy to investigate the binding of Fe(II) and the different substrates to EFE under anaerobic conditions. Fe(II)/2OG dependent oxygenases are known to exhibit characteristic metal-to-ligand charge-transfer (MLCT) transitions around 500 nm associated with the chelation of Fe(II) by 2OG at the enzyme active sites.28 The addition of 2OG to an anaerobic solution of EFE containing Fe(II) gave rise to a difference spectrum with λmax of ~515 nm and an extinction coefficient of ~114 M−1 cm−1 (Figure 5A, red trace). Subsequent addition L-Arg afforded a difference spectrum with λmax of 510 nm and an extinction coefficient of ~314 M−1 cm−1 (Figure 5A, blue trace). These MLCT transitions are similar to those reported for other 2OG oxygenases.29 The significant increase in intensity upon L-Arg binding may be due to an initial mixture of monodentate and bidentate 2OG-metal interactions that shifts exclusively to bidentate binding in the presence of the effector molecule. The apparent binding constants, Kd, for Fe(II), 2OG, and L-Arg, were estimated (Figure 5B–D) to be 14, 25, and 34 μM, respectively. Anaerobic spectra were also obtained for the Fe(II)/EFE/2OA and Fe(II)/EFE/2OA/L-Arg complexes (Figure 6); the 530 nm MLCT transition with an extinction coefficient of ~106 M−1 cm−1 for the sample lacking L-Arg underwent a significant shift to 480 nm with an extinction coefficient of ~156 M−1 cm−1 when L-Arg was added.
Figure 5.
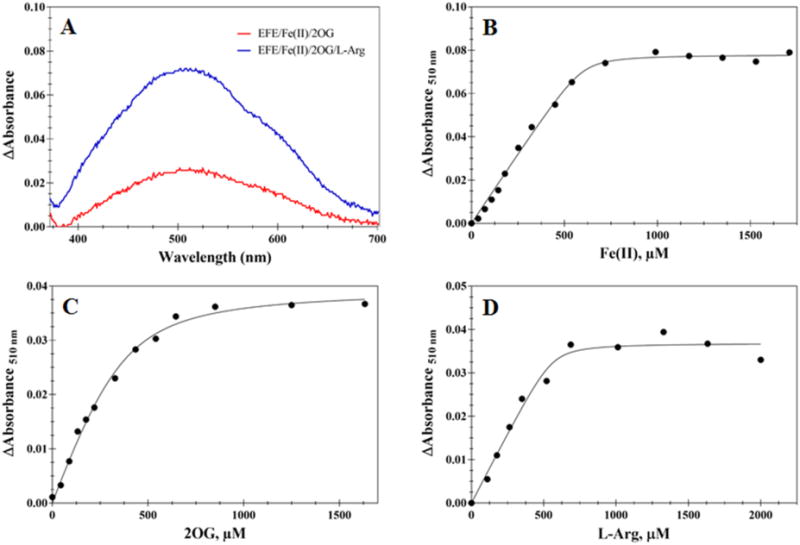
Difference absorption UV-vis spectra to monitor the binding of Fe(II) and substrates to EFE. (A) Difference spectra of EFE/Fe(II)/2OG (red) and EFE/Fe(II)/2OG/L-Arg, with the spectrum of EFE/Fe(II) subtracted for both samples. The anaerobic samples contained 226 μM EFE, 1 mM Fe(II), 2.4 mM 2OG, and (when present) 2.7 mM L-Arg. (B) Representative titration of Fe(II) into EFE (232 μM)/2OG (1 mM)/L-Arg (1 mM). (C) Representative titration of 2OG into EFE (238 μM)/Fe(II) (0.250 mM)/L-Arg (1 mM). (D) Representative titration of L-Arg into EFE (261 μM)/Fe(II) (0.5 mM)/L-Arg (2 mM). All samples were prepared in 25 mM HEPES, pH 8.0, with 2 mM dithionite at 25 °C, and monitored at 510 nm. Solid black lines are fits to the quadratic equation used for determining the thermodynamic constants (B, Kd = 14 ± 7 μM and n = 2.2 ± 0.4; C, Kd = 25 ± 7 μM and n = 1.7 ± 0.4; D, Kd = 34 ± 25 μM and n = 1.3 ± 0.5).
Figure 6.
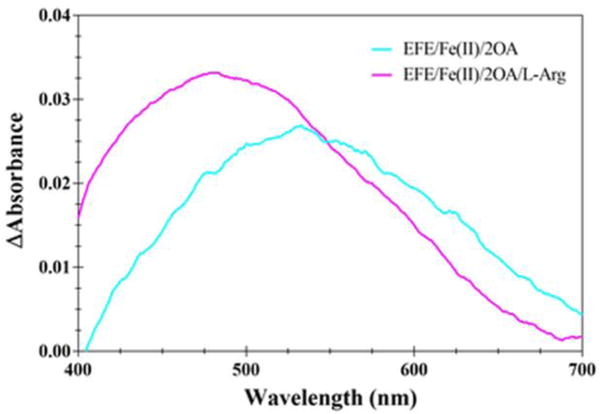
Difference absorption UV-vis spectra of EFE/Fe(II) in the presence of 2OA and L-Arg. A solution of EFE (212 μM) and Fe(II) (0.5 mM) was adjusted to 2.2 mM OA (cyan trace) and further adjusted to contain 3.1 mM L-Arg (magenta trace) in 25 mM HEPES, pH 8.0, with 2 mM dithionite at 25 °C. The data were subjected to a three-point smoothing with a zero order polynomial to reduce the noise using GraphPad Prism 7.0.
DISCUSSION
EFE has garnered tremendous recent interest because of its potential application in the large scale production of ethylene as a biofuel. For example, efforts are underway to create recombinant strains of cyanobacteria that use light energy to fix CO2 and use EFE to transform a portion of the resulting fixed carbon into ethylene.10, 12, 30 Similarly, the gene encoding EFE has been introduced into various other organisms (e.g. E. coli and Saccharomyces cerevisiae) in efforts to allow the production of ethylene.11, 31, 32 Elegant computational modeling studies are being used to understand metabolic transformations involving EFE in recombinant organisms.12, 33, 34 Notably, each of these modeling efforts incorporates the integral partitioning ratio reported for the dual-circuit mechanism of Fukuda et al. in 1992,16 with 2 molecules of 2OG converted to ethylene as a third is decarboxylated during the hydroxylation of L-Arg. Surprisingly little biochemical characterization of EFE has been carried out in the intervening quarter century. To gain additional insight into the biochemical properties, reaction mechanism, and reaction stoichiometry of this enzyme, we expressed the gene encoding EFE in recombinant E. coli cells, purified the protein by a facile protocol, and used this form of EFE for the various studies presented here.
Our version of EFE exhibits the greatest specific activity yet reported for ethylene formation. Using this enzyme, we confirmed the prior finding that L-Arg is metabolized by EFE and we demonstrated by LC-MS and derivatization with 2-aminobenzaldehyde and ninhydrin that the reaction products of this transformation are indeed P5C and guanidine as previously suggested, but not shown, by the earlier investigators. We found that succinate, P5C, and guanidine are formed in similar concentrations with comparable kinetics.
We showed that various L-Arg analogues stimulated 2OG conversion into ethylene by EFE, but without themselves undergoing detectable hydroxylation; thus, L-Arg hydroxylation and ethylene-formation can be unlinked. A compound resembling L-Arg must bind to the active site for ethylene to be produced (albeit this gas is generated at very low levels with several of these compounds), but differences in binding of these analogues compared to authentic L-Arg must somehow prevent their hydroxylation. Of further interest, the L-Arg analogues allow the enzyme to carry out a newly identified reaction for EFE: the uncoupled oxidative decarboxylation of 2OG. Uncoupling between the oxidative decarboxylation of 2OG and the oxidation of primary substrate has been observed in many other Fe(II)/2OG oxygenase family members,9 but had not previously been described for EFE.
Further evidence that ethylene production and L-Arg hydroxylation can be unlinked was derived from studies using α-keto acids other than 2OG. In particular, we found that 2OA is used by EFE as a co-substrate for the hydroxylation of L-Arg to form P5C and guanidine, but no ethylene is generated in this reaction. EFE uses 2OA in the same manner as 2OG is utilized by a typical member of the Fe(II)/2OG dependent oxygenase superfamily; i.e., the enzyme decarboxylates the co-substrate (to form glutaric acid) as it hydroxylates the δC position of L-Arg, followed by spontaneous conversion to the products. Thus, by increasing the length of the α-keto acid, the reactivity of the enzyme was modified to eliminate one reaction (ethylene formation) while allowing a second reaction (the transformation of L-Arg) to proceed. Our kinetic evidence indicates that EFE exhibits a clear preference for 2OG over 2OA for L-Arg hydroxylation.
The anaerobic difference UV-vis spectra we obtained for EFE are fairly typical of the ternary and quaternary complexes observed for other 2OG/Fe(II) dependent oxygenases. The observation of such species argues against the previously proposed tridentate Schiff base (formed by 2OG and L-Arg) binding to the metallocenter.16 Fe(II) tightly binds to the enzyme, with a Kd that is less than the estimated concentration of this metal ion in the E. coli cells (15–30 μM).35 The cellular concentrations of 2OG36 and L-Arg37 also exceed the Kd associated with EFE binding these species.
On the basis of our biochemical, kinetic, and spectroscopic results, the previously reported homology model/mutagenesis studies of EFE,19 and the vast literature on 2OG/Fe(II) dependent oxygenases9 we present an updated proposal for the dual-circuit reaction mechanism of EFE (Scheme 4). The resting enzyme is suggested to possess Fe(II) bound in octahedral coordination to three water molecules and a 2-His-1-carboxylate motif, rather than to just two unidentified protein ligands as proposed earlier.16 Our anaerobic difference spectroscopy investigations indicate that 2OG chelates the metal center of the enzyme to form a ternary complex, instead of EFE first binding L-Arg to the Fe(II) as initially suggested.16 Our spectral studies and comparisons to other family members are consistent with subsequent binding of L-Arg to the active site, without coordinating the metallocenter, to form the quaternary complex, as opposed to formation of the metal-bound Schiff complex posited earlier.16 The Fe(II) is likely to be 5-coordinate in the enzyme quaternary complex and primed for oxygen binding. The initial oxygen intermediate, likely to be an Fe(III)-superoxo species, may form a bicyclic Fe(IV)-peroxo intermediate which can proceed in either of two directions. In one potential mechanism (red) the intermediate decomposes into ethylene, CO2, and (in one potential mechanism) oxalate bound to a ferryl intermediate. Further steps in this pathway result in the formation of additional bicarbonate/CO2 as the enzyme returns to the resting state. In a second route (blue), the bicyclic Fe(IV)-peroxo intermediate proceeds according to the well-established mechanism for primary substrate hydroxylation by Fe(II)/2OG oxygenases. In this case, 2OG decarboxylation releases CO2 and creates a ferryl intermediate with bound succinate, the ferryl intermediate abstracts a hydrogen atom from L-Arg forming an Fe(III)-OH species and the substrate radical, hydroxyl radical rebound yields the hydroxylated L-Arg product plus the resting Fe(II) state, and the products are released to complete the catalytic cycle. Of great importance, our stoichiometry studies, work with L-Arg analogues, and investigation of 2OA as an alternate oxo-acid demonstrate the dual circuit mechanism does not require an integral two-to-one partitioning of the two cycles. Rather, ethylene generation versus L-Arg hydroxylation happens to approximate a ratio of two with this particular enzyme and using the stated reaction conditions. In the extreme case, EFE can generate ethylene using particular L-Arg analogues without those compounds undergoing hydroxylation (although these conditions lead to a third reaction: the oxidative decarboxylation of 2OG with a requirement for ascorbate or other reductant to restore the resting enzyme) and EFE can use 2OA to hydroxylate L-Arg without the production of ethylene.
Scheme 4.
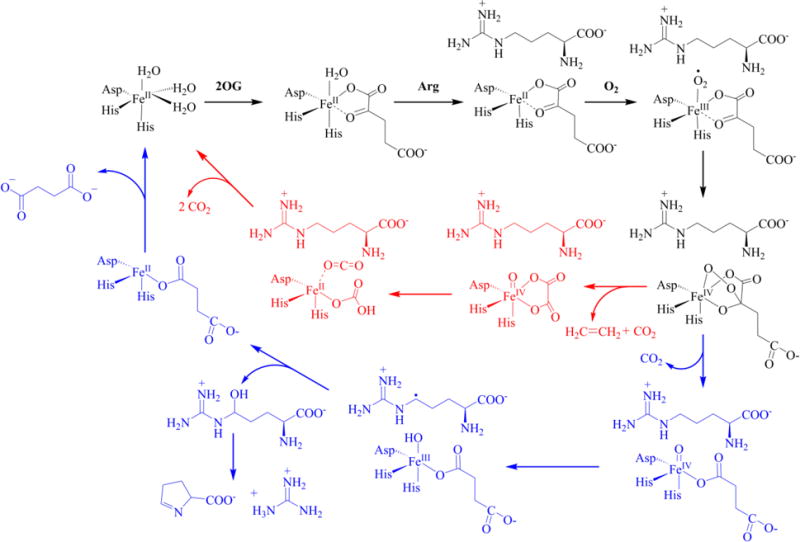
Revised Dual Circuit Mechanism of EFE. The hypothetical pathway for ethylene formation depicts release of one CO2 from 2OG while forming an oxalate-bound ferryl intermediate that is further metabolized to release two more CO2/bicarbonate molecules per ethylene.
In conclusion, the studies presented here provide significant new insights into the properties of EFE and they set the foundation for future studies on this unique enzyme. One area of great interest centers on the important question of how EFE transforms 2OG into ethylene. A second area of focus is whether the gene encoding EFE can be engineered to generate an enzyme that exclusively catalyzes 2OG conversion into ethylene without a requirement for L-Arg or which is incapable of hydroxylating this valuable cellular metabolite.
Supplementary Material
Acknowledgments
We thank Jianping Yu for providing the original plasmid containing the gene for EFE and for helpful discussions. We also thank Nicholas Henning and Anastasia Ritchie for assistance in selected studies and Anthony Schilmiller at the MSU RTSF Mass Spectrometry and Metabolomics Core Facilities for assistance with LC-MS.
Funding
This work was supported in part by the National Institutes of Health (Grant GM063584 to R.P.H.)
ABBREVIATIONS
- ACC
1-aminocyclopropane-1-carboxylic acid
- DTT
dithiothreitol
- EDTA
ethylenediaminetetraacetic acid
- EFE
ethylene-forming enzyme
- ESI-MS
electrospray ionization mass spectrometry
- GC
gas chromatography
- HEPES
4-(2-hydroxyethyl)-1-piperazineethanesulfonic acid
- MLCT
metal-to-ligand charge-transfer
- Ni-NTA
nickel-nitrilotriacetic acid
- 2OG
2-oxoglutarate
- 2OA
2-oxoadipate
- PCR
polymerase chain reaction
- P5C
L-Δ1-pyrroline-5-carboxylate
- SEC-MALS
size-exclusion chromatography-multi-angle light scattering
- SDS-PAGE
sodium dodecyl sulfate-polyacrylamide gel electrophoresis
- TEV
tobacco etch virus
- UV-vis
ultraviolet-visible
Footnotes
Supporting Information
The Supporting Information is available free of charge on the ACS Publications website (http://pubs.acs.org).
Molecular weight determinations and kinetic assays used to obtain steady state kinetic parameters.
References
- 1.Intratec Solutions. ‘Green’ ethylene production. Chem Eng. 2015:39. [Google Scholar]
- 2.Ghanta M, Fahey D, Subramaniam B. Environmental impacts of ethylene production from diverse feedstocks and energy sources. Appl Petrochem Res. 2014;4:167–179. [Google Scholar]
- 3.Bleecker AB, Kende H. Ethylene: A gaseous signal molecule in plants. Annu Rev Cell Dev Biol. 2000;16:1–18. doi: 10.1146/annurev.cellbio.16.1.1. [DOI] [PubMed] [Google Scholar]
- 4.Simaan AJ, Reglier M. 1-Aminocyclopropane-1-carboxylic acid oxidase. In: Schofield CJ, Hausinger RP, editors. 2-Oxoglutarate-Dependent Oxygenases. The Royal Society of Chemistry; Cambridge, UK: 2015. pp. 425–437. [Google Scholar]
- 5.Ince JE, Knowles CJ. Ethylene formation by cell-free extracts of Escherichia coli. Arch Microbiol. 1986;146:151–158. doi: 10.1007/BF00402343. [DOI] [PubMed] [Google Scholar]
- 6.Fukuda H, Takahashi M, Fujii T, Tazaki M, Ogawa T. An NADH: Fe(III) EDTA oxidoreductase from Cryptococcus albidus: an enzyme involved in ethylene production in vivo? FEMS Microbiol Lett. 1989;60:107–111. doi: 10.1111/j.1574-6968.1989.tb03428.x. [DOI] [PubMed] [Google Scholar]
- 7.Weingart H, Völksch B, Ullrich MS. Comparison of ethylene production by Pseudomonas syringae and Ralstonia solanacearum. Phytopathol. 1999;89:360–365. doi: 10.1094/PHYTO.1999.89.5.360. [DOI] [PubMed] [Google Scholar]
- 8.Fukuda H, Kitajima H, Fujii T, Tazaki M, Ogawa T. Purification and some properties of a novel ethylene-forming enzyme produced by Penicillium digitatum. FEMS Microbiol Lett. 1989;59:1–6. [Google Scholar]
- 9.Hausinger RP. Biochemical diversity of 2-oxoglutarate-dependent oxygenases. In: Schofield CJ, Hausinger RP, editors. 2-Oxoglutarate-dependent oxygenases. The Royal Society of Chemistry; Cambridge, UK: 2015. pp. 1–58. [Google Scholar]
- 10.Xiong W, Morgan JA, Ungerer J, Wang B, Maness PC, Yu J. The plasticity of cyanobacterial metabolism supports direct CO2 conversion to ethylene. Nat Plants. 2015;1:15053. [Google Scholar]
- 11.Lynch S, Eckert C, Yu J, Gill R, Maness PC. Overcoming substrate limitations for improved production of ethylene in E. coli. Biotechnol Biofuels. 2016;9:1–10. doi: 10.1186/s13068-015-0413-x. [DOI] [PMC free article] [PubMed] [Google Scholar]
- 12.Zavřel T, Knoop H, Steuer R, Jones PR, Červený J, Trtílek M. A quantitative evaluation of ethylene production in the recombinant cyanobacterium Synechocystis sp. PCC 6803 harboring the ethylene-forming enzyme by membrane inlet mass spectrometry. Bioresource Technol 202. 2016:142–151. doi: 10.1016/j.biortech.2015.11.062. [DOI] [PubMed] [Google Scholar]
- 13.Zhu T, Xie X, Li Z, Tan X, Lu X. Enhancing photosynthetic production of ethylene in genetically engineered Synechocystis sp. PCC 6803. Green Chem. 2015;17:421–434. [Google Scholar]
- 14.Goto M, Hyodo H. Ethylene production by cell-free extract of the Kudzu strain of Pseudomonas syringae pv. phaseolicola. Plant Cell Physiol. 1987;28:405–414. [Google Scholar]
- 15.Nagahama K, Ogawa T, Fujii T, Tazaki M, Tanase S, Morino Y, Fukuda H. Purification and properties of an ethylene-forming enzyme from Pseudomonas syringae pv. phaseolicola PK2. Microbiology. 1991;137:2281–2286. doi: 10.1099/00221287-137-10-2281. [DOI] [PubMed] [Google Scholar]
- 16.Fukuda H, Ogawa T, Tazaki M, Nagahama K, Fujiil T, Tanase S, Morino Y. Two reactions are simultaneously catalyzed by a single enzyme: The arginine-dependent simultaneous formation of two products, ethylene and succinate, from 2-oxoglutarate by an enzyme from Pseudomonas syringae. Biochem Biophys Res Commun. 1992;188:483–489. doi: 10.1016/0006-291x(92)91081-z. [DOI] [PubMed] [Google Scholar]
- 17.Nagahama K, Ogawa T, Fujii T, Tazaki M, Goto M, Fukuda H. L-Arginine is essential for the formation in vitro of ethylene by an extract of Pseudomonas syringae. Microbiology 137. 1991:1641–1646. [Google Scholar]
- 18.Martinez S, Hausinger RP. Catalytic mechanisms of Fe(II)- and 2-oxoglutarate-dependent oxygenases. J Biol Chem. 2015;290:20702–20711. doi: 10.1074/jbc.R115.648691. [DOI] [PMC free article] [PubMed] [Google Scholar]
- 19.Johansson N, Persson KO, Larsson C, Norbeck J. Comparative sequence analysis and mutagenesis of ethylene forming enzyme (EFE) 2-oxoglutarate/Fe(II)-dependent dioxygenase homologs. BMC Biochem. 2014;15:1–8. doi: 10.1186/1471-2091-15-22. [DOI] [PMC free article] [PubMed] [Google Scholar]
- 20.Yin X, Zabriskie TM. VioC is a non-heme iron, α-ketoglutarate-dependent oxygenase that catalyzes the formation of 3S-hydroxy-L-arginine during viomycin biosynthesis. ChemBioChem. 2004;5:1274–1277. doi: 10.1002/cbic.200400082. [DOI] [PubMed] [Google Scholar]
- 21.Hiratsuka T, Koketsu K, Minami A, Kaneko S, Yamazaki C, Watanabe K, Oguri H, Oikawa H. Core assembly mechanism of quinocarcin/SF-1739: bimodular complex nonribosomal peptide synthetases for sequential Mannich-type reactions. Chem Biol. 2013;20:1523–1535. doi: 10.1016/j.chembiol.2013.10.011. [DOI] [PubMed] [Google Scholar]
- 22.Chang CY, Lyu SY, Liu YC, Hsu NS, Wu CC, Tang CF, Lin KH, Ho JY, Wu CJ, Tsai MD, Li TL. Biosynthesis of streptolidine involved two unexpected intermediates produced by a dihydroxylase and a cyclase through unusual mechanisms. Angew Chem Int Ed. 2014;53:1943–1948. doi: 10.1002/anie.201307989. [DOI] [PubMed] [Google Scholar]
- 23.Blommel PG, Fox BG. A combined approach to improving large-scale production of tobacco etch virus protease. Protein Expression Purif. 2007;55:53–68. doi: 10.1016/j.pep.2007.04.013. [DOI] [PMC free article] [PubMed] [Google Scholar]
- 24.Mezl VA, Knox WE. Properties and analysis of a stable derivative of pyrroline-5-carboxylic acid for use in metabolic studies. Anal Biochem. 1976;74:430–440. doi: 10.1016/0003-2697(76)90223-2. [DOI] [PubMed] [Google Scholar]
- 25.Kim HR, Rho HW, Park JW, Park BH, Kim JS, Lee MW. Assay of ornithine aminotransferase with ninhydrin. Anal Biochem. 1994;223:205–207. doi: 10.1006/abio.1994.1574. [DOI] [PubMed] [Google Scholar]
- 26.Ravikumar H, Devaraju KS, Shetty KT. Effect of pH on spectral characteristics of P5C-ninhydrin derivative: Application in the assay of ornithine amino transferase activity from tissue lysate. Indian J Clin Biochem. 2008;23:117–122. doi: 10.1007/s12291-008-0028-0. [DOI] [PMC free article] [PubMed] [Google Scholar]
- 27.Nagahama K, Yoshino K, Matsuoka M, Tanase S, Ogawa T, Fukuda H. Site-directed mutagenesis of histidine residues in the ethylene-forming enzyme from Pseudomonas syringae. J Ferment Bioeng. 1998;85:255–258. [Google Scholar]
- 28.Pavel EG, Zhou J, Busby RW, Gunsior M, Townsend CA, Solomon EI. Circular dichroism and magnetic circular dichroism spectroscopic studies of the non-heme ferrous active site in clavaminate synthase and its interaction with α-ketoglutarate cosubstrate. J Am Chem Soc. 1998;120:743–753. [Google Scholar]
- 29.Proshlyakov DA, Hausinger RP. Transient iron species in the catalytic mechanism of the archetypal α-ketoglutarate-dependent dioxygenase, TauD. In: de Visser SP, Kumar D, editors. Iron-Containing Enzymes : Versatile Catalysts of Hydroxylation Reactions in Nature. The Royal Society of Chemistry; Cambridge, UK: 2011. pp. 67–87. [Google Scholar]
- 30.Guerrero F, Carbonell V, Cossu M, Correddu D, Jones PR. Ethylene synthesis and regulated expression of recombinant protein in Synechocystis sp PCC 6803. PloS One. 2012;7:e50470. doi: 10.1371/journal.pone.0050470. [DOI] [PMC free article] [PubMed] [Google Scholar]
- 31.Johansson N, Quehl P, Norbeck J, Larsson C. Identification of factors for improved ethylene production via the ethylene forming enzyme in chemostat cultures of Saccharomyces cerevisiae. Microb Cell Fact. 2013;12:1–7. doi: 10.1186/1475-2859-12-89. [DOI] [PMC free article] [PubMed] [Google Scholar]
- 32.Johansson N, Persson KO, Quehl P, Norbeck J, Larsson C. Ethylene production in relation to nitrogen metabolism in Saccharomyces cerevisiae. FEMS Yeast Res. 2014;14:1110–1118. doi: 10.1111/1567-1364.12208. [DOI] [PubMed] [Google Scholar]
- 33.Erickson KE, Gill RT, Chatterjee A. CONSTRICTOR: Constraint modification provides insight into design of biochemical networks. PloS One. 2014;9:e113820. doi: 10.1371/journal.pone.0113820. [DOI] [PMC free article] [PubMed] [Google Scholar]
- 34.Knoop H, Steuer R. A computational analysis of stoichiometric constraints and trade-offs in cyanobacterial biofuel production. Front Bioeng Biotechnol 3. 2015 doi: 10.3389/fbioe.2015.00047. [DOI] [PMC free article] [PubMed] [Google Scholar]
- 35.Keyer K, Imlay JA. Superoxide accelerates DNA damage by elevating free-iron levels. Proc Natl Acad Sci, USA. 1996;93:13635–13640. doi: 10.1073/pnas.93.24.13635. [DOI] [PMC free article] [PubMed] [Google Scholar]
- 36.Yan D, Lenz P, Hwa T. Overcoming fluctuation and leakage problems in the quantification of intracellular 2-oxoglutarate levels in Escherichia coli. Appl Environ Microbiol. 2011;77:6763–6771. doi: 10.1128/AEM.05257-11. [DOI] [PMC free article] [PubMed] [Google Scholar]
- 37.Caldara M, Dupont G, Leroy F, Goldbeter A, De Vuyst L, Cunin R. Arginine biosynthesis in Escherichia coli: Experimental perturbation and mathematical modeling. J Biol Chem. 2008;283:6347–6358. doi: 10.1074/jbc.M705884200. [DOI] [PubMed] [Google Scholar]
Associated Data
This section collects any data citations, data availability statements, or supplementary materials included in this article.


