Highlight
Repeat-length variation in the cellulose synthase-like (Csl) gene is associated with increased lignification and strength of wheat stems. The predicted Csl gene co-locates with a previously reported tiller inhibition gene (tin).
Keywords: Cellulose synthase-like, cell wall thickening, lignin, lodging, tillering, tin, Triticum aestivum, wheat.
Abstract
The tiller inhibition gene (tin) that reduces tillering in wheat (Triticum aestivum) is also associated with large spikes, increased grain weight, and thick leaves and stems. In this study, comparison of near-isogenic lines (NILs) revealed changes in stem morphology, cell wall composition, and stem strength. Microscopic analysis of stem cross-sections and chemical analysis of stem tissue indicated that cell walls in tin lines were thicker and more lignified than in free-tillering NILs. Increased lignification was associated with stronger stems in tin plants. A candidate gene for tin was identified through map-based cloning and was predicted to encode a cellulose synthase-like (Csl) protein with homology to members of the CslA clade. Dinucleotide repeat-length polymorphism in the 5′UTR region of the Csl gene was associated with tiller number in diverse wheat germplasm and linked to expression differences of Csl transcripts between NILs. We propose that regulation of Csl transcript and/or protein levels affects carbon partitioning throughout the plant, which plays a key role in the tin phenotype.
Introduction
The development of tillers from basal nodes of shoots has major effects on the above-ground architecture and biomass of monocots. Under favourable environmental conditions, buds in the leaf axils of basal nodes can grow out to form tillers (branches) that determine the yield potential of temperate cereals such as wheat (Triticum aestivum). A gene was reported in wheat that reduces tillering by preventing tiller-bud outgrowth and hence is named ‘tiller inhibition’ gene (tin) (Atsmon and Jacobs, 1977; Kebrom et al., 2012). The gene was mapped to the short arm of chromosome 1A and tightly linked to the simple sequence repeat (SSR) marker gwm136 (Spielmeyer and Richards 2004). The tin gene was also associated with larger spikes and increased grain weight along with thicker leaves and stems, which were collectively referred to as Gigas characteristics (Atsmon and Jacobs, 1977). Several agronomic studies concluded that tin was associated with greater harvest index (more assimilates partitioned to grain relative to total plant biomass) and an increase in grain weight (Atsmon and Jacobs, 1977; Richards, 1988; Duggan et al., 2005). Other studies also reported an association of tin with increased grain weight; however, the effect on yield was variable and highly dependent on the genetic background and the environment (Mitchell et al., 2012, 2013). Large grain weight can be a valuable trait in dryland, rain-fed environments that experience water stress during grain filling as it reduces the proportion of small and shrivelled grain (screenings) at harvest.
Aside from effects on tiller number and grain weight, tin also influences internode development in wheat. Two separate studies reported that basal internodes during the transition from vegetative to reproductive growth started to elongate in tin lines before the free-tillering near-isogenic line (NIL) (Kebrom et al., 2012; Moeller et al., 2014). Precocious internode development of tin during this early growth stage was also associated with solidness of stem basal internodes. However, certain environmental conditions can restrict internode growth of tin plants. Under experimental conditions of long days (14 h) and low temperature (15–20 °C) internodes may fail to elongate, resulting in stunted stem growth of plants containing tin (Atsmon et al., 1986; Richards, 1988; Kebrom and Richards 2013). The degree of stunting is variable and associated with the distance between successive leaf ligules of the primary stems, which fail to separate in severely stunted plants (Kebrom et al., 2012; Kebrom and Richards 2013).
To further study the tin phenotype, we compared cell wall morphology and composition of stems and related changes in chemical composition to differences in physical stem strength between NILs. A candidate gene for tin, identified through map-based cloning, was predicted to encode a cellulose synthase-like (Csl) gene. We propose that the regulation of the Csl transcript and/or protein levels alters carbon partitioning throughout the plant, preventing tiller-bud outgrowth and resulting in increased lignification and strength of stems in tin plants.
Materials and methods
Genetic material
The donor of tin was the uniculm line 492 (AUS 20430) of Triticum aestivum L., which originated from a North African landrace (previously described by Atsmon and Jacobs, 1977). Line 492 was backcrossed four times to a free-tillering Australian cultivar, Banks, generating BC5 near-isogenic lines (NILs), as outlined by Spielmeyer and Richards (2004). A range in the expression of tiller inhibition was noted during the development of the BC5 lines, and two reduced-tillering lines (NIL76 and NIL98) showing heritable differences in the severity of tiller number reduction were selected from the BC5F3 family. The uniculm NIL98 line closely resembled the donor 492 and was frequently stunted under controlled conditions. Oligoculm NIL76 produced 2–3 tillers without stunting. The tillering habit of both NILs remained stable over multiple generations of selfing. In experiments when stunting occurred in NIL98, only Banks and NIL76 were analysed. Plants were analysed at key stages of growth and development with corresponding Zadoks (Z) scores (Zadoks et al., 1974; Supplementary Table S1 at JXB online).
A subset of the Watkins wheat collection (118 landraces) was obtained from the Australian Winter Cereals collection and grown under glasshouse conditions. A further subset of 16 lines with similar phenology was selected for phenotypic and genotypic analyses (see Supplementary Table S2; Wingen et al., 2014)
Growth conditions and determination of tiller number
Tight environmental control was required to ensure reproducible determination of tiller number. NILs were grown in Conviron controlled environment growth cabinets without humidity control (PGC20) and set to 14-h days, 400 μmol m−2 s−1 photosynthetically active photon flux density (mixture of fluorescent tubes and incandescent bulbs), 20 °C day and 15 °C night. NILs were grown with four plants per pot in 15-cm pots containing a soil/compost mix with an adequate amount of slow-release NPK fertiliser. These NILs were grown in many experiments under the same conditions and using the same soil medium without observing ‘pot effects’ in plants from the same pot. We therefore regarded plants grown in the same pot as biological replicates. However, most plants that were harvested for stem chemical and physical analysis came from separate pots because individual plants with very similar growth stage were selected from a larger set of plants grown for each experiment. Tiller number was recorded at the terminal spikelet stage (Z30–32) before stem elongation.
Stem morphological and histochemical analysis
For macroscopic analysis, a minimum of three primary stems were harvested when NILs were heading (Z50) and processed individually. Internode lengths were determined for the peduncle (Ped), the internode immediately below the peduncle (P-1), and the second internode below the peduncle (P-2). Digital callipers were used to determine the outer diameter at the midpoint of the internodes. For microscopic analysis, at least three cross-sections were examined from each genotype. Cross-sections were taken at internode and peduncle midpoints, and the most representative cross-sections are shown in the Results. Unstained sections were viewed under bright-field illumination. For histochemical analysis, P-2 was harvested during the late elongation phase (Z39). Fresh sections were treated with Toluidine Blue or Mäule stain as outlined by MacMillan et al. (2010) for bright-field and fluorescence imaging.
Stem chemical analysis
Whole primary stems (without sheaths) were sampled at the late stem elongation stage (Z39) from six plants of Banks and NIL76 and processed individually. Internode lengths and fresh weights were recorded before freezing in liquid nitrogen. Stems were freeze-dried for 48 h and stored at room temperature on desiccant before analysis. For alcohol-insoluble residue (AIR) preparation, the method outlined by Pettolino et al. (2012) was followed with some modifications. Two replicates were pooled and milled in 10-ml grinding jars with 20-mm stainless steel ball bearings in a Qiagen Tissue Lyser II (catalogue number 85300) for 2 min and frequency of 30 s–1. Ground samples were visually inspected under a light microscope. Samples were resuspended in 70% (v/v) EtOH and incubated at 90 °C for 20 min before cooling and centrifugation at 2500 g for 5 min. The cell wall pellet was washed four times with 70% (v/v) EtOH followed by chloroform:methanol (1:1) extraction, centrifugation, and washing with methanol and 100% (v/v) EtOH. The cell wall pellet was air-dried overnight, followed by 24 h drying under vacuum at 40 °C, and then stored on desiccant at room temperature.
Klason lignin analysis was performed for the gravimetric determination of lignin in Banks and NIL76 plants, as described by Theander and Westerlund (1986) with some modifications. From the AIR cell wall preparations, the sample was split into two 20-mg fractions and vacuum-dried overnight at 40 °C, alongside Millipore glass fibre filters (catalogue no. AP2502500) stored in 6-well plates. After drying, individual filters and cell wall samples were weighed, stored under desiccant, and processed immediately. Sulfuric acid treatment of cell walls (addition of 12M H2SO4, incubation at 35 °C for 1 h, followed by dilution to 2M H2SO4, incubation at 121 °C for 1h) was followed by centrifugation at 800 g for 10 min to collect acid-insoluble components, which were subsequently resuspended in water. Samples were applied to filters in a Millipore 1225 Sampling Manifold (catalogue no. XX2702550) and washed with water. Filters were dried in a vacuum-oven at 40 °C overnight. Final filter-plus-sample weights were recorded and lignin weight was determined as the difference between the final and initial filter weight. Differences between means were tested for significance using Student’s two-tailed t-test (for unequal variances).
Stem physical analysis
Banks and NIL76 plants were grown under controlled conditions as described above. We performed tests on fully mature, dried stems to avoid the confounding effects of water content, and to reflect a relevant time point for lodging risk in the field. Primary stems from a minimum of five plants were harvested from each genotype at maturity and processed individually. Leaf sheaths were removed and samples stored under ambient conditions prior to measurements. P-1 and P-2 lengths and diameters were determined as described above. A three-point bend test was carried out as described by Kokubo et al. (1989) with an Instron 4500 series universal testing machine configured with a 41-mm span between support pins, 5 kN load cell, and cross-head speed of 10 mm min–1. Stems were deformed by the application of compressive force at the point of contact with the stem (uppermost surface), which created tensile stress at the outer, opposite stem edge. Force (N) and deflection (mm) were recorded at the midpoint of each internode (P-1, P-2). After the bend-test, internodes were dissected with an Astra Superior double-edge blade, 1 cm above and below the midpoint (to avoid the area of stem deformed by the test). Unstained cross-sections were photographed under a light microscope (Leica MZFL3 Axiocam HRC, 1.6× magnification) to measure thickness of the stem wall. Stem wall thickness was calculated as the mean of each value above and below the internode midpoint. The internal stem diameter was determined as the external diameter less the total stem wall thickness (×2). Maximum bending stress and bending rigidity were determined according to equations presented in Supplementary Note S1 (Timoshenko, 1955; Crook and Ennos, 1994). Values for bending stress and bending rigidity were averaged across genotypes and differences between means were tested for significance using Student’s two-tailed t-test (for unequal variances).
Genetic and physical mapping
BC5 NIL76 was backcrossed to Banks to generate a large F2 mapping population consisting of several thousand F2 seed. DNA was extracted from the endosperm half of the F2 seed using the technique outlined by Ellis et al. (2005). The SSR markers cfa2153 and psp2999 (Glu3-1A) that were flanking tin were used to identify recombinants. Corresponding F2 embryos were planted and progeny tested for tiller number in the F3 generation (at least 12 individuals per line). The Watkins lines were genotyped with the SSR marker gwm136 using capillary electrophoresis (Applied Biosystems 3130 Genetic Analyser) to resolve DNA fragment sizes.
Expression analysis of cellulose synthase-like gene
At four time points from the double-ridge to late stem elongation phase, elongating internodes were sampled from Banks and NILs with three replicates, and RNA was extracted using a Qiagen RNeasy Plant kit (catalogue no. 74904) with the incorporation of a DNAse treatment (catalogue no. 79254). A Qiagen OneStep RT PCR kit (catalogue no. 210212) was used to synthesise cDNA, including control reactions that lacked reverse transcriptase (RT). Biorad iQ SYBR Green Supermix was used for quantitative real-time PCR (qPCR) using two technical replicates per sample and non-RT checks. The marker CSL_20 amplified a 130-bp product from the Csl gene. Initially, expression levels of three constitutively expressed genes, namely ubiquitin, glyceraldehyde 3-phosphate dehydrogenase (GAPDH), and β-actin, were assessed. GAPDH expression level was invariant and was selected as a reference gene. Relative gene expression was calculated using the ∆∆Cq method (Bustin, et al., 2009). Primer sequences for markers used in this study are listed in Supplementary Table S3. The length of the 5′UTR of the Csl gene was determined using a Clontech SMARTer 5′RACE kit (catalogue no. 634858).
Screening of 1AS-specific Chinese Spring BAC library and construction of non-gridded BAC library from line 492
The 1AS chromosome-specific BAC Library (named TaaCsp1AShA) was constructed from DNA of the chromosome-arm flow-sorted hexaploid wheat T. aestivum Chinese Spring in the frame of the IWGSC project and as described in Breen et al. (2013). The library is available at the Institute of Experimental Botany (http://olomouc.ueb.cas.cz/dnalib/taacsp1asha) and at the French Plant Genomic Center (http://cnrgv.toulouse.inra.fr/en/library/genomic_resource/TaaCsp1AShA). The TaaCsp1AShA BAC library is represented by 31 104 BAC clones (81 384 well plates) with an average insert size of 111 kb, thus representing a 11.8× chromosome arm coverage. The 384 BAC clones of each plate were pooled into 81 plate pools. Pools were screened using the gwm136-specific PCR primers. For each positive plate, row and columns pools were constructed in order to find the coordinates of the positive BAC clones. Each positive coordinates of BAC clones were validated individually by PCR amplification using the specific gwm136 PCR primers.
A non-gridded BAC library, namely Tae-B-492-ng, was constructed from the gDNA of the wheat line 492 (AUS 20430). The non-gridded BAC library was constructed based on the protocol described in Isidore et al. (2005) with the modifications previously described in Mago et al. (2014). High molecular weight (HMW) DNA was extracted from 20 g of leaf material from line 492. Embedded HMW DNA was partially digested using HindIII (Sigma-Aldrich, St-Louis, Missouri), size-selected, eluted, and ligated into the pIndigoBAC-5 HindIII-Cloning Ready vector (Epicentre Biotechnologies, Madison, Wisconsin). From this HMW DNA extraction, four independent sizing steps led to the production of 490 936 clones. To evaluate the average insert size of the library, the DNA was isolated from randomly selected BAC clones, digested with the NotI restriction enzyme, and analysed using Pulsed-Field Gel Electrophoresis (PFGE). All fragments generated by NotI digestion contained the 7.5-kb pIndigoBAC-5 vector band and various insert fragments. Analysis of insert sizes from these BAC clones indicated a mean average size of 120 kb. Thus, the BAC clones produced represent a total of ~3.3-fold coverage of the genome. BAC clones were divided into 384 pools before overnight growth and DNA amplification. Each pool contained 1280 individual BAC clones on average. Pools were screened by PCR using the specific markers ctg4_94K, gwm136 and 33N02unk.
Results
Plant morphology
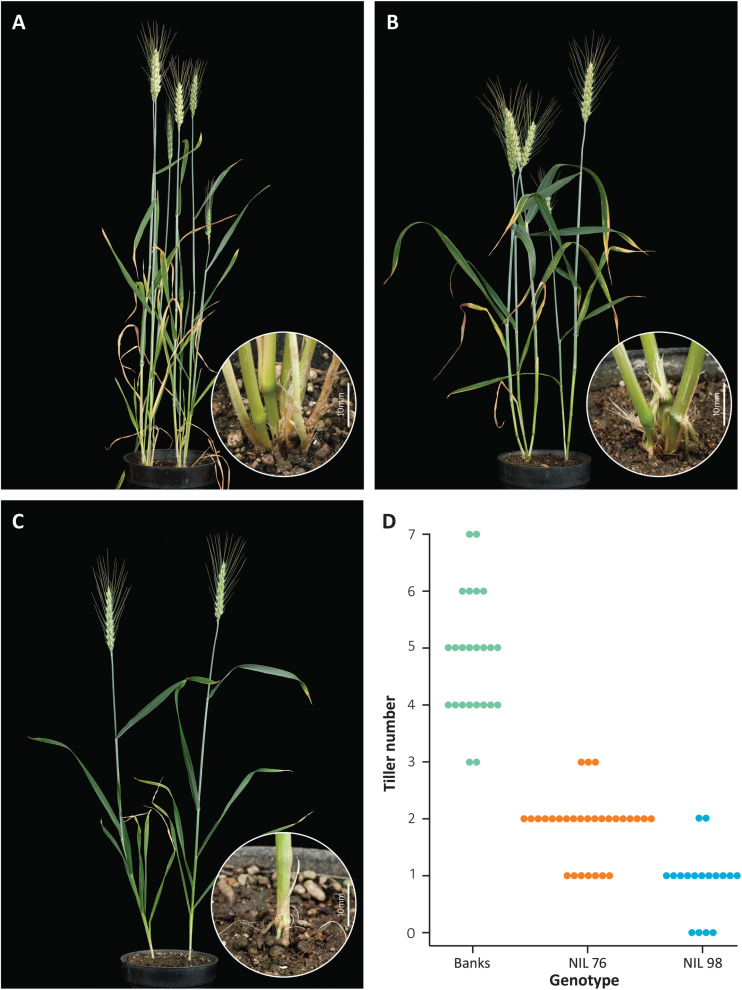
The near-isogenic line Banks+tin that was previously used for agronomic assessment of tin was developed by transferring the gene from the ‘492’ donor line into the Australian wheat cultivar ‘Banks’ (Richards, 1988). For this study a BC5F2:F3 population was generated and two lines (NIL76 and NIL98) were selected that both carried the tin gene but showed heritable differences in the severity of reduction in tiller number (Fig. 1). Under controlled growth conditions, the free-tillering Banks produced an average of 4.8 (±0.2 SE) tillers, compared with 1.9 (±0.1) tillers for NIL76 and 0.9 (±0.1) for NIL98 (Fig. 1). These lines were used for subsequent experiments to analyse the effect of tin on the morphological, chemical, and physical properties of the stem, and used as parental lines in the genetic analysis.
Fig 1.
Tillering behaviour of free-tillering cultivar Banks (A) and reduced-tillering near-isogenic lines NIL76 (B) and NIL98 (C). (D) Stacked dot-plot showing tiller number of individual plants from Banks (n=24), NIL 76 (n=29), and NIL98 (n=17) at terminal spikelet stage before stem elongation and when grown under controlled conditions. Dots represent tiller scores from individual plants.
Stem morphology
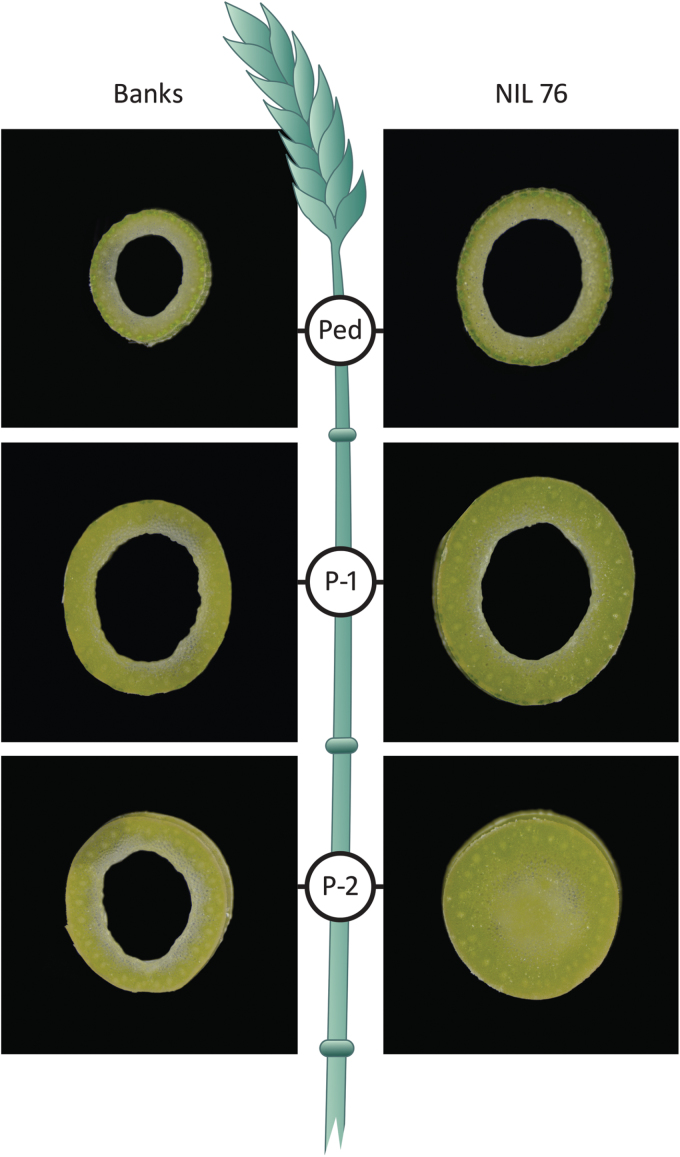
Average plant height at heading was similar between Banks and NIL76 (Z50–59), although individual internode lengths varied slightly (see Supplementary Fig. S1). At the same time point, the outer stem diameter of NIL76 was wider than in Banks (Supplementary Fig. S2) and lower internodes of NIL76 were solid, which was most pronounced in the P-2 internode (Fig. 2).
Fig 2.
Stem cross-sections of cultivar Banks and NIL76 at heading from the midpoint of the peduncle (Ped), the first internode below the peduncle (P-1), and the second internode below the peduncle (P-2).
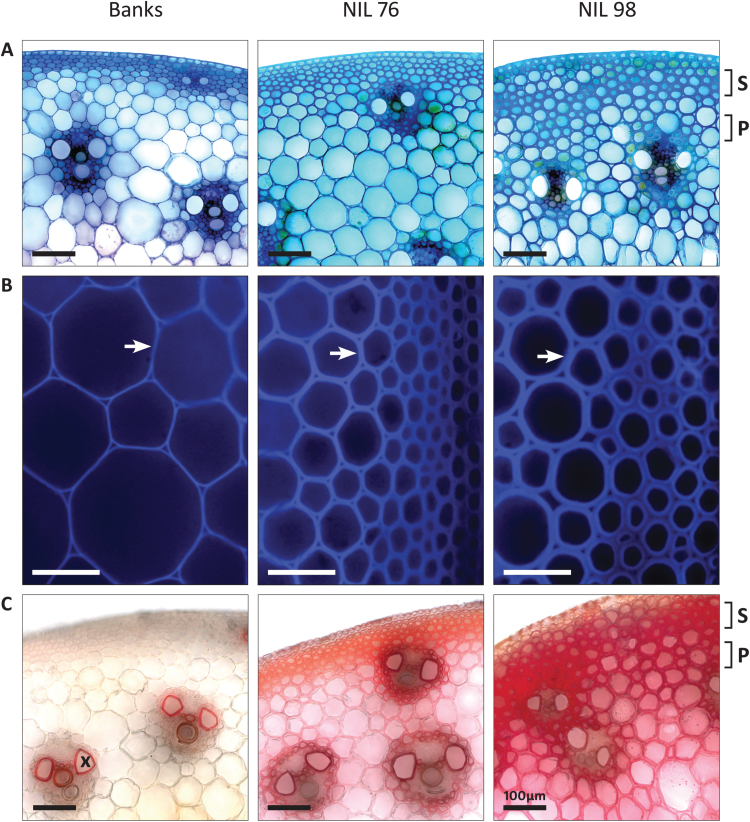
To further examine stem morphology, the P-2 internode was harvested during late stem elongation (Z37–39). Cross-sections of NILs were stained with Toluidine Blue or Mäule reagent and viewed under light and fluorescent illumination (Fig. 3). As shown in Fig. 3A, a colour difference was evident, with sections from Banks appearing light blue-violet, compared to a darker turquoise in NILs containing tin. Toluidine Blue stains cell wall polysaccharides violet whereas lignin appears more turquoise (Matos et al., 2013), suggesting that cell walls of tin stems contain more lignin than Banks. Sclerenchyma (S) cell walls appeared thickened in NIL76 and NIL98 relative to Banks (Fig. 3A). In addition, the parenchyma (P) also appeared to have thicker cell walls in NIL98. Thicker walls in the NILs containing tin was emphasised by autofluorescence imaging of the sections (Fig. 3B). NIL76, with an oligoculm phenotype, showed an increased thickness in cell walls relative to Banks, but uniculm NIL98 showed an even greater thickness of cell walls (arrows). We found no differences in vascular bundle density between the NILs (data not shown).
Fig. 3.
Microscopic analysis of stem cross-sections of cultivar Banks, NIL76, and NIL98 from the midpoint of internode P-2 at late stem elongation. (A) Toluidine Blue stain with bright-field illumination (20×). (B) Unstained, autofluorescence (20×). (C) Mäule stain with bright-field illumination (20×). Sclerenchyma (S) and parenchyma (P) cell layers, and xylem vessel (X) are indicated. Cell wall thickening is indicated by the arrows. Scale bars=100 µm.
Given the apparent increase in cell wall thickness in NIL76 and NIL98, sections were treated with Mäule reagent for lignin, which is a major component of secondary cell walls (Fig. 3C). Xylem vessels (X) in Banks, NIL76, and NIL98 were red-brown, signifying lignification as expected in these transport vessels. In addition, walls of parenchyma (P) and sclerenchyma (S) cells were also lignified in NIL76. This effect was most pronounced in NIL98, as seen by deeper red staining of cell walls. Mäule reagent stains guaiacyl monolignol subunits brown and syringyl subunits red (Tu et al., 2010). To confirm these results, lignin content was quantified in main stems using chemical analysis.
Stem chemical analysis
Microscopic analysis indicated differences in cell wall thickness and composition between NILs. To determine the lignin content, total lignin was extracted from the whole stem during late elongation (Z37–39) and quantified. The lignin content of NIL76 as a percentage of total cell wall dry weight was higher than that of Banks (14% ±0.2 vs 12% ±0.4; P<0.01). These results were consistent with the microscopic observations and suggested that the tin gene contributed to an increase in secondary cell wall thickening and lignin content in elongating stem internodes. Given that cellulose is also an important structural component of cell walls, crystalline cellulose content was quantified in whole stems of Banks and NILs. There was no difference in cellulose content per unit dry stem weight between genotypes (data not shown).
Stem physical analysis
It is possible that increased stem diameter and solidness, changes in cell wall thickness, and increased lignification may result in greater strength of the wheat stem, which in turn could affect lodging resistance. To test this hypothesis, stem strength and rigidity was measured using the three-point bend test previously utilised to give an index of lodging resistance in cereals (Kokubo et al., 1989; Crook and Ennos, 1994). Strength refers to the ability of the stem to withstand force without breaking and its determination considers the solidness of the stem. Rigidity is a measure of the stiffness or flexibility of the stem. Both strength and rigidity are important parameters for the consideration of lodging.
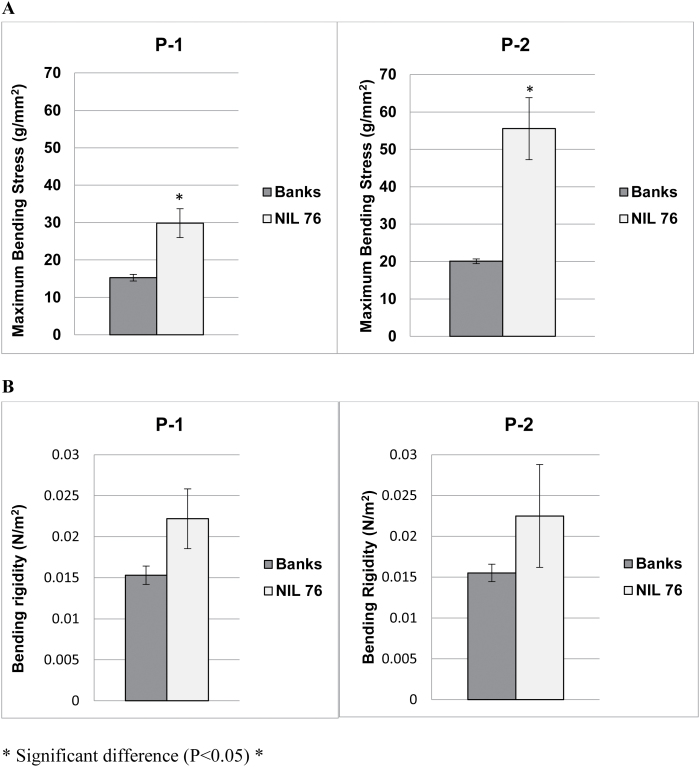
The stem strength of P-1 and P-2 internodes in NIL76 was greater than in Banks (Fig. 4A). NIL76 internode P-1 had double the maximum bending stress of Banks (30 g mm–2 ±3.9 vs 15 g mm–2 ±0.9, respectively). Differences were even more striking in P-2, where the mean strength of NIL76 (56 g mm–2 ±8.3) was 2.8-fold greater than Banks (20 g mm–2 ±0.6). In two NIL76 plants, P-2 snapped during the bend test, suggesting that for these lines the stress exceeded the tensile strength while other stems deformed by bending only. There was a tendency for the bending rigidity to increase in NIL76 relative to Banks without being statistically significant (Fig. 4B).
Fig. 4.
Mean physical stem strength and rigidity (±SE) of cultivar Banks and NIL76 (P-1, P-2 internodes) at maturity (n=5–6). (A) Mean strength determined as maximum bending stress. (B) Mean bending rigidity at midpoints. *Statistical difference at P<0.05.
Genetic and physical mapping of the tin region
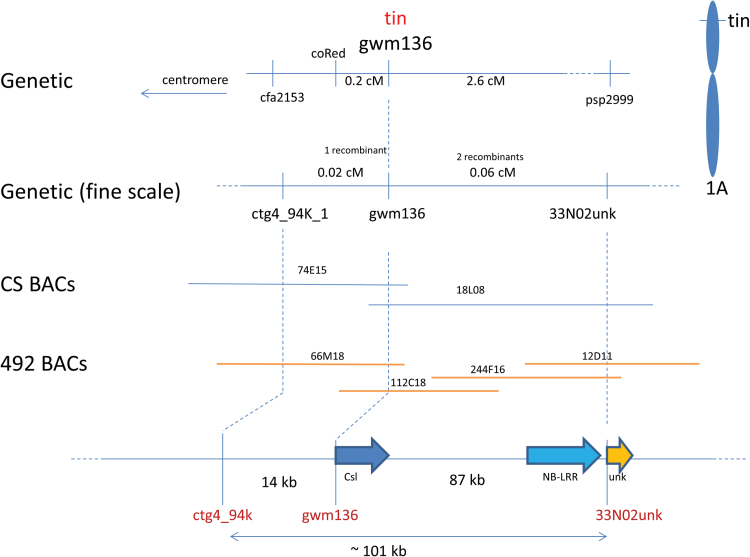
Previously, the tin gene was mapped to the distal region of chromosome 1AS and linked to the SSR markers gwm136 and psp2999 (Glu3A) (Spielmeyer and Richards, 2004). In this study, an additional SSR marker cfa2153 was identified that flanked the gene on the proximal side. Flanking markers cfa2153 and psp2999 were used to genotype 2816 F2s derived from backcrossing a NIL carrying tin to Banks. The screen identified 88 recombinants and defined a genetic interval of approximately 3 cM containing tin (Fig. 5). These recombinants were scored for tiller number in the F2/F3 generations and genotyped with gwm136, which co-segregated with tin.
Fig. 5.
Genetic and physical map of the tin region located on chromosome 1AS. Genetic distances (cM) based on the recombination rate in F2 mapping family derived from Banks × NIL76. Physical maps of the tin region constructed with BAC clones from cultivar Chinese Spring and reduced-tillering donor line 492. Annotation of the DNA sequence spanning the region identified two predicted open-reading frames: Csl, cellulose synthase-like, and NB-LRR, nucleotide-binding leucine-rich repeat genes.
A chromosome arm-specific BAC library from Chinese Spring (CS) was screened with gwm136 to isolate clones 74E15 and 18L08 (Fig. 5). Because the same BAC library was used for the construction of the physical map of 1AS, these clones were fingerprinted and shown to be part of the same DNA sequence scaffold (Breen et al., 2013). DNA sequencing confirmed that these clones overlapped and spanned approximately 180 kb of genomic sequence that contained the SSR marker gwm136. A PCR-based marker 33N02unk derived from the BAC end of 18L08 flanked the tin gene on the distal side (two recombinants, Fig.5). A PCR-based marker ctg4_94k derived from 74E15 co-segregated with tin.
To increase the map resolution on the proximal side, a second round of marker screening was initiated using 33N02unk and coRed, a PCR-based marker that was previously identified and which mapped closer to tin on the proximal side of the gene (Fig. 5). Within 760 F2s, 12 additional recombinants were identified between 33N02unk and coRed, which revealed one recombinant between the gene and marker ctg4_94k after lines were phenotyped for tiller number. A physical interval of approximately 98 kb in CS corresponded to the genetic interval that contained tin and the SSR marker gwm136 (Fig. 5).
To compare gene content of the tin region in the free-tillering CS with the tin donor line 492, a non-gridded BAC library was constructed from line 492 and screened with markers ctg4_94K, gwm136, and 33N02unk. BAC clones 66M18, 112C18, 12D11, and 244F16 were isolated, and when sequenced spanned a contig of approximately 101 kb. Sequence comparison of the region in CS and 492 revealed a high level of sequence homology (>96% identity) with a few short expansions evident in non-coding regions of the tin haplotype relative to CS. Gene annotation of this region identified a predicted full-length gene belonging to the Nucleotide Binding Leucine-Rich Repeat (NB-LRR) gene family with several SNPs within the predicted coding region of CS and 492. Another predicted full-length gene was annotated as a member of the Cellulose synthase-like (Csl) gene family. These were the only genes annotated in approximately 100 kb of sequence that included the tin gene. Csl genes belong to a large gene family, of which some members have been shown to encode enzymes involved in the synthesis of hemicelluloses (Richmond and Somerville, 2000). Given the cell wall changes observed in stems of tin plants, we focused on Csl as a candidate gene for tin.
Cellulose synthase-like as candidate gene for tin
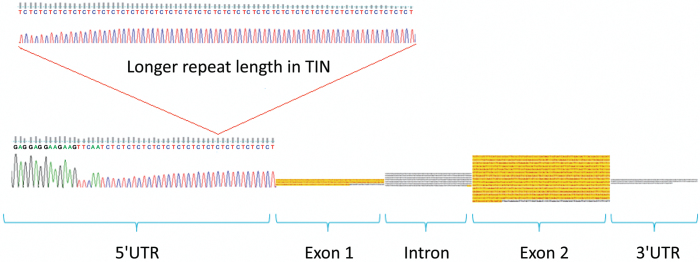
The open-reading frame (ORF) of the predicted Csl gene was 1530 nucleotides and consisted of two exons (Fig. 6) (GenBank accession no. KY554802). Comparison of the predicted amino acid (aa) sequence placed the Csl candidate gene in the CslA clade of the Cellulose Synthase Superfamily. The aa sequence of the Csl candidate was 58% identical to the rice glucomannan 4-beta-mannosyltransferase (see Supplementary Fig. S3), which was the nearest homolog that was functionally tested and confirmed to synthesise mannans in a heterologous expression system (Liepman et al., 2007; Doblin et al., 2010). The ORFs of line 492 and Chinese Spring (CS) were identical at the nucleotide level. There was also no change in predicted ORFs of NIL76 and Banks. However, in the 5′region of the gene, a CT repeat of approximately 190 bp present in the tin haplotype of both NIL76 and NIL98 was shortened by approximately 80 bp and 40 bp in Banks and CS, respectively (Fig. 6). The length polymorphism of the CT repeat was assayed with gwm136, the tight physical linkage being consistent with a lack of recombinants between the marker and gene in the high-resolution population. 5′RACE RT-PCR confirmed that the CT repeat was part of the 5′-untranslated region (UTR) in Banks and NIL76.
Fig. 6.
Schematic representation of the cellulose synthase-like gene including intron/exon structure and the 5′UTR region that contains repeat-length polymorphisms between the free-tillering cultivar Banks and the reduced-tillering NILs. Exons are shown in yellow.
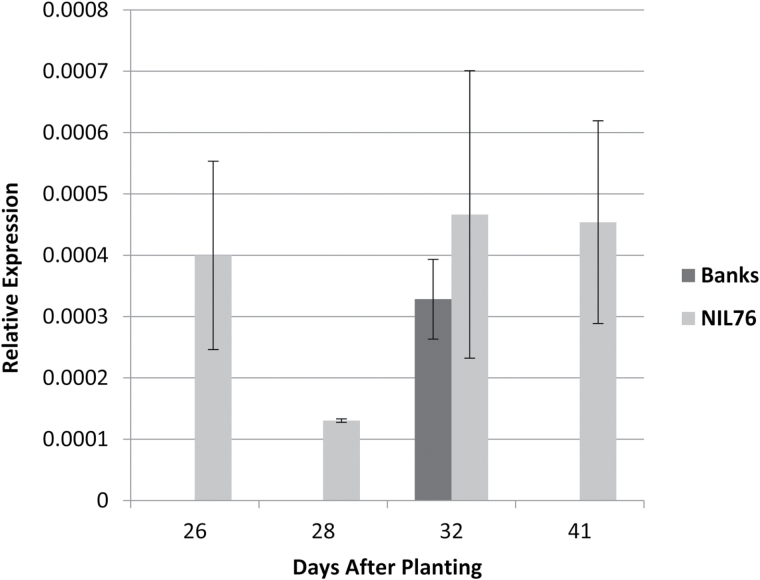
To study the possible effect of repeat-length variation on gene expression, transcript levels of Csl were assessed by qPCR in NIL76 and Banks at four time points in internodes of the primary stems. For the first time point, stem tissue was harvested before stems started to elongate (Z30), while later time points were from early to late stages of stem elongation. Although gene expression was low and variable, Csl transcripts were detected in NIL76 across all time points but were only detectable in Banks at 32 d after planting (DAP), when terminal spikelet stage was reached and stem elongation commenced (Fig. 7).
Fig. 7.
Mean relative expression (±SE) of the cellulose synthase-like gene in elongating internodes of primary stems of cultivar Banks and NIL76. Three biological replicates from each line were sampled at four time points, which corresponded to double-ridge (26 d after planting, DAP), terminal spikelet (28 DAP), early stem elongation (32 DAP), and late stem elongation (41 DAP).
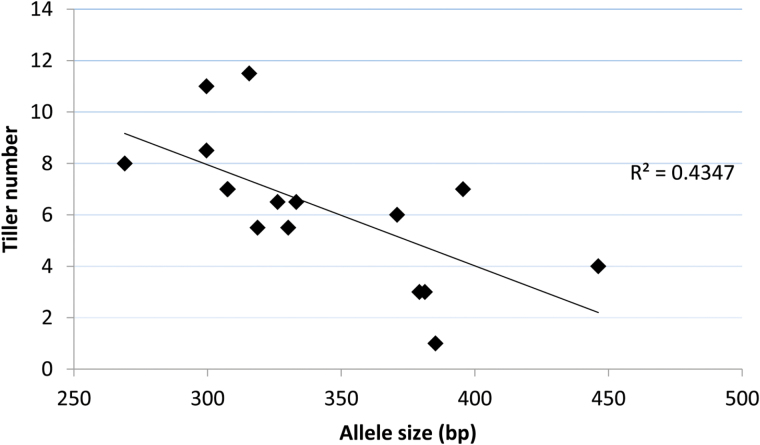
We studied the allelic diversity of the repeat-length variation in the 5′UTR region and possible association with tillering by assaying the polymorphism detected by gwm136 in diverse and historical wheat landraces contained within the Watkins collection. The primer sequences of gwm136 were almost immediately flanking the CT repeat. The analysis revealed a high level of polymorphism across 118 landraces, with gwm136 allele sizes varying from 242 to 446 bp, and including a null allele (see Supplementary Table S2). When these landraces were grown under glasshouse conditions, a subset of 16 lines with similar maturity were selected for tiller number assessment at anthesis. There was a negative correlation (R2=0.4) between tiller number and repeat-length as detected by gwm136 (Fig. 8). This finding is consistent with the hypothesis that longer repeats in the 5′UTR region of the Csl gene contribute to a reduction in tiller number. Not all lines with long repeats were low-tillering, and the correlation was only significant in lines with similar phenology, because the timing of the vegetative to floral transition has a major impact on tillering behaviour.
Fig. 8.
Allele survey of repeat-length polymorphisms detected by the SSR marker gwm136 in a subset of 16 Watkins lines and the association with average tiller number of glasshouse-grown plants.
Discussion
The tiller inhibition gene (tin) affects branching and the above-ground morphology of wheat plants. Here, we report changes in wheat stems including increased solidness and cell wall thickness, lignin composition, and stem strength. Map-based cloning identified a cellulose synthase-like (Csl) gene as a candidate for tin. The phenotypic changes were associated with variation in the length of a microsatellite repeat in the 5′UTR of the Csl gene.
Stems of NILs with tin have larger outer diameter and more-solid internodes during the late stage of stem elongation than the free-tillering cultivar Banks. Previously, stem solidness was linked to tin in the early stage of stem elongation, which was also accompanied by early elongation of tin internodes (Kebrom et al., 2012). Wheat stems in general are solid at the nodal region; however, during internode elongation the inner cell area becomes lost, forming intermodal lacuna (or hollow stems) (Kirby, 2002). This phenomenon explains why internodes begin as solid tissue, gradually becoming hollow at the internode midpoint. Future work will focus on the study of tin regulation and a possible role in reducing the rate of cell breakdown in the central pith.
In addition to more-solid internodes, tin was associated with an increase in stem cell wall thickness and lignin content, as determined using microscopic and chemical analysis. Microscopic analysis of stem sections showed that walls of all major cell types in P-2 were thicker in tin plants and suggested that these cell walls contained more lignin than the Banks plants. Lignin quantification agreed with the histochemical results, that stems of NIL76 contained more lignin per dry weight than Banks, approaching the expected lignin content of mature wheat straw (del Río et al., 2012). These findings suggest an increase in secondary cell wall development in tin that resulted in thicker cell walls and enhanced lignification.
Cells that typically develop secondary walls in wheat stems are xylem and sclerenchyma, found in and around vascular bundles to facilitate water and solute transport and to provide mechanical support. Sclerenchyma beneath the epidermis developed thicker walls that contained more lignin in tin stems than Banks. Parenchyma cell walls of NIL76 and NIL98 also appear to be more lignified, which may be due to secondary thickening. Parenchyma cells, typically the largest in the cross-section of a wheat stem, are found predominantly in the pith and usually have thin primary walls to facilitate expansion. Thickening of the parenchyma cell walls can make the cells appear smaller; however, this is probably due to these walls extending into the cell lumen. There are some examples of lignification occurring in parenchyma cells independent of secondary wall development in Brachypodium distachyon, perennial ryegrass, and maize (Chesson et al., 1997; Tu et al., 2010; Matos et al., 2013). Based on these results, it is unclear if parenchyma cell walls in tin stems have undergone secondary thickening or lignification of primary wall structures. In summary, the tin gene was associated with major changes in carbon allocation from early to late stages of development that altered overall stem dimensions and also cell wall structure and composition.
Numerous studies have reported correlations between stem wall morphology, lignification, and lodging resistance in buckwheat (Wang et al., 2014), rice (Zhang et al., 2014), and wheat (Peng et al., 2014). Specifically, an increase in lignification of sclerenchyma and thickening of the cortex cell layer was associated with lodging resistance in wheat (Kong et al., 2013). In light of changes in stem morphology and lignification between NILs, we examined possible differences in physical strength parameters that may influence resistance to lodging under field conditions. Using the three-point bend test, stem strength but not rigidity increased in internodes of NIL76 compared to Banks. Strength and rigidity are affected by the stem morphology, the thickness of cell walls and their composition (see Forbes and Watson, 1992, for a review). It is possible that the increased bending strength in tin stems was due to greater compressive (not tensile) strength as some of the NIL76 P-2 internodes snapped during testing, with the break occurring on the underside of the stem. These results are consistent with an increased lignification of tin stems because more lignin confers higher compressive strength due to the highly cross-linked 3-dimensional network it forms, whereas tensile strength of the stem is less affected by the presence of lignin alone (MacMillan et al., 2010). Field trials will need to be conducted to determine whether increased strength of tin stems also translates into greater lodging resistance.
In determining the molecular basis of tin, the gene was placed within a physical interval of approximately 100 kb in the donor line ‘492’. The region of interest contained two predicted genes with homology to NB-LRR-like gene and a Csl gene. Given the changes in cell wall properties reported herein, we focused on Csl as a candidate gene for tin. Since we found no polymorphism in the ORF between NILs, we postulated that repeat-length variation in the 5′UTR affected transcript levels and/or translation, thereby altering Csl enzyme levels in elongating internodes. In support of this hypothesis, we demonstrated that tin was associated with higher transcript levels, although the relative expression levels of this gene were low, consistent with previous reports of low expression levels for members of this gene family (Hamann et al., 2004). In Banks, the Csl gene was expressed at 32 DAP, which coincided with the time of rapid internode elongation in Banks (Kebrom et al., 2012). However, in NILs containing tin, Csl gene expression occurred at least 6 d earlier. Thus, early gene expression coincided with precocious internode elongation in tin (Kebrom et al., 2012).
The allele survey of diverse wheat landraces established a correlation between repeat length in the 5′UTR region of the Csl gene and tiller number, suggesting a functional link between SSR length and the tin phenotype. SSRs in 5′UTRs were previously linked to changes in transcription or translation of genes encoding enzymes in plants (Li et al., 2004; Zhao et al., 2014; Joshi-Saha and Reddy, 2015). Tight physical linkage confirms that the SSR marker gwm136 is a diagnostic marker to select and transfer tin in breeding programs. Future work will focus on the functional proof of the Csl gene, and on elucidating how gene function is linked to changes in stem strength and cell wall composition and other aspects of wheat physiology.
Supplementary data
Supplementary data are available at JXB online.
Table S1. Developmental stages of wheat and corresponding Zadoks scale.
Table S2. Allele size of gwm136 in parental lines and in the Watkins collection.
Table S3. PCR primer sequences of markers.
Note S1. Calculations for bending strength and rigidity.
Fig. S1. Mean internode lengths of Banks and NIL76 at heading.
Fig. S2. Mean outer stem diameters of Banks and NIL76 at heading.
Fig. S3. Amino acid sequence of CslA (tin).
Supplementary Material
Acknowledgements
The authors thank Dina Yulia and Dr Mark Talbot for technical assistance, Dr Greg Grimes (Australian Winter Cereals Collection, AWCC) for seed of the Watkins collection, and Dr Rachel Burton and Dr Julian Schwerdt for discussions and advice. We thank Carl Davies for the design of figures and Dr Alec Zwart for statistical advice. The authors declare no conflict of interest during this work. Funding was provided by CSIRO Agriculture & Food.
References
- Atsmon D, Bush MG, Evans LT. 1986. Stunting in gigas wheat as influenced by temperature and day length. Australian Journal of Plant Physiology 13, 381–389. [Google Scholar]
- Atsmon D, Jacobs E. 1977. Newly bred gigas form of bread wheat (Triticum aestivum L.): morphological features and thermo-photoperiodic responses. Crop Science 17, 31–35. [Google Scholar]
- Breen J, Wicker T, Shatalina M, et al. 2013. A physical map of the short arm of wheat chromosome 1A. PLoS ONE 8, e80272. [DOI] [PMC free article] [PubMed] [Google Scholar]
- Bustin SA, Benes V, Garson JA, et al. 2009. The MIQE guidelines: minimum information for publication of quantitative real-time PCR experiments. Clinical Chemistry 55, 611–622. [DOI] [PubMed] [Google Scholar]
- Chesson A, Provan GJ, Russell W, Scobbie L, Chabbert B, Monties B. 1997. Characterisation of lignin from parenchyma and sclerenchyma cell walls of the maize internode. Journal of the Science of Food and Agriculture 73, 10–16. [Google Scholar]
- Crook MJ, Ennos AR. 1994. Stem and root characteristics associated with lodging resistance in four winter wheat cultivars. The Journal of Agricultural Science 123, 167–174. [Google Scholar]
- del Río JC, Rencoret J, Prinsen P, Martínez ÁT, Ralph J, Gutiérrez A. 2012. Structural characterization of wheat straw lignin as revealed by analytical pyrolysis, 2D-NMR, and reductive cleavage methods. Journal of Agricultural and Food Chemistry 60, 5922–5935. [DOI] [PubMed] [Google Scholar]
- Doblin M, Pettolino F, Bacic A. 2010 Plant cell walls: the skeleton of the plant world. Functional Plant Biology 37, 357–381. [Google Scholar]
- Duggan BL, Richards RA, van Herwaarden AF, Fettell NA. 2005. Agronomic evaluation of a tiller inhibition gene (tin) in wheat I. Effect on yield, yield components, and grain protein. Australian Journal of Agricultural Research 56, 169–178. [Google Scholar]
- Ellis MH, Rebetzke GJ, Azanza F, Richards RA, Spielmeyer W. 2005. Molecular mapping of gibberellin-responsive dwarfing genes in bread wheat. Theoretical and Applied Genetics 111, 423–430. [DOI] [PubMed] [Google Scholar]
- Forbes JC, Watson D. 1992. Plant strength and integrity. In: Plants in agriculture. Cambridge University Press, 82–109. [Google Scholar]
- Hamann T, Osborne E, Youngs H, Misson J, Nussaume L, Somerville C. 2004. Global expression analysis of CESA and CSL genes in Arabidopsis. Cellulose 11, 279–286. [Google Scholar]
- Isidore E, Scherrer B, Bellec A, et al. 2005. Direct targeting and rapid isolation of BAC clones spanning a defined chromosome region. Functional & Integrative Genomics 5, 97–103. [DOI] [PubMed] [Google Scholar]
- Joshi-Saha A, Reddy KS. 2015. Repeat length variation in the 5′UTR of myo-inositol monophosphatase gene is related to phytic acid content and contributes to drought tolerance in chickpea (Cicer arietinum L.). Journal of Experimental Botany 66, 5683–5690. [DOI] [PubMed] [Google Scholar]
- Kebrom TH, Chandler PM, Swain SM, King RW, Richards RA, Spielmeyer W. 2012. Inhibition of tiller bud outgrowth in the tin mutant of wheat is associated with precocious internode development. Plant Physiology 160, 308–318. [DOI] [PMC free article] [PubMed] [Google Scholar]
- Kebrom TH, Richards R. 2013. Physiological perspectives of reduced tillering and stunting in the tiller inhibition (tin) mutant of wheat. Functional Plant Biology 40, 977–985. [DOI] [PubMed] [Google Scholar]
- Kirby EJM. 2002. Botany of the wheat plant. In: Curtis BC, Rajaram S, Macpherson HG. eds. Bread wheat, improvement and production. Rome: FAO Plant Production Series No. 30. [Google Scholar]
- Kokubo A, Kuraishi S, Sakurai N. 1989. Culm strength of barley: correlation among maximum bending stress, cell wall dimensions, and cellulose content. Plant Physiology 91, 876–882. [DOI] [PMC free article] [PubMed] [Google Scholar]
- Kong E, Liu D, Guo X, et al. 2013. Anatomical and chemical characteristics associated with lodging resistance in wheat. Crop Journal 1, 43–49. [Google Scholar]
- Li YC, Korol AB, Fahima T, Nevo E. 2004. Microsatellites within genes: structure, function, and evolution. Molecular Biology and Evolution 21, 991–1007. [DOI] [PubMed] [Google Scholar]
- Liepman AH, Nairn CJ, Willats WG, Sørensen I, Roberts AW, Keegstra K. 2007. Functional genomic analysis supports conservation of function among Cellulose synthase-like A gene family members and suggests diverse roles of mannans in plants. Plant Physiology 143, 1881–1893. [DOI] [PMC free article] [PubMed] [Google Scholar]
- MacMillan CP, Mansfield SD, Stachurski ZH, Evans R, Southerton SG. 2010. Fasciclin-like arabinogalactan proteins: specialization for stem biomechanics and cell wall architecture in Arabidopsis and Eucalyptus. The Plant Journal 62, 689–703. [DOI] [PubMed] [Google Scholar]
- Mago R, Tabe L, Vautrin S, et al. 2014. Major haplotype divergence including multiple germin-like protein genes, at the wheat Sr2 adult plant stem rust resistance locus. BMC Plant Biology 14, 379. [DOI] [PMC free article] [PubMed] [Google Scholar]
- Matos DA, Whitney IP, Harrington MJ, Hazen SP. 2013. Cell walls and the developmental anatomy of the Brachypodium distachyon stem internode. PLoS ONE 8, e80640. [DOI] [PMC free article] [PubMed] [Google Scholar]
- Mitchell JH, Chapman SC, Rebetzke GJ, Bonnett DG, Fukai S. 2012. Evaluation of a reduced-tillering (tin) gene in wheat lines grown across different production environments. Crop Pasture Science 63, 128–41. [Google Scholar]
- Mitchell JH, Rebetzke GJ, Chapman SC, Fukai S. 2013. Evaluation of reduced-tillering (tin) wheat lines in managed, terminal water deficit environments. Journal of Experimental Botany 64, 3439–3451. [DOI] [PMC free article] [PubMed] [Google Scholar]
- Moeller C, Evers JB, Rebetzke G. 2014. Canopy architectural and physiological characterization of near-isogenic wheat lines differing in the tiller inhibition gene tin. Frontiers in Plant Science 5, 617. [DOI] [PMC free article] [PubMed] [Google Scholar]
- Peng D, Chen X, Yin Y, Lu K, Yang W, Tang Y, Wang Z. 2014. Lodging resistance of winter wheat (Triticum aestivum L.): lignin accumulation and its related enzymes activities due to the application of paclobutrazol or gibberellin acid. Field Crops Research 157, 1–7. [Google Scholar]
- Pettolino FA, Walsh C, Fincher GB, Bacic A. 2012. Determining the polysaccharide composition of plant cell walls. Nature Protocols 7, 1590–1607. [DOI] [PubMed] [Google Scholar]
- Richards R. 1988. A tiller inhibition gene in wheat and its effect on plant growth. Australian Journal of Agricultural Research 39, 749–757. [Google Scholar]
- Richmond TA, Somerville CR. 2000. The cellulose synthase superfamily. Plant Physiology 124, 495–498. [DOI] [PMC free article] [PubMed] [Google Scholar]
- Spielmeyer W, Richards RA. 2004. Comparative mapping of wheat chromosome 1AS which contains the tiller inhibition gene (tin) with rice chromosome 5S. Theoretical and Applied Genetics 109, 1303–1310. [DOI] [PubMed] [Google Scholar]
- Theander O, Westerlund EA. 1986. Studies on dietary fiber. 3. Improved procedures for analysis of dietary fiber. Journal of Agricultural and Food Chemistry 34, 330–336. [Google Scholar]
- Timoshenko S. 1955. Strength of materials. New York: Van Nostrand Reinhold Co, 92–136. [Google Scholar]
- Tu Y, Rochfort S, Liu Z, et al. 2010. Functional analyses of caffeic acid O-Methyltransferase and Cinnamoyl-CoA-reductase genes from perennial ryegrass (Lolium perenne). The Plant Cell 22, 3357–3373. [DOI] [PMC free article] [PubMed] [Google Scholar]
- Wang C, Tang Y, Guo Y. 2014. Adenosine deaminase biosensor combining cationic conjugated polymer-based FRET with deoxyguanosine-based photoinduced electron transfer. ACS Applied Materials & Interfaces 6, 21686–21691. [DOI] [PubMed] [Google Scholar]
- Wingen LU, Orford S, Goram R, et al. 2014. Establishing the A. E. Watkins landrace cultivar collection as a resource for systematic gene discovery in bread wheat. Theoretical and Applied Genetics 127, 1831–1842. [DOI] [PMC free article] [PubMed] [Google Scholar]
- Zadoks JC, Chang TT, Konzak CF. 1974. A decimal code for the growth stages of cereals. Weed Research 14, 415–421. [Google Scholar]
- Zhang J, Li G, Song Y, Liu Z, Yang C, Tang S, Zheng C, Wang S, Ding Y. 2014. Lodging resistance characteristics of high-yielding rice populations. Field Crops Research 161, 64–74. [Google Scholar]
- Zhao Z, Guo C, Sutharzan S, Li P, Echt CS, Zhang J, Liang C. 2014. Genome-wide analysis of tandem repeats in plants and green algae. G3. Genes Genomes Genetics 4, 67–78. [DOI] [PMC free article] [PubMed] [Google Scholar]
Associated Data
This section collects any data citations, data availability statements, or supplementary materials included in this article.


