Abstract
Purpose
To investigate the heating of EEG electrodes during MRI scans and to better understand the underlying physical mechanisms with a focus on the antenna effect.
Materials and Methods
Gold cup and conductive plastic electrodes were placed on small watermelons with fiberoptic probes used to measure electrode temperature changes during a variety of 1.5T and 3T MRI scans. A subset of these experiments was repeated on a healthy human volunteer.
Results
The differences between gold and plastic electrodes did not appear to be practically significant. For both electrode types, we observed heating below 4°C for straight wires whose lengths were multiples of ½ the radiofrequency (RF) wavelength and stronger heating (over 15°C) for wire lengths that were odd multiples of ¼ RF wavelength, consistent with the antenna effect.
Conclusions
The antenna effect, which has received little attention so far in the context of EEG-MRI safety, can play as significant a role as the loop effect (from electromagnetic induction) in the heating of EEG electrodes, and therefore wire lengths that are odd multiples of ¼ RF wavelength should be avoided. These results have important implications for the design of EEG electrodes and MRI studies as they help to minimize the risk to patients undergoing MRI with EEG electrodes in place.
Keywords: MRI safety, thermal injuries, antenna effect, electromagnetic induction, EEG-fMRI
Introduction
The electroencephalography (EEG) electrodes typically used in clinical settings—epilepsy long-term monitoring (LTM) or intensive care units (ICUs)—are often removed prior to MRI scanning at 3T due to safety concerns regarding their heating by the radiofrequency (RF) pulses that are transmitted during MRI scans1,2. It would be advantageous to (i) leave these electrodes on during routine clinical MRI scans and (ii) be able to record directly from these electrodes during functional MRI scans, as originally demonstrated by Ives et al.3
From a clinical perspective, the main advantages of leaving the electrodes in place during MRI scans are reduced wear-and-tear on the scalp (from the repeated application and removal of electrodes) and faster preparation of patients for MRI4. In addition, numerous research studies with important clinical relevance, such as the investigation of structural or functional changes immediately after a seizure, would benefit from the ability to move patients from LTM units into an MRI scanner as quickly as possible.
The ability to record from EEG electrodes during functional MRI scans (commonly referred to as “simultaneous EEG-fMRI”) has enabled the investigation of hemodynamic changes accompanying epileptiform events, such as interictal spikes, that are typically identified via EEG5. These studies include reports of high variability in the timing of hemodynamic changes relative to the timing of interictal spikes6,7, with the intriguing finding that, in several cases, the onset of hemodynamic changes appears to precede spike onset8,9. Also of note are recent findings that the concordance (or lack thereof) between the brain areas that show spike-related fMRI activation and the presumed epileptogenic zone (identified through a combination of scalp EEG, intracranial electrodes and behavioral measures) is predictive of seizure freedom following epilepsy surgery10,11.
Despite the various advantages of leaving EEG electrodes on during MRI scans, including but not limited to the ones described above, previous studies of the heating of EEG electrodes and leads by RF pulses have either been conducted at 1.5T or have employed EEG caps that are not typically used in clinical settings, e.g., see Lemieux et al.12 or Nöth et al.13 The purpose of this study was therefore to measure the temperature changes under two types of clinically used electrodes—gold cup electrodes (GCEs) and conductive plastic electrodes (CPEs)—during a variety of scans at 3T, primarily using watermelons as conductive head phantoms, in order to assess the safety implications of using these electrodes on patients and to understand the underlying mechanisms of the observed temperature changes, with an emphasis on the antenna effect, which can result from the formation of electromagnetic standing waves on wires (i.e., the electrode leads).
Materials and Methods
For Experiments 1 and 2, small watermelons with circumferences ranging from 50 to 60 cm were used as head phantoms since (i) their high water content results in a strong MR signal, (ii) their size is similar to that of the human head and (iii) their surfaces are conductive, like the human scalp and unlike most MRI phantoms, thus providing a safe and inexpensive means to investigate potentially large temperature changes under EEG electrodes during MRI. The results from Experiments 1 and 2 informed the design of Experiment 3, which was performed on a healthy volunteer (see below). All electrodes (GCEs or CPEs) were provided by Ives EEG Solutions Inc. (Newburyport, USA) and temperatures were measured by placing up to four T1 fiberoptic probes (Neoptix, Inc., Québec, Canada) under the electrodes, with the fiberoptic cables running from the scanner room to a recording device (Neoptix Reflex Signal Conditioner) in the scanner console room. All scans were performed on either a 3T Trio scanner or a 1.5T Avanto scanner (Siemens Healthcare, Erlangen, Germany), with the body coil used for RF transmission in all cases.
Experiment 1
Either GCEs (for one watermelon) or CPEs (for a second watermelon) were placed on the surface along with EEG gel, adhering as closely as possible to the International 10-20 system14,15. Three different configurations of electrode wire lengths were investigated: in the “short wire” configuration (Fig. 1, left), the 21 scalp EEG electrodes (lead lengths: 25 to 30 cm) and 1 electrocardiography (ECG) electrode (lead length: 61 cm) terminated at the black connectors indicated by the black arrow. In the “medium wire” configuration (Fig. 1, center), the black connectors were connected via braided wires (green arrow) of about 66 cm in length to a Brain Products interface box (blue arrow), which has 5 kΩ resistors in series with the output connector. Note that, because of the closed design of this particular receive array coil, the braided wires had to be routed around the perimeter of the coil. In the “long wire” configuration (Fig. 1, right), the interface box was connected via a ribbon cable (purple arrow) of about 112 cm in length to a BrainAmp MR amplifier (Brain Products GmbH, Gilching, Germany), allowing EEG signals to be recorded. Electrical connectivity between the ECG electrode and the watermelon was established by a trail of EEG gel running in an approximately straight path close to and almost parallel to the ECG lead (the ECG lead itself was not surrounded by gel). The impedance of the electrode-watermelon junction, as measured by the Brain Products system, was less than 3 kΩ for each electrode (mean: 1.4 kΩ, standard deviation: 0.9 kΩ), with the ECG electrodes on the higher end of this range (i.e., close to 3 kΩ).
Figure 1.
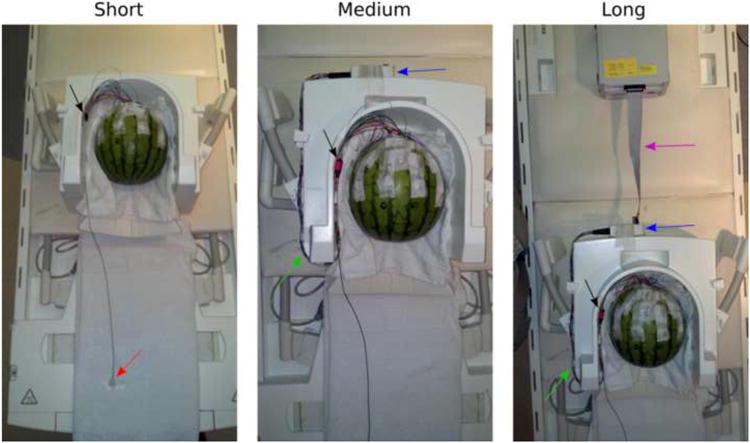
Watermelon phantom with 1 ECG electrode (red arrow) and 21 scalp EEG electrodes placed in accordance with the International 10-20 system, for Experiment 1. The short, medium and long wire configurations described in the Methods are shown in the left, center and right panels, respectively. The black arrow indicates the black Molex connectors, which connect to the braided wires indicated with the green arrow. The blue arrow indicates the Brain Products interface box, which connects to the ribbon cable (purple arrow) that leads to the amplifier. A short ribbon cable is shown here in order to fit the amplifier into the photograph frame, whereas a long ribbon cable was used in the actual experiment.
Since only four temperature probes were available, three of the probes were distributed over the watermelon surface, namely under the T3, Fp2 and T6 electrodes, and the fourth probe was placed under the ECG electrode. Temperature changes under these electrodes were recorded while running a variety of pulse sequences on a 3T Trio scanner equipped with a 32-channel receive array head coil, including MPRAGE, EPI, DTI, HASTE, FLAIR and TSE, with the pulse-sequence parameters set to the typical values currently used at our institution for routine clinical scans (see Table 1). The number of repetitions for each sequence was adjusted so that each scan would have a duration of approximately 4 minutes, with the exception of the DTI sequence, which had a duration of approximately 6 minutes (for a single repetition).
Table 1.
Pulse-sequence parameters for the MRI scans used in this study.
| Parameter\Sequence | MPRAGE | EPI | DTI | HASTE | FLAIR | TSE |
|---|---|---|---|---|---|---|
| Repetition Time (ms) | 1520 | 1000 | 10238 | 2000 | 8000 | 4000 |
| Echo Time (ms) | 2 | 40 | 88 | 90 | 137 | 89 |
| Inversion Time (ms) | 800 | N/A | N/A | N/A | 2370 | N/A |
| Field of View (mm) | 220×220 | 220×220 | 220×220 | 200×200 | 180×200 | 168×200 |
| Matrix | 256×256 | 64×64 | 128×128 | 256×320 | 288×320 | 302×512 |
| Slice Thickness (mm) | 0.9 | 5.0 | 2.2 | 4.0 | 4.0 | 2.5 |
| Flip Angle (°) | 9 | 90 | 90 | 150 | 120 | 120 |
| SAR (W/kg) | 0.07 | 0.08 | 0.16 | 0.19 | 0.32 | 0.34 |
MPRAGE = magnetization-prepared rapid gradient-echo; EPI = echo-planar imaging; DTI = diffusion tensor imaging; HASTE = half-Fourier acquisition single-shot turbo spin-echo; FLAIR = fluid-attenuated inversion recovery; TSE = turbo spin echo; SAR = specific absorption rate.
In addition to noting the maximum temperature increase under the four electrodes during each scan, we also estimated the equilibrium temperature that would have resulted from (infinitely) long scan durations by fitting the rising temperature values to an exponential recovery function of the form T(t) = Teq + (Tin – Teq) exp(−t/τ), where T is the temperature at time t after scan onset, Teq is the equilibrium temperature (i.e., the value as t→∞), Tin is the initial temperature (i.e., at t = 0), and τ is the time constant13. The above fits were performed in MATLAB, using the Levenberg-Marquardt nonlinear least-squares algorithm in function lsqnonlin. Straight-line fits of equilibrium temperature versus the specific absorption rate (SAR) of each pulse sequence were also performed in MATLAB, using the regress function.
Experiment 2
The results of Experiment 1 led us to hypothesize the antenna effect as the underlying explanation for the observed phenomena (see Discussion). In order to confirm this hypothesis, we systematically varied the length of one GCE lead and one CPE lead, kept mostly straight and with the two electrodes affixed to another watermelon and with their locations approximately centered on the left and right hand sides of the watermelon. The temperature changes under the two electrodes were then measured at 3T during the TSE scans, which caused the strongest heating in Experiment 1. At the end of each TSE scan, the leads were shortened by 30.5 cm (∼1 foot), from an initial length of 244 cm (∼8 feet) to a final length of 30.5 cm. Note that the leads were not connected to the amplifier here. This experiment was then repeated at 1.5T, with the same TSE parameters as those used at 3T (Table 1, rightmost column).
Experiment 3
GCEs were placed on a 46-year-old healthy male volunteer from whom informed consent was obtained, and temperature probes were placed under the same electrodes as in Experiment 1 (i.e., T3, Fp2, T6 and the ECG electrode) prior to scanning at 3T. In the short wire configuration, the ECG electrode was not affixed to the subject, corresponding to the situation when, for example, an LTM patient wearing scalp electrodes is brought down for a routine clinical MRI scan, with no attempt to record from the EEG electrodes during the MRI scan. Temperatures were recorded during an MPRAGE and a TSE scan, using the same pulse-sequence parameters as in the previous experiments (see Table 1). In the long wire configuration, which permits recording of EEG/ECG during the MRI scan, the ECG electrode was affixed to the subject's back, and temperatures were recorded during an MPRAGE and an EPI scan—as typically run in a simultaneous EEG-fMRI experiment. In all cases, the volunteer was instructed to press the squeeze-ball if he felt any heating of the electrodes, thus signaling the scanner operator to terminate the currently-running scan. Note, however, that we do caution against the use of such a strategy when large temperature changes are likely in the time interval encompassing the combined reaction time of the volunteer and scanner operator.
Results
Experiment 1
Fig. 2 shows the temperature changes under T3, Fp2, T6 and the ECG electrode during and immediately after the TSE scan, with GCEs (top row) or CPEs (bottom row), for the short wire (left column), medium wire (middle column) and long wire (right column) configurations. For both electrode types, increases in temperature of more than 15°C were seen for the ECG electrode in the short wire configuration and of less than 4°C in the medium or long wire configurations. The other three electrodes (T3, Fp2 and T6) showed temperature increases of less than 4°C for both electrode types and all wire-length configurations, with one exception: T6 CPE in the short wire configuration exhibited a 6°C increase.
Figure 2.
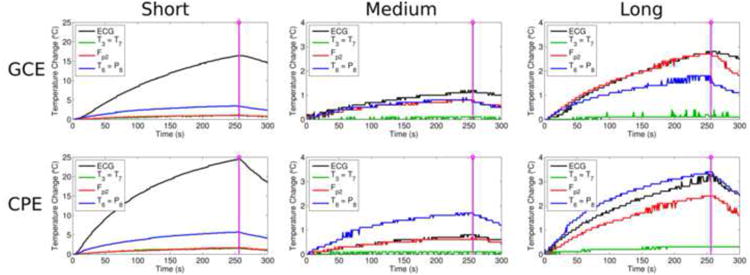
For GCEs (top row) and CPEs (bottom row) in Experiment 1, the temperature changes under T3, Fp2, T6 and the ECG electrode during and immediately after the TSE scan are shown for the short wire (left column), medium wire (center column) and long wire (right column) configurations, with the end of the scan indicated by the purple line. Note the larger scale on the vertical axis (0-25°C) for the short wire configuration, in which large temperature changes were observed for both electrode types, versus the 0-4°C scale used for the other configurations.
Fig. 3 shows the equilibrium temperature at each electrode (in the short wire configuration) plotted against the SAR of each pulse sequence we investigated (see Table 1). An approximately linear relationship can be seen here, consistent with prior work (see Discussion). For the ECG electrode, which exhibited the most heating, the slope and intercept of the GCE (CPE) straight-line fit was 83.3 (83.8) °C/W/kg and 17.3 (19.7) °C, respectively. For the T6 electrode, which exhibited the next most heating, the slope and intercept of the GCE (CPE) straight-line fit was 13.0 (18.4) °C/W/kg and 19.7 (20.0) °C, respectively.
Figure 3.
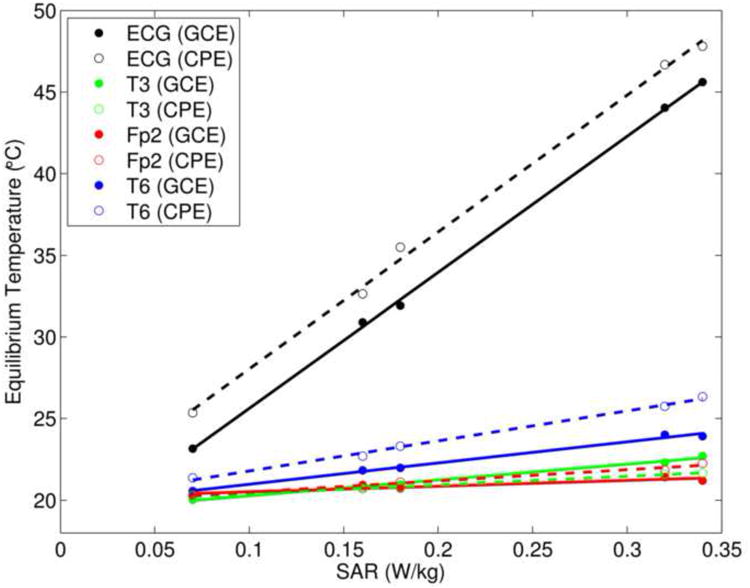
For the short wire configuration in Experiment 1, the equilibrium temperature at each electrode versus the specific absorption rate (SAR) of each pulse sequence used in this study (see Table 1). The data for GCEs and CPEs are shown with filled and open circles, respectively, and the corresponding straight-line fits are shown with solid and dashed lines.
Experiment 2
The substantial ECG temperature increases observed in the short wire configuration of Experiment 1, but not in the medium or long wire configurations, led us to postulate RF antenna effects as the underlying explanation, as detailed in the Discussion. To test this hypothesis, we systematically varied lead lengths as described in the Methods; Fig. 4 shows a plot of wire length, expressed as a fraction of RF wavelength (approximately 488 cm at 1.5T and 244 cm at 3T), versus the maximum temperature increase under each electrode type during TSE scans at 1.5T and 3T. Note the stronger heating of the electrodes for wire lengths corresponding to ¼ and ¾ RF wavelength (odd multiples of ¼ RF wavelength), but minimal heating at lengths corresponding to ½ and 1 RF wavelength (even multiples of ¼ RF wavelength).
Figure 4.
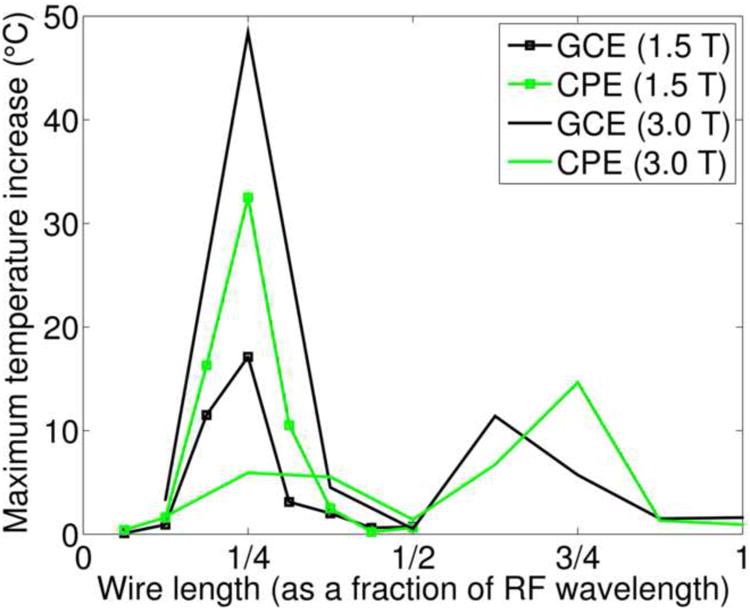
Results of Experiment 2. The maximum temperature increase under a GCE and a CPE during TSE scans at 1.5T and 3T is plotted against wire length, where wire lengths are expressed as a fraction of RF wavelength (approximately 488 cm at 1.5T and 244 cm at 3T).
Experiment 3
Fig. 5 shows the temperature changes under GCEs when scanning a human volunteer at 3T (see Methods). In the short wire configuration, very little heating was seen during the MPRAGE scan (top left) and the maximum temperature increase seen during the TSE scan was ∼2°C, under the T6 electrode (top right). In the long wire configuration, which allowed recording of EEG/ECG signals during the scans as in a typical simultaneous EEG-fMRI experiment, very little heating was seen under the scalp electrodes during MPRAGE (bottom left) or EPI (bottom right) scans, with a maximum temperature increase of ∼2°C recorded under the ECG electrode.
Figure 5.
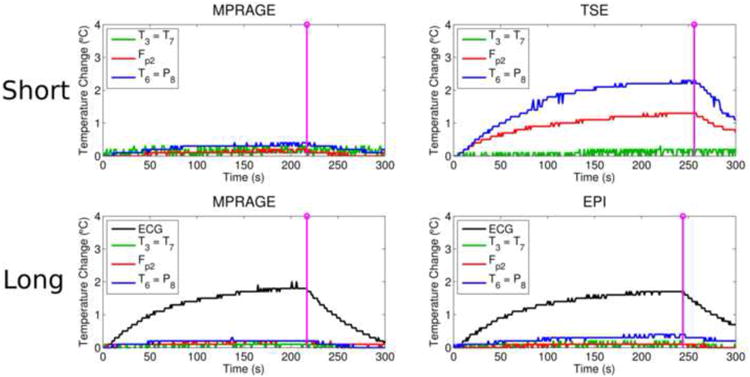
Results from scanning a human volunteer at 3T (Experiment 3). The upper row shows the temperature changes under GCEs during an MPRAGE (top left) and a TSE (top right) scan in the short wire configuration. Note that the ECG electrode was not affixed to the volunteer for the scans in the short wire configuration. The lower row shows the temperature changes under GCEs during an MPRAGE (bottom left) and an EPI (bottom right) scan in the long wire configuration. As before, the purple lines indicate the end of the scan.
Discussion
The Antenna Effect
The antenna effect results from the formation of electromagnetic standing waves on wires, as illustrated in Fig. 6. From this figure, it can be seen that the largest currents (and therefore the most ohmic or resistive heating) would be predicted for wire lengths that are odd multiples of ¼ RF wavelength, assuming relatively low impedance at the electrode-scalp junction (typically well below 5 kΩ) and high impedance at the other end of the wire, where the EEG/ECG lead either meets air (effectively infinite impedance) or connects to a high-impedance amplifier. The ECG wire length was close to an odd multiple of ¼ RF wavelength in the short wire configuration of Experiment 1, with a wire length of ∼61 cm and given a 3T RF wavelength (in air) very close to 244 cm. On the other hand, in the medium and long wire configurations, the ECG wire length was close to an even multiple of ¼ RF wavelength: ∼122 and ∼244 cm for the medium and long wire configurations, respectively. Therefore, the high temperature changes observed under the ECG electrode in the short wire configuration versus the relatively low temperature increases in the medium and long wire configurations are what initially led us to hypothesize the antenna effect as the primary source of the temperature changes observed in Experiment 1 (see Fig. 2).
Figure 6.
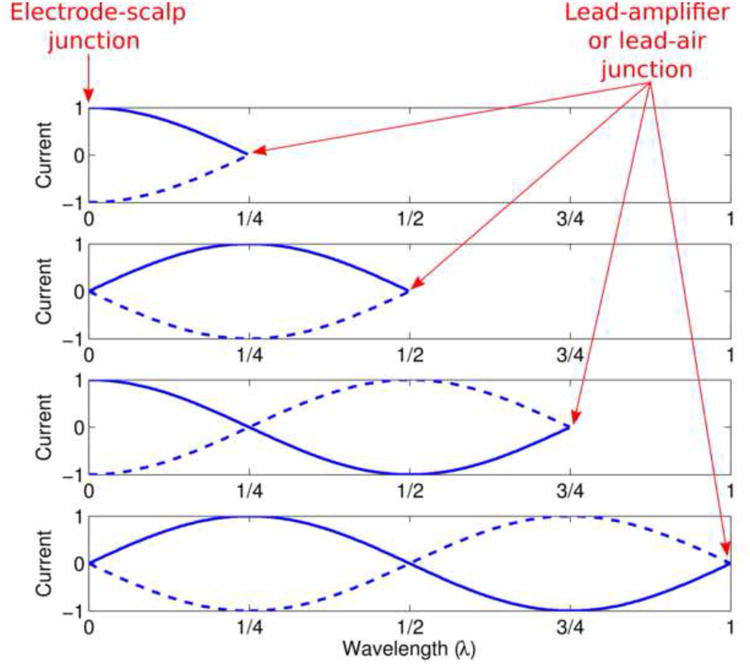
Illustration of the antenna effect. Standing wave patterns of current are shown for four wire lengths: ¼, ½, ¾ or 1 times the RF wavelength. For each wire length, electric current (arbitrary units) is plotted versus position along the wire, with the leftmost point of the blue curves corresponding to the electrode-scalp junction, where the impedance is relatively low, and the rightmost point corresponding to the junction between the EEG/ECG lead and air or the amplifier, where the impedance is extremely high. Note that the highest currents at the electrode-scalp junction occur at odd multiples of ¼ RF wavelength, whereas the lowest currents occur at even multiples.
The hypothesis above motivated Experiment 2, which was designed to explicitly test for the antenna effect. Here, wire lengths were varied systematically with finer increments (30.5 cm) than was possible in Experiment 1, and the wires were kept as straight as possible to minimize heating due to other effects, such as electromagnetic induction in conducting loops (also known as the loop effect). The resulting temperature changes, as a function of wire length, exhibited exactly the pattern of behavior predicted by the antenna effect at both 1.5T and 3T (see Fig. 4). Our use of the body transmit coil in all of our experiments may have made this pattern particularly apparent—had we instead used a head transmit coil, our longest wires may have been exposed to little RF energy at their ends furthest from the coil, resulting in a rather more complicated relationship between electrode heating and wire length.
The importance of the antenna effect, in the specific context of the safety of simultaneous EEG and MRI, has not been adequately acknowledged or appreciated in the literature, in our opinion. We attribute this in part to the influential nature of the paper by Lemieux et al.12, who observed very little heating due to antenna effects in their experimental setup and therefore concluded that the loop effect was the single most important risk factor in simultaneous EEG and MRI—a conclusion that may have been over-generalized by others with regard to their own experimental scenarios. The antenna effect was not a factor in the Lemieux et al.12 study because they likely used wire lengths much shorter than 122 cm (i.e., ¼ RF wavelength at 1.5T)—however, the probability of encountering EEG lead lengths that are odd multiples of ¼ RF wavelength increases at 3T and beyond, and therefore antenna effects, can no longer be safely ignored.
Our comments above are specific to scalp EEG—the antenna effect has indeed been considered and described for various other physiological monitoring or stimulation devices, such as intracranial EEG electrodes16, guidewires17,18, catheters19,20, spinal-fusion stimulators21 and deep-brain stimulators22. Note that these devices often involve implanted wires surrounded by tissue, resulting in an approximately ten-fold reduction of the RF wavelength22, and therefore the wire lengths at which antenna effects manifest can be very different than for scalp EEG leads (which are usually surrounded by air). Furthermore, the boundary conditions are typically different for implanted wires versus EEG leads, resulting in a different relationship between RF wavelength and the wire lengths that exhibit the strongest heating. For example, for wire immersed entirely in gel or tissue, maximum heating occurs for wire lengths that are near multiples of ½ RF wavelength23,24, as opposed to the odd multiples of ¼ RF wavelength we observe.
The antenna effect was also considered to be the most likely factor in several reports of ECG burn injuries sustained during MRI25,26. The authors of the latter study conducted a related experimental study involving a systematic variation of wire length, and observed the most heating at ½ (rather than ¼) RF wavelength27. We attribute the difference between their findings and ours to the different boundary conditions involved: they did not have one end of their wires at low impedance, as we did. We contend that our boundary conditions are more representative of realistic EEG scenarios, where the electrode is likely to be in good electrical contact with the scalp (i.e., with relatively low impedance), whereas the other end of the lead is likely to have extremely high impedance, either due to its connection with a high-impedance amplifier or due to its contact with air in the disconnected state.
While the antenna effect plays a prominent role in the results presented here, we stress that we are not minimizing the role of electromagnetic induction (i.e., when wire loops are formed), which can also lead to significant heating. Therefore, both the antenna effect and the loop effect must be considered as potential sources of heating of EEG electrodes in the MRI scanner.
What Temperature Increases are Acceptable?
The International Electrotechnical Commission has recommended a 1°C limit for increases in body core temperature resulting from heating during MRI scans28. However, this limit is far too conservative for increases in skin temperature: in a study of thermal injury of porcine skin, Moritz and Henriquez29 found that a 3-hour exposure to a temperature of 45°C resulted in 2nd-3rd degree burns. However, reducing the temperature by 1°C (to 44°C) meant that a much longer exposure (7 hours) was required to produce burns of comparable severity, and reducing the exposure time at 45°C by just 30 minutes (i.e., to a 2½ hour exposure) reduced the severity to a 1st degree burn (equivalent to superficial sunburn without blisters). Since skin temperature rarely exceeds 35°C30,31, with the exact values falling somewhere between body core temperature and the ambient temperature, a skin temperature increase greater than 8°C and sustained for over 2 hours (well above the duration of typical MRI exams) would likely be required to produce even a 1st degree burn.
We now turn to the relationship between increases in temperature and the specific absorption rate (SAR) of a pulse sequence. As shown in Fig. 3, and as observed by others (e.g., Nöth et al.13) the (equilibrium) temperature increase under a given electrode varies approximately linearly with the scanner-reported, whole-body SAR of the applied pulse sequence. The slope of this line is, however, difficult to predict and is likely to be dependent on various factors, such as the geometry of the RF transmit coil and the exact positioning of the leads with respect to the transmit coil27. This limits the utility of whole-body SAR as a predictor of the most pertinent safety parameter, i.e., the expected increase in temperature under the electrode (a similar point is made by Baker et al.32 and Nitz et al.33 regarding the heating of implants). Nevertheless, whole-body SAR is at least useful for making decisions regarding relative safety: for example, if a high-SAR sequence such as TSE can be shown to be safe, then a sequence with lower SAR (such as EPI) will almost certainly be safe, assuming all other experimental conditions are kept unchanged—this was our rationale for focusing on TSE scans in Experiment 2.
On the Validity of Watermelons as Models of Human Heads
For the majority of the experiments in this study, temperature measurements were made under electrodes affixed to small watermelons, which served as models of the human head. As stated earlier, the rationale for this choice of phantom was that (i) the high water content in these melons results in a strong MR signal, (ii) their size is similar to that of the human head and (iii) their surfaces are conductive, like the human scalp and unlike most MRI phantoms. These watermelon phantoms therefore provide a convenient and inexpensive means to investigate the heating of EEG electrodes in the MRI scanner, without the concern of injuring a human subject, especially when large temperature changes are involved. We acknowledge, however, the limits of this model: the electrical and thermal conductivities of the various components of watermelons are unlikely to closely match those of brain tissues, and the geometry of the conductivity boundaries is undoubtedly different.
Nevertheless, meaningful results can be obtained with these phantoms. These results should not, however, be carelessly generalized to humans and are better seen as indicators of relative rather than absolute safety. For example, the experiments performed in this study show that there are no practically significant differences between GCEs and CPEs: if large temperature changes are observed for one electrode type, large temperature changes are likely for the other electrode type. In other words, it is not so much what is at the end of the leads, but rather the leads themselves that matter with regard to heating in the scanner, at least for the two electrode types investigated here. As a second example, the experiments in this study showed that antenna effects can play a significant role in the heating of electrodes, contradicting the general belief we have noted in the EEG community, and therefore certain wire lengths are less safe than others, all else being equal.
In conclusion, EEG wire length, wire geometry and the SAR of the applied MRI sequences must all be carefully taken into consideration in order to minimize the risk when performing MR scans on patients with EEG electrodes in place, especially at field strengths of 3T and above. It is our hope that greater appreciation of each of these factors, along with a deeper understanding of their underlying physical mechanisms, will allow safety officers to better assess the potential risks versus benefits to the patient in these situations.
Acknowledgments
The authors thank Arnie Cyr for his help with collecting the data on phantoms and Jack Connolly for his help with collecting the data on humans. This work was supported by a BCH-MIT Collaborative Fellowship Grant and NIH grants R21NS076859, P41EB015898 and P41EB015902.
References
- 1.Friedman D, Claassen J, Hirsch LJ. Continuous electroencephalogram monitoring in the intensive care unit. Anesth Analg. 2009;109(2):506–23. doi: 10.1213/ane.0b013e3181a9d8b5. [DOI] [PubMed] [Google Scholar]
- 2.Roth BJ, Pascual-Leone A, Cohen LG, Hallett M. The heating of metal electrodes during rapid-rate magnetic stimulation: a possible safety hazard. Electroencephalogr Clin Neurophysiol. 1992;85(2):116–23. doi: 10.1016/0168-5597(92)90077-o. [DOI] [PubMed] [Google Scholar]
- 3.Ives JR, Warach S, Schmitt F, Edelman RR, Schomer DL. Monitoring the patient's EEG during echo planar MRI. Electroencephalogr Clin Neurophysiol. 1993;87(6):417–20. doi: 10.1016/0013-4694(93)90156-p. [DOI] [PubMed] [Google Scholar]
- 4.Mirsattari SM, Lee DH, Jones D, Bihari F, Ives JR. MRI compatible EEG electrode system for routine use in the epilepsy monitoring unit and intensive care unit. Clin Neurophysiol. 2004;115(9):2175–80. doi: 10.1016/j.clinph.2004.04.011. [DOI] [PubMed] [Google Scholar]
- 5.Gotman J, Pittau F. Combining EEG and fMRI in the study of epileptic discharges. Epilepsia. 2011;52(Suppl 4):38–42. doi: 10.1111/j.1528-1167.2011.03151.x. [DOI] [PMC free article] [PubMed] [Google Scholar]
- 6.Jacobs J, Hawco C, Kobayashi E, Boor R, LeVan P, Stephani U, Siniatchkin M, Gotman J. Variability of the hemodynamic response as a function of age and frequency of epileptic discharge in children with epilepsy. Neuroimage. 2008;40(2):601–14. doi: 10.1016/j.neuroimage.2007.11.056. [DOI] [PMC free article] [PubMed] [Google Scholar]
- 7.Benar CG, Gross DW, Wang Y, Petre V, Pike B, Dubeau F, Gotman J. The BOLD response to interictal epileptiform discharges. Neuroimage. 2002;17(3):1182–92. doi: 10.1006/nimg.2002.1164. [DOI] [PubMed] [Google Scholar]
- 8.Jacobs J, Levan P, Moeller F, Boor R, Stephani U, Gotman J, Siniatchkin M. Hemodynamic changes preceding the interictal EEG spike in patients with focal epilepsy investigated using simultaneous EEG-fMRI. Neuroimage. 2009;45(4):1220–31. doi: 10.1016/j.neuroimage.2009.01.014. [DOI] [PubMed] [Google Scholar]
- 9.Hawco CS, Bagshaw AP, Lu Y, Dubeau F, Gotman J. BOLD changes occur prior to epileptic spikes seen on scalp EEG. Neuroimage. 2007;35(4):1450–8. doi: 10.1016/j.neuroimage.2006.12.042. [DOI] [PubMed] [Google Scholar]
- 10.An D, Fahoum F, Hall J, Olivier A, Gotman J, Dubeau F. Electroencephalography/functional magnetic resonance imaging responses help predict surgical outcome in focal epilepsy. Epilepsia. 2013;54(12):2184–94. doi: 10.1111/epi.12434. [DOI] [PMC free article] [PubMed] [Google Scholar]
- 11.Thornton R, Laufs H, Rodionov R, Cannadathu S, Carmichael DW, Vulliemoz S, Salek-Haddadi A, McEvoy AW, Smith SM, Lhatoo S, Elwes RD, Guye M, Walker MC, Lemieux L, Duncan JS. EEG correlated functional MRI and postoperative outcome in focal epilepsy. J Neurol Neurosurg Psychiatry. 2010;81(8):922–7. doi: 10.1136/jnnp.2009.196253. [DOI] [PubMed] [Google Scholar]
- 12.Lemieux L, Allen PJ, Franconi F, Symms MR, Fish DR. Recording of EEG during fMRI experiments: patient safety. Magn Reson Med. 1997;38(6):943–52. doi: 10.1002/mrm.1910380614. [DOI] [PubMed] [Google Scholar]
- 13.Nöth U, Laufs H, Stoermer R, Deichmann R. Simultaneous electroencephalography-functional MRI at 3 T: an analysis of safety risks imposed by performing anatomical reference scans with the EEG equipment in place. J Magn Reson Imaging. 2012;35(3):561–71. doi: 10.1002/jmri.22843. [DOI] [PubMed] [Google Scholar]
- 14.Jasper HH. Report of the committee on methods of clinical examination in electroencephalography. Electroencephalogr Clin Neurophysiol. 1958;10:370–75. [Google Scholar]
- 15.Steinmetz H, Furst G, Meyer BU. Craniocerebral topography within the international 10-20 system. Electroencephalogr Clin Neurophysiol. 1989;72(6):499–506. doi: 10.1016/0013-4694(89)90227-7. [DOI] [PubMed] [Google Scholar]
- 16.Carmichael DW, Thornton JS, Rodionov R, Thornton R, McEvoy AW, Ordidge RJ, Allen PJ, Lemieux L. Feasibility of simultaneous intracranial EEG-fMRI in humans: a safety study. Neuroimage. 2010;49(1):379–90. doi: 10.1016/j.neuroimage.2009.07.062. [DOI] [PubMed] [Google Scholar]
- 17.Ladd ME, Zimmermann GG, Quick HH, Debatin JF, Boesiger P, von Schulthess GK, McKinnon GC. Active MR visualization of a vascular guidewire in vivo. J Magn Reson Imaging. 1998;8(1):220–5. doi: 10.1002/jmri.1880080137. [DOI] [PubMed] [Google Scholar]
- 18.Liu CY, Farahani K, Lu DS, Duckwiler G, Oppelt A. Safety of MRI-guided endovascular guidewire applications. J Magn Reson Imaging. 2000;12(1):75–8. doi: 10.1002/1522-2586(200007)12:1<75::aid-jmri8>3.0.co;2-#. [DOI] [PubMed] [Google Scholar]
- 19.Nitz WR, Oppelt A, Renz W, Manke C, Lenhart M, Link J. On the heating of linear conductive structures as guide wires and catheters in interventional MRI. J Magn Reson Imaging. 2001;13(1):105–14. doi: 10.1002/1522-2586(200101)13:1<105::aid-jmri1016>3.0.co;2-0. [DOI] [PubMed] [Google Scholar]
- 20.Armenean C, Perrin E, Armenean M, Beuf O, Pilleul F, Saint-Jalmes H. RF-induced temperature elevation along metallic wires in clinical magnetic resonance imaging: influence of diameter and length. Magn Reson Med. 2004;52(5):1200–6. doi: 10.1002/mrm.20246. [DOI] [PubMed] [Google Scholar]
- 21.Chou CK, McDougall JA, Chan KW. RF heating of implanted spinal fusion stimulator during magnetic resonance imaging. IEEE Trans Biomed Eng. 1997;44(5):367–73. doi: 10.1109/10.568912. [DOI] [PubMed] [Google Scholar]
- 22.Georgi JC, Stippich C, Tronnier VM, Heiland S. Active deep brain stimulation during MRI: a feasibility study. Magn Reson Med. 2004;51(2):380–8. doi: 10.1002/mrm.10699. [DOI] [PubMed] [Google Scholar]
- 23.Yeung CJ, Susil RC, Atalar E. RF safety of wires in interventional MRI: using a safety index. Magn Reson Med. 2002;47(1):187–93. doi: 10.1002/mrm.10037. [DOI] [PubMed] [Google Scholar]
- 24.Bassen H, Kainz W, Mendoza G, Kellom T. MRI-induced heating of selected thin wire metallic implants-- laboratory and computational studies-- findings and new questions raised. Minim Invasive Ther Allied Technol. 2006;15(2):76–84. doi: 10.1080/13645700600640931. [DOI] [PubMed] [Google Scholar]
- 25.Kugel H, Bremer C, Puschel M, Fischbach R, Lenzen H, Tombach B, Van Aken H, Heindel W. Hazardous situation in the MR bore: induction in ECG leads causes fire. Eur Radiol. 2003;13(4):690–4. doi: 10.1007/s00330-003-1841-8. [DOI] [PubMed] [Google Scholar]
- 26.Dempsey MF, Condon B. Thermal injuries associated with MRI. Clin Radiol. 2001;56(6):457–65. doi: 10.1053/crad.2000.0688. [DOI] [PubMed] [Google Scholar]
- 27.Dempsey MF, Condon B, Hadley DM. Investigation of the factors responsible for burns during MRI. J Magn Reson Imaging. 2001;13(4):627–31. doi: 10.1002/jmri.1088. [DOI] [PubMed] [Google Scholar]
- 28.IEC. Particular requirements for the safety of magnetic resonance equipment for medical diagnosis, 2nd revision. 2002:29–31. International Standard IEC 60601-2-33. [Google Scholar]
- 29.Moritz AR, Henriques FC. Studies of Thermal Injury: II The Relative Importance of Time and Surface Temperature in the Causation of Cutaneous Burns. Am J Pathol. 1947;23(5):695–720. [PMC free article] [PubMed] [Google Scholar]
- 30.Olesen BW. Thermal comfort. Technical review. 1982;2:3–41. [Google Scholar]
- 31.Burton AC. Human Calorimetry II: The Average Temperature of the Tissues of the Body. J Nutr. 1935;9(8):261–80. [Google Scholar]
- 32.Baker KB, Tkach JA, Nyenhuis JA, Phillips M, Shellock FG, Gonzalez-Martinez J, Rezai AR. Evaluation of specific absorption rate as a dosimeter of MRI-related implant heating. J Magn Reson Imaging. 2004;20(2):315–20. doi: 10.1002/jmri.20103. [DOI] [PubMed] [Google Scholar]
- 33.Nitz WR, Brinker G, Diehl D, Frese G. Specific absorption rate as a poor indicator of magnetic resonance-related implant heating. Invest Radiol. 2005;40(12):773–6. doi: 10.1097/01.rli.0000185898.59140.91. [DOI] [PubMed] [Google Scholar]


