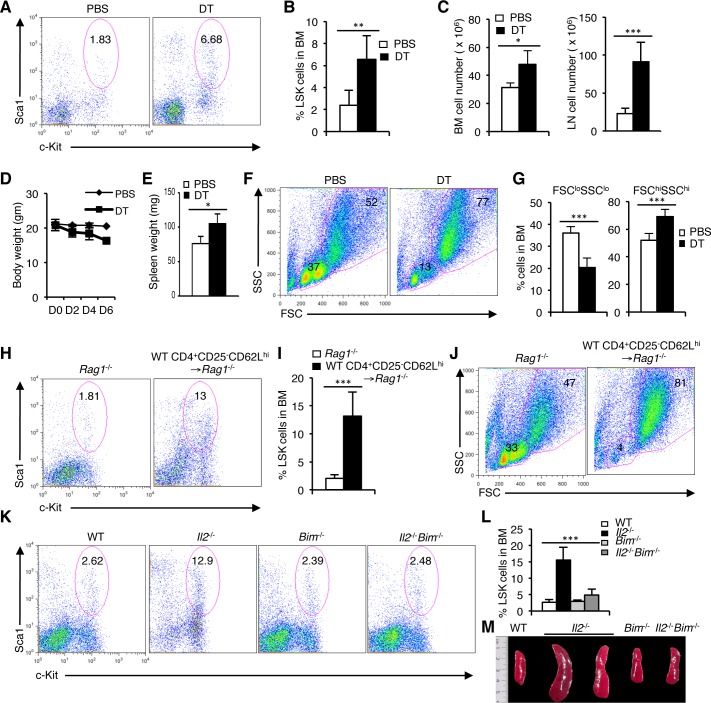
Figure 4. Treg cell activity is critical for steady state hematopoiesis.
A. LSK cells distribution in the BM of DEREG mice treated with PBS or diphtheria toxin (DT). B. Quantification of the LSK population distribution in DEREG mice BM after PBS or DT treatment. C. Cellularity in the BM and LNs of DEREG mice following PBS or DT treatment. D. Evaluation of body weight following each PBS or DT injection to the DEREG mice. E. Spleen weight of DEREG mice treated with PBS or DT. F. FSC/SSC distribution of BM cells from PBS or DT treated DEREG mice. G. Evaluation of FSCloSSClo and FSChiSSChi BM cells in PBS or DT treated DEREG mice. H. Distribution of LSK population in the BM of Rag1−/− mice, 3 weeks after transfer of WT CD4+CD25−CD62Lhi cells, compared to normal WT or Rag1−/− mice. I. Quantification of BM LSK cells in Rag1−/− mice, 3 weeks post-transfer of WT CD4+CD25−CD62Lhi cells in comparison to control Rag1−/− mice. J. FSC/SSC distribution of BM cells from WT CD4+CD25−CD62Lhi cells transferred Rag1−/− mice compared to control Rag1−/− mice. K. Flow cytometry profiles of LSK cells in BM of WT, Il2−/−, Bim−/− and Il2−/−Bim−/− mice. L. Quantification of the distribution of BM LSK population in indicated mice. M. Photograph of spleens from WT, Il2−/−, Bim−/− and Il2−/−Bim−/− mice. Numbers inside each FACS plot represent percent respective population. Data are shown as mean ± s.d., in (B) **P = 0.0043, (C) *P = 0.0113 and ***P = 0.0005, (E) *P = 0.01734, (G) ***P = 0.0003, ***P = 0.0008, (I) ***P = 0.0006, and in (L) ***P < 0.0001 unpaired t-test. Data are representative of 3 independent experiments, (n = 4 per group).

