Abstract
Previous studies have linked increased frequency of glycosylphosphatidylinositol-anchor protein (GPI-AP) deficiency with genomic instability and the risk of carcinogenesis. However, the underlying mechanism is still not clear. A randomForest analysis of the gene expression array data from 55 MDS patients (GSE4619) demonstrated a significant (p = 0.0007) correlation (Pearson r =-0.4068) between GPI-anchor biosynthesis gene expression and genomic instability, in which PIGN, a gene participating in GPI-AP biosynthesis, was ranked as the third most important in predicting risk of MDS progression. Furthermore, we observed that PIGN gene expression aberrations (increased transcriptional activity but diminished to no protein production) were associated with increased frequency of GPI-AP deficiency in leukemic cells during leukemic transformation/progression. PIGN gene expression aberrations were attributed to partial intron retentions between exons 14 and 15 resulting in frameshifts and premature termination which were confirmed by examining the RNA-seq data from a group of AML patients (phs001027.v1.p1). PIGN gene expression aberration correlated with the elevation of genomic instability marker expression that was independent of the TP53 regulatory pathway. Suppression/elimination of PIGN protein expression caused a similar pattern of genomic instability that was rescued by PIGN restoration. Finally, we found that PIGN bound to the spindle assembly checkpoint protein, MAD1, and regulated its expression during the cell cycle. In conclusion, PIGN gene is crucial in regulating mitotic integrity to maintain chromosomal stability and prevents leukemic transformation/progression.
Keywords: PIGN gene expression aberration, MDS, AML with myelodysplasia-related changes (AML-MRC), genomic instability, leukemogenesis
INTRODUCTION
Myelodysplastic syndromes (MDS) are a heterogeneous collection of clonal hematological malignancies that affect about 13,000 people annually in the United States alone with about a one-third propensity of progression into acute myeloid leukemia (AML) [1]. MDS is conventionally classified as AML with myelodysplasia-related changes (AML-MRC) when blood or bone marrow blast populations reach or exceed 20% with dysplastic morphology in 50% or more cells in more than two myeloid lineages [2, 3]. AML is more aggressive and molecularly diverse, involving an unconstrained proliferation of aberrant myeloid progenitor cells. These aberrant myeloid progenitor cells possess genetic aberrations, populate the bone marrow and peripheral blood, and contribute to leukemia progression by driving clonal evolution [4].
Genomic instability is associated with cancer initiation and progression and has been indicated as a driver of the clonal evolution of MDS to AML [5–8]. Genomic instability is responsible for the accumulation of genetic abnormalities that contribute to the transformation of MDS into AML [5, 9]. In fact, the frequency of cytogenetic aberrations at the initial presentation of MDS is less than 50% but this frequency increases with progression due to loss or gain of large chromosomal segments [10, 11]. Previous studies have associated genomic instability with increased frequency of glycosylphosphatidylinositol-anchor protein (GPI-AP) deficiency [12–15]. Moreover, multiple studies have proposed GPI-AP loss as a predictor of leukemic transformation and have linked increased frequency of GPI-AP deficiency to genomic instability [15–17]. However, the biomarker and the underlying mechanism that link GPI-AP loss to genomic instability and leukemic transformation are yet to be elucidated. Recently, a gene called Phosphatidylinositol Glycan Anchor Biosynthesis; Class N (PIGN), which is located at the 18q21.33 locus, was suggested as a cancer chromosomal instability (CIN) suppressor in a colon cancer model [18]. The PIGN gene encodes a phosphoethanolamine (EtNP) transferase involved in the terminal steps of GPI-AP anchor biosynthesis [19, 20]. Germline mutations in the PIGN gene have been implicated in GPI-AP deficiency and are associated with multiple congenital anomalies and developmental defects [19, 21–34]. Interestingly, CIN, a form of genomic instability, has been linked with risk of leukemic transformation of MDS and is associated with poor overall survival in MDS patients [35]. However, no literature has yet addressed the role of the PIGN gene in hematological malignancy formation and progression. This study investigated the relationship between PIGN gene expression aberration, genomic instability, and leukemic transformation/progression. We showed for the first time that PIGN plays a vital role in maintaining chromosomal stability and preventing leukemic transformation/progression in a subgroup of patients with MDS or AML-MRC.
RESULTS
PIGN gene expression profile links to genomic stability, especially MDS progression risk stratification
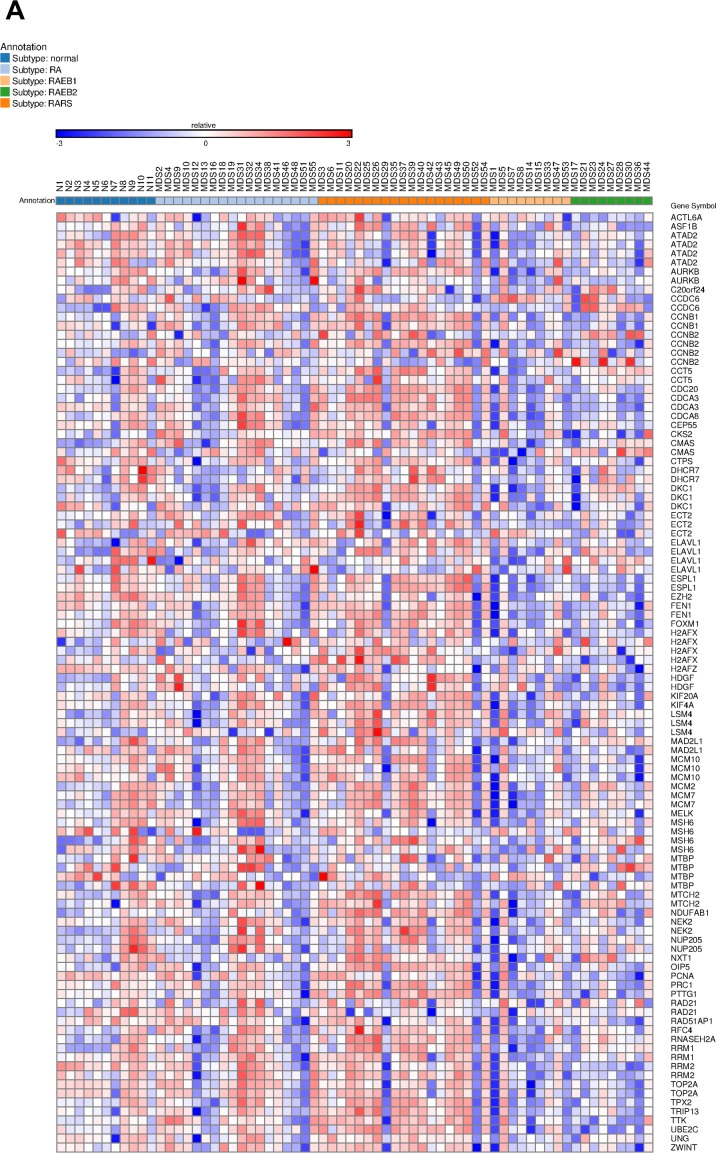
We initially analyzed array data generated from 55 MDS patients and 11 normal controls (GSE4619) [36]. The patients were sub-classified as follows: RA (18 patients), RARS (19 patients), RAEB1 and REAB2 (18 patients). Overall, CIN70 genes were expressed in a MDS disease subtype-dependent manner with a relatively lower expression in high-risk disease subtypes (REAB-1 and RAEB-2) compared to the low risk subtypes (RA and RARS) and normal controls [37]. This gene expression heat map showed that the expression of the CIN70 gene panel was associated with MDS risk stratification (Figure 1A). A randomForest analysis further demonstrated a significant (p = 0.0007) correlation (Pearson r =-0.4068) between the GPI-anchor biosynthesis gene panel and the CIN70 genomic instability marker panel (Figure 1B). Furthermore, the mean decrease in accuracy identified PIGN as highly important (i.e. 3rd ranked) among the GPI-AP biosynthesis genes in predicting MDS progression risk (Figure 1C).
Figure 1. PIGN gene was highly ranked as a predictive biomarker of MDS risk stratification.
A. Gene expression heat map showing expression of the CIN70 signature was associated with MDS risk stratification in CD34+ cells isolated from bone marrow samples of 55 MDS patients and 11 normal controls (GSE4619) [36, 37]. B. 2D scatter plot showed a significantly (p = 0.0007) negative correlation (Pearson r =-0.4068) between the GPI anchor biosynthesis gene panel and the CIN70 signature by plotting the first principal component (PC1) of each individual per gene panel. C. PIGN was ranked third among GPI-AP biosynthesis genes in predicting MDS risk stratification based on a Random Forest classifier using Mean Decrease in Accuracy as predictor.
PIGN gene expression aberrations occur in a subgroup of patients with MDS or AML-MRC
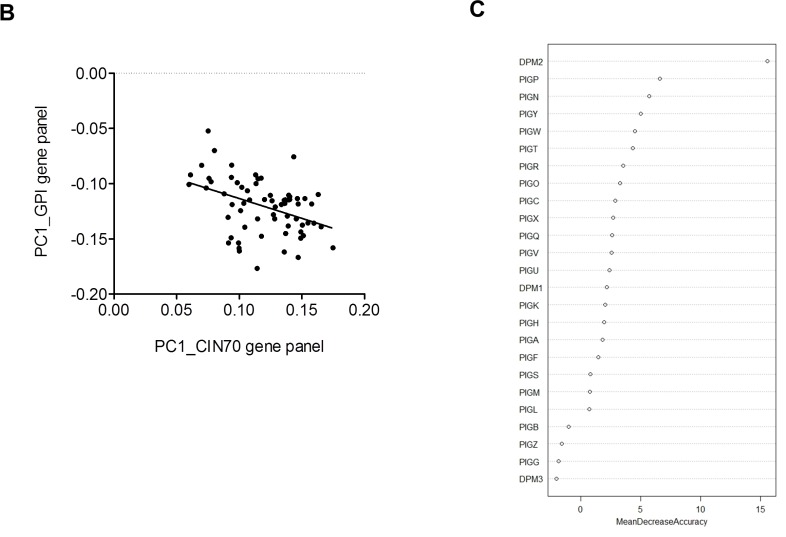
We used RT-qPCR to determine the PIGN gene expression profiles of CD34+ mononuclear cells harvested from the peripheral blood or bone marrow aspirates of 48 patient samples with either high risk MDS or AML-MRC and 12 healthy volunteers. Our results revealed that the majority (~60%) of these patients had a significantly (p<0.0001) higher expression of the PIGN gene in comparison with the cells from healthy normal controls (Figure 2A). Moreover, 15 of 35 patient samples examined for both PIGN transcription and translation had an aberrant expression pattern (i.e. increased transcriptional activity but diminished to no protein production) (Table 1 and Figure 2B). Overall, these data indicated that a subgroup of patients with high risk MDS or AML-MRC appeared to have PIGN expression aberration with increased gene expression but diminished protein production.
Figure 2. PIGN gene expression aberration was due to truncation.
A. RT-qPCR data on patient samples showed that a subgroup of MDS/AML-MRC patients had a significant difference (***p<0.0001) in PIGN gene expression than normal controls. B. In that same subpopulation of patients their PIGN protein expression was lost or suppressed. C. Sequence analyses on CD34+ cells revealed the presence of intron fragment retentions resulting from splice defects between exons 14 and 15 caused frameshifts and premature termination; samples M1, M2 and M4 were from AML patients; samples 1-11 represented the results of RNA-seq junction file data analyses from AML patients in the dbGAP study phs001027.v1.p1. Intron base positions (bp) were based on NCBI reference sequence NG_033144.1.
Table 1. PIGN gene and protein expression status in MDS or AML-MRC patients.
| ID | Age/Sex | TP53 Deletion | PIGN Protein Expression | a PIGN Gene Fold Expression | Karyotype (Normal/Complex) |
|---|---|---|---|---|---|
| M1 | 60/F | + | - | 3.787 | Complex |
| M2 | 27/F | + | - | 7.653 | Complex |
| M3 | 87/M | - | + | 1.187 | Complex |
| M4* | 59/F | - | + | 3.927 | Complex |
| M5* | 59/F | - | - | 2.703 | Complex |
| M6 | 61/M | - | - | 4.639 | Complex |
| M7 | 78/M | - | + | 1.636 | Complex |
| M8 | 64/M | - | - | 0.398 | Complex |
| M9 | 29/F | - | + | N.D | Complex |
| M10 | 29/F | - | + | 1.435 | Complex |
| M11 | 68/M | - | + | 2.002 | Complex |
| M12 | 61/F | - | + | 3.228 | Normal |
| M13 | 63/F | + | + | 0.873 | Complex |
| M14 | 55/F | - | N.D | 2.323 | Normal |
| M15 | 67/F | - | - | 5.158 | Complex |
| M16 | 67/F | - | - | 15.633 | Complex |
| M17 | 73/F | - | N.D | 1.150 | Complex |
| M18 | 27/M | - | + | 2.513 | Complex |
| M19 | 48/F | - | - | 7.756 | Complex |
| M20 | 66/F | - | N.D | 3.045 | Complex |
| M21 | 72/F | + | - | 6.974 | Complex |
| M22 | 45/F | - | + | 5.737 | Normal |
| M23 | 46/M | - | - | 3.857 | Complex |
| M24 | 59/M | - | - | 10.461 | Complex |
| M25 | 47/F | - | N.D | 6.246 | Complex |
| M26 | 27/F | + | - | 5.227 | Complex |
| M27 | 37/F | - | N.D | 18.311 | Complex |
| M28 | 56/F | + | - | 9.260 | Complex |
| M29 | 84/F | - | N.D | 3.068 | Complex |
| M30 | 61/M | - | + | 3.328 | Normal |
| M31 | 74/M | + | N.D | 5.849 | Complex |
| M32 | 61/M | - | + | 2.354 | Complex |
| M33 | 74/M | - | N.D | 16.343 | Complex |
| M34 | 74/M | - | N.D | 3.031 | Complex |
| M35 | 65/F | - | N.D | 0.808 | Normal |
| M36 | 65/F | - | + | 0.959 | Normal |
| M37 | 81/F | + | + | 1.490 | Complex |
| M38 | 75/F | - | + | 3.671 | Normal |
| M39 | 85/M | - | N.D | 3.026 | Normal |
| M40 | 71/M | - | + | 3.021 | Complex |
| M41 | 77/M | - | + | 0.962 | Complex |
| M42 | 62/M | - | - | 7.275 | Complex |
| M43 | 49/F | - | - | 9.842 | Complex |
| M44 | 51/F | - | + | 3.676 | Normal |
| M45 | 51/F | - | N.D | 1.096 | Normal |
| M46 | 58/M | + | + | 2.825 | Complex |
| M47 | 68/F | + | + | 1.113 | Complex |
| M48 | 59/M | - | N.D | 8.061 | Complex |
a Mean fold difference in gene expression in patients compared to PIGN gene expression in normal healthy control PBMCs.
+: detected
-: not detected
N.D: no data available
Mono: mononuclear cells
*: M4 and M5 from the same patient; M4 at pre-treatment phase and M5 at relapse phase.
PIGN gene expression aberrations were caused by novel intronic retention mutation between exons 14 and 15
We further explored the cause of this PIGN gene expression aberration by cloning and sequencing the PIGN transcripts from 3 patient samples (M1, M2, and M4) and a cell line (MDS-L) which had significantly high PIGN gene expression but no protein expression. Our results revealed the retention of aberrant short intronic fragments (i.e. 11bp to 142bp) between exons 14 and 15 (Figure 2C; 1-4). The predicted product of this mutation is a truncated protein around ~46 kDa which is less than half of the normal protein size (i.e. ~106 kDa). Interestingly, we identified similar variants of this mutation in 11 AML patients from junction files generated from the RNA-seq data of 19 AML patients (dbGaP Study Accession: phs001027.v1.p1) (Figure 2C; 1-11) [38]. Further examination at the resolution of individual bases of these aberrant transcripts revealed that these intron fragments were similar to those originally identified in the patients with PIGN gene expression aberrations.
The novel intronic retention mutations are present in leukemic cells but not in non-leukemic cells and are associated with a relatively high frequency of GPI-AP deficiency
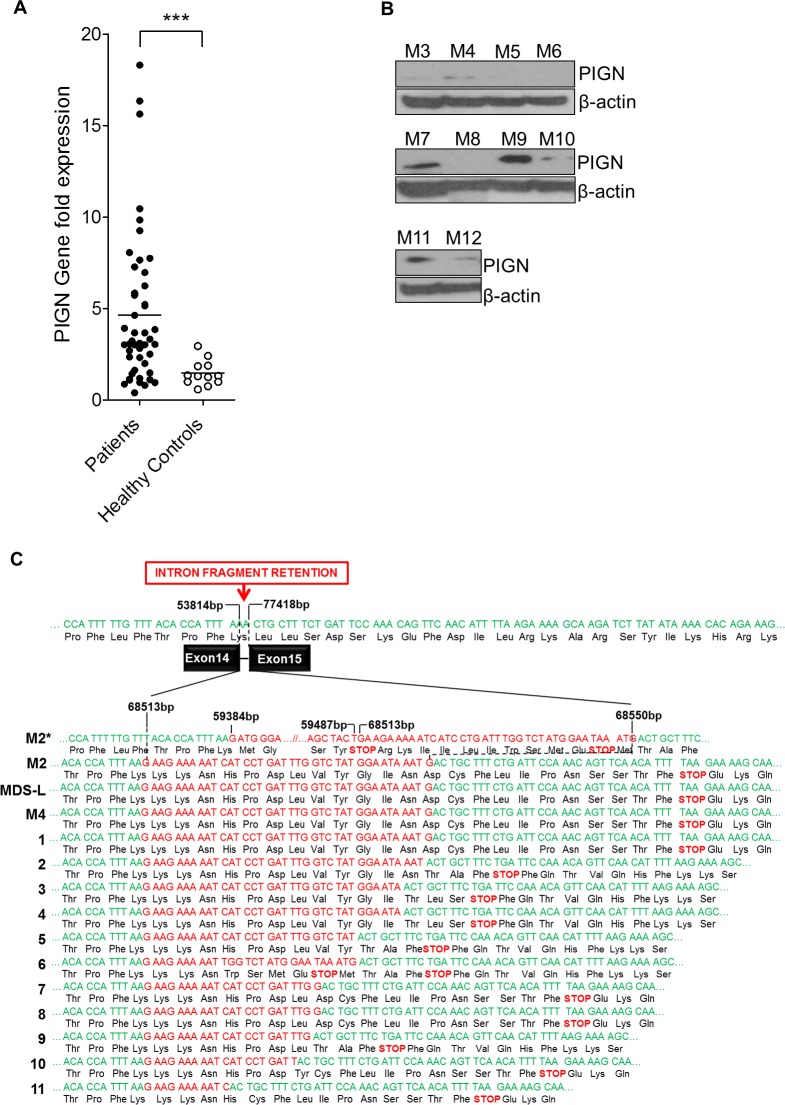
Using RT-qPCR, we examined PIGN gene expression in sorted leukemic cells from 2 AML patients (M1 and M2). Both patients contained TP53 gene deletion mutations (Table 1). PIGN gene expression in the leukemic cells from these two patients was at least 3~7-fold higher than in the non-leukemic cells (NL); but PIGN protein expression was not detectable in those leukemic cells (Figure 3A–3B). We then sub-cloned and sequenced PIGN transcripts from the sorted leukemic cells and non-leukemic cells. Interestingly, we observed the retention of segments (38 bp and 142 bp) of the intervening intron between exons 14 and 15 in the leukemic cells which resulted in frameshifts and led to the occurrence of premature termination codons (PTCs) (Figure 2C); but not in the non-leukemic cells.
Figure 3. PIGN expression aberration resulted in an increased frequency of GPI-AP deficiency.
A. RT-qPCR showed that PIGN gene expression in leukemic cells from AML patients M1 and M2 were significantly (***p<0.0001) higher (i.e. 3- to 7-fold) than in normal control cells from healthy individual (NL). One way ANOVA Tukey’s post-hoc test; error bars represent standard deviation from the mean fold change in gene expression. B. PIGN protein expression was lost in patients M1 and M2. C. Frequency of GPI-AP loss was much higher in leukemic clones than in the non-leukemic clones in the respective AML patients. For detailed calculations of frequency of GPI-AP deficiency please review citation [13]. *Leukemic and non-leukemic cells were sorted using the following markers: HLA-DR, CD13, CD117 and CD45 as described earlier with some modifications [54].
Elevated frequency of GPI-AP deficiency has been linked with genomic instability and leukemic progression [16]. In order to explore the genetic stability status of those patients, we conducted proaerolysin-resistant colony forming cell (CFC) assays on both sorted leukemic and non-leukemic cells from patients M1 and M2. We then calculated the GPI-AP deficiency frequency of the two AML patients as previously described [13]. The median frequencies (GPI-AP deficiency frequency) of proaerolysin-resistant leukemic CFC formation for M1 and M2 were 1.20% and 4.71% (ranging from 0.27 to 3.02% and 2.88 to 6.46%) respectively; however, the median frequencies (GPI-AP deficiency frequency) of proaerolysin-resistant non-leukemic CFC formation were 0.009% and 0.029% (ranging from 0.004% to 0.013% and 0.007% to 0.075%) respectively (Figure 3C). The GPI-AP deficiency frequency in a normal population is approximately 0.002% [13]. Thus, the GPI-AP deficiency frequencies in the leukemic cells were 100 times higher than in the non-leukemic cells.
PIGN gene expression aberrations occur during leukemic transformation and progression
Due to our initial identification of partial intron retentions in the sorted leukemic cells, we examined PIGN gene and protein expression in relation with disease progression in a refractory AML patient (Figure 4A–4B). That patient had 65% leukemic blasts during the pre-treatment phase (M4) and 42% leukemic blasts at the relapse phase (M5). We detected an intron fragment retention between exons 14 and 15 in the pre-treatment mononuclear cells of this patient that was similar to those intron fragment retentions earlier identified in the sorted leukemic cells in M1 and M2 (Figure 2C). However, this intron fragment was not detected in the mononuclear cells collected at the relapse phase. Furthermore, we observed PIGN gene expression aberrations in both phases of disease progression (M4 and M5) in this AML patient, with higher gene expression (~4-fold) in the pre-treatment phase than in the relapse phase (~2.5-fold) compared to normal healthy control cells (Figure 4A–4B), but more suppressed protein expression in the relapse phase.
Figure 4. PIGN expression aberration was a marker of leukemic transformation and progression.
A. PIGN protein was progressively lost in an AML patient (M4 and M5) and B. PIGN gene expression was significantly (***p<0.0001) downregulated from pre-treatment (M4) to relapse (M5). Error bars represent standard deviation from the mean fold change in gene expression. C and D. MDS92 and MDS-L shared the same origin. (C) PIGN protein progressively lost from the MDS phase (MDS92 cells) to the leukemic phase (MDS-L cells) and (D) PIGN gene expression was significantly (***p<0.0001) higher in MDS92 cells than in MDS-L cells. E. Similarly, PIGN protein expression was more suppressed in the myeloblastic phase (KG1) comparing to its myeloid derivative (KG1a) but F. no significant (NS) difference in gene expression was observed between the KG1a and KG1cell lines. However, the PIGN gene transcriptions in all of the above-mentioned samples were elevated 2- to 5- fold in comparison with PIGN gene expression in CD34+ cells from healthy individuals. Error bars represent standard deviation from the mean fold change in gene expression. G. This simplified model depicted the loss of PIGN protein with disease progression from a less aggressive disease stage to a more aggressive disease stage.
In order to examine whether PIGN gene expression aberration occurs during leukemic transformation, we employed a cell line model of MDS transformation to AML. This model involves two cell lines (MDS92 and its blastic subline MDS-L) generated from a single patient but with distinct phenotypes representative of the MDS phase and the AML phase of leukemic progression respectively [39]. We examined PIGN gene and protein expression in these two cell lines. PIGN protein expression was relatively higher in MDS92 cell line but was not detected in MDS-L cell line (Figure 4C). Moreover, we observed a relatively high PIGN gene expression in MDS92 cells (~5.1-fold) and MDS-L cells (~2.2-fold) compared to normal non-leukemic mononuclear cells (Figure 4D). Thus, PIGN gene expression aberration was more obvious in the leukemic phase than in the MDS phase. Interestingly, we detected the same intron fragment retention in the leukemic phase MDS-L cell line as the one we identified in leukemic cells from M2 and M4 (Figure 2C). This mutation was however not detected in the MDS92 cells. Thus, PIGN expression aberration occurs during MDS leukemic transformation and progression and is marked by the presence of partial intron retention mutations between exons 14 and 15, and ultimately the progressive loss of PIGN protein expression. We also observed a similar PIGN expression aberration pattern in one (KG1) of two leukemia cell lines (KG1 and KG1a) originated from a single patient, KG1 harboring a myeloblast phenotype but KG1a bearing a stem/progenitor-like phenotype (Figure 4E–4F). However, no intron fragment retention was detected in either cell lines while PIGN gene expression was only marginally different between these two cell lines. Overall, the progressive loss of PIGN protein expression in these leukemic cells and cell lines in the different MDS/leukemic progression phases indicated that PIGN loss may mark myeloid leukemia progression from a less aggressive disease state to a more aggressive one (Figure 4G). However, the partial intron retention mutations between exons 14 and 15 only occur in a subgroup of patients, especially those patients who have not received chemotherapy yet.
The genomic instability status in leukemic cells was driven by PIGN gene expression aberration and was TP53 regulatory pathway independent
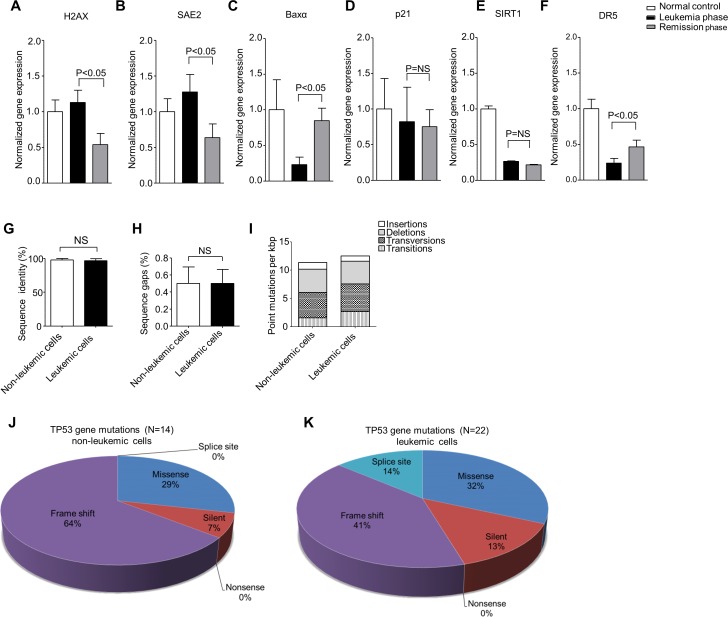
We further investigated the role of PIGN gene expression aberration in genomic instability by comparing the gene expression levels of a group of genomic instability/DNA damage related biomarkers in peripheral blood mononuclear cells collected from patient M2 at leukemia active phase and leukemia remission phase. We observed that the biomarkers not regulated by TP53 (H2AX and SAE2) manifested a significant transcriptional activation in the leukemia active phase but not in the remission phase (Figure 5A–5B). H2AX is a genomic instability suppressor gene and SAE2 encodes a protein involved in double strand DNA break repair [40, 41]. BAXα, a pro-apoptotic gene, was significantly downregulated in the leukemia active phase as well (Figure 5C). However, the expression of TP53 target gene p21 and the TP53 deacetylase gene SIRT1 was not significantly different between leukemia phase and remission phase (Figure 5D–5E). The TP53-dependent TRAIL death receptor DR5 was upregulated in the remission phase but was still about 50% below the DR5 gene expression in the normal control (Figure 5F).
Figure 5. PIGN expression aberration was associated with genomic instability in leukemic cells and was TP53-pathway independent.
A and B. TP53-independent genomic instability/DNA damage markers (H2AX and SAE2) gene expression were significantly (p<0.05) upregulated in the leukemic phase compared to remission phase. C. The expression of TP53-targeted apoptosis marker BAXα was downregulated in both leukemic phase and remission phase though it was more significantly (p<0.05) in the PMNC rich with leukemic cells. D. The TP53 target gene involved in cell cycle control (p21) was not significantly (NS) different between the active leukemia and remission phase and could point to a TP53-independent mechanism. E. The TP53 deacetylase and deactivator, SIRT1 was also not significantly (NS) different between the leukemic and remission phase of disease progression. F. The expression of the TP53 target, TRAIL death receptor 5 (DR5) was significantly downregulated in the leukemic cell rich active leukemia phase compared to the remission phase but DR5 expression was below 50% of the normal control in both the leukemia and remission phases. Genomic instability biomarkers not regulated by TP53 (H2AX and SAE2) showed significantly transcriptional activation in mononuclear cells rich with leukemic cells in the active leukemia phase but not in mononuclear cells in the remission phase. Results were analyzed using a One-way ANOVA followed by Tukey’s post hoc tests. P-values <0.05 were considered statistically significant. G and H. the PBMCs from patient M2 were sorted into leukemic and non-leukemic cell populations followed by Sanger sequencing of approximately 2,300 bp of DNA encoding for intron and exon regions ranging from exons 2-11 of the TP53 gene revealed no significant (NS) difference in the overall sequence identity (%) of sequenced (G) introns and (H) exons between the non-leukemic and the leukemic cells with reference to the TP53 gene sequence (NC_000017.9). I. Combined intron and exon mutation frequency normalized to kilo bp (kbp) of the TP53 gene in non-leukemic and leukemic cells in patient M2. Qualitative analysis of sequence alterations of TP53 gene coding sequences (exons) of J. non-leukemic cells and K. leukemic cell populations in patient M2 showed no significant difference. Statistical differences were analyzed using Student’s t-test. P-values ≤0.05 were considered statistically significant. ‘NS’ indicates statistically non-significant (p>0.05) differences.
TP53 gene deletion was observed in both M2’s leukemic cells and non-leukemic cells. Approximately 2,300 bp of DNA from non-leukemic and leukemic cells spanning exons 2-11 of the TP53 gene was analyzed by Sanger sequencing. However, only three sequence alterations could be verified as a conserved deletion or missense mutations between the different cell types (Table 2). We found no significant difference in sequence identity (%) between non-leukemic and leukemic cells derived from patient M2 (Figure 5G–5H). The overall mutation rate was also similar between non-leukemic and leukemic cells with 11.4/kbp and 12.5/kbp respectively (Figure 5I). Non-leukemic cells displayed a total of 14 sequence alterations in the coding sequence whereas leukemic cells displayed 22 (Figure 5J–5K). However, PIGN gene expression aberration was only observed in the leukemic cells. Thus, we proposed that PIGN gene expression aberration may be the driving force of high genomic instability in the leukemic cells.
Table 2. Verified common non-leukemic and leukemic mutations in the TP53 gene.
| Positiona | Exon | Nucleotide change | Type | AA Change | SIFTb |
|---|---|---|---|---|---|
| 11,031 | 2 | G>A | Non-synonymous | p.S9N | neutral |
| 11,470 | 4 | C>G | Non-synonymous | p.P80R | neutral |
| 12,379 | 5 | C>- | Frameshift deletion | p.N131fs | NA |
a Position in GenBank NC_000017.9
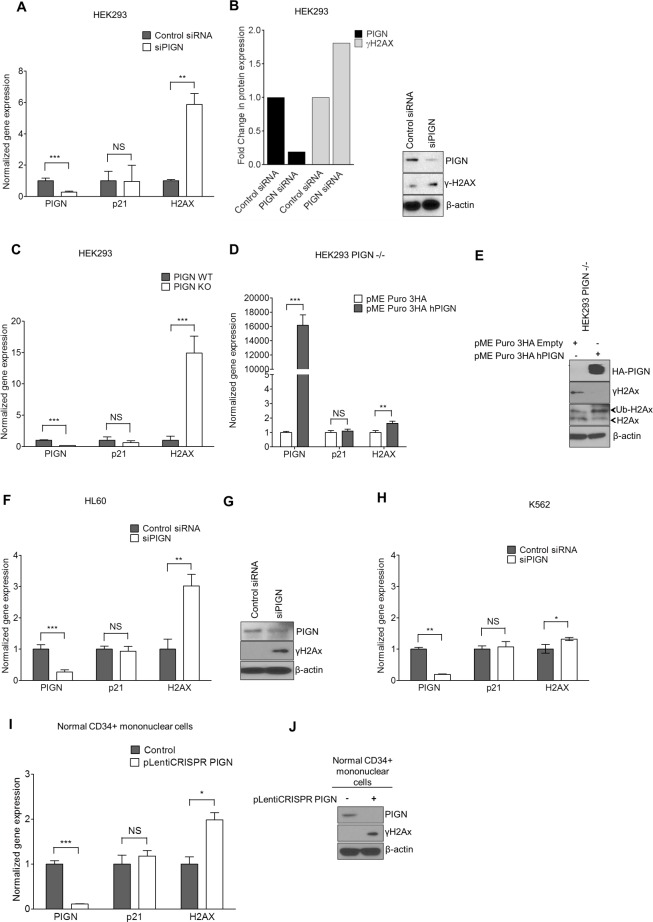
In order to further test our hypothesis that PIGN gene expression aberration can contribute to genomic instability regardless of TP53 gene status, we employed the transient knockdown of PIGN in multiple cell lines with various TP53 gene mutation statuses. We investigated the impact of PIGN gene expression suppression or silencing on the gene expression of p21 and H2AX in HL60 (TP53 deletion), K652 (TP53 mutation), HEK293 and HEK293 PIGN KO (TP53 wild type) cell lines and CD34+ mononuclear cells from a healthy individual. We observed that PIGN suppression in HEK293 cells resulted in the upregulation of H2AX transcription and γH2AX induction (Figure 6A–6B). Moreover, CRISPR/Cas9 knockout of PIGN in HEK293 cells confirmed a functional link between PIGN loss and the induction of genomic instability in cells and involved an increased transcription (~15-fold) of H2AX (Figure 6C). However, genomic instability was reduced as shown by γH2AX downregulation with the restoration of PIGN expression (Figure 6E). We confirmed these findings in K562 and HL60 cell lines (Figure 6F–6H) and in CD34+ mononuclear cells from a healthy individual (Figure 6I–6J). Interestingly, H2AX expression in these cell lines was not influenced by their TP53 gene mutation status, and p21 gene expression was not influenced by PIGN gene expression status. Thus, PIGN loss or suppression induced genomic instability in a TP53 pathway-independent manner.
Figure 6. PIGN gene expression suppression was associated with genomic instability; and reintroduction of PIGN gene expression restored genomic stability in a TP53-pathway independent manner.
A. PIGN suppression (***p=0.0008) in HEK293 (TP53wt) cells resulted in the upregulated gene expression of H2AX (**p=0.0029) but no significant change (NS) in p21 gene expression. B. PIGN suppression resulted in DNA damage response via a ~50% upregulation of γH2AX transcription and translation in HEK293 cells. C. PIGN deletion (***p< 0.0001) results in a ~15 fold increase (***p=0.0003) in H2AX gene expression but a marginal increase in TP53-dependent p21 gene expression in HEK293 cells. D. Restoration of PIGN in PIGN null (CRISPR/Cas9 deletion) HEK293 cells via transfection of PIGN expression plasmid results in a marked upregulation (i.e. ~400-fold) in PIGN gene expression with a ~1.6-fold increase (**p= 0.0056) of H2AX transcription and no significant (NS) change in p21 gene expression. E. Restoration of PIGN expression in PIGN null HEK293 cells ameliorates genomic instability as indicated by γH2AX suppression while increasing the mono-ubiquitination of H2AX which is critical in the initiation of DNA damage response. F and G. PIGN loss (***p= 0.0003) in HL60 cells (TP53 null) results in a significant (**p=0.0013) upregulation of H2AX in both (F) transcription level and (G) translation level but not (NS) p21 gene transcription. H. PIGN suppression (**p=0.0019) resulted in a marginal increase (*p=0.0387) in H2AX gene expression (NS) but not p21 gene expression (NS) in K562 cells (TP53 inactivation mutation). Above-mentioned data indicated that PIGN suppression/elimination caused genomic instability was independent from TP53-pathway regulation. I. CRISPR/Cas9 ablation (***p<0.0001) of PIGN in normal healthy donor CD34+ mononuclear cells results in a significant (*p=0.0261) upregulation in H2AX transcriptional activation without a significant (NS) increase in p21 transcriptional activation. J. PIGN loss via CRISPR/Cas9 ablation induces upregulation of γH2AX translation in normal healthy donor CD34+ mononuclear cells.
PIGN maintains genomic stability, especially chromosomal stability, by regulating the mitotic spindle assembly checkpoint protein MAD1
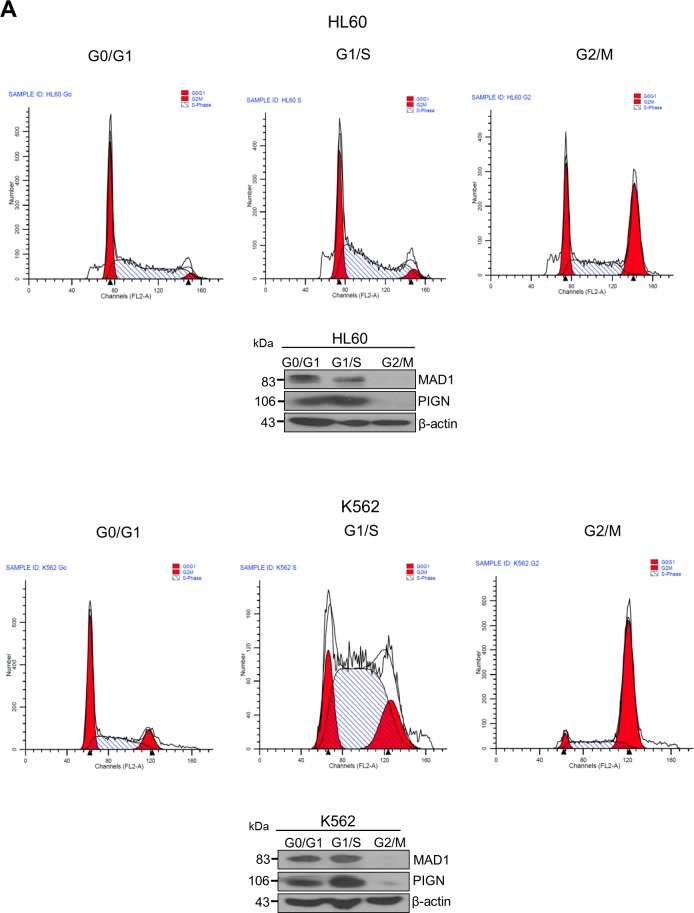
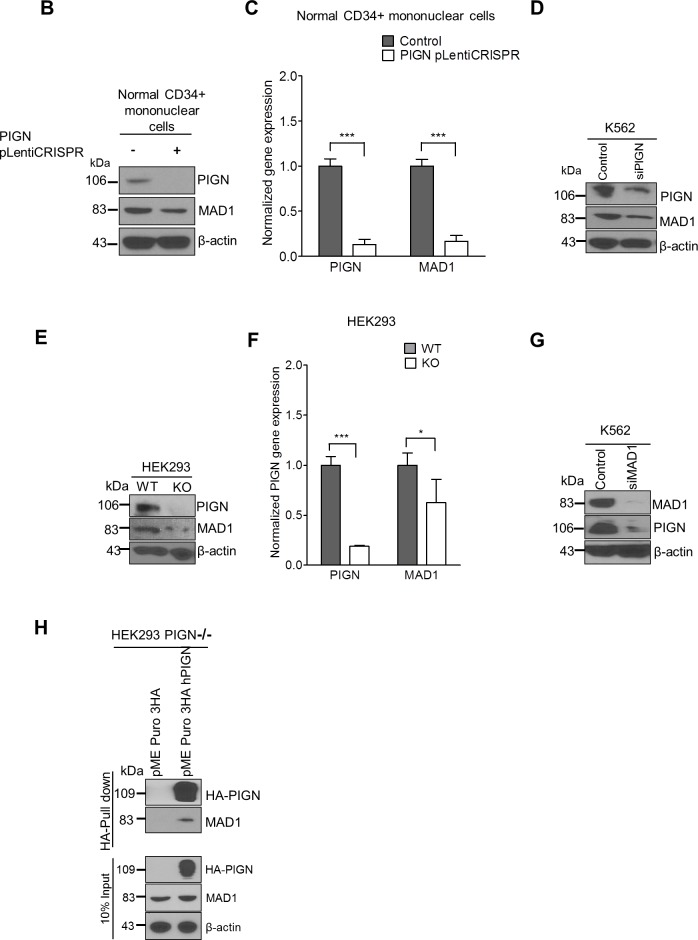
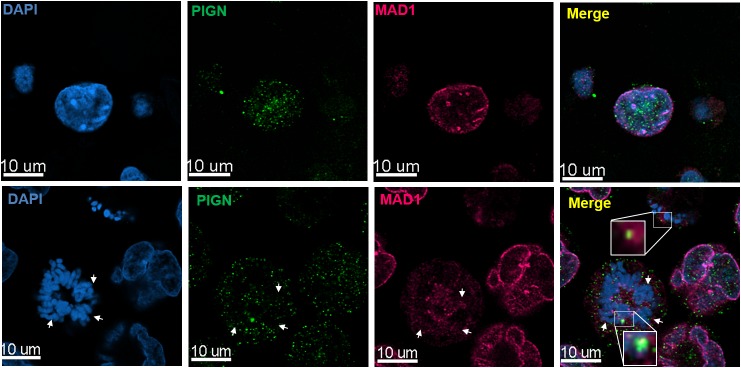
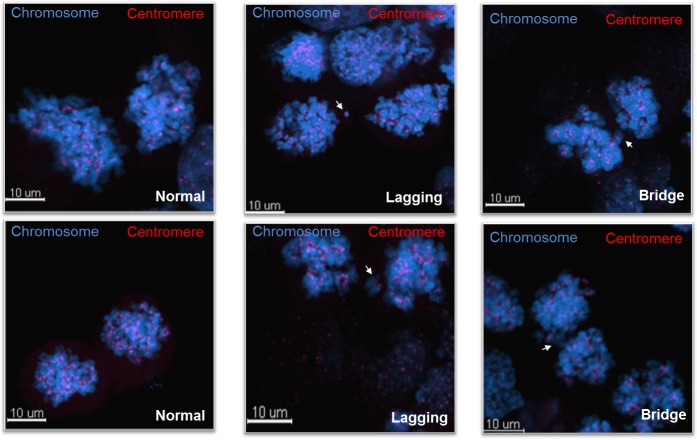
We sought to further investigate the mechanistic role of PIGN in maintaining genomic stability. We conducted cell cycle experiments by blocking cell cycle progression at G0/G1, S and G2/M phases in HL60 and K562 cells via serum starvation, double-thymidine and nocodazole treatment respectively. We observed a cell-cycle dependent expression of PIGN which correlated with the expression of the spindle assembly checkpoint (SAC) protein MAD1. PIGN and MAD1 were least expressed in the G2/M phase of the cell cycle (Figure 7A). The SAC is primarily responsible for ensuring proper chromosomal segregation during metaphase-anaphase transition [42]. We observed that PIGN suppression/knockout caused MAD1 suppression, even in CD34+ mononuclear cells derived from a healthy individual (Figure 7B–7F). Alternatively, MAD1 suppression resulted in decreased expression of PIGN (Figure 7G). These findings revealed a novel reciprocal regulation between the SAC component MAD1 and PIGN. To further investigate the relationship between PIGN and MAD1, we transfected CRISPR/Cas9 PIGN KO HEK293 cells with an HA-tagged PIGN and performed a HA-tag pulldown assay. We observed a direct interaction between PIGN and MAD1 with the highest interaction at 48 hours post-transfection (Figure 7H). Confocal analyses also revealed co-localization of MAD1 and PIGN during prometaphase in K562 cells (Figure 7I). PIGN loss was also accompanied by an increase in the frequency of missegregation errors in PIGN CRISPR/Cas9 knockout HEK293 cells (Figure 7J–7K). The same experiments were conducted on a leukemia patient sample (M4), HL60 and K562 cells with similar observations (data not shown). The above data indicated that PIGN maintains chromosomal stability by interaction with the SAC protein MAD1 during the cell cycle.
Figure 7. PIGN loss induced chromosomal instability via dysregulation of the spindle assembly checkpoint protein MAD1.
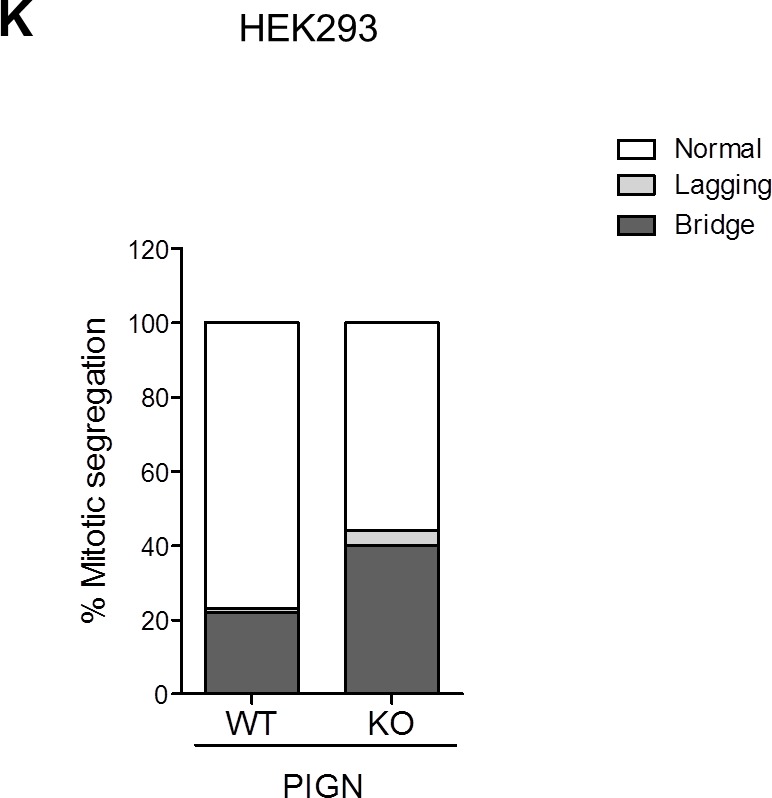
A. PIGN and MAD1 were similarly expressed in a cell cycle-dependent manner with suppressed expression in the G2/M phase in HL60 and K562 cells. B. PIGN loss via CRISPR/Cas9 ablation resulted in MAD1 downregulation in normal healthy donor CD34+ mononuclear cells. C. MAD1 gene expression was significantly (***p=0.0007) impacted by PIGN gene loss in normal healthy donor CD34+ mononuclear cells. D. RNAi-mediated PIGN suppression resulted in MAD1 downregulation in K562 cells. E-F. Comparing PIGN wild-type (WT) HEK293 cells and PIGN null (KO) HEK293 cells: PIGN loss is associated with downregulation of MAD1 protein expression and repression (*p=0.0509) of MAD1 gene transcriptional activation. G. MAD1 suppression was accompanied by a corresponding decrease in PIGN protein expression in K562 cells. H. MAD1 directly interacted with PIGN. MAD-1 was co-purified with PIGN in a HA-tag pulldown assay in PIGN null HEK293 cells. Input represents 10% of total protein lysate used in the HA pull down assay. I. Immunofluorescence image of K562 cells showed that PIGN (green) and MAD1(red) had a similar pattern of localization during the mitotic phase and co-localized (yellow) during late prometaphase. White arrows indicate groups of chromosomes in prometaphase. Upper panel: Asynchronous cells; Lower panel: Late prometaphase cells. J-K. PIGN loss in HEK293 cells results in phenotypes associated with chromosomal instability (increased lagging chromosomes and anaphase bridges). J. Representative images of missegregation errors observed in HEK293 cells; Blue (chromosomes) and red (centromere). White arrows indicate lagging chromosomes and positions of anaphase bridges. K. Quantitative analyses of missegregation errors were calculated by counting the numbers of lagging and anaphase bridges observed in a total of 100 cells randomly selected from multiple fields of view.
DISCUSSION
Genomic instability is a driving force for cancer initiation and progression. Previous studies have indicated that cell lines with genomic instability (i.e. Fanconi anemia and colon cancer cells with a mutator phenotype) had a marked increase in frequency of acquiring GPI-AP deficiency [14, 15, 17]. Our laboratory observations have also shown that MDS and myeloproliferative diseases (MPD) patients bearing high frequency of GPI-AP deficiency posed a higher risk for leukemic transformation [12]. Using bioinformatics tools to screen existing databases we identified the PIGN gene as a predictor of MDS progression risk [36]. We then observed a unique gene expression aberration pattern within a subgroup of patients with MDS or AML-MRC. We were able to link PIGN protein loss to the presence of partial retentions of the intervening intron between exons 14 and 15 that resulted in frameshifts and early translational termination. We confirmed the presence of this intron retention mutation in multiple AML patients based on RNA-seq data analyses (phs001027.v1.p1) that verified the conserved nature of this mutation. However, no such natural alternative splice variants of PIGN gene have been reported (Ensembl release 85: ENSG00000197563). Thus, the novel intron fragment retention identified in our study is not a natural alternative splice variant. Similar deleterious splice defects were previously reported for genes including DMD, C9orf72 and GR associated with muscular dystrophy, amyotrophic lateral sclerosis/frontotemporal dementia and small cell lung cancer respectively [43–45]. Moreover, splicing factor genes have been reported to be mutated in MDS and AML [46].
We also observed PIGN gene expression aberration and partial intron retention in a pre-treatment sample (M4) from an AML patient. Despite progressive loss of PIGN protein expression in the relapse sample (M5), this intron fragment retention was not detected. We could not explain why partial intron retention was not detected in M5, though M5 was in the state of PIGN gene expression aberration. We hypothesize that chemotherapy may eliminated the clone harboring PIGN partial intron retention but the chemo-resistant clones survived and proliferated, which could explain why PIGN protein expression was not observed in M5. Earlier studies have demonstrated the occurrence of multiple clones with varied sensitivity to chemotherapy [47, 48].
The data from our patient samples, cell lines and existing databases are in line with previous observations that elevated frequency of GPI-AP deficiency is a marker of genomic instability and might predict a risk of leukemic transformation and progression [15–17]. Furthermore, this study indicated that PIGN gene expression aberration may be the key factor linking GPI-AP deficiency with CIN and leukemogenesis. Previous studies demonstrated that, unlike PIGA, PIGN gene loss would not completely eliminate GPI-AP biosynthesis [19, 21]. This piece of data may explain why the leukemic cells from patients M1 and M2 still showed sign of CFC formation reduction in proaerolysin-containing medium though the CFC counts were significantly higher than the normal control.
We further explored the role of PIGN gene expression aberration in genomic instability/leukemic progression and the role of the TP53 signaling pathway in the regulation of genomic instability during leukemia progression by studying the leukemic cells from patient M2, and several cell lines. In this patient, TP53 gene deletion was observed in both leukemic cells and non-leukemic cells and manifested with a similar mutation profile, however, the PIGN gene expression aberration only occurred in the leukemic cells. We found that the gene expression of TP53-independent genomic instability/DNA damage markers (H2AX and SAE2) were upregulated and the expression of the pro-apoptosis marker BAXα was downregulated specifically in the leukemic cell-rich mononuclear cells at the active leukemia phase when compared to the cells from the remission phase. However, the expressions of TP53-dependent biomarkers, such as p21 and SIRT1, were not significantly different between the active phase and the remission phase. Furthermore, the expression of the TRAIL death receptor 5 (DR5) was below 50% of that of the normal control in both active phase and the remission phase. We further observed that suppression or elimination of PIGN gene expression in several cell lines and CD34+ mononuclear cells from healthy individuals induced a similar TP53 independent pattern of genomic instability which could be reversed via PIGN gene expression restoration (Figure 6A–6J).
Our data demonstrated that PIGN gene expression aberration was associated with genomic instability in leukemic cells and was independent of the TP53 regulatory pathway. A similar phenomenon was reported in the normal epithelium of benign breast tissue within the same breast cancer patients [49]. Wong et al. also previously reported the presence of functional TP53 mutations in mononuclear cells isolated from healthy individuals [50]. It was suggested that TP53 loss may be permissive rather than causative with regards to genomic instability [18, 51]. Thus, this is likely a reflection of the loss of the CIN suppressor PIGN, facilitating TP53 gene loss of heterozygosity (LOH) in leukemic cells and corroborates the fact that TP53 loss alone is insufficient for the promotion of genomic instability in those cells [18, 51, 52]. Our findings are also consistent with previous observations in Li-Fraumeni Syndrome patients and may explain why those patients are prone to develop therapy-related MDS with complex cytogenetics and poor prognosis [53].
PIGN protein was historically known as a membrane protein involved in GPI-AP biosynthesis, however, we showed that PIGN could directly interact with the SAC protein MAD1. PIGN loss resulted in the dysregulation of MAD1 during cell cycle progression and was associated with an increased frequency of mitotic missegregation. We demonstrated that PIGN and MAD1 were expressed similarly in a cell cycle-dependent manner with a subtle co-localization during prometaphase and the least expression in the mitotic phase relative to the G0/G1 and S phases. This decline in expression at mitotic block may be the natural process for microtubule/spindle detachment from the kinetochore or could be due to the spindle disrupting effect of nocodazole treatment which may in turn result in the destabilization and degradation of the MAD1-PIGN complex. This study showed for the first time that PIGN could directly interact with SAC protein complex at the mitotic phase of cell cycle to regulate chromosome stability. Thus, we postulate a novel model of PIGN regulation of chromosome stability via interaction and regulation of the SAC protein MAD1.
In conclusion, PIGN is a novel biomarker of CIN and leukemic transformation/progression in a subgroup of patients with MDS or AML-MRC. This study provides additional evidence for the necessity of updating our MDS/AML risk estimation stratification system, and may help to develop novel MDS/AML therapy specifically targeting CIN.
MATERIALS AND METHODS
A brief description of research methods is below. Please read the Supplementary Material for detailed methodology.
Leukemic blasts cell sorting
Leukemic blasts were sorted from CD34+ cells under BSL-2 conditions with a 16-color BD FACSAria SORP high speed cell sorter (Becton Dickinson) using the following markers: HLA-DR, CD13, CD117 and CD45 as previously described with few modifications [54].
Selection of proaerolysin-resistant CFCs and GPI-AP deficiency frequency analysis
The selection of proaerolysin-resistant colony forming cells (CFCs) was conducted as previously described with some modifications [13].
PIGN knockdown and CRISPR/Cas9 knockout studies
RNAi-mediated PIGN knockdown experiments were conducted using the Nucleofector™ II Device (Amaxa) in conjunction with the Cell line Nucleofector™ Kit V reagent kit (Amaxa). CRISPR/Cas9 experiments were conducted according to a modified LentiCRISPRv2 (Addgene plasmid #49535) protocol [55]. The gRNA (AAACGGTCATGTAGCTCTGATAGC) we employed targets PIGN at exon 4 and results in a frameshift [21].
TP53 sequence analyses
One microgram of DNA isolated from non-leukemic cells and leukemic cells was amplified using primers covering exons 2-11 of the TP53 gene including intron/exon boundaries according to instructions in the IARC database (http://p53.iarc.fr) [56]. Seven PCR reactions per sample (non-leukemic and leukemic) were spin column purified and sequenced using a 3130XL capillary sequencer (ABI systems) with the same primers in both reverse and forward directions. The obtained sequence was analyzed using the software FinchTV version 1.4.0 and nucleotide BLAST (http://blast.ncbi.nlm.nih.gov/Blast). Sequencing products were aligned to the TP53 GenBank sequence NC_000017.9 and sequence alterations were identified partially through manual inspection. Sequence alterations were correlated with the coding sequence of the TP53 protein and the impact on protein Sorting Intolerant From Tolerant (SIFT) was determined using the IARC database (http://p53.iarc.fr/p53Sequence.aspx) [56, 57].
Bioinformatics analyses and statistical analyses
The GENE-E (http://www.broadinstitute.org/cancer/software/GENE-E/) matrix visualization and analysis platform was used to generate a heat map of the CIN70 signature of the CD34+ cells of 55 MDS patients and 11 healthy controls utilizing data generated on the Affymetrix GeneChip U133 Plus2.0 platform from the study GSE4619 [36, 37]. The randomForest v4.6-12 R package with default parameters was used in a randomForest analysis to classify patients based on MDS risk stratification. RNA-seq Analysis study was conducted on raw RNA-seq files from the dbGAP study phs001027.v1.p1. For details, please read the Supplementary Data.
MDS92 and MDS-L cells were a gift from Dr. Kaoru Tohyama, Department of Laboratory Medicine, Kawasaki Medical School Kurashiki, Okayama, Japan. HEK293 CRISPR KO cells and pME PURO 3HA hPIGN expression plasmid were the gifts from Drs. Taroh Kinoshita and Yoshiko Murakami, Research Institute for Microbial diseases, Osaka University.
SUPPLEMENTARY MATERIALS FIGURES AND TABLES
Acknowledgments
The authors thank the patients and their families for contributing invaluable disease knowledge and specimens for this study. The authors also thank the nurses and other medical staff for their effort in coordinating this study.
Footnotes
CONFLICTS OF INTEREST
The authors declare that they have no conflicts of interest.
GRANT SUPPORT
This study was supported by: AA&MDSIF research grant to JJP (146818), American Cancer Society research grant to JJP (124171-IRG-13-043-02), and a Pennsylvania State University College of Medicine research grant to JJP.
Author contributions
JJP designed this study and wrote this manuscript; JJP, EKT, AS, PX, NKF, PG, and SS conducted experiments and performed data analyses; YIK and ACS conducted bioinformatics study and analyses; TA contributed to Confocal imaging study; JJP, MB, WCE, DFC, and WBR provided patient care; EKT, NKF, YIK, ACS, HGW, JJD, WSE, RAB, and RJH participated in manuscript formation by providing comments and suggestions.
REFERENCES
- 1.American Cancer Society Cancer Facts & Figures. 2016.
- 2.Arber DA, Orazi A, Hasserjian R, Thiele J, Borowitz MJ, Le Beau MM, Bloomfield CD, Cazzola M, Vardiman JW. The 2016 revision to the World Health Organization classification of myeloid neoplasms and acute leukemia. Blood. 2016;127:2391–405. doi: 10.1182/blood-2016-03-643544. [DOI] [PubMed] [Google Scholar]
- 3.Vardiman J, Reichard K. Acute Myeloid Leukemia With Myelodysplasia-Related Changes. Am J Clin Pathol. 2015;144:29–43. doi: 10.1309/AJCP58RSMFRHLHHH. [DOI] [PubMed] [Google Scholar]
- 4.Genovese G, Kahler AK, Handsaker RE, Lindberg J, Rose SA, Bakhoum SF, Chambert K, Mick E, Neale BM, Fromer M, Purcell SM, Svantesson O, Landen M, et al. Clonal hematopoiesis and blood-cancer risk inferred from blood DNA sequence. N Engl J Med. 2014;371:2477–87. doi: 10.1056/NEJMoa1409405. [DOI] [PMC free article] [PubMed] [Google Scholar]
- 5.Negrini S, Gorgoulis VG, Halazonetis TD. Genomic instability--an evolving hallmark of cancer. Nat Rev Mol Cell Biol. 2010;11:220–8. doi: 10.1038/nrm2858. [DOI] [PubMed] [Google Scholar]
- 6.Rabinovitch PS, Reid BJ, Haggitt RC, Norwood TH, Rubin CE. Progression to cancer in Barrett’s esophagus is associated with genomic instability. Lab Invest. 1989;60:65–71. [PubMed] [Google Scholar]
- 7.Tainsky MA, Bischoff FZ, Strong LC. Genomic Instability Due to Germline P53 Mutations Drives Preneoplastic Progression toward Cancer in Human-Cells. Cancer and Metastasis Reviews. 1995;14:43–8. doi: 10.1007/Bf00690210. [DOI] [PubMed] [Google Scholar]
- 8.Sheffer M, Bacolod MD, Zuk O, Giardina SF, Pincas H, Barany F, Paty PB, Gerald WL, Notterman DA, Domany E. Association of survival and disease progression with chromosomal instability: a genomic exploration of colorectal cancer. Proc Natl Acad Sci U S A. 2009;106:7131–6. doi: 10.1073/pnas.0902232106. [DOI] [PMC free article] [PubMed] [Google Scholar]
- 9.Byrne M, Bennett RL, Cheng X, May WS. Progressive genomic instability in the Nup98-HoxD13 model of MDS correlates with loss of the PIG-A gene product. Neoplasia. 2014;16:627–33. doi: 10.1016/j.neo.2014.07.004. [DOI] [PMC free article] [PubMed] [Google Scholar]
- 10.Grove CS, Vassiliou GS. Acute myeloid leukaemia: a paradigm for the clonal evolution of cancer? Dis Model Mech. 2014;7:941–51. doi: 10.1242/dmm.015974. [DOI] [PMC free article] [PubMed] [Google Scholar]
- 11.Mrozek K. Cytogenetic, molecular genetic, and clinical characteristics of acute myeloid leukemia with a complex karyotype. Semin Oncol. 2008;35:365–77. doi: 10.1053/j.seminoncol.2008.04.007. [DOI] [PMC free article] [PubMed] [Google Scholar]
- 12.Pu JJ, Spivak JL, Brodsky RA, Moliterno A. The origin of GPI-AP deficient cells in MDS, MPD, and aplastic anemia and its significance in predicting leukemic transformation. J Clin Oncol. 2013:1–2. [Google Scholar]
- 13.Pu JJ, Hu R, Mukhina GL, Carraway HE, McDevitt MA, Brodsky RA. The small population of PIG-A mutant cells in myelodysplastic syndromes do not arise from multipotent hematopoietic stem cells. Haematologica. 2012;97:1225–33. doi: 10.3324/haematol.2011.048215. [DOI] [PMC free article] [PubMed] [Google Scholar]
- 14.Araten DJ, Martinez-Climent JA, Perle MA, Holm E, Zamechek L, DiTata K, Sanders KJ. A quantitative analysis of genomic instability in lymphoid and plasma cell neoplasms based on the PIG-A gene. Mutat Res. 2010;686:1–8. doi: 10.1016/j.mrfmmm.2009.11.012. [DOI] [PMC free article] [PubMed] [Google Scholar]
- 15.Araten DJ, Golde DW, Zhang RH, Thaler HT, Gargiulo L, Notaro R, Luzzatto L. A quantitative measurement of the human somatic mutation rate. Cancer Res. 2005;65:8111–7. doi: 10.1158/0008-5472.CAN-04-1198. [DOI] [PubMed] [Google Scholar]
- 16.Chen R, Eshleman JR, Brodsky RA, Medof ME. Glycophosphatidylinositol-anchored protein deficiency as a marker of mutator phenotypes in cancer. Cancer Res. 2001;61:654–8. [PubMed] [Google Scholar]
- 17.Peruzzi B, Araten DJ, Notaro R, Luzzatto L. The use of PIG-A as a sentinel gene for the study of the somatic mutation rate and of mutagenic agents in vivo. Mutat Res. 2010;705:3–10. doi: 10.1016/j.mrrev.2009.12.004. [DOI] [PubMed] [Google Scholar]
- 18.Burrell RA, McClelland SE, Endesfelder D, Groth P, Weller MC, Shaikh N, Domingo E, Kanu N, Dewhurst SM, Gronroos E, Chew SK, Rowan AJ, Schenk A, et al. Replication stress links structural and numerical cancer chromosomal instability. Nature. 2013;494:492–6. doi: 10.1038/nature11935. [DOI] [PMC free article] [PubMed] [Google Scholar]
- 19.Hong Y, Maeda Y, Watanabe R, Ohishi K, Mishkind M, Riezman H, Kinoshita T. Pig-n, a mammalian homologue of yeast Mcd4p, is involved in transferring phosphoethanolamine to the first mannose of the glycosylphosphatidylinositol. J Biol Chem. 1999;274:35099–106. doi: 10.1074/jbc.274.49.35099. [DOI] [PubMed] [Google Scholar]
- 20.Yada T, Sugiura R, Kita A, Itoh Y, Lu Y, Hong Y, Kinoshita T, Shuntoh H, Kuno T. Its8, a fission yeast homolog of Mcd4 and Pig-n, is involved in GPI anchor synthesis and shares an essential function with calcineurin in cytokinesis. J Biol Chem. 2001;276:13579–86. doi: 10.1074/jbc.M009260200. [DOI] [PubMed] [Google Scholar]
- 21.Ohba C, Okamoto N, Murakami Y, Suzuki Y, Tsurusaki Y, Nakashima M, Miyake N, Tanaka F, Kinoshita T, Matsumoto N, Saitsu H. PIGN mutations cause congenital anomalies, developmental delay, hypotonia, epilepsy, and progressive cerebellar atrophy. Neurogenetics. 2014;15:85–92. doi: 10.1007/s10048-013-0384-7. [DOI] [PubMed] [Google Scholar]
- 22.Golla A, Jansson A, Ramser J, Hellebrand H, Zahn R, Meitinger T, Belohradsky BH, Meindl A. Chronic recurrent multifocal osteomyelitis (CRMO): evidence for a susceptibility gene located on chromosome 18q21.3-18q22. Eur J Hum Genet. 2002;10:217–21. doi: 10.1038/sj.ejhg.5200789. [DOI] [PubMed] [Google Scholar]
- 23.Maydan G, Noyman I, Har-Zahav A, Neriah ZB, Pasmanik-Chor M, Yeheskel A, Albin-Kaplanski A, Maya I, Magal N, Birk E, Simon AJ, Halevy A, Rechavi G, et al. Multiple congenital anomalies-hypotonia-seizures syndrome is caused by a mutation in PIGN. J Med Genet. 2011;48:383–9. doi: 10.1136/jmg.2010.087114. [DOI] [PubMed] [Google Scholar]
- 24.Chen CP, Lin HM, Leung C, Lin SP, Su YN, Su JW, Chen YT, Wang W. Partial monosomy 9p (9p22.2-->pter) and partial trisomy 18q (18q21.32-->qter) in a female infant with anorectal malformations. Genet Couns. 2012;23:201–6. [PubMed] [Google Scholar]
- 25.McKean DM, Niswander L. Defects in GPI biosynthesis perturb Cripto signaling during forebrain development in two new mouse models of holoprosencephaly. Biol Open. 2012;1:874–83. doi: 10.1242/bio.20121982. [DOI] [PMC free article] [PubMed] [Google Scholar]
- 26.Hansen L, Tawamie H, Murakami Y, Mang Y, ur Rehman S, Buchert R, Schaffer S, Muhammad S, Bak M, Nothen MM, Bennett EP, Maeda Y, Aigner M, et al. Hypomorphic mutations in PGAP2, encoding a GPI-anchor-remodeling protein, cause autosomal-recessive intellectual disability. Am J Hum Genet. 2013;92:575–83. doi: 10.1016/j.ajhg.2013.03.008. [DOI] [PMC free article] [PubMed] [Google Scholar]
- 27.Krawitz PM, Murakami Y, Riess A, et al. Kruger U, Zhu N, Kinoshita T, Mundlos S, Hecht J, Robinson PN, Horn D. PGAP2 mutations, affecting the GPI-anchor-synthesis pathway, cause hyperphosphatasia with mental retardation syndrome. Am J Hum Genet. 2013;92:584–9. doi: 10.1016/j.ajhg.2013.03.011. [DOI] [PMC free article] [PubMed] [Google Scholar]
- 28.Brady PD, Moerman P, De Catte L, Deprest J, Devriendt K, Vermeesch JR. Exome sequencing identifies a recessive PIGN splice site mutation as a cause of syndromic congenital diaphragmatic hernia. Eur J Med Genet. 2014;57:487–93. doi: 10.1016/j.ejmg.2014.05.001. [DOI] [PubMed] [Google Scholar]
- 29.Couser NL, Masood MM, Strande NT, Foreman AK, Crooks K, Weck KE, Lu M, Wilhelmsen KC, Roche M, Evans JP, Berg JS, Powell CM. The phenotype of multiple congenital anomalies-hypotonia-seizures syndrome 1: report and review. Am J Med Genet A. 2015;167A:2176–81. doi: 10.1002/ajmg.a.37129. [DOI] [PMC free article] [PubMed] [Google Scholar]
- 30.McInerney-Leo AM, Harris JE, Gattas M, Peach EE, Sinnott S, Dudding-Byth T, Rajagopalan S, Barnett CP, Anderson LK, Wheeler L, Brown MA, Leo PJ, Wicking C, et al. Fryns Syndrome Associated with Recessive Mutations in PIGN in two Separate Families. Hum Mutat. 2016;37:695–702. doi: 10.1002/humu.22994. [DOI] [PubMed] [Google Scholar]
- 31.Jezela-Stanek A, Ciara E, Piekutowska-Abramczuk D, Trubicka J, Jurkiewicz E, Rokicki D, Mierzewska H, Spychalska J, Uhrynowska M, Szwarc-Bronikowska M, Buda P, Said AR, Jamroz E, et al. Congenital disorder of glycosylphosphatidylinositol (GPI)-anchor biosynthesis--The phenotype of two patients with novel mutations in the PIGN and PGAP2 genes. Eur J Paediatr Neurol. 2016;20:462–73. doi: 10.1016/j.ejpn.2016.01.007. [DOI] [PubMed] [Google Scholar]
- 32.Imhof I, Canivenc-Gansel E, Meyer U, Conzelmann A. Phosphatidylethanolamine is the donor of the phosphorylethanolamine linked to the alpha1,4-linked mannose of yeast GPI structures. Glycobiology. 2000;10:1271–5. doi: 10.1093/glycob/10.12.1271. [DOI] [PubMed] [Google Scholar]
- 33.Thompson MD, Cole DE. Recessive PIGN Mutations in Fryns Syndrome: Evidence for Genetic Heterogeneity. Hum Mutat. 2016;37:621. doi: 10.1002/humu.23016. [DOI] [PubMed] [Google Scholar]
- 34.Nakagawa T, Taniguchi-Ikeda M, Murakami Y, Nakamura S, Motooka D, Emoto T, Satake W, Nishiyama M, Toyoshima D, Morisada N, Takada S, Tairaku S, Okamoto N, et al. A novel PIGN mutation and prenatal diagnosis of inherited glycosylphosphatidylinositol deficiency. Am J Med Genet A. 2016;170A:183–8. doi: 10.1002/ajmg.a.37397. [DOI] [PubMed] [Google Scholar]
- 35.Heilig CE, Loffler H, Mahlknecht U, Janssen JW, Ho AD, Jauch A, Kramer A. Chromosomal instability correlates with poor outcome in patients with myelodysplastic syndromes irrespectively of the cytogenetic risk group. J Cell Mol Med. 2010;14:895–902. doi: 10.1111/j.1582-4934.2009.00905.x. [DOI] [PMC free article] [PubMed] [Google Scholar]
- 36.Pellagatti A, Cazzola M, Giagounidis AA, Malcovati L, Porta MG, Killick S, Campbell LJ, Wang L, Langford CF, Fidler C, Oscier D, Aul C, Wainscoat JS, et al. Gene expression profiles of CD34+ cells in myelodysplastic syndromes: involvement of interferon-stimulated genes and correlation to FAB subtype and karyotype. Blood. 2006;108:337–45. doi: 10.1182/blood-2005-12-4769. [DOI] [PubMed] [Google Scholar]
- 37.Carter SL, Eklund AC, Kohane IS, Harris LN, Szallasi Z. A signature of chromosomal instability inferred from gene expression profiles predicts clinical outcome in multiple human cancers. Nat Genet. 2006;38:1043–8. doi: 10.1038/ng1861. [DOI] [PubMed] [Google Scholar]
- 38.Trapnell C, Pachter L, Salzberg SL. TopHat: discovering splice junctions with RNA-Seq. Bioinformatics. 2009;25:1105–11. doi: 10.1093/bioinformatics/btp120. [DOI] [PMC free article] [PubMed] [Google Scholar]
- 39.Tohyama K, Tsutani H, Ueda T, Nakamura T, Yoshida Y. Establishment and characterization of a novel myeloid cell line from the bone marrow of a patient with the myelodysplastic syndrome. Br J Haematol. 1994;87:35–42. doi: 10.1111/j.1365-2141.1994.tb04904.x. [DOI] [PubMed] [Google Scholar]
- 40.Turinetto V, Giachino C. Multiple facets of histone variant H2AX: a DNA double-strand-break marker with several biological functions. Nucleic Acids Res. 2015;43:2489–98. doi: 10.1093/nar/gkv061. [DOI] [PMC free article] [PubMed] [Google Scholar]
- 41.Puddu F, Oelschlaegel T, Guerini I, Geisler NJ, Niu H, Herzog M, Salguero I, Ochoa-Montano B, Vire E, Sung P, Adams DJ, Keane TM, Jackson SP. Synthetic viability genomic screening defines Sae2 function in DNA repair. EMBO J. 2015;34:1509–22. doi: 10.15252/embj.201590973. [DOI] [PMC free article] [PubMed] [Google Scholar]
- 42.Musacchio A, Salmon ED. The spindle-assembly checkpoint in space and time. Nat Rev Mol Cell Biol. 2007;8:379–93. doi: 10.1038/nrm2163. [DOI] [PubMed] [Google Scholar]
- 43.Gonorazky H, Liang M, Cummings B, Lek M, Micallef J, Hawkins C, Basran R, Cohn R, Wilson MD, MacArthur D, Marshall CR, Ray PN, Dowling JJ. RNAseq analysis for the diagnosis of muscular dystrophy. Ann Clin Transl Neurol. 2016;3:55–60. doi: 10.1002/acn3.267. [DOI] [PMC free article] [PubMed] [Google Scholar]
- 44.Niblock M, Smith BN, Lee YB, Sardone V, Topp S, Troakes C, Al-Sarraj S, Leblond CS, Dion PA, Rouleau GA, Shaw CE, Gallo JM. Retention of hexanucleotide repeat-containing intron in C9orf72 mRNA: implications for the pathogenesis of ALS/FTD. Acta Neuropathol Commun. 2016;4:18. doi: 10.1186/s40478-016-0289-4. [DOI] [PMC free article] [PubMed] [Google Scholar]
- 45.Parks LL, Turney MK, Detera-Wadleigh S, Kovacs WJ. An ACTH-producing small cell lung cancer expresses aberrant glucocorticoid receptor transcripts from a normal gene. Mol Cell Endocrinol. 1998;142:175–81. doi: 10.1016/s0303-7207(98)00107-5. [DOI] [PubMed] [Google Scholar]
- 46.Ogawa S. Splicing factor mutations in myelodysplasia. Int J Hematol. 2012;96:438–42. doi: 10.1007/s12185-012-1182-y. [DOI] [PubMed] [Google Scholar]
- 47.Stiehl T, Baran N, Ho AD, Marciniak-Czochra A. Clonal selection and therapy resistance in acute leukaemias: mathematical modelling explains different proliferation patterns at diagnosis and relapse. J R Soc Interface. 2014;11:20140079. doi: 10.1098/rsif.2014.0079. [DOI] [PMC free article] [PubMed] [Google Scholar]
- 48.Cogle CR, Bosse RC, Brewer T, Migdady Y, Shirzad R, Kampen KR, Saki N. Acute myeloid leukemia in the vascular niche. Cancer Lett. 2016;380:552–60. doi: 10.1016/j.canlet.2015.05.007. [DOI] [PubMed] [Google Scholar]
- 49.Kandel R, Li SQ, Ozcelik H, Rohan T. p53 protein accumulation and mutations in normal and benign breast tissue. Int J Cancer. 2000;87:73–8. doi: 10.1002/1097-0215(20000701)87:1<73::aid-ijc11>3.0.co;2-u. [DOI] [PubMed] [Google Scholar]
- 50.Wong TN, Ramsingh G, Young AL, Miller CA, Touma W, Welch JS, Lamprecht TL, Shen D, Hundal J, Fulton RS, Heath S, Baty JD, Klco JM, et al. Role of TP53 mutations in the origin and evolution of therapy-related acute myeloid leukaemia. Nature. 2015;518:552–5. doi: 10.1038/nature13968. [DOI] [PMC free article] [PubMed] [Google Scholar]
- 51.Bunz F, Fauth C, Speicher MR, Dutriaux A, Sedivy JM, Kinzler KW, Vogelstein B, Lengauer C. Targeted inactivation of p53 in human cells does not result in aneuploidy. Cancer Res. 2002;62:1129–33. [PubMed] [Google Scholar]
- 52.Hermsen R, Toonen P, Kuijk E, Youssef SA, Kuiper R, van Heesch S, de Bruin A, Cuppen E, Simonis M. Lack of major genome instability in tumors of p53 null rats. PLoS One. 2015;10:e0122066. doi: 10.1371/journal.pone.0122066. [DOI] [PMC free article] [PubMed] [Google Scholar]
- 53.Talwalkar SS, Yin CC, Naeem RC, Hicks MJ, Strong LC, Abruzzo LV. Myelodysplastic syndromes arising in patients with germline TP53 mutation and Li-Fraumeni syndrome. Arch Pathol Lab Med. 2010;134:1010–5. doi: 10.1043/2009-0015-OA.1. [DOI] [PubMed] [Google Scholar]
- 54.Sandes AF, Kerbauy DM, Matarraz S, Chauffaille Mde L, Lopez A, Orfao A, Yamamoto M. Combined flow cytometric assessment of CD45, HLA-DR, CD34, and CD117 expression is a useful approach for reliable quantification of blast cells in myelodysplastic syndromes. Cytometry B Clin Cytom. 2013;84:157–66. doi: 10.1002/cyto.b.21087. [DOI] [PubMed] [Google Scholar]
- 55.Sanjana NE, Shalem O, Zhang F. Improved vectors and genome-wide libraries for CRISPR screening. Nat Methods. 2014;11:783–4. doi: 10.1038/nmeth.3047. [DOI] [PMC free article] [PubMed] [Google Scholar]
- 56.Petitjean A, Mathe E, Kato S, Ishioka C, Tavtigian SV, Hainaut P, Olivier M. Impact of mutant p53 functional properties on TP53 mutation patterns and tumor phenotype: lessons from recent developments in the IARC TP53 database. Hum Mutat. 2007;28:622–9. doi: 10.1002/humu.20495. [DOI] [PubMed] [Google Scholar]
- 57.Ng PC, Henikoff S. Predicting deleterious amino acid substitutions. Genome Res. 2001;11:863–74. doi: 10.1101/gr.176601. [DOI] [PMC free article] [PubMed] [Google Scholar]
Associated Data
This section collects any data citations, data availability statements, or supplementary materials included in this article.


