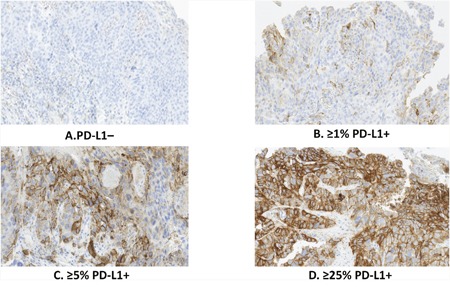
Figure 1. Tumor PD-L1 expressed at different levels in ESCC specimens.

A. PD-L1 negative; B. ≥1% PD-L1-positive tumor cells with membrane staining of any intensity; C. ≥5% PD-L1-positive tumor cells with membrane staining of any intensity; D. ≥25% PD-L1-positive tumor cells with membrane staining of at least 2+ intensity.
