Abstract
Glycosylation is an important post-translational modification of proteins present in the vast majority of human proteins. For this reason, they are potentially new sources of biomarkers and active targets of therapeutics and vaccines. However, the absence of a biosynthetic template as in the genome and the general complexity of the structures have limited the development of methods for comprehensive structural analysis. Even now, the exact structures of many abundant N-glycans in serum are not known. Structural elucidation of oligosaccharides remains difficult and time-consuming. Here, we introduce a means of rapidly identifying released N-glycan structures using their accurate masses and retention times based on a glycan library. This serum glycan library, significantly expanded from a previous one covering glycans released from a handful of serum glycoproteins, has more than 170 complete and partial structures and constructed instead from whole serum. The method employs primarily nanoflow liquid chromatography and accurate mass spectrometry. The method allows us to readily profile N-glycans in biological fluids with deep structural analysis. This approach is used to determine the relative abundances and variations in the N-glycans from several individuals providing detailed variations in the abundances of the important N-glycans in blood.
Graphical abstract
Alterations of glycoconjugates are found to correlate with pathological states, making them new potential targets for therapeutic drugs and as biomarkers for diseases.1–10 The human serum is highly glycosylated.11–14 In general, glycoconjugates are ubiquitous in biological systems and are highly distributed on cell surfaces and in secreted proteins. As a post-translational modification, glycosylation may be more responsive and sensitive to changes in biological states.2–10,15,16 However, the utility of glycoconjugates and the general understanding of their functions are severely limited by the lack of rapid methods for structural analysis. Indeed, the large variety of structures, the microheterogeneity, and the unavailability of a biological template have conspired to severely limit our efforts to translate the glycomic code.17
Glycans on proteins are differentiated into at least two major classes, N-glycan and O-glycan, according to the connecting atom on the protein backbone.18 N-Glycans are significantly more abundant in serum. They are further differentiated into three subtypes depending on their composition as governed by the biosynthetic pathway. They include complex, high-mannose, and hybrid types. N-Glycans are produced with a single-core structure composed of Manα1–6(Manα1–3)-Manβ1–4GlcNAcβ1–4GlcNAc. Additional monosaccharides such as mannose (Man), N-acetylglucosamine (GlcNAc), galactose (Gal), fucose (Fuc), and N-acetylneuraminic acid (NeuAc) are added to elongate the structure.18 Via the addition of different numbers and types of monosaccharides through various linkages, branching and multiple antennae are produced, resulting in large diversity of structures.17 Because the biosynthesis of N-glycans involves the competition of a number of glycosyltransferases, there are no templates as in genomics and proteomics to predict N-glycan structures.18
Even with the ubiquity of N-glycosylation, many of the exact structures of abundant glycans in serum are still unknown. However, these glycans could provide important targets either as diagnostic markers or for pharmaceutical drugs. They also provide important targets for synthesis. Analytical methods for structural characterization of glycans have progressed significantly.19–23 For example, accurate mass readily yields glycan compositions, while tandem MS provides sequence and even linkage information.19 Tandem MS has also been shown to be effective for structural identification of glycans.19,24,25 Profiling the human serum N-glycome is performed mostly on the compositional level.3,26–30
There are methods that can provide a structural profile of glycans. A chromatographic method for profiling 2AB-labeled glycans in serum with structural analyses and isomer differentiation was developed by Rudd and co-workers using HILIC.31,32 The method employs a glycan relational database GlycoBase, which contains 300 partial and complete structures. There are limitations in distinguishing positional isomers of compounds containing more than one sialic acid. Furthermore, because HILIC does not provide extensive isomer separation and detection relies primarily on spectrophotometric techniques, it requires exoglycosidase digestion in every analysis.
N-Glycans and their isomers are readily separated and profiled on a LC chip with a column packed with porous graphitized carbon (PGC).33 In our hands, PGC provides the best isomer separation of glycans compared to any other stationary phase. PGC separates both neutrals and highly sialylated glycans effectively with high retention time repeatability.33 Neutral and sialylated species are separated on the isomer level. Even highly sialylated species are eluted as shown recently by Kronewitter et al. with glycans containing as many as 11 sialic acids.34
In this study, we developed an in-depth glycomic tool for profiling N-glycans with comprehensive structural analysis, including isomer differentiation based on an N-glycan library produced directly from serum. This library resolves most crucial linkages (e.g., linkages of the sialic acids of most of the sialylated N-glycans), thereby allowing the identification of N-glycans on an isomeric level. Currently, the serum N-glycan library contains ~50 complete structures, ~100 partial structures, and 177 entries in total. Moreover, because serum glycans are generally representative of human glycosylation, it can be used for other tissues. The method for glycan identification relies on employing accurate masses and nanoflow liquid chromatography (nanoLC) retention times for the vast majority of the compounds. However, tandem MS can also be used where necessary. The high retention time reproducibility, high mass accuracy of nanoLC-CHIP-Q-TOF, and the excellent repeatability of sample preparation that are well tested ensure the effectiveness of this method.7,15,17,33,35,27
EXPERIMENTAL SECTION
Chemicals and Reagents
Human pooled serum and standard serum proteins, including immunoglobulin A, immunoglobulin M, anti-trypsin, and transferrin, were purchased from Sigma-Aldrich (St. Louis, MO). Nine individual human sera were collected from healthy patients by the UCDavis Medical Center following a protocol approved by the UCDavis Medical Center IRB. Peptide:N-Glycosidase F (PNGase F) and exoglycosidases, including α(2–3) neuraminidase (sialidase), α(1–2,3) mannosidase, α(1–6) mannosidase, and β N-acetylglucosaminidase (GlcNAcase), were purchased from New England Biolabs (Ipswich, MA). β(1–4) galactosidase and α(1–3,4) fucosidase were purchased from Prozyme (Hayward, CA). Sodium borohydride was purchased from Sigma-Aldrich. All reagents were of analytical or HPLC grade.
Sample Preparation
Human serum N-glycans were released, reduced, and purified using a well-established protocol in our laboratory.15 Briefly, N-glycans were enzymatically released by PNGase F from 50 μL of serum in a CEM microwave reactor (CEM Corp., Matthews, NC). They were then purified and enriched by solid phase extraction (SPE) employing a graphitized carbon cartridge (GCC) (Alltech Associated, Deerfield, IL) on an automated Gilson GX-274 ASPEC liquid handler. The released N-glycans were chemically reduced with 1 M NaBH4 in a 65 °C water bath for 1.5 h and desalted by automated SPE-GCC. Reduced N-glycans were eluted in 20% acetonitrile (ACN) in water (v/v) and 0.05% trifluoroacetic acid (TFA) in 40% ACN in water (v/v). The sample was dried down and reconstituted with 50 μL of nanopure water.
Fractionation by HPLC
Human serum N-glycans were fractioned off-line with an Agilent Hewlett-Packard Series 1100 HPLC system using a Hypercarb PGC column (Thermo Scientific) (100 mm × 0.5 mm inside diameter, 5 μm particle size) for exoglycosidase sequencing. N-Glycans were eluted with a binary solvent system comprised of 0.1% formic acid (FA) in 3% ACN in water (v/v) as solvent A and 0.1% FA in 90% ACN in water (v/v) as solvent B, with a flow rate of 0.30 mL/min. Eighty fractions were collected from 20 to 60 min with an interval of 0.5 min over the 70 min gradient. The collected fractions were dried and reconstituted in 10 μL of nanopure water.
Nano-LC-Chip-Q-TOF-MS Analysis
Global N-glycan profiling of human serum was performed using an Agilent nanoLC-Chip-Q-TOF-MS instrument. MS spectra were acquired in the positive mode. The instrument is composed of a microwell plate autosampler, a 1200 series nano-LC system equipped with a capillary sample loading pump and a nanopump, a chip–cube interface, and a model 6520 Q-TOF mass spectrometer. The nano-LC system employs a binary solvent consisting of A [0.1% FA in 3% ACN in water (v/v)] and B [0.1% FA in 90% ACN in water (v/v)]. Human serum N-glycans were enriched and separated on the Agilent HPLC-Chip II comprised of a 40 nL enrichment column and a 75 μm × 43 mm analytical column both packed with PGC at 5 μm particle size. The sample was delivered by the capillary pump to the enrichment column at a flow rate of 4 μL/min and separated on the analytical column by the nanopump at a flow rate of 0.3 μL/min with a gradient that was previously optimized for N-glycans (0% B, 0–2.5 min; 0 to 16% B, 2.5–20 min; 16 to 44% B, 20–30 min; 44 to 100% B, 30–35 min; and 100% B, 35–45 min) followed by pure A for equilibration for 20 min. The instrument was mass-calibrated with internal calibrant ions covering a wide m/z range (622.029, 922.010, 1221.991, 1521.972, 1821.952, 2121.933, and 2421.914) to yield mass accuracies of <5 ppm for MS and <20 ppm for MS/MS. Tandem MS spectra were acquired via collision-induced dissociation (CID).24
In-source fragmentation produces losses of residues that coincide with smaller compounds. This yields an apparent compound that elutes at the same location as the larger parent compound. To determine if an extracted chromatographic peak is due to the in-source fragmentation of a larger compound, the peak is matched to larger co-eluting homologues with nearly identical retention times. For example, an N-glycan losing a fucose, a labile residue, can produce an apparent smaller compound because of in-source fragmentation with peaks that coincide but with differing abundances. Generally, the abundances of the fragments can be as much as 10% of the parent.
Exoglycosidase Digestion
Several exoglycosidases were used to elucidate the complete N-glycan structures using conditions previously described.36 Namely, the reaction buffer was prepared by adding glacial acidic acid to 0.1 M ammonium acetate to reach the desired pH for the specific enzyme. In a typical reaction, 5 μL of buffer, 3 μL of a fractioned N-glycan solution, and 0.5 μL of enzyme were mixed, and the reaction was conducted in a Thermo Precision incubator (Thermo scientific) at 37 °C. The digestion time depends on the activity of the specific enzyme and the amount of N-glycan used. The optimal digestion time for each enzyme was obtained by monitoring the reaction over several time points to ensure the specificity of the exoglycosidase and the completeness of the reaction. The reaction conditions for all of the exoglycosidases used in this study are tabulated in a previous report.36 The oligosaccharides before and after enzyme digestion were monitored by nano-LC-Chip-Q-TOF-MS.
RESULTS AND DISCUSSION
LC retention times and accurate masses are used as distinguishing features to compare unknown compounds against a library, thereby achieving rapid in-depth N-glycan structural identification without time-consuming exoglycosidase digestions. The serum N-glycome library was constructed to facilitate rapid identification. The library incorporated a more limited one created previously from nine commercial glycoproteins corresponding to the most abundant species in serum.37 While that previous effort helped guide the current one, it had severe limitations that are corrected herein. Namely, the commercial glycoproteins contained glycans that are not generally found in serum because of the processes involved in commercial preparation. Many of the serum glycans are not represented in the small number of proteins, and there were technical limitations that were not easily identifiable such as the prevalence of in-source fragmentation in nanoLC MS. This database attempts to correct these limitations by obtaining serum glycans more comprehensively from all serum proteins with no protein enrichment. We further identified in-source fragments as described in the Experimental Section. The resulting library is more comprehensive, focused on serum, with the entries verified as unique compounds.
Extended Comprehensive Library
The overall workflow for the construction of the library is summarized in Figure S1 of the Supporting Information. N-Glycans are first released from serum and reduced to eliminate the the level of interference from anomers. HPLC is performed and the eluent collected into 80 fractions. Each fraction is further analyzed by nanoLC-CHIP-Q-TOF to obtain the number of compounds (including isomers) and their corresponding compositions. The compositions yield putative structures that are used to guide the exoglycosidase reactions. The enzymes are selected on the basis of the putative structures. A number of enzyme reactions are used to determine the structure with the products monitored by nanoLC-CHIP-Q-TOF. HPLC separation can result in the fractionation of isomeric mixtures. To observe the extent of the enzymatic reactions, both the loss of the precursor molecule and the rise of the digestion products are observed. The presence of isomers and other compounds aids in the analysis as not all the isomers will react with the same enzyme, and the relative loss of some isomers is indicative of the reaction. The presence of endogenous compounds corresponding to potential digestion products similarly does not obscure the analysis as the method yields highly reproducible relative abundances. A decrease in the precursor ion corresponds to a proportional increase in the product ion.
N-Glycans before and after the exoglycosidase reactions were monitored by nanoLC-CHIP-Q-TOF. Figure 1 provides one example demonstrating the procedure for exoglycosidase sequencing. The specificity of the enzymes was determined extensively in previous studies.38–40 Figure 1a shows the ECC of the major N-glycan, a monosialylated diantennary species (putative structure and MS inset), obtained in a single fraction using offline HPLC of whole human serum. After digestion with an α(2–3) neuraminidase for 1 h, the magnitude of the peak for this compound diminished completely and a new peak corresponding to a loss of one sialic acid appeared as shown in Figure 1b, thereby confirming the linkage of the terminal sialic acid as α(2–3) (structure and MS inset). To confirm further the position of the terminal sialic acid, a cocktail of enzymes consisting of a β(1–4) galactosidase, β N-acetylglucosaminidase, and α(1–2,3) mannosidase was used over a 24 h reaction time. Because the exoglycosidases cleave off only the terminal monosaccharide from the nonreducing end, the branch with a sialic acid as the protecting cap will remain while the branch with the Gal exposed will be digested away. If the sialic acid is on the 1–6 arm (two arms differentiated by the linkage of the two branching mannoses), one Gal, one GlcNac, and one Man will be cleaved off. Conversely, if the sialic acid is on the 1–3 arm, only one Gal and one GlcNac will be cleaved off while the α(1–6)Man will remain intact even in the presence of α(1–2,3) mannosidase. Figure 1c shows the ECC of the enzyme digestion product with the mass spectrum (inset) exhibiting the loss of one Gal, one GlcNac, and one Man, meaning the terminal sialic acid is on the 1–6 antenna.
Figure 1.
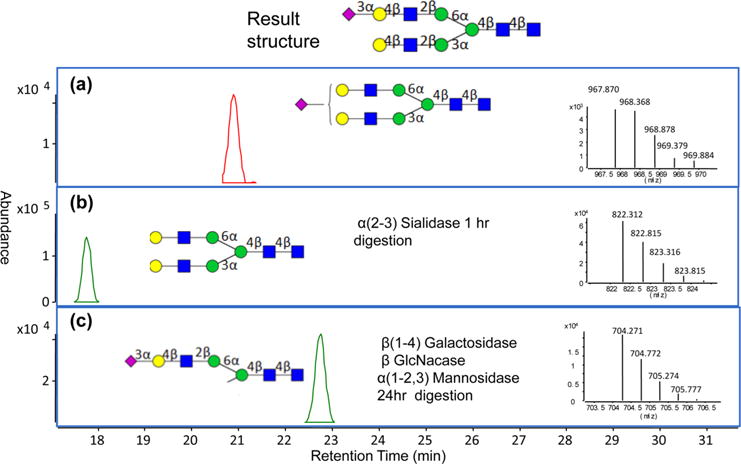
Extracted compound chromatograms (ECCs) of a monosialylated diantennary species (putative structure inset) before and after exoglycosidase digestion yield the linkage and position of the sialic acid. (a) Chromatogram of N5401 from an HPLC fraction before enzyme digestion. The neutral mass of 1933.71 Da was used to produce the ECC. (b) Chromatogram of the N-glycan after digestion with α(2–3) sialidase for 1 h at 37 °C. The neutral mass of 1642.61 Da is used to produce the ECC. (c) Chromatogram of the N-glycan residue after digestion for 24 h with a cocktail of exoglycosidases, including β (1–4) galactosidase, β N-acetylglucosaminidase, and α(1–2,3) mannosidase, at 37 °C of this fraction. The neutral mass of 1406.53 Da is used to produce the ECC.
Tandem MS spectra were used to further distinguish isomers and to add an additional level of validation for the structures.19,24,41 Figure 2 shows the tandem MS spectra of four isomers corresponding to the most abundant composition in serum, namely the biantennary disialylated species. The composition yields four isomers: N5402a, N5402b, N5402c, and N5402d. The structures are given a systematic name such as N5402a for N-glycan (N) with Hex5:HexNAc4:Fuc0:NeuAc2. The lowercase letter corresponds to the isomer designation in order of abundance, with “a” being the most abundant in serum. The most abundant isomer N5402a is the structure with both sialic acid being linked in an α(2–3) manner. Compound N5402c is the one with both sialic acids linked in α(2–6) and has a significantly lower abundance. Compounds N5402b and N5402d are mixed linkages with one sialic acid being α(2–3) and the other α(2–6). These structures were confirmed by α(2–3) neuraminidase digestion of the isomeric mixtures. Tandem MS spectra further confirmed the differences between isomers producing unique fragmentation. The four spectra corresponding to the isomers (Figure 2) produce the same sialic acid peaks, 273.09 Da (neutral mass) and 291.09 Da corresponding to NeuAc-H2O and NeuAc, respectively, but with significantly differing intensities. Each isomer apparently has its own favored fragmentation pathway. For example, N5402c (Figure 2c) dissociates from the reducing end, losing the core GlcNac. Conversely, the other three isomers first lose sialic acid from the nonreducing end. Isomer N5402c is the only one that does not have an α(2–3) sialic acid. The other isomers contain at least one α(2–3) sialic acid, suggesting that the α(2–3) linkage is more labile than the α(2–6) linkage. This observation is difficult to confirm because of the lack of standards, but it may be a useful indicator of this specific structural feature. The CID of N5402d also appears to induce a sialic acid migration producing a loss of an internal Gal residue. There is precedence for the migration of monosaccharides in the tandem MS of native N-glycans.42 The biantennary disialylated compounds illustrate a limitation of this method. We were able to determine the linkages on the more abundant mixed-linked species (N5402b) by tandem MS and enzymatic digestion; however, we could not isolate sufficient amounts of N5402d for a similar analysis. Instead, the structure was assigned by deduction and elimination of the three more abundant species.
Figure 2.
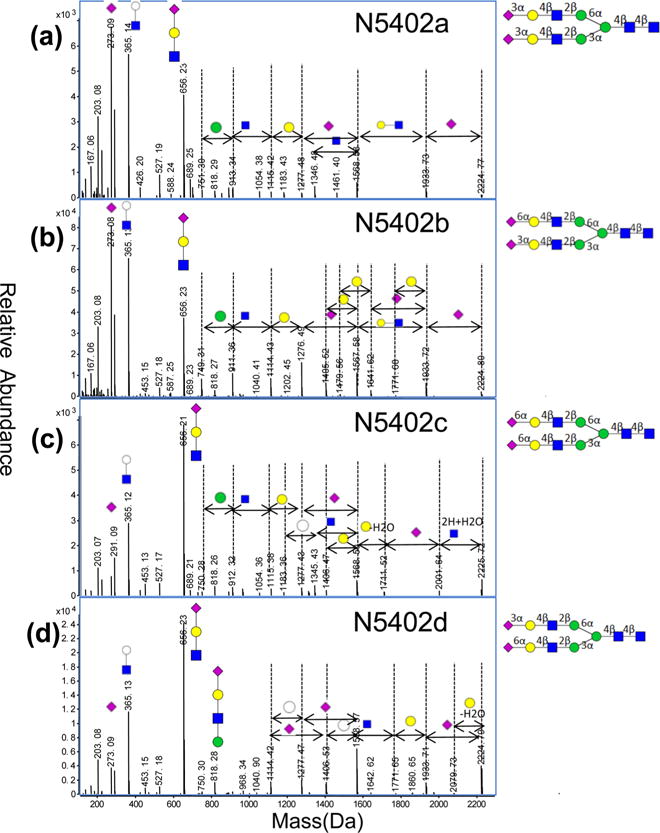
Tandem mass spectra of the four isomers of N5402 (symbolic structures inset and the complete structures as elucidated by exoglycosidases).
Table S1 of the Supporting Information summarizes the comprehensive library containing more than 170 distinct compounds with more than 50 complete structures and 100 partially elucidated structures. Linkages and positions of terminal sialic acids of most sialylated species are resolved. The compounds containing only partial structures could not be fully elucidated because of their low abundances or the lack of availability of specific enzymes. For example, entries 14, 21, 60, and 97 are four isomers of the triantennary disialylated N-glycans observed in serum with distinct retention times. Linkages of the sialic acids 14 and 21 are resolved; however, the positions cannot be resolved because of the lack of efficient and commercial β(1–4) and β(1–6) N-acetylglucosaminidases. Linkages of sialic acids of isomers 60 and 97 are not resolved because of their extremely low abundances. Furthermore, although isomers 14 and 21 have sialic acids that cannot be localized, the two compounds are distinct and can be defined by their retention times. N-Glycans in this library are sorted approximately in decreasing order of relative abundances in serum. A more systematic study of the abundances is discussed below. Systematic names, LC retention times, accurate neutral masses of reduced form, symbolic structures with annotated linkages, and relative abundances normalized to the total N-glycan abundance are provided in Table S1 of the Supporting Information.
Application of the Profiling Method for Structural Analysis of Glycans from Commercial Glycoproteins
To validate the method for profiling with instantaneous structural identification, we examined N-glycans released from several commercial human serum glycoproteins, including immunoglobulin A (IgA), immunoglobulin M (IgM), anti-trypsin, and transferrin. The glycans were released from the glycoprotein and identified by matching retention times and accurate masses to the library. The predicted structures were then validated by exoglycosidase sequencing. Figure S2 of the Supporting Information shows a glycan from immunoglobulin A. The ECC (MS inset) of N5411a shows the compound before digestion and the structure identified by matching with the library (Figure S2a of the Supporting Information). After reaction with an α(2–3) neuraminidase for 1 h, the magnitude of the original peak diminished and a new peak corresponding to N5410 emerged (Figure S2b of the Supporting Information), confirming that the sialic acid linkage is α(2–3). The ECC of the product with a loss of one GlcNac and one Gal after treatment with β(1–4) galactosidase, β N-acetylglucosaminidase, and α(1–2/3) mannosidase over a 24 h reaction time provides the location of the sialic acid as being on a 1–3 antenna (Figure S2c of the Supporting Information). The result is indeed consistent with the library assignment. This method was used to test approximately 20 randomly selected, relatively abundant structures from the proteins mentioned above. All of the assignments were correctly predicted as confirmed by enzymatic digestion.
Application of the Rapid Identification Method to Nine Individual Sera
N-Glycans in individual sera were identified by matching the LC retention times and accurate masses from the library to profile and rapidly identifying structures. Mass accuracy is consistent with small drifts over several runs because they are optimized with known standards as part of the procedure for their operation. For separation, there is no internal optimization to provide identical retention times. Furthermore, there are no well-characterized mixtures of standard oligosaccharides. Nonetheless, the retention times are suitably reproducible over a period of 2–3 days. Variations in retention times over delayed periods of several days and months were corrected by using the glycans in commercial serum as the standard oligosaccharide mixture as described below.
The N-glycans released from serum are highly reproducible in composition and relative abundance. We have previously shown that there are generally small variations in the abundances of the major components of N-glycans over hundreds of samples.33,43 Indeed, serum N-glycans are so reproducible that they make a suitable standard mixture. In this method, we use serum glycans to align chromatograms, allowing this method to be potentially transportable to other instruments and other laboratories.
Alignment of the chromatogram is performed systematically and stepwise using groups of isomers. We first extract the chromatogram of a specific mass, for example, that corresponding to composition N5402 shown in Figure 3a. The extracted chromatogram (for 2224.80 Da – reduced) shows four isomers with a distinctive abundance pattern. Figure 3b is the chromatogram from a commercial serum sample. Figure 3c is from a single individual. On the basis of this comparison, it is relatively simple to identify each component and assign the structure with the peak. Using nanoLC/MS in this way, we can comprehensively assign the N-glycans associated with serum.
Figure 3.
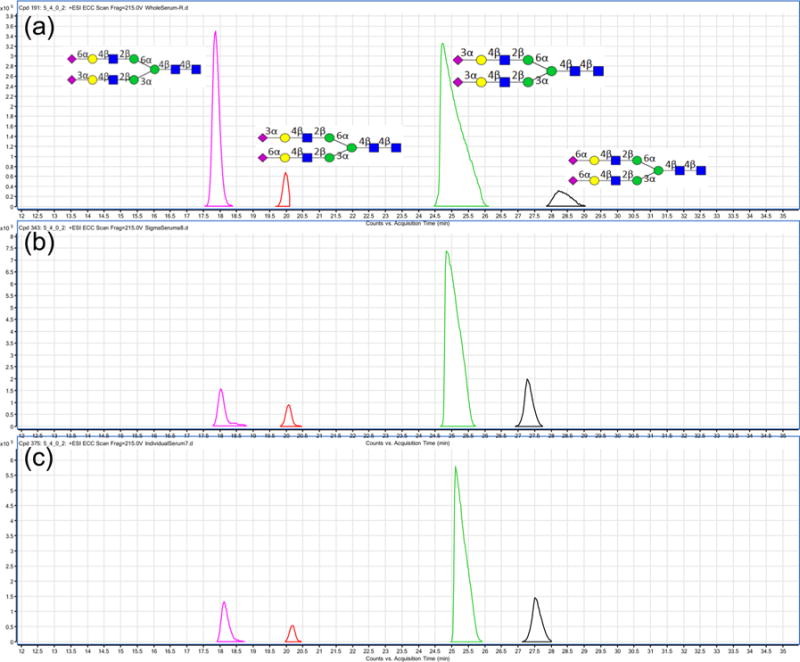
(a) ECC of mass 2224.80 Da from the library. (b) ECC of mass 2224.80 Da from the commercial serum N-glycans run together with study samples. (c) ECC of mass 2224.80 Da from an individual serum of the study sample.
The reproducibility of the technical replicates and the overall procedure was examined by comparing retention times and abundances (Figure S3 of the Supporting Information). There is high reproducibility in the total ion chromatogram as shown for both multiple injections (five) and multiple sample preparations (five). The compound extraction chromatogram in Figure S4 of the Supporting Information shows the excellent overlap for five injections of the disialylated, biantennary structure.
Shown in Figure 4 is a comprehensively annotated chromatogram using the top 100 N-glycans. The numbers correspond to the entries with structures provided in Table S1 of the Supporting Information. The profiling method was employed to determine the variations in the released N-glycans from nine individual sera. The variations in terms of glycan types are illustrated for nine individuals in Figure 5, with the abundances of the total N-glycan, sialylated (C/H-S), fucosylated (C/H-F), high-mannose (HM), and nonfucosylated nonsialylated hybrid and complex species (C/H). Coefficients of variation (CV) were determined for each category (13.2, 15.5, 14.4, 11.4, and 14.0%, respectively), indicating the biological diversity between individuals.
Figure 4.
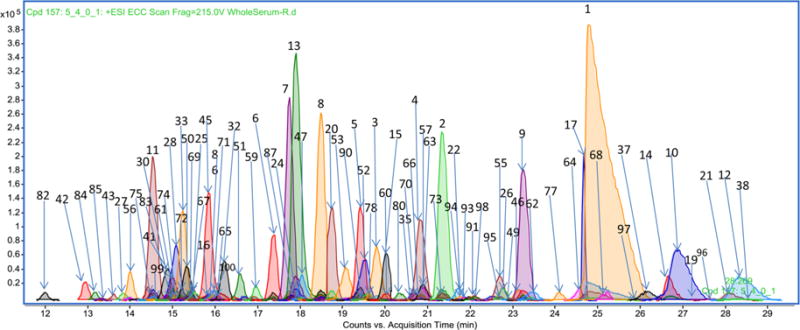
Total compound chromatogram of the reference library with peaks annotated for structures. Listed are the 100 most abundant components. Less abundant components are not labeled for the sake of clarity. The annotation numbers correspond to structures provided in Table S1 of the Supporting Information.
Figure 5.
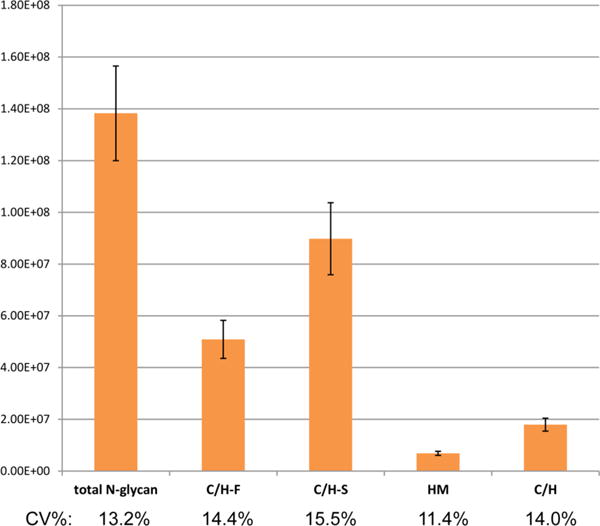
Variations in relative abundances of the N-glycan subclasses for the nine individual human serum samples.
To illustrate the biological variations in abundances between individuals, the 10 most abundant N-glycans in serum were selected and identified (Figure S5 of the Supporting Information) using direct ion abundances. While there are accepted differences in ionization and detection efficiencies, these effects are generally minimized when the compounds are separated as they are in liquid chromatography.44 The structures correspond to N5402a, N5401a, N5511a, N5401b, N5410a, N5400a, N3410a, N4410a, N5411a, and N5412a. Included in the figure are the potential protein sources for each glycan based on the earlier study.37 The most abundant glycoprotein in serum corresponds to IgG. However, while the glycans from IgG are among the top 10 structures, the most abundant N-glycan, N5402a, is from several other proteins, including α-2-macroglobulin, transferrin, and anti-trypsin.37
As expected, the CV in the individual structures is greater than those for the entire glycan types. The CV for each structure is an indication of the biological diversity. The structure with the highest CV corresponds to N3410a (31.5%). For comparison, the method replicate yields a CV of 2.8% (Figure S6 of the Supporting Information). Compound N3410a is the most abundant glycan in IgG and plays an important role in the effector function of the antibody.36 The second highest CV is that of N4410a, which is also derived from IgG. Conversely, the least fluctuating N-glycan is the structure with N5400a with a CV of 8.7%. These results suggest that the greatest variation in glycosylation is perhaps related to IgG glycosylation.
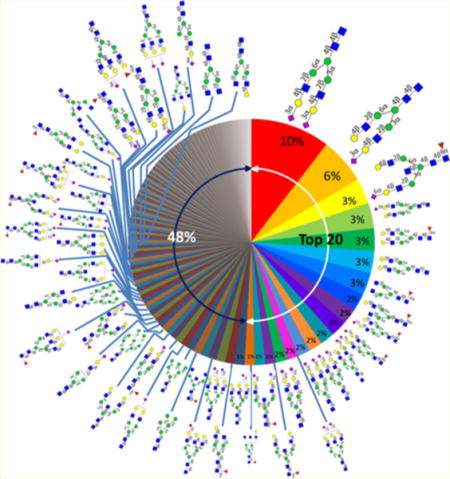
Figure 6 shows the N-glycome of human serum based on nine individual sera with the relative abundances averaged for the nine individuals. This “glycan wheel” illustrates the diversity of the human serum N-glycome. Where possible, the complete structures are provided along with the respective abundances. The chart shows that the N-glycome is much more diverse than the human plasma proteome, where a small number of proteins account for the vast majority of the abundances. The most abundant N-glycan accounts for 10% of the total N-glycan abundances. It has long been known that the most abundant composition in serum corresponds to the disialylated biantennary species. We can now assign this structure as being N5402a, the disialylated compound with both sialic acids linked via α(2,3). The second most abundant structure (N5401a) accounts for ~6%, the third to the seventh accounting for 3% individually, the eighth to the 15th accounting for 2% individually, and each of the rest accounting for only ≤1%. The top 20 N-glycans account for 52% of the total N-glycome in human serum. The remaining 48% consists of more than 100 (and perhaps many more) structures.
Figure 6.
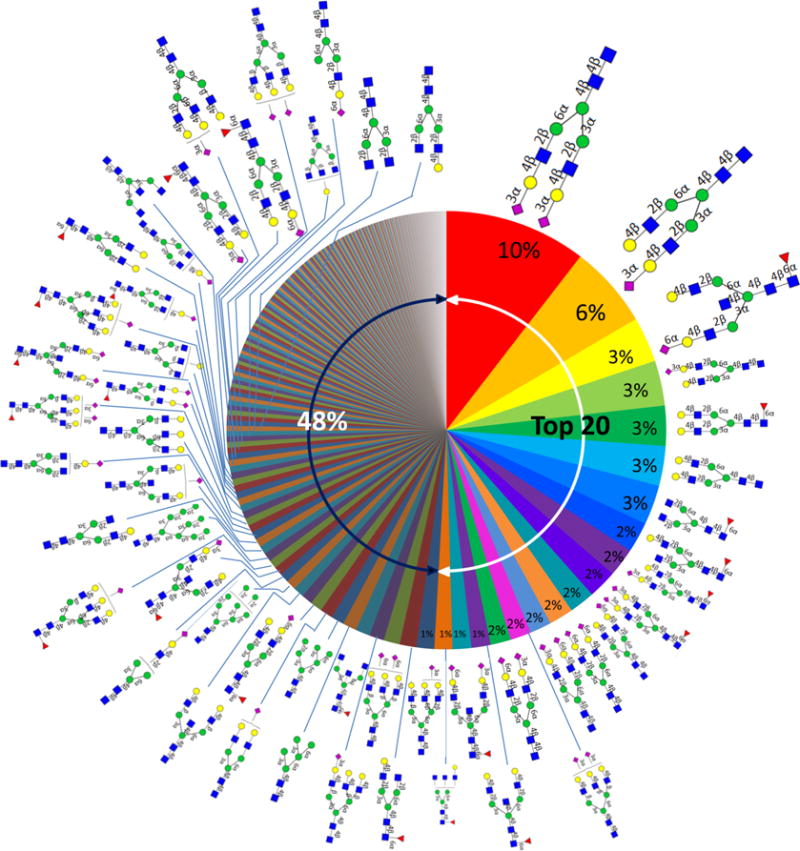
Human serum “glycan wheel” based on the relative abundances averaged for the nine individual sera.
CONCLUSION
The identification of N-glycan structures based on a functional library of serum glycans is used to profile structures in biological samples with deep structural analysis. This method provides a way forward for rapid throughput glycomics. To use this library, accurate masses and LC retention times are the most critical parameters to match between study samples and the library. The commercial serum N-glycan pool was used as the standard to correct the retention times relative to the library when needed.
The N-glycan variation in serum was monitored among nine individuals from the most abundant to the least, representing more than 4 orders of magnitude and corresponding to more than 170 structures. Interestingly, the most abundant N-glycan is not from the most abundant glycoprotein, IgG, but originated from several glycoproteins. Furthermore, the abundances are distributed throughout many structures that vary slightly between different individuals. An annotated global serum N-glycome will allow us to visualize the complexity and diversity of N-glycans, providing useful targets for future biomarker and therapeutic studies.
Supplementary Material
Acknowledgments
Funding provided by National Institutes of Health Grant R01GM049077 is gratefully acknowledged.
Footnotes
Supporting Information
Supplementary figures as noted in the text. The Supporting Information is available free of charge on the ACS Publications website at DOI: 10.1021/acs.analchem.5b01340.
Notes
The authors declare no competing financial interest.
References
- 1.Lin SQ, Kemmner W, Grigull S, Schlag PM. Exp Cell Res. 2002;276:101–110. doi: 10.1006/excr.2002.5521. [DOI] [PubMed] [Google Scholar]
- 2.An HJ, Kronewitter SR, de Leoz MLL, Lebrilla CB. Curr Opin Chem Biol. 2009;13:601–607. doi: 10.1016/j.cbpa.2009.08.015. [DOI] [PMC free article] [PubMed] [Google Scholar]
- 3.An HJ, Miyamoto S, Lancaster KS, Kirmiz C, Li BS, Lam KS, Leiserowitz GS, Lebrilla CB. J Proteome Res. 2006;5:1626–1635. doi: 10.1021/pr060010k. [DOI] [PubMed] [Google Scholar]
- 4.de Leoz MLL, An HJ, Kronewitter S, Kim J, Beecroft S, Vinall R, Miyamoto S, White RD, Lam KS, Lebrilla C. Dis Markers. 2008;25:243–258. doi: 10.1155/2008/515318. [DOI] [PMC free article] [PubMed] [Google Scholar]
- 5.de Leoz MLA, Young LJT, An HJ, Kronewitter SR, Kim JH, Miyamoto S, Borowsky AD, Chew HK, Lebrilla CB. Mol Cell Proteomics. 2011;10 doi: 10.1074/mcp.M110.002717. M110.002717. [DOI] [PMC free article] [PubMed] [Google Scholar]
- 6.Hua S, An HJ, Ozcan S, Ro GS, Soares S, DeVere-White R, Lebrilla CB. Analyst. 2011;136:3663–3671. doi: 10.1039/c1an15093f. [DOI] [PMC free article] [PubMed] [Google Scholar]
- 7.Kirmiz C, Li BS, An HJ, Clowers BH, Chew HK, Lam KS, Ferrige A, Alecio R, Borowsky AD, Sulaimon S, Lebrilla CB, Miyamoto S. Mol Cell Proteomics. 2007;6:43–55. doi: 10.1074/mcp.M600171-MCP200. [DOI] [PubMed] [Google Scholar]
- 8.Lebrilla CB, An H. J Mol BioSyst. 2009;5:17–20. doi: 10.1039/b811781k. [DOI] [PubMed] [Google Scholar]
- 9.Leiserowitz GS, Lebrilla C, Miyamoto S, An HJ, Duong H, Kirmiz C, Ll B, Liu H, Lam KS. International Journal of Gynecological Cancer. 2008;18:470–475. doi: 10.1111/j.1525-1438.2007.01028.x. [DOI] [PMC free article] [PubMed] [Google Scholar]
- 10.Packer NH, von der Lieth CW, Aoki-Kinoshita KF, Lebrilla CB, Paulson JC, Raman R, Rudd P, Sasisekharan R, Taniguchi N, York WS. Proteomics. 2008;8:8–20. doi: 10.1002/pmic.200700917. [DOI] [PubMed] [Google Scholar]
- 11.Alavi A, Axford JS. Rheumatology. 2008;47:760–770. doi: 10.1093/rheumatology/ken081. [DOI] [PubMed] [Google Scholar]
- 12.Dube DH, Bertozzi CR. Nat Rev Drug Discovery. 2005;4:477–488. doi: 10.1038/nrd1751. [DOI] [PubMed] [Google Scholar]
- 13.Robinson LN, Artpradit C, Raman R, Shriver ZH, Ruchirawat M, Sasisekharan R. Electrophoresis. 2012;33:797–814. doi: 10.1002/elps.201100231. [DOI] [PMC free article] [PubMed] [Google Scholar]
- 14.Varki A. Trends Mol Med. 2008;14:351–360. doi: 10.1016/j.molmed.2008.06.002. [DOI] [PMC free article] [PubMed] [Google Scholar]
- 15.Hua S, Lebrilla C, An HJ. Bioanalysis. 2011;3:2573–2585. doi: 10.4155/bio.11.263. [DOI] [PubMed] [Google Scholar]
- 16.Taniguchi N, Paulson JC. Proteomics. 2007;7:1360–1363. doi: 10.1002/pmic.200700123. [DOI] [PubMed] [Google Scholar]
- 17.Kronewitter SR, An HJ, de Leoz ML, Lebrilla CB, Miyamoto S, Leiserowitz GS. Proteomics. 2009;9:2986–2994. doi: 10.1002/pmic.200800760. [DOI] [PMC free article] [PubMed] [Google Scholar]
- 18.Brooks SA, Dwek MV, Schumacher U. Functional and molecular glycobiology. Springer-Verlag; Oxford, U.K.: 2002. p. xvi.p. 354. [Google Scholar]
- 19.An HJ, Lebrilla CB. Mass Spectrom Rev. 2011;30:560–578. doi: 10.1002/mas.20283. [DOI] [PubMed] [Google Scholar]
- 20.Gupta G, Surolia A, Sampathkumar SG. Omics. 2010;14:419–436. doi: 10.1089/omi.2009.0150. [DOI] [PubMed] [Google Scholar]
- 21.Takegawa Y, Deguchi K, Nakagawa H, Nishimura SI. Anal Chem. 2005;77:6062–6068. doi: 10.1021/ac050843e. [DOI] [PubMed] [Google Scholar]
- 22.Singh S, Reinhold V. Glycobiology. 2003;13:848. [Google Scholar]
- 23.Zhang HL, Singh S, Reinhold V. Glycobiology. 2004;14:1192. [Google Scholar]
- 24.Wu S, Salcedo J, Tang N, Waddell K, Grimm R, German JB, Lebrilla CB. Anal Chem. 2012;84:7456–7462. doi: 10.1021/ac301398h. [DOI] [PMC free article] [PubMed] [Google Scholar]
- 25.Mechref Y, Kang P, Novotny MV. Rapid Commun Mass Spectrom. 2006;20:1381–1389. doi: 10.1002/rcm.2445. [DOI] [PMC free article] [PubMed] [Google Scholar]
- 26.Chu CS, Ninonuevo MR, Clowers BH, Perkins PD, An HJ, Yin H, Killeen K, Miyamoto S, Grimm R, Lebrilla CB. Proteomics. 2009;9:1939–1951. doi: 10.1002/pmic.200800249. [DOI] [PMC free article] [PubMed] [Google Scholar]
- 27.Kronewitter SR, de Leoz MLL, Peacock KS, McBride KR, An HJ, Miyamoto S, Leiserowitz GS, Lebrilla CB. J Proteome Res. 2010;9:4952–4959. doi: 10.1021/pr100202a. [DOI] [PMC free article] [PubMed] [Google Scholar]
- 28.Vanhooren V, Dewaele S, Libert C, Engelborghs S, De Deyn PP, Toussaint O, Debacq-Chainiaux F, Poulain M, Glupczynski Y, Franceschi C, Jaspers K, van der Pluijm I, Hoeijmakers J, Chen CC. Exp Gerontol. 2010;45:738–743. doi: 10.1016/j.exger.2010.08.009. [DOI] [PubMed] [Google Scholar]
- 29.Callewaert N, Contreras R, Mitnik-Gankin L, Carey L, Matsudaira P, Ehrlich D. Electrophoresis. 2004;25:3128–3131. doi: 10.1002/elps.200406020. [DOI] [PubMed] [Google Scholar]
- 30.Leymarie N, Griffin PJ, Jonscher K, Kolarich D, Orlando R, McComb M, Zaia J, Aguilan J, Alley WR, Altmann F, Ball LE, Basumallick L, Bazemore-Walker CR, Behnken H, Blank MA, Brown KJ, Bunz SC, Cairo CW, Cipollo JF, Daneshfar R, Desaire H, Drake RR, Go EP, Goldman R, Gruber C, Halim A, Hathout Y, Hensbergen PJ, Horn DM, Hurum D, Jabs W, Larson G, Ly M, Mann BF, Marx K, Mechref Y, Meyer B, Moginger U, Neusubeta C, Nilsson J, Novotny MV, Nyalwidhe JO, Packer NH, Pompach P, Reiz B, Resemann A, Rohrer JS, Ruthenbeck A, Sanda M, Schulz JM, Schweiger-Hufnagel U, Sihlbom C, Song E, Staples GO, Suckau D, Tang H, Thaysen-Andersen M, Viner RI, An Y, Valmu L, Wada Y, Watson M, Windwarder M, Whittal R, Wuhrer M, Zhu Y, Zou C. Mol Cell Proteomics. 2013;12:2935–2951. doi: 10.1074/mcp.M113.030643. [DOI] [PMC free article] [PubMed] [Google Scholar]
- 31.Saldova R, Asadi Shehni A, Haakensen VD, Steinfeld I, Hilliard M, Kifer I, Helland A, Yakhini Z, Borresen-Dale AL, Rudd PM. J Proteome Res. 2014;13:2314–2327. doi: 10.1021/pr401092y. [DOI] [PubMed] [Google Scholar]
- 32.Campbell MP, Royle L, Radcliffe CM, Dwek RA, Rudd PM. Bioinformatics. 2008;24:1214–1216. doi: 10.1093/bioinformatics/btn090. [DOI] [PubMed] [Google Scholar]
- 33.Ruhaak LR, Taylor SL, Miyamoto S, Kelly K, Leiserowitz GS, Gandara D, Lebrilla CB, Kim K. Anal Bioanal Chem. 2013;405:4953–4958. doi: 10.1007/s00216-013-6908-z. [DOI] [PMC free article] [PubMed] [Google Scholar]
- 34.Kronewitter SR, Marginean I, Cox JT, Zhao R, Hagler CD, Shukla AK, Carlson TS, Adkins JN, Camp DG, II, Moore RJ, Rodland KD, Smith RD. Anal Chem. 2014;86:8700–8710. doi: 10.1021/ac501839b. [DOI] [PMC free article] [PubMed] [Google Scholar]
- 35.Chu CS, Ninonuevo MR, Clowers BH, Perkins PD, An HJ, Yin HF, Killeen K, Miyamoto S, Grimm R, Lebrilla CB. Proteomics. 2009;9:1939–1951. doi: 10.1002/pmic.200800249. [DOI] [PMC free article] [PubMed] [Google Scholar]
- 36.Song T, Ozcan S, Becker A, Lebrilla CB. Anal Chem. 2014;86:5661–5666. doi: 10.1021/ac501102t. [DOI] [PMC free article] [PubMed] [Google Scholar]
- 37.Aldredge D, An HJ, Tang N, Waddell K, Lebrilla CB. J Proteome Res. 2012;11:1958–1968. doi: 10.1021/pr2011439. [DOI] [PMC free article] [PubMed] [Google Scholar]
- 38.Zhang JH, Lindsay LL, Hedrick JL, Lebrilla CB. Anal Chem. 2004;76:5990–6001. doi: 10.1021/ac049666s. [DOI] [PubMed] [Google Scholar]
- 39.Wu SA, Grimm R, German JB, Lebrilla CB. J Proteome Res. 2011;10:856–868. doi: 10.1021/pr101006u. [DOI] [PMC free article] [PubMed] [Google Scholar]
- 40.Wu SA, Tao NN, German JB, Grimm R, Lebrilla CB. J Proteome Res. 2010;9:4138–4151. doi: 10.1021/pr100362f. [DOI] [PMC free article] [PubMed] [Google Scholar]
- 41.Penn SG, Cancilla MT, Lebrilla CB. Anal Chem. 1996;68:2331–2339. doi: 10.1021/ac960155i. [DOI] [PubMed] [Google Scholar]
- 42.Franz AH, Lebrilla CB. J Am Soc Mass Spectrom. 2002;13:325–337. doi: 10.1016/S1044-0305(02)00343-4. [DOI] [PubMed] [Google Scholar]
- 43.Kronewitter SR, de Leoz ML, Peacock KS, McBride KR, An HJ, Miyamoto S, Leiserowitz GS, Lebrilla CB. J Proteome Res. 2010;9:4952–4959. doi: 10.1021/pr100202a. [DOI] [PMC free article] [PubMed] [Google Scholar]
- 44.Lebrilla CB, An HJ. Mol BioSyst. 2009;5:17–20. doi: 10.1039/b811781k. [DOI] [PubMed] [Google Scholar]
Associated Data
This section collects any data citations, data availability statements, or supplementary materials included in this article.


