

Abstract
Brain tumor biopsies that are routinely performed in clinical settings significantly aid in diagnosis and staging. The aim of this study is to develop and evaluate a methodological image-guided approach that would allow for routine sampling of glioma tissue from orthotopic mouse brain tumor models. A magnetic resonance imaging-guided biopsy method is presented to allow for spatially precise stereotaxic sampling of a murine glioma coupled with genome-scale technology to provide unbiased characterization of intra- and intertumoral clonal heterogeneity. Longitudinal and multiregional sampling of intracranial tumors allows for successful collection of tumor biopsy samples, thus allowing for a pathway-enrichment analysis and a transcriptional profiling of RNA sequencing data. Spatiotemporal gene expression pattern variations revealing genomic heterogeneity were found.
Keywords: MRI-guided biopsy, murine studies, genomic analysis, glioma
Introduction
Glioblastoma (GBM) is the most common and aggressive intracranial tumor in adults. Despite decades of research, survival remains dismal, with a mean survival time of 15 months and a mean 5-year survival rate of <10% (1–3). The standard therapy consists of maximal safe surgical resection, followed by radiation and then chemotherapy with temozolomide, and this protocol has changed very little since its inception (2). Although many patients initially respond, GBM inevitably recurs in most patients (1).
Given its poor prognosis, GBM is a perfect candidate for targeted therapy using precision medicine; thus, understanding the genetic profile of GBM is vital. However, known spatial and temporal tumor heterogeneity is recognized as a significant obstacle for accurate diagnosis impeding the use of targeted therapies. GBM is among the first tumor types for which in-depth genomic analyses were performed (4), and integrated genomic analyses performed in a large cohort of patients uncovered complex clonal heterogeneity (4), intertumoral heterogeneity (5–10), and intratumoral heterogeneity (11–14). Recent studies have revealed that customized treatments targeting specific mutations may not be efficacious in altering patient outcomes (15). Although in this case the cause of treatment failure is unclear, previous studies have shown that between 67% and 91% of posttreatment failures no longer harbored the target mutation (16, 17). This is probably because of clonal expansion of cells outside the targeted mutation. GBM is also known to change its molecular signature with treatment (18). These findings reflect the highly dynamic genetic evolution present in GBM, confounding the elucidation of its complete genetic landscape.
Multiregional tumor sampling is ideal in GBM and other tumor types, but it is often impractical and potentially risky for routine clinical application (19, 20). Furthermore, tumor sampling during different treatment phases is often clinically unindicated. However, precise mechanisms underlying tumor heterogeneity and its functional significance can be evaluated in preclinical models for discovery of driver mutations, discovery of mechanisms of drug resistance, identification of genetic and imaging biomarkers, and development of clone-specific cancer therapies.
Here, we devised and successfully showed a magnetic resonance imaging (MRI)-guided stereotactic biopsy method for isolation and functional profiling of tumoral heterogeneity to assess temporal and geographical genomic variations during disease progression in an intact murine GBM model. Longitudinal tumor biopsy samples were obtained at different stages of tumor growth and in spatially distinct locations. RNA sequencing (RNA-Seq) of biopsy tissue showed unique temporal and spatial gene expression patterns.
Methods
Mouse Strains
The p53 mutant GBM mouse model was obtained from Dr. Yuan Zhu Children's National Medical Center (Washington DC). The genotype and maintenance of the strain have been described previously (21). Animal experiments were approved by the University Committee on the “Use and Care of Animals” (UCUCA) at the University of Michigan.
MRI Acquisition
Mice were anesthetized using a 1%–2% isofluorane–air mixture throughout the duration of the MRI experiment. Then, 5 minutes before anesthesia administration, 50 μL of 0.5M gadolinium (Gd)–diethylenetriaminepentaacetic acid (DTPA) (Magnevist; Bayer Healthcare Pharmaceuticals) was injected intraperitoneally. Once anesthetized, mice were securely fastened in the animal handling MRI cradle with a bite bar and stererotactic bilateral ear bars. An external fiducial marker consisting of Gd contrast agent was secured to the coil ∼1 cm left of the mouse skull. MRI scanning was performed using a 7 T Direct Drive MR system (Agilent, CA) using a volume radiofrequency transmit coil and a 2-channel fixed-tuned actively decoupled surface receive coil with the mouse handling cradle including bilateral ear bars and a bite bar for securing the mouse head (Rapid MR International). During MRI, heated air was introduced into the magnet bore (World Precision Instruments) to maintain animal body temperature. T1-weighted spin echo images were acquired for each animal using a spin echo sequence with the following parameters: repetition time/echo time = 510/15 milliseconds, field of view = 20 × 20 mm2, matrix size = 128 × 128, slice thickness = 500 μm, number of slices = 25 interleaved sections, and 2 signal averages per phase encode step.
MRI Biopsy Validation Study
Phantoms were constructed using agarose gel blocks. Bubbles with varying volumes of air (5, 10, and 20 μL) were injected into the gel before it solidified using a Hamilton syringe. The MRI radiofrequency coil bed with an associated fiducial marker was modified to allow for secure attachment to a Kopf stereotactic device to provide for a consistent and reproducible coordinate system. MRI-guided biopsy was performed on the gel blocks as described below to validate targeting accuracy. Instead of extracting “tissue” (eg, gel), we injected a 1:10 dilution of 0.5M Gd–DTPA (Magnevist) into the agarose gel at the calculated location of the intended target volume (eg, air bubble). If the air bubble was successfully filled with the contrast agent, the air would be displaced and a bright signal in the T1 magnetic resonance (MR) image would be used to verify success versus failure. Gel-based target biopsies were performed on 15, 12, and 12 bubbles with 5-, 10-, and 20-μL volumes, respectively. The accuracy of the method was determined as follows: [(success)/(total number of target volumes)] × 100%. Success was determined as the ability of the biopsy needle to completely fill the target volume as determined by MRI.
Intracranial Biopsy Procedure
After acquisition of prebiopsy MR images, the mouse was anesthetized with a ketamine/xylazine (0.1/0.02 mg/kg) mixture. The tumor was localized with 3-dimensional (3D) Cartesian coordinates on the basis of the distance from the external fiducial marker. The coil was secured to a coil-holder with an attached Kopf stereotactic coordinate system. The mouse was prepped for surgical biopsy and the eyes were protected using eye lubrication. The scalp was sterilized with a topical antiseptic solution and allowed to dry. A 1.5-cm longitudinal incision was made across the midline beginning just posterior to the nasion. The scalp and pericranium were gently retracted and the skull was exposed with cotton-tip applicators. A drill was attached to the stereotactic system (Foredom K-1070 with MH-170 drill with stereotaxic attachment-Model 1474; with Kyocera #70 105-0280.400 drill bits). The attached drill was used to localize the skull burr hole site based on the MRI-determined Cartesian coordinates. After the burr hole was made, a fine aspiration needle (Inrad Model 54722) was secured to the stereotactic instrument and placed into the burr hole. The needle was then advanced to the MRI-determined depth at the proximal/superior edge of the tumor. The inner cannula was removed and the needle was advanced toward the center of the tumor. The needle was attached to a mini-bore extension set (Abbott 32072) connected using a locking aspiration syringe. A syringe was used to withdraw with 2.5 mL of pressure for 3 seconds before the pressure was re-equalized, and the needle was withdrawn from the skull. The biopsy sample was collected in a sterile 2-mL centrifuge tube. Samples were either snap frozen or manually dissociated and cultured at 37°C.
After the biopsy, the burr hole was covered with bone wax (#W810, Ethicon), and the incisions were approximated and closed with Vetbond (#1469SB, Vetbond). To minimize pain, 100 μL (1 mg/mL) of Rimadyl (Pfizer Animal Health) was subcutaneously administered following completion of the surgical procedure. The mouse was kept secured in the coil holder and the MRI was repeated. T1-weighted images were acquired as described above to confirm the accuracy of the biopsy and to rule out significant complications.
A second late-stage biopsy was performed when the tumor volumes reached ∼100 μL. Two distinct biopsy locations were identified and similar biopsy procedures were carried out as described above. The notation Mx[y] was used to denote mouse number [x] and tumor biopsy sample number [y]. At the conclusion of the final biopsy and MR scans to confirm biopsy locations, the animals were sacrificed.
RNA-Seq
Tumor biopsy tissues were used for RNA extraction. Total RNA was extracted using TRIzolTM (#10296010; Life Technologies) and ethanol precipitation as per the manufacturer's instructions. RNA-Seq library preparation and sequencing was completed by DNA sequencing core at the University of Michigan. Specifically, the RNA library was prepared with NEBNext® rRNA Depletion Kit (#E6310L, NEB). Further, 30–45 million 50nt-single-end reads were obtained from each sample with an estimated 20–30× sequencing depth.
RNA-Seq Data Analysis
Single-end reads of RNA-Seq data were mapped to the mouse transcriptome (GRCm38.p4 /mm10) using BWA, duplicate reads were marked by Picard, and base quality scores were recalibrated using GATK, by referring to the PRADA pipeline (22), followed by proceeding with the mapped reads to calculate the read counts and RPKM (reads per kilobase of transcript per million mapped reads) values for 39,017 expressed genes (Ensembl Gene ID) using UCSC/mm10/ensGene transcript database, with associated gene names annotated based on Ensembl genome assembly (Biomart). Differential expression of genes was calculated by applying quantile-adjusted conditional maximum likelihood method that fits read counts with negative binomial models and obtains dispersion estimates, followed by an exact test to determine differential expressions based on false discovery rate (FDR ∼ adjusted P value) (23). Genes were considered to be differentially expressed when the change was greater than 1.5-fold, and the adjusted P value (FDR) was <0.05%.
Pathway and network analyses of differentially expressed genes in early- versus late-stage biopsies were performed using ingenuity pathway analysis (IPA) software (Qiagen). The molecule activity predictor in IPA was used to predict the upstream or downstream activation or inhibition of a given pathway. The P value of the enrichment score was used to evaluate the significance of the overlap between observed and predicted gene sets. All statistical analyses were performed and graphs were obtained under R (version 3.2.3) environment.
Tumor purity was evaluated on RPKM (reads per kilobase of transcript per million mapped reads) values of gene expression profiling using ESTIMATE, based on the enrichment of gene signatures in stromal and immune cells (24). The molecular classification of samples was performed using ssGSEA.
Results
To enable temporal and geographical multisampling of tumor tissue in a murine GBM model, we devised a biopsy apparatus (Figure 1A). For tumor localization, a 3D Cartesian coordinate diagram with external fiducial markers was used to guide biopsy (Figure 1B). To validate the stereotactic biopsy efficiency and accuracy, an MR phantom consisting of agar gels was developed. Three different volumes of air bubbles (void spaces) were used as representative tumor sizes. Once the locations of the voids were determined by MRI within the 3D coordinate system on the basis of the distance from the external fiducial marker, Gd was stereotactically injected into spatially distinct voids via biopsy needles. MRI T1 images were taken before and after Gd injection to determine the accuracy of the biopsy method (Figure 1C). Further, 12–15 mock biopsies were performed for each size, and the accuracy was shown to be 100, 92, and 73% at volumes of 20, 10, and 5 μL, respectively (Figure 1D). These results show that sampling of tumors as small as 5 μL can be routinely achieved with a high degree of accuracy using this MRI-guided biopsy method.
Figure 1.

Instrument setup and optimization used for image-guided biopsy of murine intracranial tumors. Magnetic resonance imaging (MRI)-guided stereotactic biopsy station (A). MRI-coordinate diagram of stereotactic biopsy with fiducial marker to guide biopsy (B). Magnetic resonance (MR) gel phantom with intended stereotactic biopsy site denoted (circle) along with the location of the fiducial marker (arrow) (C). Graphical representation of biopsy accuracy using MR phantom (D). Target biopsy success/number of attempts: 5 μL: 11/15 (73%); 10 μL: 11/12 (92%); 20 μL: 12/12 (100%).
Next, we demonstrated this method for stereotactic MRI-guided multiregional sampling of spontaneous murine p53 mutant GBM tumors with tumor volumes of 10–20 μL. Animals were secured in a stereotactic biopsy station (Figure 1A), and the tumor was localized on the basis of the distance from the external fiducial marker (Figure 1B) using MRI. MR images were easily acquired both before and after stereotactic biopsy sampling (as depicted in Figure 2A) by transferring the MRI animal cradle to a holder with an attached stereotactic coordinate system. After surgical preparation, the Cartesian coordinate system was used to localize the tumor, and a fine aspiration needle attached to an articulating apparatus was used to withdraw the biopsy tissue specimen. The tissue was either snap frozen for RNA extraction or manually dissociated for cell culture (data not shown). T1-weighted MRI was repeated after biopsy to confirm the accuracy of the biopsy and the sampling location. Three p53 mutant GBM animals were used to perform an early-stage biopsy. Further, 2 geographically distinct locations were sampled during the late-stage biopsies for each animal at a tumor volume of ∼100 μL (Figure 2, B and C) to investigate intertumoral genomic heterogeneity.
Figure 2.
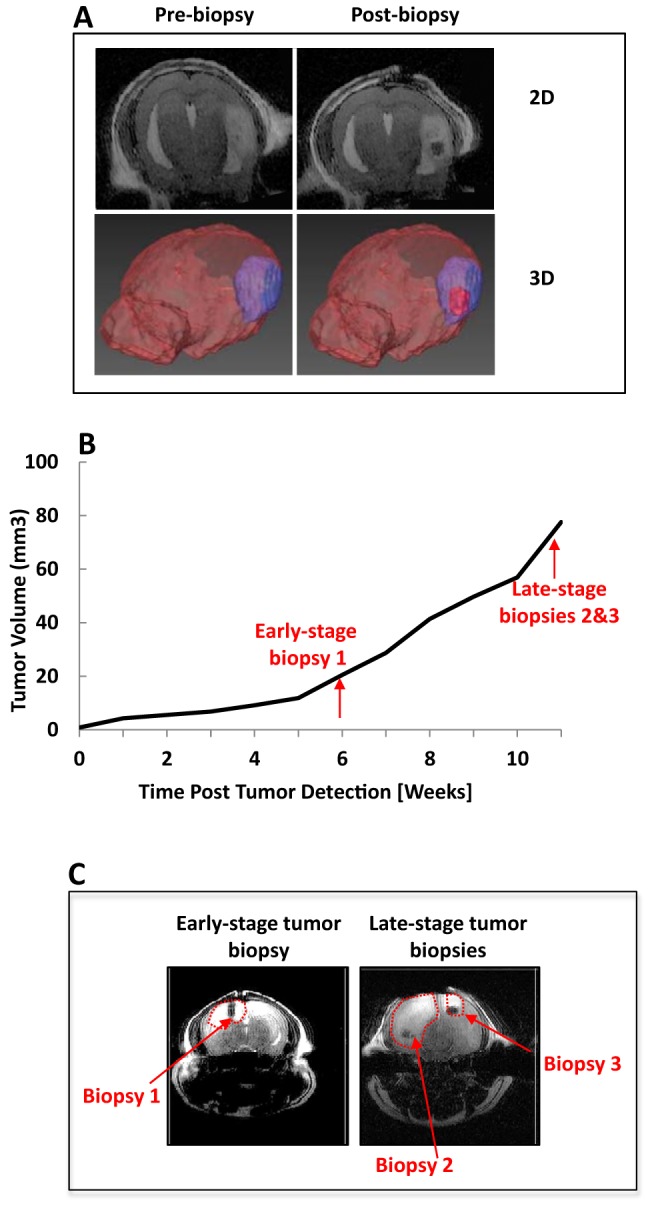
MRI images and 3-dimensional (3D) rendering shows location and time of multiple biopsies from p53-deficient glioma models. Stereotactic biopsy pre- and postbiopsy shown in 2D and 3D (A). MRI-based volumetric analysis of intracranial tumor growth (B). Arrows indicate time points when early- and late-stage biopsies were taken. Postbiopsy T1-weighted MRI shows an early-stage glioma biopsy (left panel) and 2 late-stage biopsy locations (right panel; C). Tumor volume extents are delineated with a red-dotted line.
The analysis of spatiotemporal genomic heterogeneity was accomplished by RNA-Seq-based expression profiling of early- and late-stage biopsies, which revealed distinct temporal and spatial gene expression patterns. We compared both early- and late-stage biopsies of 3 individual mice, and we depicted the top 10 genes upregulated (Figure 3A) and downregulated (Figure 3B) in late-stage biopsies. Pathway-enrichment analysis of differentially expressed genes during tumor progression further identified unique molecular patterns. Upregulated and downregulated pathways in late- versus early-stage biopsies are depicted (Figure 3C). Overall, the pathway-enrichment analysis of differentially expressed genes in early- versus late-stage biopsy samples showed significant differences in molecular patterns during tumor progression. Moreover, spatially varying differences in expressed genes were also observed in late-stage tumors, revealing that intertumoral heterogeneity in this GBM mouse model could be detected using this method.
Figure 3.

RNA-sequencing (RNA-Seq)-based expression profiling of early- and late-stage biopsies reveals distinct temporal and spatial gene expression patterns. The top 10 genes (A) upregulated and downregulated (B) in late-stage biopsies are displayed. Differential expression of genes was calculated. Pathway and network analyses of differentially expressed genes performed using ingenuity pathway analysis (IPA) software (C). The molecule activity predictor in IPA was used to predict the upstream or downstream activation or inhibition of a given pathway. Spatial gene expression patterns were identified by comparing 2 different locations of late-stage tumors (location 1 vs. 2) using the aforementioned criteria (D) and IPA pathway analysis (E). Nomenclature: Mx[y] denotes mouse number [x] and tumor biopsy sample number [y].
Transcriptional profiling of GBM has been previously performed in large-scale clinical studies, and heterogeneous genotypes consisting of subclones with varying tumorigenic, proliferative, differentiation, and drug responsiveness have been shown (4, 5, 18). To identify whether such spatial (geographical) gene expression patterns were present in a preclinical p53 mutant GBM model, 2 spatially distinct locations of late-stage tumors using the aforementioned criteria and IPA pathway analysis were compared (Figure 3D). Interestingly, transcription factor OTX2 was differentially regulated between the 2 spatially distinct regions. OTX2 has been implicated as an oncogene in medulloblastoma where it is highly expressed and amplified in a subset of these tumors (25). OTX2 regulates cell cycle and differentiation, and its regulated genes may serve as potential therapeutic targets (25). Differentially regulated pathways between regions are depicted (Figure 3E). Up- and/or downregulated genes were found, and although detailed studies need to be conducted to investigate the roles of each gene in tumor growth and survival, some genes identified have been indicated to play a role in overall patient survival and tumorigenesis. For example, Ighg1 has been shown to affect overall survival in GBM patients, indicating that it may be associated with more aggressive tumor characteristics in the late stages of tumor growth.
Discussion
Molecular characterization of tumors to guide treatment selection is hampered by intratumor heterogeneity (19, 26). Longitudinal and multifocal monitoring of clonal dynamics may provide for improved patient care (19). In this study, we devised an experimental approach for image-guided tumor sample acquisition from isolated GBM biopsies for sequencing to enable comparative analyses of gene expression patterns and tumor growth. This method allowed for longitudinal tissue sampling over time and in geographically specific regions to gain further insight into the mechanisms of heterogeneity, thus allowing for linking phenotypic and genomic characteristics.
Although phenotypic analyses are not shown here, neurosphere cultures may also be established from GBM biopsies (data not shown). Single-cell expansion and functional assays may be performed from these biopsies and are a topic for future investigations. Although cell to cell differences were not investigated in this study, this approach would also allow for single-cell isolation and investigation of clonal heterogeneity. These studies can easily be expanded to include DNA extraction and the analysis of genetic variations by exome or deep sequencing approaches. We believe that these types of sequencing analyses may aid in the identification of genetic and imaging biomarkers.
Currently, MRI-based stereotactic intracranial procedures are routine in clinical practice. However, an accurate intracranial biopsy technique has not been shown in mouse models. Here, we established an innovative and accurate stereotactic image-guided murine biopsy method that is capable of accurate and repeated biopsy collection from an individual animal. Tissues collected can be used to investigate genomic dynamics during disease progression and modulation during treatment intervention. Spatial and temporal variations in the molecular landscape of preclinical models may provide unique insights into the development and interrogation of novel therapeutic strategies. This information provides opportunities for evaluating genomic responses during treatment to gain a further biological understanding of drug/target modulation and mechanisms of drug resistance and clonal evolution. Elucidation of the precise mechanisms of existing or emerging tumor heterogeneity and its functional significance in preclinical models provides opportunities to discover driver mutations, emergence of drug resistance, identification of genetic and or imaging biomarkers, and development of clone-specific cancer therapies. Here, we devised a method to isolate and functionally profile intratumoral heterogeneity by using MRI-guided biopsies to assess temporal and geographical differences during disease progression in a murine GBM model. We successfully collected tumor biopsy samples at different stages of tumor growth and individual locations. RNA-Seq results showed unique temporal and spatial gene expression patterns in GBM. This approach may allow for new opportunities for assessing tumor tissue samples from discrete spatial locations over time to improve our understanding of the role of spatial heterogeneity and genomic instability in adaptation mechanisms and therapy resistance. In the future, this approach may be adapted to investigate treatment-induced changes and adapted to study other primary and metastatic tumor types. In summary, the combination of MRI-guided tumor sampling with advanced genome sequencing can facilitate identification of mechanisms leading to heterogeneity and development of clinically useful measures of heterogeneity, which may guide identification of new therapeutic strategies.
Acknowledgments
This work was supported by grant funding from the National Institutes of Health (P01CA085878 and R35CA197707).
Disclosures: No disclosures to report.
Conflict of Interest: None reported.
Footnotes
- GBM
- Glioblastoma
- MRI
- magnetic resonance imaging
- Gd
- gadolinium
- MR
- magnetic resonance
- FDR
- false discovery rate
- IPA
- ingenuity pathway analysis
- 3D
- 3-dimensional
- RNA-Seq
- RNA sequencing
References
- 1. Stupp R, Hegi ME, Mason WP, van den Bent MJ, Taphoorn MJ, Janzer RC, Ludwin SK, Allgeier A, Fisher B, Belanger K, Hau P, Brandes AA, Gijtenbeek J, Marosi C, Vecht CJ, Mokhtari K, Wesseling P, Villa S, Eisenhauer E, Gorlia T, Weller M, Lacombe D, Cairncross JG, Mirimanoff RO; European Organisation for Research and Treatment of Cancer Brain Tumour and Radiation Oncology Groups; National Cancer Institute of Canada Clinical Trials Group. Effects of radiotherapy with concomitant and adjuvant temozolomide versus radiotherapy alone on survival in glioblastoma in a randomised phase III study: 5-year analysis of the EORTC-NCIC trial. Lancet Oncol. 2009;10(5):459–466. [DOI] [PubMed] [Google Scholar]
- 2. Stupp R, Mason WP, van den Bent MJ, Weller M, Fisher B, Taphoorn MJ, Belanger K, Brandes AA, Marosi C, Bogdahn U, Curschmann J, Janzer RC, Ludwin SK, Gorlia T, Allgeier A, Lacombe D, Cairncross JG, Eisenhauer E, Mirimanoff RO; European Organisation for Research and Treatment of Cancer Brain Tumor and Radiotherapy Groups; National Cancer Institute of Canada Clinical Trials Group. Radiotherapy plus concomitant and adjuvant temozolomide for glioblastoma. N Engl J Med. 2005;352(10):987–996. [DOI] [PubMed] [Google Scholar]
- 3. Wen PY, Kesari S. Malignant gliomas in adults. N Engl J Med. 2008;359(5):492–507. [DOI] [PubMed] [Google Scholar]
- 4. Meyer M, Reimand J, Lan X, Head R, Zhu X, Kushida M, Bayani J, Pressey JC, Lionel AC, Clarke ID, Cusimano M, Squire JA, Scherer SW, Bernstein M, Woodin MA, Bader GD, Dirks PB. Single cell-derived clonal analysis of human glioblastoma links functional and genomic heterogeneity. Proc Natl Acad Sci U S A. 2015;112(3):851–856. [DOI] [PMC free article] [PubMed] [Google Scholar]
- 5. Cancer Genome Atlas Research Network. Comprehensive genomic characterization defines human glioblastoma genes and core pathways. Nature. 2008;455(7216):1061–1068. [DOI] [PMC free article] [PubMed] [Google Scholar]
- 6. Network TC. Corrigendum: Comprehensive genomic characterization defines human glioblastoma genes and core pathways. Nature. 2013;494(7438):506. [DOI] [PubMed] [Google Scholar]
- 7. Brennan CW, Verhaak RG, McKenna A, Campos B, Noushmehr H, Salama SR, Zheng S, Chakravarty D, Sanborn JZ, Berman SH, Beroukhim R, Bernard B, Wu CJ, Genovese G, Shmulevich I, Barnholtz-Sloan J, Zou L, Vegesna R, Shukla SA, Ciriello G, Yung WK, Zhang W, Sougnez C, Mikkelsen T, Aldape K, Bigner DD, Van Meir EG, Prados M, Sloan A, Black KL, Eschbacher J, Finocchiaro G, Friedman W, Andrews DW, Guha A, Iacocca M, O'Neill BP, Foltz G, Myers J, Weisenberger DJ, Penny R, Kucherlapati R, Perou CM, Hayes DN, Gibbs R, Marra M, Mills GB, Lander E, Spellman P, Wilson R, Sander C, Weinstein J, Meyerson M, Gabriel S, Laird PW, Haussler D, Getz G, Chin L; TCGA Research Network. The somatic genomic landscape of glioblastoma. Cell. 2013;155(2):462–477. [DOI] [PMC free article] [PubMed] [Google Scholar]
- 8. Eckel-Passow JE, Lachance DH, Molinaro AM, Walsh KM, Decker PA, Sicotte H, Pekmezci M, Rice T, Kosel ML, Smirnov IV, Sarkar G, Caron AA, Kollmeyer TM, Praska CE, Chada AR, Halder C, Hansen HM, McCoy LS, Bracci PM, Marshall R, Zheng S, Reis GF, Pico AR, O'Neill BP, Buckner JC, Giannini C, Huse JT, Perry A, Tihan T, Berger MS, Chang SM, Prados MD, Wiemels J, Wiencke JK, Wrensch MR, Jenkins RB. Glioma groups based on 1p/19q, IDH, and TERT promoter mutations in tumors. N Engl J Med. 2015;372(26):2499–2508. [DOI] [PMC free article] [PubMed] [Google Scholar]
- 9. Hegi ME, Diserens AC, Gorlia T, Hamou MF, de Tribolet N, Weller M, Kros JM, Hainfellner JA, Mason W, Mariani L, Bromberg JE, Hau P, Mirimanoff RO, Cairncross JG, Janzer RC, Stupp R. MGMT gene silencing and benefit from temozolomide in glioblastoma. N Engl J Med. 2005;352(10):997–1003. [DOI] [PubMed] [Google Scholar]
- 10. Verhaak RG, Hoadley KA, Purdom E, Wang V, Qi Y, Wilkerson MD, Miller CR, Ding L, Golub T, Mesirov JP, Alexe G, Lawrence M, O'Kelly M, Tamayo P, Weir BA, Gabriel S, Winckler W, Gupta S, Jakkula L, Feiler HS, Hodgson JG, James CD, Sarkaria JN, Brennan C, Kahn A, Spellman PT, Wilson RK, Speed TP, Gray JW, Meyerson M, Getz G, Perou CM, Hayes DN; Cancer Genome Atlas Research Network. Integrated genomic analysis identifies clinically relevant subtypes of glioblastoma characterized by abnormalities in PDGFRA, IDH1, EGFR, and NF1. Cancer Cell. 2010;17(1):98–110. [DOI] [PMC free article] [PubMed] [Google Scholar]
- 11. Patel AP, Tirosh I, Trombetta JJ, Shalek AK, Gillespie SM, Wakimoto H, Cahill DP, Nahed BV, Curry WT, Martuza RL, Louis DN, Rozenblatt-Rosen O, Suvà ML, Regev A, Bernstein BE. Single-cell RNA-seq highlights intratumoral heterogeneity in primary glioblastoma. Science. 2014;344(6190):1396–401. [DOI] [PMC free article] [PubMed] [Google Scholar]
- 12. Sottoriva A, Spiteri I, Piccirillo SG, Touloumis A, Collins VP, Marioni JC, Curtis C, Watts C, Tavaré S. Intratumor heterogeneity in human glioblastoma reflects cancer evolutionary dynamics. Proc Natl Acad Sci U S A. 2013;110(10):4009–4014. [DOI] [PMC free article] [PubMed] [Google Scholar]
- 13. Aubry M, de Tayrac M, Etcheverry A, Clavreul A, Saikali S, Menei P, Mosser J. From the core to beyond the margin: a genomic picture of glioblastoma intratumor heterogeneity. Oncotarget. 2015;6(14):12094–12109. [DOI] [PMC free article] [PubMed] [Google Scholar]
- 14. Kumar A, Boyle EA, Tokita M, Mikheev AM, Sanger MC, Girard E, Silber JR, Gonzalez-Cuyar LF, Hiatt JB, Adey A, Lee C, Kitzman JO, Born DE, Silbergeld DL, Olson JM, Rostomily RC, Shendure J. Deep sequencing of multiple regions of glial tumors reveals spatial heterogeneity for mutations in clinically relevant genes. Genome Biol. 2014;15(12):530. [DOI] [PMC free article] [PubMed] [Google Scholar]
- 15. Malkki H. Trial Watch: Glioblastoma vaccine therapy disappointment in Phase III trial. Nat Rev Neurol. 2016;12(4):190. [DOI] [PubMed] [Google Scholar]
- 16. Sampson JH, Heimberger AB, Archer GE, Aldape KD, Friedman AH, Friedman HS, Gilbert MR, Herndon JE 2nd, McLendon RE, Mitchell DA, Reardon DA, Sawaya R, Schmittling RJ, Shi W, Vredenburgh JJ, Bigner DD. Immunologic escape after prolonged progression-free survival with epidermal growth factor receptor variant III peptide vaccination in patients with newly diagnosed glioblastoma. J Clin Oncol. 2010;28(31):4722–4729. [DOI] [PMC free article] [PubMed] [Google Scholar]
- 17. Schuster J, Lai RK, Recht LD, Reardon DA, Paleologos NA, Groves MD, Mrugala MM, Jensen R, Baehring JM, Sloan A, Archer GE, Bigner DD, Cruickshank S, Green JA, Keler T, Davis TA, Heimberger AB, Sampson JH. A phase II, multicenter trial of rindopepimut (CDX-110) in newly diagnosed glioblastoma: the ACT III study. Neuro Oncol. 2015;17(6):854–861. [DOI] [PMC free article] [PubMed] [Google Scholar]
- 18. Kim H, Zheng S, Amini SS, Virk SM, Mikkelsen T, Brat DJ, Grimsby J, Sougnez C, Muller F, Hu J, Sloan AE, Cohen ML, Van Meir EG, Scarpace L, Laird PW, Weinstein JN, Lander ES, Gabriel S, Getz G, Meyerson M, Chin L, Barnholtz-Sloan JS, Verhaak RG. Whole-genome and multisector exome sequencing of primary and post-treatment glioblastoma reveals patterns of tumor evolution. Genome Res. 2015;25(3):316–327. [DOI] [PMC free article] [PubMed] [Google Scholar]
- 19. Bedard PL, Hansen AR, Ratain MJ, Siu LL. Tumour heterogeneity in the clinic. Nature. 2013;501(7467):355–364. [DOI] [PMC free article] [PubMed] [Google Scholar]
- 20. Nikbakht H, Panditharatna E, Mikael LG, Li R, Gayden T, Osmond M, Ho CY, Kambhampati M, Hwang EI, Faury D, Siu A, Papillon-Cavanagh S, Bechet D, Ligon KL, Ellezam B, Ingram WJ, Stinson C, Moore AS, Warren KE, Karamchandani J, Packer RJ, Jabado N, Majewski J, Nazarian J. Spatial and temporal homogeneity of driver mutations in diffuse intrinsic pontine glioma. Nat Commun. 2016;7:11185. [DOI] [PMC free article] [PubMed] [Google Scholar]
- 21. Wang Y, Yang J, Zheng H, Tomasek GJ, Zhang P, McKeever PE, Lee EY, Zhu Y. Expression of mutant p53 proteins implicates a lineage relationship between neural stem cells and malignant astrocytic glioma in a murine model. Cancer Cell. 2009;15(6):514–526. [DOI] [PMC free article] [PubMed] [Google Scholar]
- 22. Torres-Garcia W, Zheng S, Sivachenko A, Vegesna R, Wang Q, Yao R, Berger MF, Weinstein JN, Getz G, Verhaak RG. PRADA: pipeline for RNA sequencing data analysis. Bioinformatics. 2014;30(15):2224–2226. [DOI] [PMC free article] [PubMed] [Google Scholar]
- 23. Robinson MD, McCarthy DJ, Smyth GK. edgeR: a Bioconductor package for differential expression analysis of digital gene expression data. Bioinformatics. 2010;26(1):139–140. [DOI] [PMC free article] [PubMed] [Google Scholar]
- 24. Yoshihara K, Shahmoradgoli M, Martínez E, Vegesna R, Kim H, Torres-Garcia W, Treviño V, Shen H, Laird PW, Levine DA, Carter SL, Getz G, Stemke-Hale K, Mills GB, Verhaak RG. Nat Commun. 2013;4:2612. [DOI] [PMC free article] [PubMed] [Google Scholar]
- 25. Bunt J, Hasselt NE, Zwijnenburg DA, Hamdi M, Koster J, Versteeg R, Kool M. OTX2 directly activates cell cycle genes and inhibits differentiation in medulloblastoma cells. Int J Cancer. 2012;131(2):E21–E32. [DOI] [PubMed] [Google Scholar]
- 26. Burrell RA, McGranahan N, Bartek J, Swanton C. The causes and consequences of genetic heterogeneity in cancer evolution. NatureÙ. 2013;501(7467):338–345. [DOI] [PubMed] [Google Scholar]