Summary
AlphaScreen technology has been routinely utilized in high throughput screening assays to quantify analyte accumulation or depletion, bimolecular interactions, and post-translational modifications. The high signal-to-background, dynamic range and sensitivity associated with AlphaScreens as well as the homogenous assay format and reagent stability makes the technology particularly well suited for high throughput screening applications. Here, we describe the development of AlphaScreen assays to identify small molecule inhibitors of enzymes and protein-protein interactions using the highly miniaturized 1536-well format. The subsequent implementation of counter assays to identify false positive compounds is also discussed.
Keywords: AlphaLISA, AlphaScreen, High Throughput Screening, Assay, ELISA, HTS, Enzyme, Protein-protein interaction
1. Introduction
The AlphaScreen (Amplified Luminescent Proximity Homogenous Assay Screen) and AlphaLISA technologies have enabled the development of robust proximity-based assays to identify small molecule modulators for a variety of biological targets from high throughput screening (HTS) of compound libraries. AlphaScreen technology was developed from a methodology for diagnostic assays called Luminescent Oxygen Channeling Immunoassay (LOCI) that was described in 1994 by Ullman et al. [1]. This method was based on the non-enzymatic channeling of singlet oxygen species, generated from a photoexcitable latex bead, to a second latex bead located in close proximity in order to induce a chemiluminescent signal. Ullman and colleagues demonstrated that the short diffusion distance of singlet oxygen prior to its spontaneous decay could be exploited to detect biological analytes and molecular interactions. Similarly, the AlphaScreen approach reports on the proximity of “donor” and “acceptor” beads induced by the presence and co-recognition of an analyte of interest, which can include molecules, post-translational modifications to proteins and molecular interactions. The donor beads contain a phthalocyanine photosensitizer that excites ambient oxygen into a singlet state following high energy irradiation at 680 nm. Excitation of the donor beads generates about 60,000 oxygen singlets per second, which can diffuse to a maximum distance of about 200 nm [2]. A chemiluminescent signal is generated within an AlphaScreen acceptor bead if it is located in close enough proximity to receive singlet oxygen. Because AlphaScreen acceptor beads contain three chemical dyes, Thioxene, Anthracene and Rubrene, they are sometimes referred to as ‘TAR’ beads. The singlet oxygen initially reacts with thioxene to generate light that is transferred to anthracene and then to rubrene, resulting in a broad emission from 520 nm to 620 nm. In AlphaLISA and AlphaPlex acceptor beads, anthracene and rubrene are substituted by either europium, terbium or samarium chelates, which are directly excited upon fragmentation of the dioxetane intermediate formed by the reaction of thioxene with singlet oxygen. AlphaLISA (Europium, λem = 615 nm), AlphaPlex 545 (Terbium, λem = 545 nm) and AlphaPlex 645 (Samarium, λem = 645 nm) acceptor beads emit intense and spectrally defined emission signals. Therefore, it is possible to develop multiplex assays by incorporating multiple acceptor beads into the assay design. The lifetime of singlet oxygen is relatively short in aqueous solutions (~ 4 msec) and the beads are generally introduced at low concentrations, so non-specific interactions among bead pairs are rare and the background is very low [3]. Due to the very high signal and very low background, AlphaScreen technology is easily adaptable to the highly miniaturized 1536-well plates. Additionally, the convenient homogenous assay format and excellent reagent stability make the AlphaScreen technology particularly well-suited for high throughput applications. The surfaces of the hydrophilic AlphaScreen, AlphaLISA and AlphaPlex beads are coated with latex-based hydrogels with reactive aldehydes to allow the attachment of assay-specific molecules such as antibodies, ligands, substrates and binding partners. In addition to the widely-used biotin-streptavidin pair, frequently utilized are recognition pairs based on protein affinity purification handles, such as hexahistidine, FLAG, and GST tails, as well as specific antibodies targeting post-translational modifications, such as various histone methylation loci. This flexibility in bead conjugation has enabled the development of a variety of assays suitable for different biological applications. For example, a number of diagnostic approaches have been reported that utilize AlphaLISA to measure biomarkers from human saliva, plasma and serum [4–8]. Additionally, the technology has been applied extensively to investigate a wide variety of biological processes, including the activities of purified enzymes, the generation of second messengers, post-translational modifications to proteins and different types of molecular interactions (for a review, see [3]).
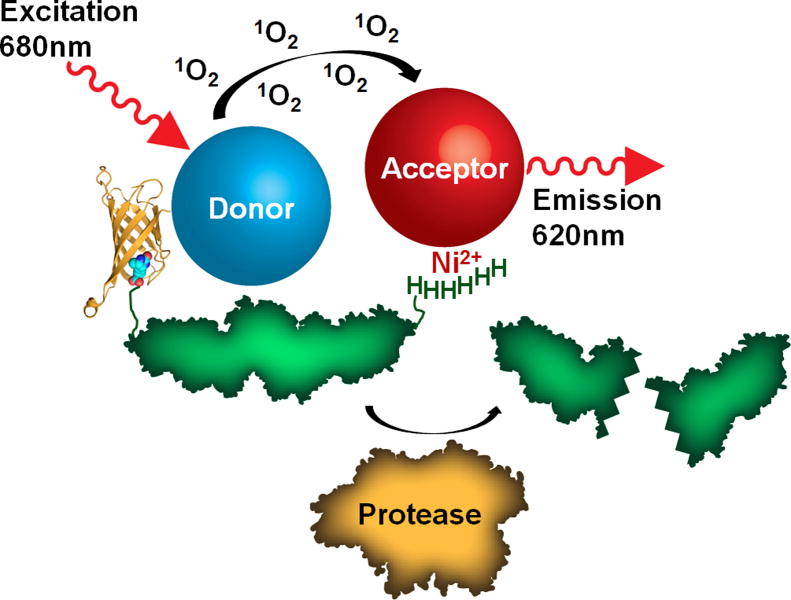
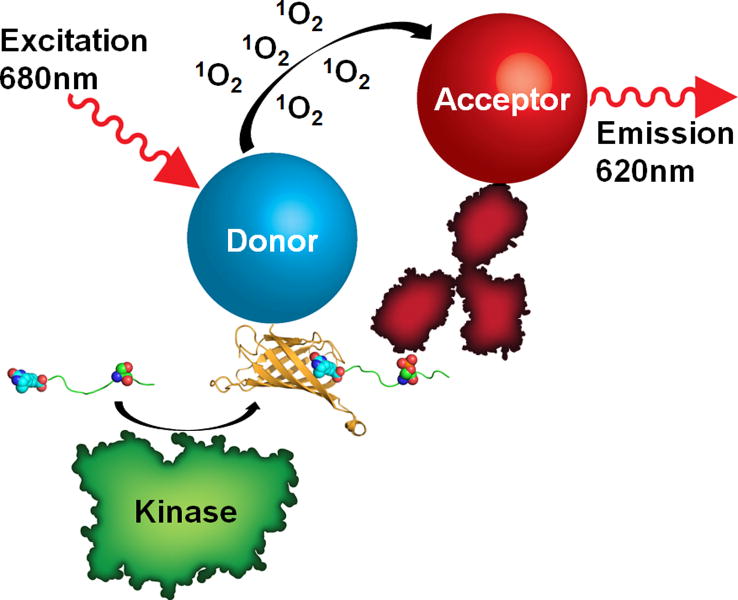
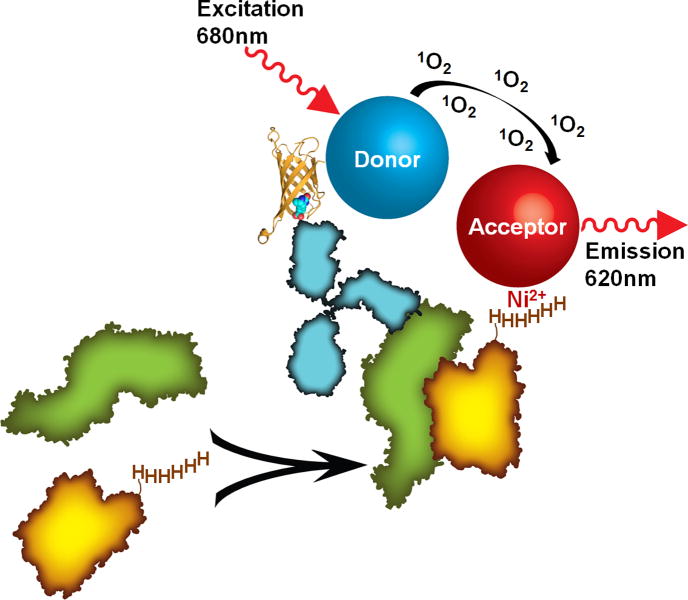
There are a multitude of examples reported in the literature where AlphaScreen/AlphaLISA technology has been utilized to develop sensitive and robust assays for HTS. In general, the basic paradigms of these different HTS assays are to detect either the depletion of a substrate (Fig. 1), the formation of a product (Fig. 2) or interactions between molecules (Fig. 3). At our center, we have utilized all of these approaches to develop miniaturized assays for diverse biological applications that ultimately enabled the identification of small molecule modulators from large compound libraries. For example, based on a substrate depletion approach, we developed an AlphaScreen assay to identify inhibitors of Tyrosyl-DNA phosphodiesterase I (Tdp1), which is involved in DNA repair [9]. For this assay, a reporter substrate for Tdp1 was generated by coupling fluorescein isothiocyanate (FITC) to the amino group of a phosphotyrosine-containing deoxyoligonucleotide biotinylated at its 5′-end. Thus, the intact substrate would yield a high signal due to the close proximity of streptavidin-conjugated donor beads and anti-FITC-conjugated acceptor beads. In contrast, hydrolysis of the substrate by Tdp1 resulted in a loss of signal. This approach enabled the identification of previously unreported inhibitors of Tdp1. In another example, the strategy of following substrate depletion was utilized to develop an assay to investigate the activity of human flap endonuclease 1 (FEN1), which is involved in DNA replication and repair [10]. A substrate for FEN1 was assembled from three oligodeoxynucleotides, including an unlabeled template strand, a flap strand labeled on the 5′-end with FITC, and an upstream strand biotinylated at the 5′-end.
Fig. 1.
Diagram of an AlphaScreen assay strategy to follow the depletion of substrate due to enzymatic activity. The activity of a protease (represented in orange) is measured by the loss of a protein substrate (represented in green) due to proteolytic cleavage. The biotinylated substrate also contains a polyhistidine tag, which brings streptavidin donor beads and nickel chelate acceptor beads into close proximity to generate a high signal prior to cleavage. The streptavidin-biotin complex (Protein Data Bank ID 3RY2) is represented with streptavidin as a ribbon diagram and biotin as spheres and was generated with the program PyMOL.
Fig. 2.
Diagram of an AlphaScreen assay strategy to follow the generation of a reaction product due to enzymatic activity. Here, the activity of a kinase (represented in green) is followed by the phosphorylation of a biotinylated peptide substrate (represented as a green ribbon). A phospho-specific antibody (red), conjugated to an acceptor bead, recognizes the phosphorylated substrate and places the acceptor bead in close proximity to the streptavidin donor bead to generate a signal. The streptavidin-biotin complex (Protein Data Bank ID 3RY2) is represented with streptavidin as a ribbon diagram and biotin as spheres and was generated with the program PyMOL.
Fig. 3.
Diagram of an AlphaScreen assay strategy to detect protein-protein interactions. In this scheme, the association between two proteins (represented in green and orange) is followed by pairing each molecule with a donor or acceptor bead, respectively. While the orange protein contains a polyhistidine tag and associates with nickel chelate acceptor beads, the green protein is recognized by a biotinylated antibody (blue) that binds a streptavidin donor bead. The protein complex places the bead pair into close proximity to generate a signal. The streptavidin-biotin complex (Protein Data Bank ID 3RY2) is represented with streptavidin as a ribbon diagram and biotin as spheres and was generated with the program PyMOL.
Prior to cleavage, the three oligodeoxynucleotides associate and bring the streptavidin donor beads and anti-FITC-conjugated acceptor beads into close proximity, thereby generating a strong signal. Upon cleavage of the flap substrate by FEN1, the signal is reduced due to separation of the bead pairs as the biotin and FITC tags are no longer contained within the singular substrate molecule. The assay allowed identification of previously unreported FEN1 inhibitors with submicromolar potency.
AlphaScreen/AlphaLISA assays also routinely report on the generation of a product, which can be from complex systems, such as from intact or lysed cells in media. In one such example, our center took advantage of the commercially available AlphaLISA TNF-α assay to identify inhibitors of TNF-α secreted from THP-1 cells that were stimulated with lipopolysaccharide in 1536-well plates [11]. The detection reagents included two anti-TNF-α antibodies that recognize different epitopes of TNF-α. While one is directly conjugated to acceptor beads, the other antibody is biotinylated and therefore binds donor beads in solution. A signal is generated in the presence of TNF-α, which brings the bead pairs into close proximity. The optimized assay was robust and allowed us to identify novel inhibitors of TNF-α. In a different example, we used a commercially available AlphaLISA Tau assay to measure total cellular levels of the microtubule-associated protein, Tau, from SH-SY5Y neuroblastoma cell lysates in 1536-well plates [12]. As with the AlphaLISA TNF-α assay, the Tau assay utilized two antibodies that recognize different epitopes of the target. Measuring product formation can also be used to investigate the activity of purified enzymes in buffered solutions. We have used this strategy to follow the enzymatic activities of the histone methyltransferases, G9a and EHMT1 (also known as GLP) [13,14]. For these assays, the substrate was a biotinylated histone peptide. Methylation of the histone peptide by either G9a or EHMT1 was recognized by a primary antibody against methyllysine, which resulted in an increased signal due to the induced proximity of secondary antibody-coated acceptor beads and streptavidin donor beads. AlphaScreen assays can also be developed to report on associations between molecules and this approach enabled our group to investigate interactions between biotinylated trimethyllysine histone peptides that represent different histone epigenetic marks and Glutathione S-Transferase (GST) chimeras of chromodomains (MPP8, HP1β and CHD1), the JMJD2A tudor domain and RAG2, a plant homeodomain [15]. Such interactions are generally weak (having dissociation constants in the micromolar range) and therefore are challenging to interrogate by other assay technologies, such as fluorescence polarization. The AlphaScreen approach utilized commercially-available streptavidin donor and anti-GST acceptor beads to yield a signal as a consequence of protein-peptide interactions. Ultimately, the optimized assay enabled the characterization of binding specificities for the different domains to multiple histone marks. Another example of a protein-peptide interaction that was adapted to an AlphaScreen format is the association between a C-terminal peptide of heat shock protein 90 (Hsp90) and the TPR2A domain of the Hsp90 cochaperone, Hsp organizing protein (HOP) [16]. As before, the assay incorporated a biotinylated peptide, while the TPR2A protein contained a hexahistidine tag. Therefore, streptavidin donor beads and nickel chelate acceptor beads are brought together through the Hsp90/TPR2A interaction to generate a signal. The optimized assay was robust and allowed identification of a novel class of Hsp90 inhibitors [17]. Similarly, we developed a high-throughput AlphaScreen assay to identify inhibitors of the interaction between the malaria parasite proteins, AMA1 and RON2, which is essential for parasite invasion into red blood cells. The assay was developed with a biotinylated RON2L peptide, which binds streptavidin donor beads and AMA1 with a hexahistidine tag that binds nickel chelate acceptor beads. Inhibitors of the AMA1-RON2 interaction reduced the proximity of donor and acceptor beads along with the signal. The assay enabled our discovery of the first small molecule inhibitor for this interaction [18]. In addition to peptide-protein interactions, we have also developed AlphaScreen assays to report on protein-protein interactions. An excellent example of this is an assay to detect heterodimerization of the transcription factors RUNX1 and CBFβ, which has been shown to be critical for the pathogenesis of CBF leukemias [19]. In this case, the RUNX1 protein was biotinylated and the CBFβ protein was expressed to include a hexahistidine tag. Inhibitors were identified that prevented heterodimerization of the proteins and thus a loss of pairing between the streptavidin donor and nickel chelate acceptor beads. We have also used an AlphaScreen format to interrogate other types of interactions, such as an RNA-protein interaction that is relevant to the pathology of myotonic dystrophy type 1 [20]. For this assay, it was possible to utilize the same AlphaScreen reagents described in the previous example, due to the use of biotinylated RNA molecules and polyhistidine-tagged muscleblind-like 1 protein. The remainder of this chapter is intended to provide useful guidelines for the development of different types of AlphaScreen assays suitable for the identification of small molecule inhibitors of targets such as purified enzymes, protein-protein interactions and targets within whole cells from high throughput screens in the highly miniaturized 1536-well format.
2. Materials
The following three protocols for detecting substrate depletion by an enzymatic reaction, detecting protein-protein interactions and detecting product formation from live cells have each been optimized for unpublished projects that are currently active in our laboratory. Therefore, the names of the specific proteins or targets are unidentified to maintain confidentiality.
2.1. Materials for Detecting Substrate Depletion from AlphaScreen Assays
Medium-binding white solid-bottom 1536-well plates
Plate reader capable of 1536-well AlphaScreen detection (such as the EnVision Plate Reader equipped with a 1536 HTS AlphaScreen aperture)
Assay Buffer (PBS pH 7.4, 0.01% Tween-20 or another preferred buffer, see Note1)
Enzyme at double the final concentration in assay buffer
Substrate at four-fold the final concentration in assay buffer
Mixture of nickel chelate acceptor beads (20 μg/mL working stock for 5 μg/mL, final) and streptavidin donor beads (20 μg/mL working stock for 5 μg/mL, final) suspended in assay buffer (or beads conjugated for the preferred specificity, such as anti-GST) (see Note2)
Experimental compounds suspended in DMSO (stock concentrations of 640 nM – 10,000 μM for a working concentration range of 3.7 nM – 57.5 μM after a 174-fold dilution into the assay mixture)
Liquid transfer pin tool (such as a Kalypsys automated pin-tool station) (see Note3)
Centrifuge equipped with a rotor that will accommodate plates
Liquid dispenser capable of delivering small volumes (such as a BioRAPTR Flying Reagent Dispenser)
2.2. Materials for Detecting Protein-Protein Interactions from AlphaScreen Assays
Medium-binding white solid-bottom 1536-well plates
Plate reader capable of 1536-well AlphaScreen detection (such as the EnVision Plate Reader equipped with a 1536 HTS AlphaScreen aperture)
Assay Buffer (15 mM HEPES pH 7.5, 150 mM NaCl, and 0.01%Tween-20 or preferred buffer, see Note1)
Polyhistidine-tagged protein at double the final concentration in assay buffer
Biotinylated protein at four-fold the final concentration in assay buffer
A mixture of streptavidin donor beads (80 μg/mL working stock for 20 μg/mL, final) and nickel chelate acceptor beads (80 μg/mL working stock for 20 μg/mL, final) suspended in assay buffer (or beads conjugated for the preferred specificity, such as anti-GST) (see Note2)
Experimental compounds suspended in DMSO (stock concentrations of 640 nM – 10,000 μM for a working concentration range of 3.7 nM – 57.5 μM after a 174-fold dilution into the assay mixture)
Liquid transfer pin tool (such as a Kalypsys automated pin-tool station) (see Note3)
Centrifuge equipped with a rotor that will accommodate plates
Liquid dispenser capable of delivering small volumes (such as a BioRAPTR Flying Reagent Dispenser)
2.3. Materials for Detection of Product Formation from Live Cells by AlphaScreen Assays
Medium-binding white solid-bottom tissue culture treated 1536-well plates
Plate reader capable of 1536-well AlphaScreen detection (such as the EnVision Plate Reader equipped with a 1536 HTS AlphaScreen aperture)
THP-1 cells in media with 5% serum (see Note4)
Media with 5% serum
Lipopolysaccharide (LPS) (4 μg/mL working stock for 1 μg/mL, final) in media with 5% serum
Mixture of biotinylated anti-TNF-α antibody (4.66 nM working stock for 1 nM, final) and anti-TNF-α-conjugated acceptor beads (46.66 μg/mL working stock for 11 μg/mL, final) in AlphaLISA immunoassay buffer
Streptavidin donor beads (186.4 μg/mL working stock for 40 μg/mL, final) in AlphaLISA immunoassay buffer (see Note2)
Experimental compounds suspended in DMSO (stock concentrations of 640 nM – 10,000 μM for a working concentration range of 3.7 nM – 57.5 μM after a 174-fold dilution into the assay mixture)
Liquid transfer pin tool (such as a Kalypsys automated pin-tool station) (see Note3)
Centrifuge equipped with a rotor that will accommodate plates
Liquid dispenser capable of delivering small volumes (such as a Multidrop Combi Reagent Dispenser)
3. Methods
3.1. Methods for Detecting Substrate Depletion from AlphaScreen Assays
Before beginning assay development and regularly thereafter, verify that the plate reader settings are optimized for the AlphaScreen assay (see Note5).
Determine the enzymatic assay conditions, including the buffer composition, concentration of enzyme and the KM of the substrate under those conditions (see Note6).
Perform a titration of the substrate with fixed concentrations of AlphaScreen reagents in order to determine the saturation point of the beads and the dynamic range of the assay (see Note 7).
Perform a titration of enzyme with fixed concentrations of substrate and AlphaScreen reagents (see Note 8).
After assay optimization, establish DMSO tolerance (or appropriate vehicle) by performing a titration. Secondly, perform the assay in a 1536-well plate where the wells have only been treated with DMSO and control compound(s) (see Note 9).
Dispense 2 μL of a buffered enzyme solution, into columns 1, 2 and 5–48 of a 1536-well plate (see Note10).
Dispense 2 μL of buffer (the same buffer that the enzyme has been diluted into) into columns 3 and 4 of the plate (see Note11).
Spin the plate in a centrifuge for 15 seconds at 161 × g.
Deliver 23 nL of DMSO vehicle, control (if available) and library compounds to the appropriate wells of the 1536-well plate (see Note12).
Incubate the plate at room temperature for 15 minutes to allow time for the compounds to bind the target (the time period can be optimized for different assays).
Dispense 1 μL of the concentrated substrate into the wells of columns 1–48 (see Note13).
Spin the plate in a centrifuge for 15 seconds at 161 × g.
Incubate the plate at room temperature for 30 minutes (or a pre-determined amount of time).
Dispense 1 μL of a 20 μg/mL mixture of AlphaScreen streptavidin donor and nickel chelate acceptor beads (or beads with the preferred specificity) into columns 1–48 (see Note2).
Spin the plate in a centrifuge for 15 seconds at 161 × g.
Incubate the plate at room temperature for 30 minutes (this incubation time can be optimized for individual assays).
Read the plate on an EnVision Reader equipped with a 1536 HTS AlphaScreen aperture using an 80 millisecond excitation time and 240 millisecond measurement (or another reader appropriately set up to measure AlphaScreen assays) (see Note14).
3.2. Methods for Detecting Protein-Protein Interactions from AlphaScreen Assays
Before beginning assay development and regularly thereafter, verify that the plate reader settings are optimized for the AlphaScreen assay (see Note5).
Establish the lowest concentration of each protein required to obtain robust assay results (see Note15).
Verify that titration with an unlabeled version of each protein results in assay signal reduction (this can also be used as a control).
After assay optimization, establish DMSO tolerance (or appropriate vehicle) by performing a titration. Secondly, perform the assay in a 1536-well plate where the wells have only been treated with DMSO and control compound(s) (see Note 9).
Dispense 2 μL of concentrated polyhistidine-tagged protein into columns 1–48 of a 1536-well plate.
Deliver 23 nL of DMSO vehicle, control (if available) and library compounds to the appropriate wells of the 1536-well plate (see Note12).
Spin the plate in a centrifuge for 15 seconds at 161 × g.
Incubate the plate at room temperature for 15 minutes to allow time for the compounds to bind the target (the time period can be optimized for different assays).
Dispense 1 μL of concentrated biotinylated-protein into columns 1, 2 and 5–48 of the plate.
Dispense 1 μL of buffer into columns 3 and 4 of the plate (see Note16).
Spin the plate in a centrifuge for 15 seconds at 161 × g.
Incubate the plate at room temperature for 15 minutes to allow time for the proteins to bind (the time period can be optimized for different assays).
Dispense 1 μL of 80 μg/mL mixture of streptavidin donor beads and nickel chelate acceptor beads (or beads with the preferred specificity) into columns 1–48 of the plate (see Note2).
Spin the plate in a centrifuge for 15 seconds at 161 × g.
Incubate the plate at room temperature for 30 minutes (this incubation time can be optimized for individual assays).
Read the plate on an EnVision Reader equipped with a 1536 HTS AlphaScreen aperture using an 80 millisecond excitation time and 240 millisecond measurement (or another reader appropriately set up to measure AlphaScreen assays) (see Note14).
3.3. Methods for Detection of Product Formation from Live Cells by AlphaScreen Assays
Before beginning assay development and regularly thereafter, verify that the plate reader settings are optimized for the AlphaScreen assay (see Note5).
Optimize the assay parameters for detection of preferred product from preferred cell line (see Note17).
After assay optimization, establish DMSO tolerance (or appropriate vehicle) by performing a titration. Secondly, perform the assay in a 1536-well plate where the wells have only been treated with DMSO and control compound(s) (see Note 9).
Dispense 3 μL containing 3,000 THP-1 (or preferred cell type and optimized concentration) into columns 1–48 of a 1536-well plate.
Spin the plate in a centrifuge for 15 seconds at 161 × g.
Deliver 23 nL of DMSO vehicle, control (if available) and library compounds to the appropriate wells of the 1536-well plate (see Note12).
Incubate the plate at 37°C with 5% CO2 for 60 minutes to allow time for the compounds to enter the cells and bind a target (the time period can be optimized for different assays).
Dispense 1 μL of LPS (4 μg/mL working stock for 1 μg/mL, final or preferred stimulation reagent suspended in media to obtain the optimized final concentration) into columns 1, 2 and 5–48.
Dispense 1 μL of media with 5% serum into columns 3 and 4 (see Note18).
Spin the plate in a centrifuge for 15 seconds at 161 × g.
Incubate the plate at 37°C with 5% CO2 for 16 hours.
Dispense 1.5 μL containing a mixture of biotinylated anti-TNF-α antibody (1 nM, final) and anti-TNF-α-conjugated acceptor beads (10 μg/mL, final) into columns 1–48.
Spin the plate in a centrifuge for 15 seconds at 161 × g.
Incubate the plate at room temperature for 1 hour (this incubation time can be optimized for individual assays).
Dispense 1.5 μL donor beads (40 μg/mL, final) into columns 1–48 (see Note2).
Spin the plate in a centrifuge for 15 seconds at 161 × g.
Incubate the plate at room temperature for 30 minutes (this incubation time can be optimized for individual assays).
Read the plate on an EnVision Reader equipped with a 1536 HTS AlphaScreen aperture using an 80 millisecond excitation time and 240 millisecond measurement (or another reader appropriately set up to measure AlphaScreen assays) (see Note14).
3.4. Identifying False-positive Hit Compounds
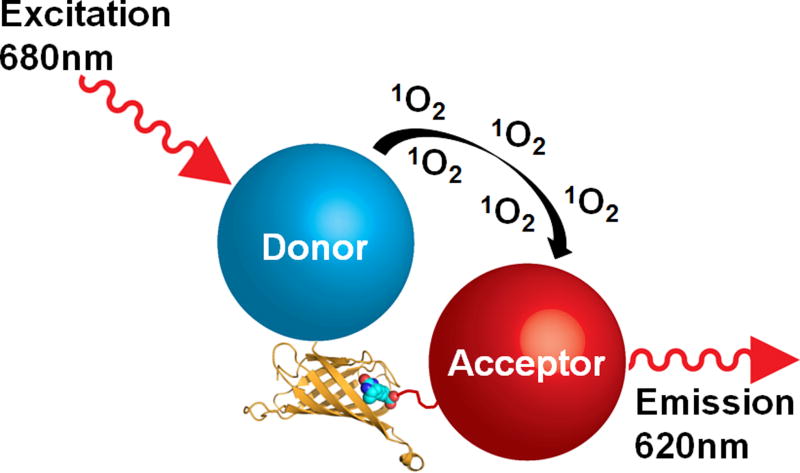
In screening AlphaScreen/AlphaLISA assays against libraries of small molecule compounds, it is probable that some of the hit compounds identified will be due to activity of the compound against the assay technology, rather than the biological system under investigation. Such compounds are commonly referred to as “false-positive hits” or “assay artifacts” and it is important to identify these compounds early on to avoid spending additional time and money in follow-up. The TruHit kit, available from PerkinElmer, was developed to detect compounds that interfere with the assay technology by four mechanisms, including those mimicking biotin, quenching singlet oxygen, quenching light, and scattering light. The TruHit kit simply contains streptavidin donor beads and biotinylated acceptor beads, which bind directly to one another, bypassing the requirement for an analyte (Fig. 4). To identify compounds that interfere by all four of the mechanisms listed above, it is necessary to perform the assay by two separate methods. To distinguish biotin mimetics, hit compounds are incubated with the streptavidin donor beads prior to the addition of biotinylated acceptor beads. These interference molecules will bind to streptavidin and prevent subsequent pairing of the donor and acceptor beads, which is indicated by a reduced AlphaScreen signal. The remaining interference mechanisms, singlet oxygen and light quenchers as well as light scatterers are identified by incubating the hit compounds with beads that have been premixed. Examples of singlet oxygen quenchers include ascorbate, azide and metals such as Zn2+, Cu2+, Fe2+ and Fe3+. Color quenchers or inner filters, such as malachite green and blue dextran, interfere with the assay by absorbing either the light used to excite the donor beads or the light emitted by the acceptor beads. Finally, compounds that form insoluble aggregates can cause interference by scattering light from both the excitation and/or emission wavelengths. Depending on the strategy of a particular AlphaScreen/AlphaLISA assay, additional experiments might need to be performed to identify other types of false-positive compounds that cannot be revealed by the TruHit kit. For instance, in the case of an AlphaScreen assay designed to detect an analyte using two antibodies, such as the secreted cytokine TNF-α, it is possible for a compound to act as a false positive hit by disrupting the interactions of either antibody with the analyte. These interference compounds can be distinguished by performing the AlphaScreen assay in the presence of purified TNF-α after the other false positive hits have been identified from the TruHit kit. In other cases, where a fusion protein has been linked to a bead through the use of an affinity tag, such as GST or polyhistidine, compounds could potentially disrupt those secondary detection interactions. If the other binding partner is biotinylated, products such as AlphaScreen Biotinylated-GST and Biotinylated-HIS are available to directly couple the donor and accepter beads and thus allow screening for interference compounds. In addition to the TruHit approach, cheminformatics filters can be applied using chemical substructure features such as the Pan Assay Interference Compounds (PAINS) filters identified by Baell, et al. [21].
Fig. 4.
Diagram of an AlphaScreen TruHit kit. A streptavidin donor bead interacts directly with a biotinylated acceptor bead to generate a signal in the absence of ligand. The kit can be used to identify false positive hits from a screen by detecting interference from compounds that mimic biotin, quench singlet oxygen, quench light and scattering light. The streptavidin-biotin complex (Protein Data Bank ID 3RY2) is represented with streptavidin as a ribbon diagram and biotin as spheres and was generated with the program PyMOL.
Fig. 5.
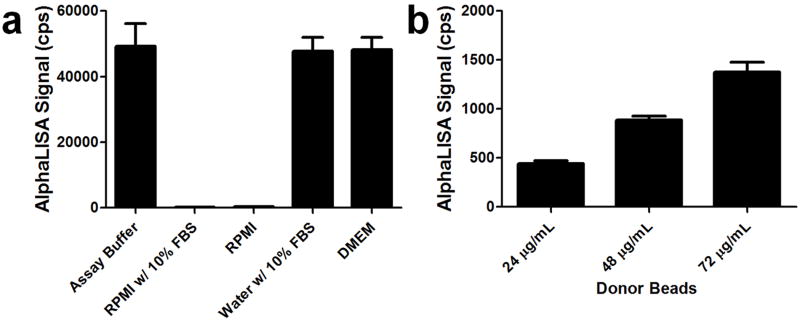
Media containing biotin, such as RPMI should be avoided when working with AlphaScreen reagents, due to interference with the streptavidin donor beads. Purified IL-1β (5.36 ng/mL) was suspended in the indicated solutions and detection was carried out with 6 μg/mL anti-IL-1β acceptor beads, 0.6 nM biotinylated anti-IL-1β antibody and 24 μg/mL donor beads in the wells of a 1,536-well plate (a). Increasing the concentration of streptavidin donor beads in the RPMI media (b), while maintaining the concentrations of the other AlphaLISA reagents as in (a) improves IL-1β detection, which is consistent with interference by biotin in the media.
Fig. 6.
Comparison of AlphaScreen data from the same plate before (a) and after (b) optimization of the plate reader. In this example, the wells of the plate were treated with only control compound (columns 3 (titration) and 4 (100% inhibition, n=32)) and DMSO (n=64, columns 1 and 2; n=1,408, columns 5–48). The signal from the wells is represented as a heat map, with red and purple corresponding to high and low signal, respectively. A gradient of signal is apparent prior to plate reader optimization (a) causing a %CV of 9.6% for 1,408 wells and a Z’ value of 0.68. Optimization of the reader for the plate dimensions clearly improved the results as seen by the uniform signal (b), a lowered %CV of 2.5% and an increased Z’ value of 0.9.
Fig. 7.
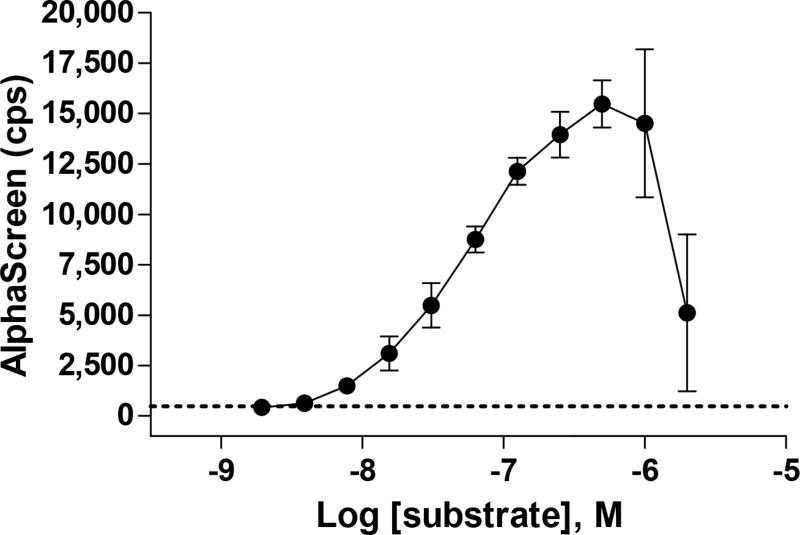
Results of a substrate titration for an AlphaScreen enzymatic assay to detect substrate depletion. With this assay format, substrate depletion causes a loss of signal. As expected, the signal is low with low substrate concentrations and increases until the point where the AlphaScreen beads are saturated. At high substrate concentrations, the signal is also reduced due to competition among substrate molecules that interferes with bead pairing, which has been referred to as the “hook effect”.
Fig. 8.
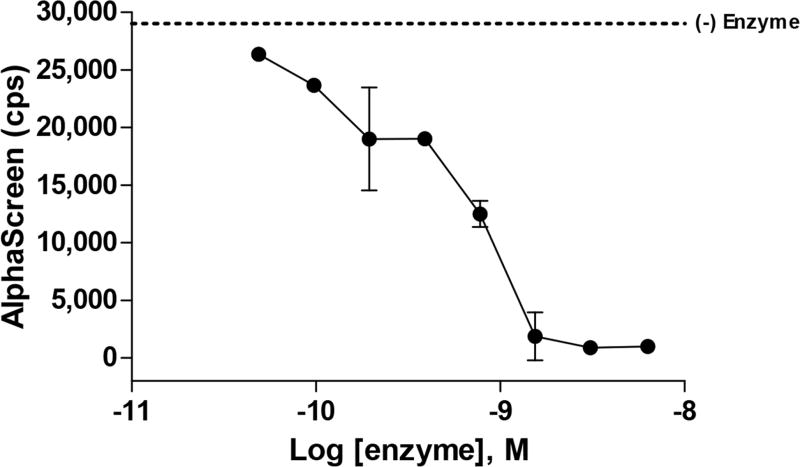
Results of an enzyme titration for an AlphaScreen enzymatic assay to detect substrate depletion after 30 minutes. The level of the “no enzyme control” (no substrate cleavage) is indicated by a dashed line. The results of this experiment can be used to determine the amount of substrate turnover for different concentrations of enzyme and various incubation periods. Thirty minutes was chosen as an incubation period for this assay to accommodate automation on a large scale.
Fig. 9.
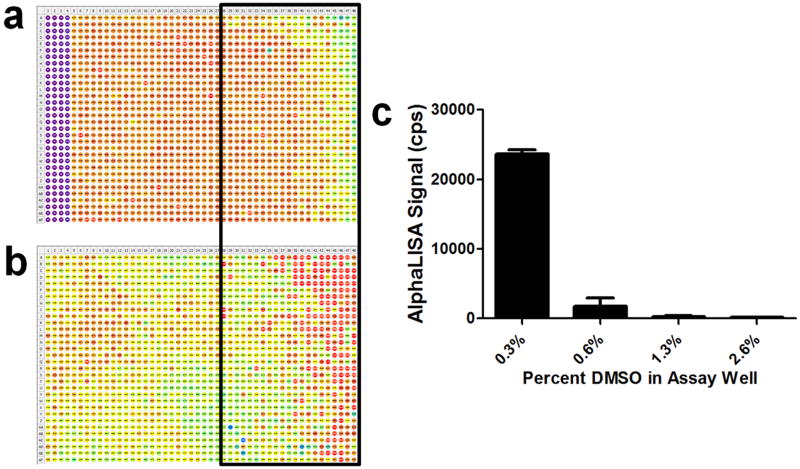
Evaluation of an assay plate treated with only control compound(s) and vehicle can help to identify sources of error. In this example, an AlphaLISA IL-1β assay was performed and the wells of the plate were treated with only control compound (n=128, columns 1–4) and DMSO (n=1,408, columns 5–48) (a). The signal from the wells is represented as a heat map, with red and purple corresponding to high and low signal, respectively. An irregular pattern associated with a lower signal was observed on the right side of the plate. After pin transferring dye into PBS buffer, a similar pattern was also observed that was consistent with greater delivery of dye on the right side of the plate (b). Therefore, the pattern in (a) was attributed to a greater delivery of DMSO to the wells on the right side of the plate based on the results in (b) and the DMSO sensitivity of the assay (c).
Fig. 10.
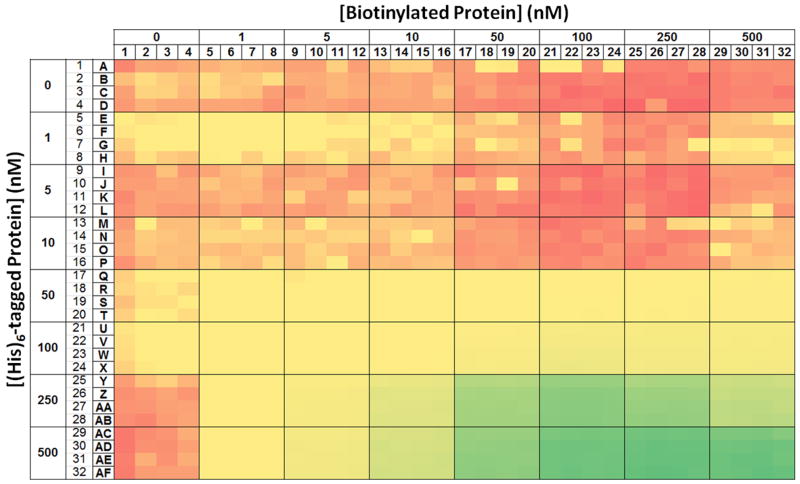
Results of an experiment to determine optimal concentrations of two proteins for an AlphaScreen assay. Eight concentrations of both hexahistidine-tagged protein (vertical axis) and biotinylated protein (horizontal axis) were examined in a matrix arrangement with 16 replicates per condition in a 1536-well plate. The signals from the wells are represented by a heat map, with red and green corresponding to low and high signal, respectively.
Fig. 11.
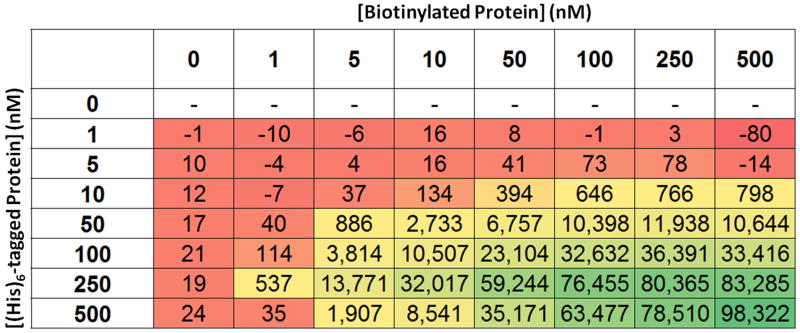
Mean signals from various combinations of protein concentrations were calculated from the data shown in Fig. 10. The mean signals (n=16) are colored as a heat map, with red and green corresponding to low and high signal, respectively.
Fig. 12.
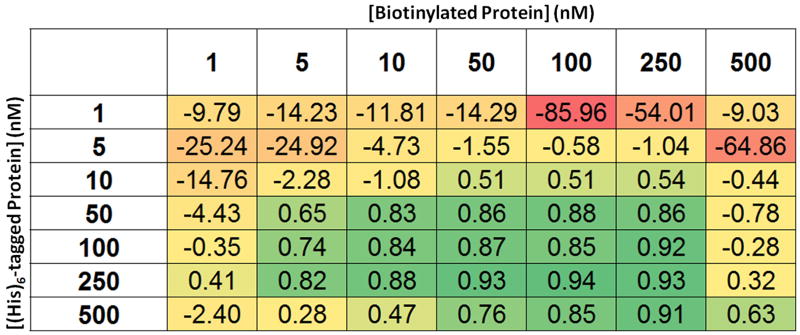
The Z’ values resulting from various combinations of protein concentrations were calculated from the data shown in Fig. 10. The Z′ values are colored as a heat map, with red and green corresponding to low and high, respectively. Based on these data, we chose to use 250 nM of polyhistidine-tagged protein and 100 nM of biotinylated protein.
Fig. 13.
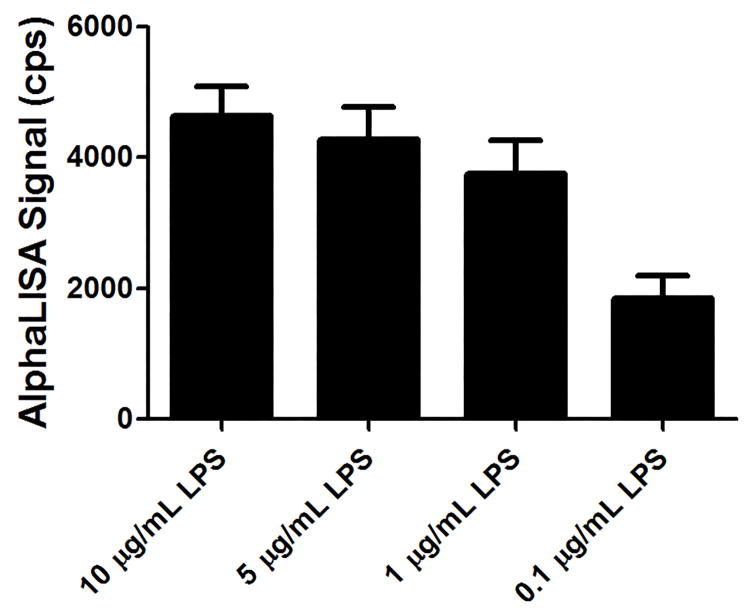
A titration of stimulation reagent should be performed to establish an optimal assay concentration. This graph shows the AlphaLISA signal associated with IL-1β detection from 3,000 THP-1 cells stimulated in 1,536-well plates with different concentrations of lipopolysaccharide (LPS) and incubated for 16 hours.
Acknowledgments
This work was supported by the NCATS Division of Pre-Clinical Innovation Intramural Program.
Footnotes
Buffer conditions that have already been established for a particular enzymatic reaction or protein-protein interaction can serve as a starting point for assay development. Sometimes it is possible to further improve an assay signal with modifications to the assay buffer, such as pH, buffering compound, salt, divalent cations, reducing agents, EDTA and BSA [22]. Also, the addition of a detergent, such as Triton X-100, Tween 20, NP-40 or Brij-35, at a concentration of ~0.01% will sometimes improve the assay signal by reducing protein adsorption to the surface of plate wells. Within the online technical resources under, “Bead selection and bead interference”, PerkinElmer provides detailed information about interferences caused by different buffer components for various bead types.
Note that any assay procedures which involve donor beads need to be performed under low light conditions (< 100 lux).
Accommodations can be made if a pin-tool, acoustic liquid dispenser or other liquid handling device capable of accurately transferring nanoliter volumes is not available. In this case, one could achieve the 174-fold dilution from a DMSO stock solution by making appropriate dilutions into the assay buffer or media. Each compound should be delivered as a 4- or 5-fold concentrated solution in a 1 μL volume to assay volumes of 3 μL or 4 μL, respectively, to achieve the final concentration. The delivery could be made with a 16-channel pipettor.
The use of media that contains biotin, such as RPMI, should be avoided as it will compete with the biotin-conjugated antibodies for the streptavidin donor beads and ultimately reduce the assay signal (Fig. 5). Also, when working with terbium-containing acceptor beads, which emit at 545 nm, we have observed a 50% decrease in signal when using media containing phenol red as compared to phenol red-free media. Finally, before preparing cells for an experiment, it is recommended to use a cell strainer.
It is important to verify both prior to and throughout the process of working with AlphaScreen/AlphaLISA assays that the plate reader settings have been optimized for use with the assay being developed. AlphaScreen Omnibeads are intended to provide a strong signal in the absence of acceptor beads and therefore can be used to calibrate instruments. The importance of instrument optimization can be illustrated with an example from our center, where the same 1536-well plate was read before and after optimizing the settings of the plate reader. In this example, the wells of the AlphaScreen assay plate were treated with only control compound (n=32) and DMSO (n=1,408). Optimization of the reader for the plate dimensions improved the %CV from 9.6% to 2.5% and the Z’ value from 0.68 to 0.9 (Fig. 6).
Detailed information about developing enzymatic assays for high throughput screening, including measuring the KM, can be found in the Assay Guidance Manual [22].
Low concentrations of substrate will result in low signal, which will increase with substrate concentration. At high substrate concentrations, the signal will again be reduced due to competition with substrate that does not result in bead pairing, which has been referred to as the “hook effect” (Fig. 7) [23]. Also, the concentration of donor and acceptor beads can be optimized for individual assays.
This experiment will determine the amount of enzyme required to achieve a robust assay signal (Fig. 8). In principle, this experiment could be performed as a two-dimensional matrix that also incorporates the substrate titration described in the previous note; however, the substrate will need to be applied with a liquid dispenser capable of delivering reagent to each of the wells simultaneously to allow comparison of the kinetics.
After an assay has been optimized, the tolerance to DMSO (or another vehicle used to solubilize compounds) should be established with a titration of vehicle into the assay mixture. Also, prior to screening with an optimized AlphaScreen/AlphaLISA assay, it is critical to evaluate the results of a plate treated with only DMSO and control compound(s). In one instance, we were able to link an irregular pattern in the DMSO-treated plate to inconsistent vehicle transfer by the automated pin-tool used to deliver compounds. The AlphaLISA assay results showed a low signal on the right side of the plate (Fig. 9A), whereas pin-transferring dye into PBS with the same pin-tool showed a higher transfer of dye on the right side (Fig. 9B). The DMSO tolerance experiment demonstrated that the assay signal was inhibited by and sensitive to DMSO (Fig. 9C).
The final enzyme concentration will need to be pre-determined based on the enzymatic activity (see Note6), which might vary among preparations/batches.
This protocol suggests a “no enzyme control” in columns 3 and 4, which can be used if there are no known inhibitors. Alternatively, if an inhibitor exists, enzyme would be included in all columns and the inhibitor compound(s) would be applied in columns 3 and 4. For instance, a titration series might be introduced in column 3 and the wells of column 4 would contain a concentration that results in 100% inhibition (see Note12).
At our center, we include high and low controls in columns 1–4 with library compounds in columns 5–48. A range for final library compound concentrations would be 3 nM – 57 μM after a 174-fold dilution.
The final substrate concentration will need to be pre-determined (see Note6) and is often used at the KM in order to be optimally sensitive to different mechanisms of inhibition [22].
The suggested excitation and measurement times will allow sensitive detection at the expense of time. Therefore, the settings can be optimized for individual assays depending on the assay signal. When using white plates, high signals will carry over to some extent into neighboring wells.
Depending on the chosen affinity tags for each protein, it is possible to evaluate the signal window before assay optimization by using commercially available products, such as AlphaScreen Biotinylated-GST and Biotinylated-HIS. We have observed that the assay signal window for a protein-protein interaction can vary depending on the affinity tag selected [15]. Therefore, one might choose to test several affinity tags before beginning the process of assay optimization. After the affinity tags for the two proteins have been selected, assay development can proceed. In order to determine the minimal concentrations of each protein required to achieve robust assay results, one should first perform a matrix titration in a 1536-well plate to systematically determine the assay signal from different concentrations of each protein in assay buffer with a fixed concentration of AlphaScreen reagents. The plate can be set up to compare 8 concentrations, including zero, of each protein in a matrix with 16 replicates per condition (Fig. 10). Mean values and standard deviations for each of the 16 replicates will then be calculated from the data (Fig. 11). This information allows calculation of the Z′ statistic, which can be used to select the minimal protein concentrations that result in robust assay performance (Fig. 12) [24]. Based on the example data shown, we chose to use 250 nM of polyhistidine-tagged protein and 100 nM of biotinylated protein. Secondly, the concentrations of donor and acceptor beads can be optimized.
This example suggests a “no protein partner control”. Alternatively, if an inhibitor compound or peptide is used, the protein will be delivered to columns 1–48. In that case, the inhibitor can be applied to columns 3 and 4. For instance, a titration series might be introduced in column 3 and the wells of column 4 would contain a concentration that results in 100% inhibition (see Note12).
Optimizations include determining the optimal cell number per well, the optimal concentration of stimulation compound (Fig. 13) and the optimal incubation period following cell stimulation. Additionally, the concentrations of donor and acceptor beads can be optimized.
This example suggests an “unstimulated control”. Alternatively, if an inhibitor compound is used, LPS can be delivered to columns 1–48. In that case, the inhibitor can be applied to columns 3 and 4. For instance, a titration series might be introduced in column 3 and the wells of column 4 would contain a concentration that results in 100% inhibition (see Note12).
References
- 1.Ullman EF, Kirakossian H, Singh S, Wu ZP, Irvin BR, Pease JS, Switchenko AC, Irvine JD, Dafforn A, Skold CN, et al. Luminescent oxygen channeling immunoassay: measurement of particle binding kinetics by chemiluminescence. Proc Natl Acad Sci U S A. 1994;91(12):5426–5430. doi: 10.1073/pnas.91.12.5426. [DOI] [PMC free article] [PubMed] [Google Scholar]
- 2.Peppard J, Glickman F, He Y, Hu SI, Doughty J, Goldberg R. Development of a high-throughput screening assay for inhibitors of aggrecan cleavage using luminescent oxygen channeling (AlphaScreen) J Biomol Screen. 2003;8(2):149–156. doi: 10.1177/1087057103252308. [DOI] [PubMed] [Google Scholar]
- 3.Eglen RM, Reisine T, Roby P, Rouleau N, Illy C, Bosse R, Bielefeld M. The use of AlphaScreen technology in HTS: current status. Curr Chem Genomics. 2008;1:2–10. doi: 10.2174/1875397300801010002. [DOI] [PMC free article] [PubMed] [Google Scholar]
- 4.Wan Y, Xhang X, Atherton JJ, Kostner K, Dimeski G, Punyadeera C. A multimarker approach to diagnose and stratify heart failure. Int J Cardiol. 2015;181:369–375. doi: 10.1016/j.ijcard.2014.12.052. [DOI] [PubMed] [Google Scholar]
- 5.Zhang X, Dimeski G, Punyadeera C. Validation of an immunoassay to measure plasminogen-activator inhibitor-1 concentrations in human saliva. Biochem Med (Zagreb) 2014;24(2):258–265. doi: 10.11613/BM.2014.028. [DOI] [PMC free article] [PubMed] [Google Scholar]
- 6.Zhang X, Wan Y, Cooper-White J, Dimeski G, Atherton J, Punyadeera C. Quantification of D-dimer levels in human saliva. Bioanalysis. 2013;5(18):2249–2256. doi: 10.4155/bio.13.190. [DOI] [PubMed] [Google Scholar]
- 7.He A, Liu TC, Dong ZN, Ren ZQ, Hou JY, Li M, Wu YS. A novel immunoassay for the quantization of CYFRA 21-1 in human serum. J Clin Lab Anal. 2013;27(4):277–283. doi: 10.1002/jcla.21597. [DOI] [PMC free article] [PubMed] [Google Scholar]
- 8.Dynon K, Heng S, Puryer M, Li Y, Walton K, Endo Y, Nie G. HtrA3 as an early marker for preeclampsia: specific monoclonal antibodies and sensitive high-throughput assays for serum screening. PLoS One. 2012;7(9):e45956. doi: 10.1371/journal.pone.0045956. [DOI] [PMC free article] [PubMed] [Google Scholar]
- 9.Marchand C, Lea WA, Jadhav A, Dexheimer TS, Austin CP, Inglese J, Pommier Y, Simeonov A. Identification of phosphotyrosine mimetic inhibitors of human tyrosyl-DNA phosphodiesterase I by a novel AlphaScreen high-throughput assay. Mol Cancer Ther. 2009;8(1):240–248. doi: 10.1158/1535-7163.MCT-08-0878. [DOI] [PMC free article] [PubMed] [Google Scholar]
- 10.Dorjsuren D, Kim D, Maloney DJ, Wilson DM, 3rd, Simeonov A. Complementary nonradioactive assays for investigation of human flap endonuclease 1 activity. Nucleic Acids Res. 2011;39(2):e11. doi: 10.1093/nar/gkq1082. [DOI] [PMC free article] [PubMed] [Google Scholar]
- 11.Leister KP, Huang R, Goodwin BL, Chen A, Austin CP, Xia M. Two High Throughput Screen Assays for Measurement of TNF-alpha in THP-1 Cells. Curr Chem Genomics. 2011;5:21–29. doi: 10.2174/1875397301105010021. [DOI] [PMC free article] [PubMed] [Google Scholar]
- 12.Dehdashti SJ, Zheng W, Gever JR, Wilhelm R, Nguyen DT, Sittampalam G, McKew JC, Austin CP, Prusiner SB. A high-throughput screening assay for determining cellular levels of total tau protein. Curr Alzheimer Res. 2013;10(7):679–687. doi: 10.2174/15672050113109990143. [DOI] [PMC free article] [PubMed] [Google Scholar]
- 13.Liu F, Chen X, Allali-Hassani A, Quinn AM, Wigle TJ, Wasney GA, Dong A, Senisterra G, Chau I, Siarheyeva A, Norris JL, Kireev DB, Jadhav A, Herold JM, Janzen WP, Arrowsmith CH, Frye SV, Brown PJ, Simeonov A, Vedadi M, Jin J. Protein lysine methyltransferase G9a inhibitors: design, synthesis, and structure activity relationships of 2,4-diamino-7-aminoalkoxy-quinazolines. J Med Chem. 2010;53(15):5844–5857. doi: 10.1021/jm100478y. [DOI] [PMC free article] [PubMed] [Google Scholar]
- 14.Quinn AM, Allali-Hassani A, Vedadi M, Simeonov A. A chemiluminescence-based method for identification of histone lysine methyltransferase inhibitors. Mol Biosyst. 2010;6(5):782–788. doi: 10.1039/b921912a. [DOI] [PMC free article] [PubMed] [Google Scholar]
- 15.Quinn AM, Bedford MT, Espejo A, Spannhoff A, Austin CP, Oppermann U, Simeonov A. A homogeneous method for investigation of methylation-dependent protein-protein interactions in epigenetics. Nucleic Acids Res. 2010;38(2):e11. doi: 10.1093/nar/gkp899. [DOI] [PMC free article] [PubMed] [Google Scholar]
- 16.Yi F, Zhu P, Southall N, Inglese J, Austin CP, Zheng W, Regan L. An AlphaScreen-based high-throughput screen to identify inhibitors of Hsp90-cochaperone interaction. J Biomol Screen. 2009;14(3):273–281. doi: 10.1177/1087057108330114. [DOI] [PMC free article] [PubMed] [Google Scholar]
- 17.Yi F, Regan L. A novel class of small molecule inhibitors of Hsp90. ACS Chem Biol. 2008;3(10):645–654. doi: 10.1021/cb800162x. [DOI] [PMC free article] [PubMed] [Google Scholar]
- 18.Srinivasan P, Yasgar A, Luci DK, Beatty WL, Hu X, Andersen J, Narum DL, Moch JK, Sun H, Haynes JD, Maloney DJ, Jadhav A, Simeonov A, Miller LH. Disrupting malaria parasite AMA1-RON2 interaction with a small molecule prevents erythrocyte invasion. Nat Commun. 2013;4:2261. doi: 10.1038/ncomms3261. [DOI] [PMC free article] [PubMed] [Google Scholar]
- 19.Cunningham L, Finckbeiner S, Hyde RK, Southall N, Marugan J, Yedavalli VR, Dehdashti SJ, Reinhold WC, Alemu L, Zhao L, Yeh JR, Sood R, Pommier Y, Austin CP, Jeang KT, Zheng W, Liu P. Identification of benzodiazepine Ro5-3335 as an inhibitor of CBF leukemia through quantitative high throughput screen against RUNX1-CBFbeta interaction. Proc Natl Acad Sci U S A. 2012;109(36):14592–14597. doi: 10.1073/pnas.1200037109. [DOI] [PMC free article] [PubMed] [Google Scholar]
- 20.Chen CZ, Sobczak K, Hoskins J, Southall N, Marugan JJ, Zheng W, Thornton CA, Austin CP. Two high-throughput screening assays for aberrant RNA-protein interactions in myotonic dystrophy type 1. Anal Bioanal Chem. 2012;402(5):1889–1898. doi: 10.1007/s00216-011-5604-0. [DOI] [PMC free article] [PubMed] [Google Scholar]
- 21.Baell JB, Holloway GA. New substructure filters for removal of pan assay interference compounds (PAINS) from screening libraries and for their exclusion in bioassays. J Med Chem. 2010;53(7):2719–2740. doi: 10.1021/jm901137j. [DOI] [PubMed] [Google Scholar]
- 22.Brooks HB, Geeganage S, Kahl SD, Montrose C, Sittampalam S, Smith MC, Weidner JR. In: Basics of Enzymatic Assays for HTS. Sittampalam GS, Gal-Edd N, Arkin M, et al., editors. Assay Guidance Manual; Bethesda (MD): 2004. [Google Scholar]
- 23.Newton P, Harrison P, Clulow S. A novel method for determination of the affinity of protein: protein interactions in homogeneous assays. J Biomol Screen. 2008;13(7):674–682. doi: 10.1177/1087057108321086. [DOI] [PubMed] [Google Scholar]
- 24.Zhang JH, Chung TD, Oldenburg KR. A Simple Statistical Parameter for Use in Evaluation and Validation of High Throughput Screening Assays. J Biomol Screen. 1999;4(2):67–73. doi: 10.1177/108705719900400206. [DOI] [PubMed] [Google Scholar]


