

Abstract
Goal
Our objective is to provide a framework for extracting signals of interest from the wearable seismocardiogram (SCG) measured during walking at normal (subject’s preferred pace) and moderately-fast (1.34 – 1.45 m/s) speeds.
Methods
We demonstrate, using empirical mode decomposition (EMD) and feature tracking algorithms, that the pre-ejection period (PEP) can be accurately estimated from a wearable patch that simultaneously measures electrocardiogram (ECG) and sternal acceleration signals. We also provide a method to determine the minimum number of heartbeats required for an accurate estimate to be obtained for the PEP from the accelerometer signals during walking.
Results
The EMD-based de-noising approach provides a statistically significant increase in the signal-to-noise ratio (SNR) of wearable SCG signals and also improves estimation of PEP during walking.
Conclusion
The algorithms described in this paper can be used to provide hemodynamic assessment from wearable SCG during walking.
Significance
A major limitation in the use of the SCG, a measure of local chest vibrations caused by cardiac ejection of blood in the vasculature, is that a user must remain completely still for high quality measurements. The motion can create artifacts and practically render the signal unreadable. Addressing this limitation could allow, for the first time, SCG measurements to be obtained reliably during movement—aside from increasing the coverage throughout the day of cardiovascular monitoring, analyzing SCG signals during movement would quantify the cardiovascular system’s response to stress (exercise), and thus provide a more holistic assessment of overall health.
Index Terms: Wearable technology, smart and connected health, seismocardiography, empirical mode decomposition
I. Introduction
Enabling cardiovascular health monitoring around the clock both for patients with cardiovascular diseases (CVDs)—for ‘disease management’—and for healthy persons—to potentially provide early detection and prevention of CVDs—is a major focus in the field of wearable technology. The prevalence of CVDs is increasing in the U.S. and worldwide: according to American Heart Association (AHA), approximately 25% of the US population suffers from some sort of CVD and this number is expected to reach 40% in the coming decade. At the same time, the costs associated with CVDs are expected to increase from $320 billion to $1 trillion [1]. Improving the continuity of care via continuous monitoring as well as enabling early detection and prevention of CVDs can potentially reduce both the prevalence of and costs associated with CVD.
Myriad non-invasive wearable systems for health monitoring have been developed recently in research and commercial settings, including devices that monitor cardiac electrophysiology (e.g., heart rate and rhythm monitors) [2]. Additionally, several groups are actively researching wearable technologies for monitoring the mechanical aspects of cardiovascular health, such as left ventricular function (e.g., cardiac output and systolic time intervals, STIs [3]), blood pressure [4], and vascular health (e.g., pulse wave velocity [5]).
One sensing modality for assessing the latter—mechanical aspects of cardiovascular function—is ballistocardiography (BCG), a measurement of the vibrations of the body that result from cardiac ejection and movement of the blood throughout the vascular tree. These body vibrations can be measured with inexpensive and miniature accelerometers, built into small and convenient wearable form factors, from different locations on the body such as the ear, wrist and arm [6]–[9]. BCG derived features have been shown to correlate well with STIs such as the pre-ejection period (PEP) [10], [11]. If the accelerometer for measuring body vibrations is placed on the surface of the chest, then the convention in the literature is that the acquired signals are named the seismocardiogram (SCG) [12]–[15]. These chest vibrations are due to the movements of the heart and blood; it should be noted though, that the accelerometer on the chest can also detect vibrations associated with the closure of the valves in frequency bands higher than the SCG (frequency > 20 Hz) [16].
A major challenge for SCG and other mechanical measurements of cardiovascular function is that high fidelity signals can only be obtained when the user is stationary. Motion artifacts related to walking or other types of movements can reduce the signal-to-noise ratio (SNR) and even sometimes render the measured signals unreadable. Hence, most of the prior research on wearable sensing of the mechanical aspects of cardiovascular function has focused on measurements in the resting state only, or during recovery following a perturbation such as exercise. In particular, enabling the estimation of STIs during movement, when the cardiovascular system is stressed due to the increased demands of the skeletal muscles and skin for blood flow, can likely provide deeper insight into cardiovascular function for patients with CVD than measurements at rest alone. SCG measurements can potentially address this compelling need, provided that motion artifacts can be adequately reduced, and a framework for objectively determining the quality of measurements during motion is developed.
In this paper, we use a small wearable patch adhered on the sternum to simultaneously measure electrocardiogram (ECG) and SCG signals during walking at different speeds. We focused initially on walking, since it is the most common form of motion that nearly all people perform during the day, and is the basis for the commonly-used clinical stress test named the 6-minute walk test [17], [18]. The 6-minute walk test has emerged as a non-invasive and inexpensive method for assessment of submaximal exercise capacity of patients with heart failure (HF) [18]. Studies have shown that different parameters obtained from the test, such as walking distance and left ventricle ejection fraction, can provide prognosis of the disease in patients with HF [19], [20].
The objectives of this research were: (1) to provide a framework, using data driven methods such as empirical mode decomposition (EMD) [21]–[23], to reduce motion-artifact corruption in the SCG signals during walking, (2) to compare the performance of the SCG with a state-of-the-art, commercially available impedance cardiogram (ICG) sensor for estimation of PEP during walking, and (3) to provide a method to objectively determine the minimum number of heartbeats before an accurate estimate of PEP can be generated using feature detection techniques. This work focuses on methods that can be used with SCG signals, but can also be extended to other sensing modalities such as photoplethysmography (PPG) for de-noising signals during walking and, concordantly, assessing cardiovascular and respiratory health.
II. Methods
A. Protocol
Data were collected from 17 young, healthy subjects (Gender: 11 males and 6 females, Age: 25±4 years, Weight: 72.5±13.6 kg and Height: 1.7±0.1 m) under a protocol approved by the Institutional Review Board at the Georgia Institute of Technology. The protocol was divided into three different phases to analyze how both surface and speed of walking affects the measured acceleration signals. These three phases are explained below:
Phase 1: Walking on level ground at the subject’s normal pace for 6 minutes, followed by 2 minutes of recovery.
Phase 2: Walking on a treadmill at 1.34 m/s for 5 minutes, followed by 1–2 minutes of recovery.
Phase 3: Walking on level ground at a brisk pace for 5 minutes, followed by 1 minute of recovery. Specifically, the walking speed during this test was estimated to be 1.45±0.13 m/s.
Walking in each phase was preceded by a baseline reading in which each subject was asked to stand upright in a resting state for 1 minute. However, only 3 subjects completed all three phases, while another 7 subjects participated in both normal and treadmill walking. The remaining 7 subjects only completed the last part of the protocol that involved walking at a brisk pace on level ground. The subjects who completed more than one phase of the protocol were given 10–15 minutes of resting time between different phases.
B. Hardware
In all sets of data, the ECG and acceleration signals were collected with a novel wearable patch as shown in Fig. 1. The wearable patch, an improvement upon our previous version described in [13], recorded data onto a micro Secure Digital (micro-SD) card. The patch housed an ATMEGA1284P micro-controller (Atmel Corporation, San Jose, CA). The ECG sensor used an analog-front-end (AFE) integrated circuit with an on-board analog-to-digital converter (ADS1291, Texas Instruments, Dallas, TX) while BMA280 (Bosch Sensortec GmbH, Reutlingen, Germany) was selected for the accelerometer in the patch. The patch, along with 3 pre-gelled electrodes, weighed 38.2 g. Along with the wearable device, ECG and ICG signals were also measured using the BNEL50 and BN-NICO wireless measurement modules (BIOPAC Systems, Inc., Goleta, CA) to provide a reference gold-standard for the assessment of PEP. All the signals from both the custom wearable patch and Biopac sensors were sampled at 1 kHz. They were synchronized by tapping both the sensors before and after the start of measurements for all types of walking, and performing re-sampling in post-processing accordingly.
Fig. 1.

Wearable device used for the collection of ECG and SCG signals. (a) The backside of the device showing three slots for attachment of adhesive electrodes. (b) The inside of the device houses a slot for a micro-SD card and a battery. The data can be read via the micro-USB port. (c) The placement of the wearable device on the sternum with adhesive electrodes.
C. Pre-Processing of Data
The signals from the Biopac and wearable patch sensors were aligned using the tapping artifacts introduced at the beginning and end of each recording. The ECG signals from both the sensors were time-stamped. Once the tapping artifacts were manually determined at the beginning of the recording, the ECG R-peaks were detected from both ECG signals. The peaks were then aligned and the signals between these were re-sampled, using cubic interpolation, to have equal numbers of samples. However, during walking, sometimes noise was present in the ECG signal from one sensor and not in the other. Hence, the signals were manually checked and time axis information was also utilized to obtain correct synchronization. The ECG, ICG and accelerometer signals were band-pass filtered using finite impulse response (FIR) filters (Kaiser window, cut-off frequencies: 0.8 – 40 Hz for the ECG, and, 0.8 – 35 Hz for the ICG and dorso-ventral (D-V) component of acceleration signals) as shown in Fig. 2(a). Once all the signals were filtered, the D-V and ICG signals were segmented into individual frames called ‘heartbeats’ using the ECG R-peaks from the corresponding ECG signals. The collection of extracted frames, called an ensemble, were averaged to obtain ensemble-averaged traces with reduced noise as compared to individual heartbeats. The averaged traces can either be obtained using a specific number of heartbeats in an ensemble or by defining an ensemble in the form of an interval and averaging heartbeats present in it [24]. Both of these approaches were implemented in this paper and are explained below:
Fig. 2.

(a) Block diagram of the setup. Data, which comprised of walking at normal speed (the speed at which each subject usually walked), walking at 1.34 m/s on the treadmill and walking at a brisk pace on level ground, were collected from 17 healthy subjects. The data from both wearable patch and Biopac sensors were bandpass filtered (BPF) and segmented into individual heartbeats which were averaged to reduce noise. (b) 5-second waveforms from accelerometer during different types of walking for a representative subject.
Interval-Based Ensemble Averaging: The ECG R-peaks Ri (i is the peak number) in 30-second, non-overlapping intervals were detected using a peak detection algorithm. Specifically, a constant threshold (γ) of 50% of the maximum amplitude of the filtered ECG was computed for each subject and peaks greater in amplitude than γ were then located automatically and annotated as R-waves. The R-waves found to be closer than 300 ms to each other were discarded as false positives and results were manually validated to correct for errors. With Ri as fiduciary points, Ri + l ms frames, where l was the frame size, were extracted from the accelerometer and ICG sensors. The frame size l was estimated as the minimum R-R interval in the 30-second interval.
Heartbeat-Based Ensemble Averaging: In this approach, ECG R-peaks were detected during the walking and recovery phases using the same algorithm and approach discussed previously. A window of NR R-peaks was chosen and the minimum R-R interval l was calculated from these R-peaks. Again, using these peaks as reference points and l, the corresponding portions of ICG and D-V signals were segmented into individual frames which were averaged to obtain ensemble-averaged traces. The window of NR was slid forward with 25% overlap and the process was continued until the whole recording was segmented into averaged traces.
The D-V and ICG signals during the 1-minute resting period were also segmented using the corresponding ECG R-peaks. However, all the frames in the resting period were averaged to obtain one averaged waveform for the baseline reading for each subject. Moreover, if noise was present in the ECG signal from any sensor during the walking period, then the corresponding data were not used in the ensemble averaging operation.
D. Analysis of Noise Energy during Walking
Walking induced amplitude distortion in the accelerometer signal. Fig. 2(b) shows a 5-second D-V signal during three different phases of the protocol for the same subject. It can be observed that walking at a normal pace induced less amplitude distortion in the measured signal. In order to further investigate this observation, the data during the walking portion of each phase of the protocol were separated and mean squared energy was estimated from the D-V signal. The mean squared energy was simply estimated as the mean of squared samples in the D-V signal for each subject during walking. Let Ek denote the mean squared energy, where k represents the subject number. The mean (μE) and standard deviation (σE) were calculated for all subjects.
E. De-Noising of Walking Heartbeats using Empirical Mode Decomposition (EMD)
Empirical mode decomposition, an analytical and adaptive method, involves breaking down or decomposing a signal into components, and was developed by Huang et. al for the analysis of non-stationary signals [21]. The components which are obtained after EMD are specific only to the signal from which they are generated. Specifically, EMD decomposes a non-stationary signal into a set of amplitude modulated (AM) and frequency modulated (FM) tones [22], [25], and these generated components are called intrinsic mode functions (imfs). The algorithm for obtaining the imfs from the given signal x is given below [22]:
Extract the local maxima and minima in the signal x.
Form the upper eu and lower el envelopes of the signal from interpolation of maxima and minima, respectively.
Estimate the mean of the two envelopes, i.e., em = (eu+ el)/2.
Subtract em from x, i.e., h = x − em.
Repeat steps 1–4 on h, i.e., x = h.
The above steps (1–5) are called the sifting process and are repeated until h becomes a zero-mean signal and the number of maxima and minima differ at most by one from the number of zero-crossings [25]. The thresholds indicated in [25] for the evaluation of zero-mean signals are used for stopping criteria of the sifting process. Once the sifting process is completed, the signal h yields the first intrinsic mode function (imf ). Let the first imf be denoted by I1. This imf is subtracted from x to obtain the residue r1 and the steps (1–5) are repeated on r1 to obtain the second intrinsic mode function. The process of generating imfs can be stopped if the residue becomes a monotone from which no further imfs can be generated. Thus, the signal can be decomposed into a finite number of components and can be reconstructed using the equation .
In this paper, EMD was used to decompose the ensemble-averaged D-V heartbeat during the walking phase into imfs as shown in Fig. 3(a). Each ensemble-averaged walking heartbeat produced 4 or 5 imfs. However, as shown in Fig. 3(a), only the first imf closely resembled the resting state D-V heartbeat and thus was used for further analysis and feature extraction. Fig. 3(b) and (c) also show 30-second ensemble-averaged noisy heartbeats from the same subject during different phases of walking and their de-noised version after the application of EMD algorithm.
Fig. 3.

(a) De-noising of the D-V heartbeat during walking using EMD algorithm. Four to five imfs (Im, where m = 1, 2, ...,) were generated after the application of EMD. The first imf (I1) was chosen as the de-noised D-V heartbeat for feature extraction. (b) Noisy heartbeats for walking at different speeds. (c) The first imf obtained after application of EMD to the noisy heartbeats in (b). The basic shape and characteristics of the SCG waveform are reconstructed accurately.
In order to assess the improvement in signal quality before and after the application of EMD, dynamic time warping (DTW) was employed to find structural likeness between the walking heartbeats and resting heartbeat for each subject. DTW is a time series alignment method used to find similarities between two time series [26]. The warping distance between the first 400 ms of each ensemble-averaged walking heartbeat and the resting heartbeat was calculated. The reason for only using the 400 ms portion was to make sure that an equal number of samples are used in the DTW process for all subjects since the heartbeat / frame size depended on the R-R interval for each subject and thus varied in each ensemble. Also, the objective was to assess structural similarity, hence no adjustment window parameter was defined for the estimation of the best warping path. Let this warping distance be denoted by dα. The warping distance was also calculated between the walking heartbeat, after the application of EMD, and the resting heartbeat and was denoted by dβ. The process was repeated for all subjects and for user-specific, 1.34 m/s and brisk pace walking data sets. The mean and standard deviation was calculated for dα and dβ for all subjects and for all data sets.
F. Aortic Valve Opening Detection and Tracking
The typical method of feature detection from the D-V acceleration data involves detection of maxima or minima in the D-V heartbeat [3]. In this study, a feature or point corresponding to the opening of the aortic valve (AO) was detected from the heartbeats in the resting state for each subject and the same feature was tracked during the walking and recovery phases. The maximum or minimum with the highest absolute magnitude in the first 150 ms of the heartbeat (as expected for aortic valve opening based on the physiology) was selected as a feature and denoted by fa. Note that we shall refer to the selected feature (maximum or minimum) as a peak in the rest of the paper. Since we focused on the relative changes in AO during walking and recovery for each subject, the AO-marker (maximum or minimum) with highest amplitude constitutes the most prominent feature in that half of the heartbeat / waveforms and is hence easier to detect without errors. The peak from this first segment was defined by two attributes that were used for identifying similar peaks in the motion-artifact corrupted signals acquired during walking: (1) its position in the frame denoted by pa, i.e., the position of maximum or minimum which ever one was chosen on the basis of absolute magnitude, and (2) the sign of the maximum or minimum. A ‘+’ sign was used if the selected peak was a maximum while a ‘−’ sign was used if a minimum was selected as the peak. The time difference between fa and the ECG R-peak was estimated as the PEP. The choice of the most prominent feature (maximum or minimum) does not give the absolute PEP values but it facilitates in tracking of relative changes in PEP values during exercise.
In the walking (after the application of the EMD algorithm) and the recovery heartbeats, the AO point was detected by tracking the peak selected initially from the resting heartbeat. Specifically, we searched for a peak with same sign as fa and around the position pa of fa as shown in Fig. 4. The peak which was closest to pa was chosen as the desired AO point, denoted by in the walking and recovery heartbeats. In case two peaks were found closer to fa, the preference was given to the peak on the left, i.e., the peak whose position was less than pa was chosen as the AO point. The reason for this was that a decrease in contractility (or, in other words, an increase in PEP) is very unlikely during exercise, and thus setting the earlier peak as the preferred selection is more physiologically sound [27].
Fig. 4.
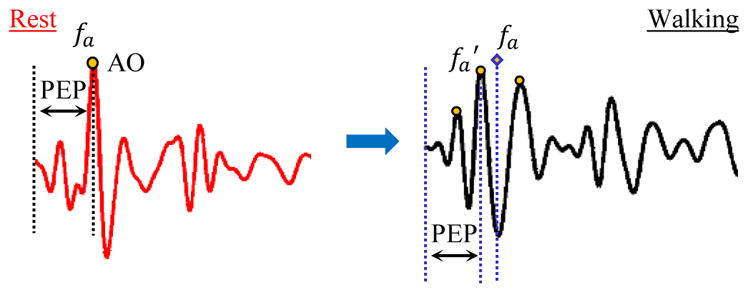
Detecting and tracking AO point in the D-V heartbeats. The AO point, denoted by fa and specified by sign (+ or −) and position pa, was detected as the maximum or minimum with highest absolute amplitude in the resting heartbeat. During walking, the first imf was selected as the clean heartbeat. The AO point in the selected imf was chosen as the peak closest to fa and with similar sign. fa was used as a reference for correct detection of AO-marker in the de-noised heartbeat.
G. Comparison of ICG and SCG Data
In order to compare the ICG and SCG data, the ICG heartbeats from the Biopac were partitioned using the interval-based ensemble averaging method to obtain ensemble-averaged traces. Since the data from the Biopac and the wearable patch sensor were time-synchronized, the ensemble averaged D-V heartbeats were obtained from the SCG data. In order to detect the B-point on the ICG ensemble-averaged heartbeats, the heartbeats were twice differentiated with a Savitzky-Golay filter [11]. The position of the global peak in the double-differentiated signal was chosen as the B-point and the time difference between this peak and the ECG R-peak was estimated as the PEP from the ICG. The PEP values estimated from ICG waveforms during walking and recovery for each subject were normalized by the resting PEP value and denoted by .
The PEP from the SCG was estimated as the time difference between the AO point and the ECG R-peak. The resting PEP value for each subject was used to normalize the corresponding walking and recovery PEP values and were denoted by .
H. Quantitative Determination of Ensemble Size
Based on the ICG and SCG comparison, a method was devised to estimate the minimum ensemble size in terms of number of heartbeats required for the SCG data to yield accurate estimation of PEP intervals. In resting conditions, ensemble averaging is usually performed by using as many beats as are available, such that the extraction of features can be as accurate as possible. It is assumed that the cardiovascular state is relatively static, and thus a single ensemble average can capture all of the information required for assessing that state. However, during exercise, the cardiovascular state is changing dynamically, with heart rate, contractility, and stroke volume typically increasing to meet the increased demands of the skeletal muscles and skin for blood flow. This presents a major challenge from a feature extraction standpoint. On one hand, capturing the transient information associated with these changes—such as the time constant with which PEP decreases at a given exercise intensity—can provide deep information regarding cardiovascular health, and the ability of the cardiovascular system to respond to the stress of exercise; thus, not using ensemble averaging at all would be ideal as one would obtain beat-by-beat information regarding these transients. On the other hand, motion artifacts are more significant during exercise and thus the noise and interference in the data is more substantial; thus, using ensemble averages with a high number of beats would be ideal as one would provide the maximal reduction of such noise and interference in the measured signals. We therefore aimed to provide a data-driven methodology for objectively determining the optimal number of beats that should be used in ensemble averaging during exercise for the SCG signals.
The optimum ensemble size for each subject was determined using the heartbeat-based ensemble averaging approach. Specifically, to determine the minimum ensemble size for PEP estimation, ensemble sizes of 64 to 4 heartbeats were traversed with 25% overlap, i.e., each ensemble contained 25% of heartbeats from the previous ensemble. The objective of using overlapping ensembles or moving average is to increase the number of estimates in the analysis. For each ensemble size, PEP was estimated by detecting the AO feature in the heartbeat obtained after the application of EMD algorithm. Once all the PEP estimates were obtained for a certain ensemble size during the walking phase, the mean (μ) and standard deviation (σ) of PEP estimates was calculated and the data points beyond μ ± σ were removed from the estimated set. A third degree polynomial was then fitted to the remaining estimates to capture the trend in the estimated PEP values with respect to time, with an order low enough to avoid over-fitting. The time values were chosen as the mean of the time index for the first and last heartbeat in the ensemble and were denoted by the variable tm.
The distance of each point from the best fit line was estimated and root mean square error (RMSE) was calculated for the data points for that specific ensemble size. In order to further remove outliers and improve the polynomial fitting, one data point was iteratively removed from the estimated PEP estimates and RMSE was derived for the remaining data points. Hence, one data point for which the RMSE decreased considerably was excluded from the data set and final RMSE error was calculated for the remaining points. The process was repeated for different ensemble sizes and RMSE errors were derived for the PEP estimates for each subject.
III. Results
A. Energy based Difference among Varying Types of Walking Signals
The mean squared energy in the signal when subjects walked at a normal pace was lowest as compared to the energy for walking at higher speeds. The D-V heartbeats during walking at the normal user-specific pace had low mean squared energy as compared to the heartbeats during walking at 1.34 m/s on the treadmill (user-specific pace: M = 0.009, SD = 0.004, 1.34 m/s treadmill: M = 0.02, SD = 0.006; t(12) = −4.55, p ≪ 0.01, where M and SD indicate mean and standard deviation, respectively). A t-test also showed that there was less energy in the D-V signal for normal user-specific pace walking as compared to walking at a brisk pace on level ground (user-specific pace: M = 0.009, SD = 0.004, brisk pace: M = 0.016, SD = 0.008; t(12) = −2.39, p ≪ 0.05). There was no statistically significant difference in the energy of the D-V signal between walking at higher speeds.
B. EMD based De-Noising
The interval-based ensemble averaging approach was used in this section. The warping distance between the resting heartbeats and walking heartbeats, before and after the application of EMD, i.e., dα and dβ, were calculated for all subjects. The warping distance decreased significantly after the walking heartbeats were de-noised using the EMD algorithm for all subjects. Since, warping distance indicates the cost of aligning two time series, a lower cost indicates greater similarity. A paired t-test was done on warping distance values obtained before (dα) and after the application of EMD based algorithm (dβ). There was significant reduction in warping distance for walking at user-specific normal speed before (M = 7.74, SD = 5.54) and after the use of EMD based de-noising method (M = 0.84, SD = 1.11); t(106) = −12.9, p ≪ 0.001. Similar results were obtained for walking at 1.34 m/s on the treadmill (dα : M = 9.42, SD = 8.1 and dβ : M = 1.3, SD = 0.86; t(83) = −9.4, p ≪ 0.001) and brisk pace walking on level ground (dα : M = 9.5, SD = 9.2 and dβ : M = 1.1, SD = 1.4; t(99) = −9.6, p ≪ 0.001). Hence, EMD based de-noising algorithm was able to improve SNR for different types of walking tests considered in this study.
C. ICG vs SCG
The normalized PEP estimates from the ICG and SCG sensors were compared using linear regression and correlation analysis. Walking induced motion artifacts in the measured ICG signals as well. Hence, in order to compare the results, the noisy ICG heartbeats were rejected from the analysis. A simple criteria, based on the amplitude of the B-point according to the guidelines provided in [28], was implemented to find noisy ICG heartbeats. If the amplitude of the B-point was found to be less than zero for the ensemble-averaged ICG heartbeat during walking, then the corresponding ICG heartbeat was not used in the correlation analysis. Fig. 5 shows the normalized PEP values from ICG and de-noised SCG heartbeats for one subject during the walking and recovery phases. The estimates corresponding to noisy ICG heartbeats which were rejected according the criteria explained are not shown in the plot. Once all the noisy ICG heartbeats and corresponding SCG heartbeats were removed, a linear regression analysis was calculated between and estimated from the remaining heartbeats. Any further outliers from normalized PEP values estimated from these heartbeats were manually removed by rejecting the data points that caused a considerable increase in correlation. Specifically, a data point was removed if it caused more than 10% increase in correlation.
Fig. 5.
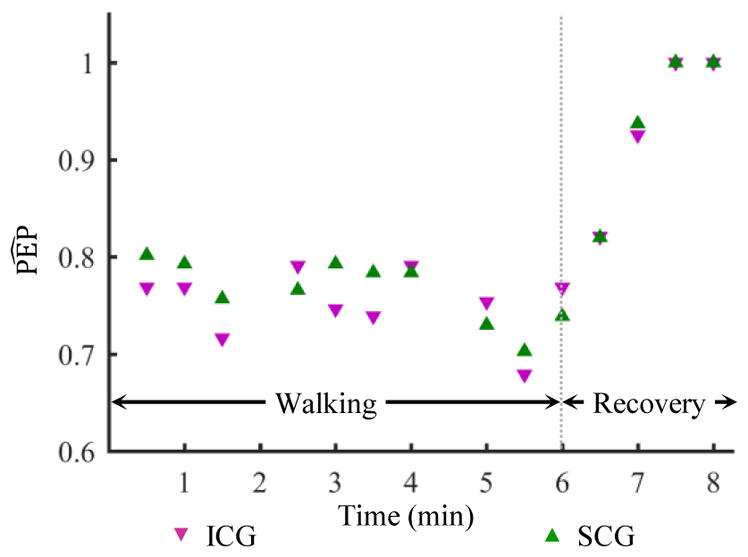
Normalized PEP values estimated from 30-second ensemble averaged heartbeats of the ICG and the de-noised SCG after the application of the EMD based algorithm for one subject. There are two data points missing in the plot (at 2:00 and 4:30 mark) due to noisy ICG heartbeats rejected from the analysis. The corresponding SCG estimates are also excluded.
The correlation results for walking at normal pace are shown in Fig. 6(a). Ten subjects participated in this phase of the protocol. However, ICG data from one subject was extremely noisy in the walking phase and hence that subject was excluded from the analysis. For the remaining 9 subjects, 30-second interval-based ensemble-averaged waveforms were analyzed. There were 16 data points for each subject which included the walking and recovery periods (total = 16 × 9). However, 42 data points were rejected as noisy ICG heartbeats and 3 more were removed as outliers. A correlation of r = 0.86 (p < 0.01) was calculated for the remaining data for all subjects in this phase of the protocol as shown in Fig. 6(a). Similarly, there were 120 data points for brisk pace walking on level ground for 10 subjects. A correlation value of r = 0.78 (p < 0.01) was obtained after rejecting 38 noisy ICG heartbeats and 5 outliers for this phase of the protocol as shown in Fig. 6(b). There was comparatively poor correlation between normalized PEP values from the ICG and SCG data for walking at 1.34 m/s on the treadmill and hence not shown here separately. For treadmill walking, r = 0.38 (p < 0.05) was obtained after rejecting more than half of the data points as either noisy ICG heartbeats or outliers.
Fig. 6.

(a) Correlation analysis for normalized PEP values from ICG and SCG for walking at normal pace on level ground. (b) Correlation analysis for brisk pace walking on level ground.
A Bland-Altman analysis was also conducted for and values for normal pace and brisk pace walking on level ground. The results are shown in Fig. 7. The Bland-Altman analysis indicates that the 95% limits of agreement between normalized PEP values from accelerometer and ICG ranged from −8.1% to 12.5% for walking at normal pace. Similarly, the 95% limits of agreement for walking at brisk pace on level ground were −14.4% to 22.8%.
Fig. 7.
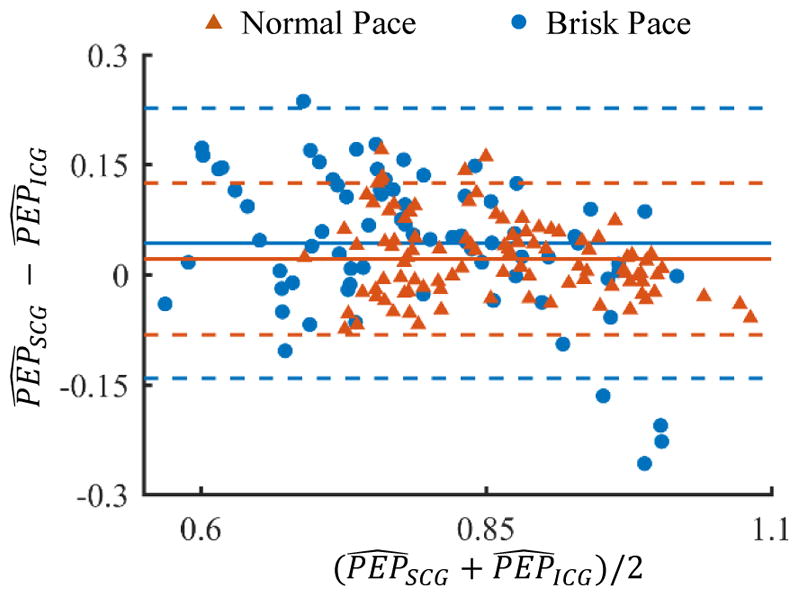
Bland-Altman analysis for and values for normal pace and brisk pace walking on level ground. The solid line indicates the mean while the dashed line indicates mean ± 1.96×standard deviation.
D. Minimum Ensemble Size Analysis
The results for the minimum ensemble size methodology for one representative subject during the 6-minute walking phase are illustrated in Fig. 8. The minimum number of heartbeats Ne in an ensemble during walking were estimated for each subject by fitting a third order polynomial on the PEP values with respect to time. The value of Ne was decreased from 64 to 4 and the error was estimated at each value. However, Fig. 8 only shows the PEP estimates for 4 different values of Ne. As the number of heartbeats were decreased from 64 to 32 in Fig. 8(b), the estimated values follow a similar trend as in Fig. 8(a) without any considerable increase in error. Similar result is obtained as the number of heartbeats is decreased further in the Fig. 8(c) and (d).
Fig. 8.
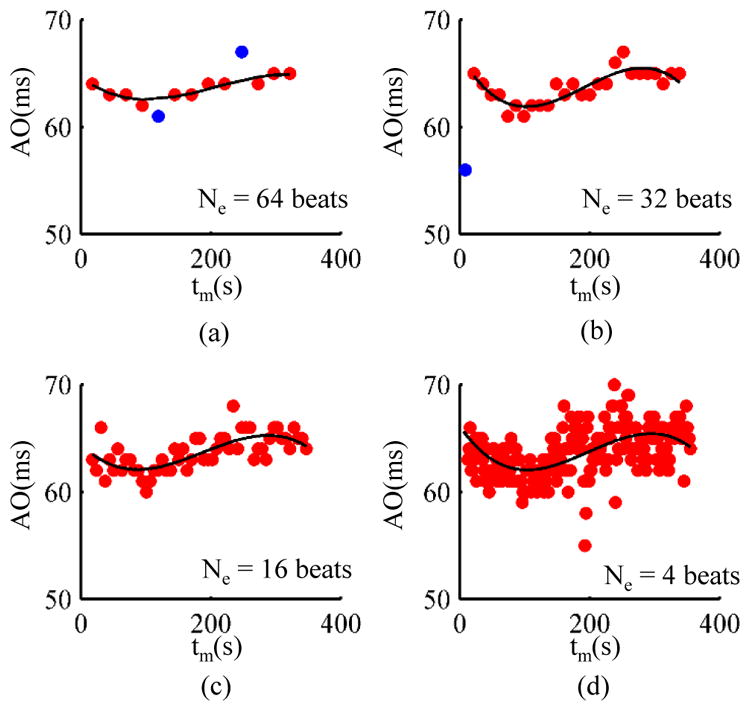
Determination of minimum ensemble size using the polynomial fitting approach for one subject. (a) 64 heartbeats. (b) 32 heartbeats. (c) 16 heartbeats. (d) 4 heartbeats. The data points in blue are outliers. In order to have the same y-axis scale for each plot, the outliers for some plots are not shown in the above figures but are explained as follows: 2 data points were detected as outliers in (a), 1 data point as outlier in (b), 2 data points as outliers in (c) but are not shown, and, 5 data points as outliers in (d) are not shown.
The results for all subjects are summarized in Table. I. We chose an RMSE threshold of 3 ms for PEP estimates for the 6-minute and 5-minute walking tests, i.e., the lowest number of heartbeats were chosen for each subject as long as these provided an RMSE of less than 3 ms from the line of best fit (3rd degree polynomial). The table shows that, if an RMSE of 3 ms can be tolerated in PEP estimation, then on average 11 heartbeats are required while the person is walking at normal pace. As the speed increases, the number of heartbeats for accurate estimation of both the PEP also increase. However, walking on level ground requires slightly less heartbeats as compared to treadmill walking.
TABLE I.
Minimum number of heartbeats Ne in an ensemble for PEP
| Ne | Normal pace | 1.34 m/s | Brisk pace |
|---|---|---|---|
|
| |||
| μ | 10.7 | 16 | 15.2 |
| σ | 7.5 | 19 | 17.8 |
IV. Discussion
The results suggest that the SCG signals processed using our de-noising and feature extraction techniques can provide accurate estimation of PEP during walking. Recent research has shown that the D-V heartbeats can be used to extract features for calculating STIs during resting scenarios [16], [29]. However, the major hurdle in using SCG for continuous monitoring has always been the exclusion of data during motion periods. The data during these movement periods can not only provide additional insight into cardiovascular health but also indicate how different stressors related to exercise affect cardiac function. In fact, to the best of our knowledge, recent efforts in this area have focused only on heart rate estimation during the movement periods. Though heart rate provides useful information about the electrical aspects of cardiovascular health, there is a strong need to also continuously estimate further parameters related to cardiac function. This paper outlines a data driven signal decomposition method for non-stationary signals that can be used to reduce the motion artifacts in SCG measurements taken during walking.
The methods described in this paper achieve a sufficiently fine time resolution for the PEP estimates from the acceleration signals to facilitate the analysis of changes in cardiovascular function associated with walking. During stationary periods, the acquired signals have a high SNR and accurate estimates can be obtained on a beat-by-beat basis. As the signal SNR decreases during walking or non-stationary periods, the need to perform ensemble averaging becomes unavoidable. The methods described in this work can readily be leveraged to obtain a minimum number of heartbeats that must be captured before an accurate and precise estimate, within some acceptable error thresholds, can be made for the PEP.
The perturbations such as walking or light exercises cause small changes to cardiovascular function of both healthy people and patients with CVDs. These brief changes can yield great insight into cardiovascular health. The common practice in existing research to overcome noise present in the signal involves ensemble-averaging heartbeat frames. The averaging operation, either performed on some specific number of frames or on frames present in some time interval, results in improved SNR, but fails to capture transients in the small changes in cardiovascular parameters from the measured signals. One of the results presented in this paper shows that the number of heartbeats required in averaging operation to increase SNR is directly proportional to the speed of walking. Walking at higher speeds requires a greater number of heartbeats. Hence, it can be concluded that some measure of intensity of the activity (speed of walking in this instance) can be incorporated into algorithms for better estimation of parameters. Thus future work should build on the ideas presented in this paper and focus on ‘smart ensemble-averaging’ of heartbeats which is adaptive in nature and captures necessary changes in the cardiovascular physiology while maintaining a good SNR in the signal under analysis.
A limitation of this work is the homogeneous nature of the data set which includes only healthy and young subjects. Also, the results presented in the paper do not show a considerable difference between walking on treadmill and on level ground at comparable speed. However, the type of surface, such a soft compressible surface, might affect the measured signals and consequently the performance of the methods. Hence, future work will include subjects with cardiovascular disorders along with the analysis of effect of type of walking surface on the performance of de-noising and minimum ensemble size algorithms. Future work should also focus on the design of an improved SNR metric to assess the quality of the measured SCG signals during exercise and consequently assess the performance of any de-noising algorithm. Nevertheless, this paper delineates novel methods for SCG signal recovery during motion which can form a foundation for these future studies and be readily extended to other measurement modalities.
V. Conclusion
In this paper, we investigated various signal processing methods and techniques for providing precise estimation of PEP from a body-worn accelerometer during walking. Using EMD, we demonstrated a significant improvement in the signal quality of wearable SCG signals during walking, allowing accurate detection of signal features in the context of activity. This approach can allow, for the first time, the assessment of SCG-based hemodynamic changes in patients with CVD performing 6-minute walk tests. The results derived in this work can lead to the design of “smart” algorithms for using the SCG methodology for in-depth and thorough cardiac monitoring away from clinics and also during different phases of daily activity.
Acknowledgments
Research reported in this publication was supported in part by the National Institute on Aging of the National Institutes of Health (NIH) under Award Number R56AG048458 and the National Institute of Biomedical Imaging and Bioengineering of the NIH under 1U01EB018818-01.
Biographies

Abdul Qadir Javaid (S’ 13) received the B.S. and M.S. degrees from University of Engineering and Technology (Lahore, Pakistan) and Newcastle University (United Kingdom) in 2007 and 2008. He worked briefly in electrical engineering department of National University of Computer and Emerging Sciences (Lahore, Pakistan) from 2010 to 2011. He joined Georgia Institute of Technology (Atlanta, Georgia USA) in 2011 and have been working in Smart Antenna Research Laboratory under Dr. Mary Ann Weitnauer’s supervision since Fall 2012. Mr. Javaid has been working with Dr. Omer T. Inan on various projects since Summer 2014. His current research interests include biomedical devices, signal processing algorithms for bio-signals and machine learning.

Hazar Ashouri received her B.E. in electrical and computer engineering from the American University of Beirut in 2013. She joined Georgia Institute of Technology in 2014 as an MS student in electrical and computer engineering. She is currently a PhD candidate and a graduate research assistant in Inan Research Laboratory under the supervision of Dr. Omer Inan. Her current research includes cardio-mechanical signals and non-invasive cardiovascular monitoring.

Alexis Dorier received his Bachelors degree in Life Sciences from the École Polytechnique Fédérale de Lausanne (EPFL), Lausanne, Switzerland in 2015. He is currently performing his Masters thesis in Dr. Omer Inans lab., Georgia Institute of Technology, Atlanta GA, USA. He will obtain his Masters degree in Bioengineering from EPFL in 2017. His current research interests are oriented towards cardiovascular technologies, hemodynamics, and noninvasive physiological measurements.

Mozziyar Etemadi (S07) received the B.S. and M.S. degrees in electrical engineering from Stanford University, Stanford, CA, USA, in 2008 and June 2009, respectively. He received the Ph.D. degree in bioengineering from the University of California, San Francisco (UCSF), USA/University of California, Berkeley, USA, Joint Graduate Group in Bioengineering in 2013, and the M.D. from UCSF in 2016 as part of the Medical Scientist Training Program (MSTP). He is currently a resident with the department of Anesthesiology at Northwestern University, Chicago, IL, USA.
Dr. Etemadi was named Forbes magazine’s “30 Under 30” in Science in January 2012. Later that year, he was awarded the Center for Integration of Medicine and Innovative Technology (CIMIT) Prize for Primary Care Innovation, and the grand prize in the Dow Sustainability Student Innovation Challenge. In 2011, he helped lead a research team in the Vodafone Americas Wireless Innovation Challenge and the mHealth Alliance Award to second prize. In 2009, while at Stanford University, he received the Frederick E. Terman Award for Scholastic Achievement in Engineering and also received the Electrical Engineering Fellowship, providing full support for his graduate studies.

J. Alex Heller (S12M13) received the B.S. degree in mechanical engineering from the University of Southern California, Los Angeles, CA, USA, and the M.S. degree in bioengineering from the University of California, San Francisco (UCSF)/UC Berkeley Joint Graduate Group in bioengineering in 2008 and 2013, respectively. In 2008, he joined Northrop Grumman, Marine Systems, Sunnyvale, CA, USA, as a Mechanical Engineer. Since 2010, he has worked as an Engineer and Researcher at UCSF for the Biodesign Laboratory and the Pediatric Device Consortium. His current research is focused on medical devices, specifically, on renal replacement therapy, home monitoring of chronic disease, and obstetrics related devices.

Shuvo Roy (M96) received the B.S. degree (magna cum laude with general honors for triple majors) in physics, mathematics (special honors), and computer science from Mount Union College, Alliance, OH, USA, in 1992, and the M.S. degree in electrical engineering and applied physics and the Ph.D. degree in electrical engineering and computer science from Case Western Reserve University, Cleveland, OH, USA, in 1995 and 2001, respectively.
Currently, he is a Professor in the Department of Bioengineering and Therapeutic Sciences (BTS), a joint department of the Schools of Pharmacy and Medicine at the University of California, San Francisco (UCSF), and Director of the UCSF Biomedical Microdevices Laboratory. He holds the Harry Wm. and Diana V. Hind Distinguished Professorship in Pharmaceutical Sciences II in the UCSF School of Pharmacy. He is a founding member of the UCSF Pediatric Devices Consortium, which has a mission to accelerate the development of innovative devices for childrens health, and a faculty affiliate of the California Institute for Quantitative Biosciences (QB3). From 1998 to 2008, he was Co-Director of the BioMEMS Laboratory in the Department of Biomedical Engineering at the Cleveland Clinic, Cleveland, OH, USA, where he worked with basic scientists, practising clinicians, and biomedical engineers to develop MEMS solutions to high-impact medical challenges. While pursuing his Ph.D. degree, he conducted research in the areas of design, microfabrication, packaging, and performance of MEMS for harsh environments. He also investigated microstructural characteristics and mechanical properties of MEMS materials, developed the requisite microfabrication technologies, and demonstrated operation of the first surface micromachined silicon carbide transducers at high temperatures (up to 950 C). He has also developed miniaturized micro-relays for high-performance electrical switching and ice detection sensors for aerospace applications. In 2008, he joined UCSF to continue the development of biomedical devices including wireless physiological monitoring systems and bioartificial replacement organs, and participate in the training of professional students in the School of Pharmacy as well as graduate students in the UCSF/UCB Joint Graduate Group in Bioengineering. He has contributed to more than 90 technical publications, coauthored three book chapters, been awarded 16 U.S. patents, and given more than 70 invited presentations. Dr. Roy is an Associate Editor of Biomedical Microdevices and editorial board member of Sensors and Materials. He was the recipient of a Top 40 under 40 award by Crains Cleveland Business in 1999 and the Clinical Translation Award at the 2nd Annual BioMEMS and Biomedical Nanotechnology World 2001 meeting. In 2003, he was selected as a recipient of the TR100, which features the worlds 100 Top Young Innovators as selected by Technology Review, the Massachusetts Institute of Technologys Magazine of Innovation. In 2004, he was presented with a NASA Group Achievement Award for his work on harsh environment MEMS. In 2005, he was named as a Whos Who in Biotechnology by Crains Cleveland Business. In 2009, he was nominated for the Biotechnology Industry Organizations Biotech Humanitarian Award, which is given in recognition of an individual who has used biotechnology to unlock its potential to improve the earth.
Omer T. Inan (S06, M09) received the B.S., M.S., and Ph.D. degrees in electrical engineering from Stanford University, Stanford, CA, in 2004, 2005, and 2009, respectively.
He joined ALZA Corporation (A Johnson and Johnson Company) in 2006, where he designed micropower circuits for iontophoretic drug delivery. In 2007, he joined Countryman Associates, Inc., Menlo Park, CA where he was Chief Engineer, involved in designing and developing high-end professional audio circuits and systems. From 2009–2013, he was also a Visiting Scholar in the Department of Electrical Engineering, Stanford University. Since 2013, Dr. Inan is an Assistant Professor of Electrical and Computer Engineering at the Georgia Institute of Technology. He is also an Adjunct Assistant Professor in the Wallace H. Coulter Department of Biomedical Engineering. His research focuses on non-invasive physiologic monitoring for human health and performance, and applying novel sensing systems to chronic disease management, acute musculoskeletal injury recovery, and pediatric care.
Dr. Inan is an Associate Editor of the IEEE Journal of Biomedical and Health Informatics, Associate Editor for the IEEE Engineering in Medicine and Biology Conference and the IEEE Biomedical and Health Informatics Conference, Invited Member of the IEEE Technical Committee on Translational Engineering for Healthcare Innovation, and Technical Program Committee Member or Track Chair for several other major international biomedical engineering conferences. He has published more than 80 technical articles in peer-reviewed international journals and conferences, and has five issued and four pending patents. Dr. Inan received the Gerald J. Lieberman Fellowship (Stanford University) in 2008–09 for outstanding scholarship, and the Lockheed Dean’s Excellence in Teaching Award (Georgia Tech) in 2016. He is a Three-Time National Collegiate Athletic Association All-American in the discus throw, and a former co-captain of the Stanford University Track and Field Team.
Footnotes
The content is solely the responsibility of the authors and does not necessarily represent the official views of the National Institutes of Health.
Contributor Information
Abdul Q. Javaid, School of Electrical and Computer Engineering, Georgia Institute of Technology, Atlanta, GA, 30332 USA.
Hazar Ashouri, School of Electrical and Computer Engineering, Georgia Institute of Technology, Atlanta, GA, 30332 USA.
Alexis Dorier, School of Electrical and Computer Engineering, Georgia Institute of Technology, Atlanta, GA, 30332 USA.
Mozziyar Etemadi, Department of Bioengineering and Therapeutic Sciences, University of California, San Francisco, CA 94158 USA.
J. Alex Heller, Department of Bioengineering and Therapeutic Sciences, University of California, San Francisco, CA 94158 USA.
Shuvo Roy, Department of Bioengineering and Therapeutic Sciences, University of California, San Francisco, CA 94158 USA.
Omer T. Inan, School of Electrical and Computer Engineering, Georgia Institute of Technology, Atlanta, GA, 30332 USA.
References
- 1.Mozaffarian D, Benjamin EJ, Go AS, Arnett DK, Blaha MJ, Cushman M, Das SR, de Ferranti S, Després JP, Fullerton HJ, et al. Executive summary: Heart disease and stroke statistics-2016 update: A report from the american heart association. Circulation. 2016;133(4):447. doi: 10.1161/CIR.0000000000000366. [DOI] [PubMed] [Google Scholar]
- 2.Zheng YL, Ding XR, Poon C, Lo B, Zhang H, Zhou XL, Yang GZ, Zhao N, Zhang YT. Unobtrusive sensing and wearable devices for health informatics. Biomedical Engineering, IEEE Transactions on. 2014 May;61(5):1538–1554. doi: 10.1109/TBME.2014.2309951. [DOI] [PMC free article] [PubMed] [Google Scholar]
- 3.Inan OT, Migeotte PF, Park KS, Etemadi M, Tavakolian K, Casanella R, Zanetti J, Tank J, Funtova I, Prisk GK, et al. Ballistocardiography and seismocardiography: A review of recent advances. Biomedical and Health Informatics, IEEE Journal of. 2015;19(4):1414–1427. doi: 10.1109/JBHI.2014.2361732. [DOI] [PubMed] [Google Scholar]
- 4.Mukkamala R, Hahn JO, Inan O, Mestha L, Kim CS, Toreyin H, Kyal S. Toward ubiquitous blood pressure monitoring via pulse transit time: Theory and practice. Biomedical Engineering, IEEE Transactions on. 2015 Aug;62(8):1879–1901. doi: 10.1109/TBME.2015.2441951. [DOI] [PMC free article] [PubMed] [Google Scholar]
- 5.McCombie D, Shaltis P, Reisner A, Asada H. Adaptive hydrostatic blood pressure calibration: Development of a wearable, autonomous pulse wave velocity blood pressure monitor. Engineering in Medicine and Biology Society, 2007. EMBS 2007. 29th Annual International Conference of the IEEE; Aug 2007; pp. 370–373. [DOI] [PubMed] [Google Scholar]
- 6.Da He D, Winokur E, Sodini C. An ear-worn vital signs monitor. Biomedical Engineering, IEEE Transactions on. 2015 Nov;62(11):2547–2552. doi: 10.1109/TBME.2015.2459061. [DOI] [PMC free article] [PubMed] [Google Scholar]
- 7.Wiens AD, Inan OT. Accelerometer body sensor network improves systolic time interval assessment with wearable ballistocardiography. 2015 37th Annual International Conference of the IEEE Engineering in Medicine and Biology Society (EMBC); IEEE; 2015. pp. 1833–1836. [DOI] [PubMed] [Google Scholar]
- 8.Hernandez J, McDuff D, Picard RW. Biowatch: estimation of heart and breathing rates from wrist motions. Proceedings of the 9th International Conference on Pervasive Computing Technologies for Healthcare; ICST (Institute for Computer Sciences, Social-Informatics and Telecommunications Engineering); 2015. pp. 169–176. [Google Scholar]
- 9.Wiens A, Inan O. A novel system identification technique for improved wearable hemodynamics assessment. Biomedical Engineering, IEEE Transactions on. 2015 May;62(5):1345–1354. doi: 10.1109/TBME.2014.2387354. [DOI] [PMC free article] [PubMed] [Google Scholar]
- 10.Lewis RP, Rittogers S, Froester W, Boudoulas H. A critical review of the systolic time intervals. Circulation. 1977;56(2):146–158. doi: 10.1161/01.cir.56.2.146. [DOI] [PubMed] [Google Scholar]
- 11.Etemadi M, Inan OT, Giovangrandi L, Kovacs GT. Rapid assessment of cardiac contractility on a home bathroom scale. Information Technology in Biomedicine, IEEE Transactions on. 2011;15(6):864–869. doi: 10.1109/TITB.2011.2161998. [DOI] [PubMed] [Google Scholar]
- 12.Castiglioni P, Faini A, Parati G, Di Rienzo M. Wearable seismocardiography. Engineering in Medicine and Biology Society, 2007. EMBS 2007. 29th Annual International Conference of the IEEE; IEEE; 2007. pp. 3954–3957. [DOI] [PubMed] [Google Scholar]
- 13.Etemadi M, Inan OT, Heller JA, Hersek S, Klein L, Roy S. A wearable patch to enable long-term monitoring of environmental, activity and hemodynamics variables. IEEE Transactions on Biomedical Circuits and Systems. 2016 Apr;10(2):280–288. doi: 10.1109/TBCAS.2015.2405480. [DOI] [PMC free article] [PubMed] [Google Scholar]
- 14.Tavakolian K, Ngai B, Blaber AP, Kaminska B. Infrasonic cardiac signals: Complementary windows to cardiovascular dynamics. Engineering in Medicine and Biology Society, EMBC, 2011 Annual International Conference of the IEEE; IEEE; 2011. pp. 4275–4278. [DOI] [PubMed] [Google Scholar]
- 15.Zanetti JM, Salerno DM. Seismocardiography: a technique for recording precordial acceleration. Computer-Based Medical Systems, 1991. Proceedings of the Fourth Annual IEEE Symposium; IEEE; 1991. pp. 4–9. [Google Scholar]
- 16.Tavakolian K, Blaber AP, Ngai B, Kaminska B. Computing in Cardiology. Vol. 2010. IEEE; 2010. Estimation of hemodynamic parameters from seismocardiogram; pp. 1055–1058. [Google Scholar]
- 17.Enright PL. The six-minute walk test. Respiratory care. 2003;48(8):783–785. [PubMed] [Google Scholar]
- 18.Hamilton DM, Haennel R. Validity and reliability of the 6-minute walk test in a cardiac rehabilitation population. Journal of Cardiopulmonary Rehabilitation and Prevention. 2000;20(3):156–164. doi: 10.1097/00008483-200005000-00003. [DOI] [PubMed] [Google Scholar]
- 19.Bittner V, Weiner DH, Yusuf S, Rogers WJ, McIntyre KM, Bangdiwala SI, Kronenberg MW, Kostis JB, Kohn RM, Guillotte M, et al. Prediction of mortality and morbidity with a 6-minute walk test in patients with left ventricular dysfunction. Jama. 1993;270(14):1702–1707. [PubMed] [Google Scholar]
- 20.Cahalin LP, Mathier MA, Semigran MJ, Dec GW, DiSalvo TG. The six-minute walk test predicts peak oxygen uptake and survival in patients with advanced heart failure. CHEST Journal. 1996;110(2):325–332. doi: 10.1378/chest.110.2.325. [DOI] [PubMed] [Google Scholar]
- 21.Huang NE, Shen Z, Long SR, Wu MC, Shih HH, Zheng Q, Yen N-C, Tung CC, Liu HH. The empirical mode decomposition and the hilbert spectrum for nonlinear and non-stationary time series analysis. Proceedings of the Royal Society of London A: Mathematical, Physical and Engineering Sciences; The Royal Society; 1998. pp. 1971pp. 903–995. [Google Scholar]
- 22.Rilling G, Flandrin P, Goncalves P, et al. IEEE-EURASIP workshop on nonlinear signal and image processing. Vol. 3. IEEER; 2003. On empirical mode decomposition and its algorithms; pp. 8–11. [Google Scholar]
- 23.Wu Z, Huang NE. Ensemble empirical mode decomposition: a noise-assisted data analysis method. Advances in adaptive data analysis. 2009;1(01):1–41. [Google Scholar]
- 24.Sörnmo L, Laguna P. Bioelectrical signal processing in cardiac and neurological applications. Academic Press; 2005. [Google Scholar]
- 25.Flandrin P, Rilling G, Goncalves P. Empirical mode decomposition as a filter bank. Signal Processing Letters, IEEE. 2004;11(2):112–114. [Google Scholar]
- 26.Sakoe H, Chiba S. Dynamic programming algorithm optimization for spoken word recognition. Acoustics, Speech and Signal Processing, IEEE Transactions on. 1978;26(1):43–49. [Google Scholar]
- 27.Van Der Hoeven G, Clerens P, Donders J, Beneken J, Vonk J. A study of systolic time intervals during uninterrupted exercise. British heart journal. 1977;39(3):242–254. doi: 10.1136/hrt.39.3.242. [DOI] [PMC free article] [PubMed] [Google Scholar]
- 28.Allen MT, Fahrenberg J, Kelsey RM, Lovallo WR, Doornen LJ, et al. Methodological guidelines for impedance cardiography. Psychophysiology. 1990;27(1):1–23. doi: 10.1111/j.1469-8986.1990.tb02171.x. [DOI] [PubMed] [Google Scholar]
- 29.Tavakolian K, Portacio G, Tamddondoust NR, Jahns G, Ngai B, Dumont GA, Blaber A. Myocardial contractility: a seismocardiography approach. Engineering in Medicine and Biology Society (EMBC), 2012 Annual International Conference of the IEEE; IEEE; 2012. pp. 3801–3804. [DOI] [PubMed] [Google Scholar]