Abstract
De novo donor specific antibody (dnDSA) is associated with antibody mediated rejection (AMR) and allograft loss, yet the allograft histology associated with dnDSA remains unclear. The aim of this study was to examine the allograft histology associated with dnDSA in patients with serial surveillance biopsies. We retrospectively studied adult conventional solitary kidney transplant recipients from 10/2007–5/2014. DnDSA was new DSA with MFI >1000. The incidence of dnDSA was 7.0%(54/771) over mean follow-up of 4.2±1.9 years. Patients with dnDSA had reduced death-censored allograft survival (87.0% vs. 97.0% no dnDSA, p<0.01). 94% of patients received a biopsy after dnDSA (mean of 3 biopsies/patient). AMR was present in 25.0% and 52.9% of patients at dnDSA detection and at 1 year, respectively. Patients with both class I and II dnDSA had the highest rate of allograft loss. The higher the sum MFI at dnDSA detection, the higher the incidence of AMR. In conclusion, patients with dnDSA without AMR at time of detection may benefit from a follow-up biopsy within 1 year because AMR can be missed initially. Additionally, the dnDSA class and sum MFI at baseline appears to be prognostic. The higher the sum MFI of dnDSA at baseline, the higher the incidence of AMR.
INTRODUCTION
De novo donor specific antibody (dnDSA) is a major risk factor for chronic antibody mediated rejection and allograft loss(1–5). The reported incidence of dnDSA varies from 6.2% to 27.8% depending on the cohort studied (2–4, 6–9) and up to 24% of allografts fail within 3 years of dnDSA detection(3). Medication nonadherence and previous acute cellular rejection in the setting of class II HLA mismatch are the main risk factors for dnDSA development (2, 3, 6); yet a subset of transplant recipients develop early dnDSA for unclear reasons. Regardless, no available therapy has been proven effective, emphasizing the need for prevention and therapeutic clinical trials.
The problem is that designing a clinical trial to prevent or treat patients with dnDSA is difficult. The number of patients who develop dnDSA is relatively small. Not all patients with dnDSA develop AMR or graft loss as many patients have stable allograft function for years(6). Including these patients in a clinical trial is not ideal because they would receive unnecessary treatment and would dilute any treatment effect thus necessitating a larger trial. Enriching a study population with patients the most likely to progress to a meaningful clinical end-point is a critical component in the design of an effective clinical trial.
Our goal was to examine serial allograft biopsies in patients with dnDSA to identify a subgroup of patients most likely to progress to allograft failure. We also aimed to identify potentially modifiable risk factors for dnDSA outside of medication nonadherence, acute cellular rejection, and HLA mismatch. We studied a predominantly Caucasian living donor kidney transplant population who underwent surveillance DSA testing and allograft biopsy.
Materials and Methods
This study was approved by the Mayo Clinic Institutional Review Board. We performed a retrospective cohort study of the risk factors and outcomes of our adult solitary conventional kidney transplant recipients who were transplanted between October 2007 – May 2014. We only studied the initial transplant from patients who were retransplanted at our center during the studied time period (n=5), and we excluded patients if no baseline single antigen bead (SAB) results were available (n=8), if DSA was not tested post-transplant (n=25), or if the patient had a positive crossmatch and/or DSA was detected with MFI >1000 at the time of transplant (n=158). Data was collected by chart review. Patients were censored at last follow-up.
De novo Donor Specific Antibody Assessment
A SAB, solid phase assay (LABscreen, One Lambda, Canoga Park, CA, USA) was used to identify alloantibody specificities at baseline and post-transplant. De novo DSA was defined as any DSA identified post-transplant that reached an MFI >1000 that was not detected at any time prior to transplant (each patient had at least 1 SAB test prior to transplant). Our center protocol is to obtain SABs at least yearly when patients are on the kidney transplant waiting list, immediately pre-transplant, 4 months post-transplant, and yearly post-transplant thereafter. SABs are also routinely performed at the time of allograft dysfunction or acute cellular rejection.
Assessment of Medication Adherence
This information was obtained from the clinical record. We defined medical nonadherence as documented missing labs, unexplained low immunosuppressive drug levels, no-show to appointments, medications not refilled, or the patient was admittedly nonadherent.
Biopsy Assessment
Surveillance biopsies were done at 4, 12, 24, and 60 months post-transplant as standard of care. Biopsies were also performed for allograft dysfunction, proteinuria, or based on provider discretion (i.e. known dnDSA). Kidney biopsy tissue was processed for light microscopy and C4d by immunofluorescence (AbD Serotec) if indicated.
Light microscopy features of biopsies were scored by slightly modified Banff criteria (10–12). Specifically; acute active AMR in dn DSA patients was diagnosed if 3 features were present according to Banff 2013 guidelines: 1. Histologic evidence of acute tissue injury including g>0 and/or ptc >0, intimal or transmural arteritis (v>0), thrombotic microangiopathy, or acute tubular injury, in the absence of any other apparent cause, 2. Evidence of current/recent antibody interaction with vascular endothelium including at least one of the following (C4d ≥2 with immunofluorescence on frozen section or g+ptc ≥2), and 3. Serologic evidence of donor-specific antibodies.
The presence of cg score >0 signified chronic AMR. In this study patients with acute, active AMR could have cg score >0; which is the modification from Banff 2013 guidelines. Thus, some patients met criteria for acute, active and chronic AMR simultaneously. Electron microscopy was not routinely done in all biopsies, and it was not used to determine the presence of chronic AMR.
Immunosuppression and treatment protocols
Patients received ATG (Thymoglobulin Sangstadt, Menlo Park Ca, 1.5mg/kg/d for 4 doses; anti-CD25 receptor antibodies (Simulect, Novartis Pharmaceuticals, East Hanover, NJ); or alemtuzumab (Campath, Genzyme, Cambridge, MA) as induction per center protocol. Currently, alemtuzumab is the standard induction agent if the patient age is less than 65, the B-flow cytometric crossmatch is negative, and no DSA is detected with an MFI >2000; anti-CD25 receptor antibodies are given if the patient is ≥ 65 with a negative crossmatch; and ATG is given to all other patients. Prior to 2011, alemtuzumab was part of routine protocol. At that time, ATG was given to all patients unless they were aged ≥ 65 and had a negative B flow cytometric crossmatch in which case they received anti-CD25 receptor antibodies.
Our standard maintenance immunosuppression consists of prednisone, tacrolimus, and mycophenolate mofetil in patients who receive induction with ATG and anti-CD25 antibodies. Patients are on a steroid-free immunosuppression protocol if they receive alemtuzumab induction (tacrolimus and mycophenolate mofetil only).
Because no therapy is proven effective for the sustained reduction in DSA, no specific therapy for dnDSA was given outside of routine treatment for acute cellular rejection, mixed acute cellular and antibody mediated rejection, or low immunosuppressive levels. Specifically, 75.9% (42/54) patients received no new therapy during follow-up; 11.1% (6/54) received thymoglobulin, IVIG, and plasmapheresis for mixed acute cellular and antibody mediated rejection; 9.3% (5/54) received corticosteroids for acute cellular rejection alone; and 1.9% (1/54) received IVIG therapy alone.
Laboratory monitoring
All patients had their serum creatinine and estimated GFR assessed at least every 3 months. At yearly intervals, patients had a more thorough assessment of their renal function that included iothalamate clearance testing and 24-hour urine protein testing.
Statistical Analysis
Statistical analysis was performed on JMPv10. (SAS, Cary, NC). For numerical data, groups were compared with the t-test or the Wilcoxon rank sum test as indicated. Counts and percentages were compared using Fisher’s exact test. Odds ratios (OR) were used and described by their point estimate and corresponding 95% confidence intervals. Logistic regression was used for multivariate analysis to determine the risk factors for de novo DSA. Time-to-event data were summarized for each group using Kaplan-Meier estimates. Cox regression with a time-dependent variable (dnDSA) was used to test between groups (Wald’s test at the 0.05 level). Testing was two-sided at the 0.05 level. The paired t-test was used to compared paired continuous data and the McNemar’s test was used to compare paired proportions.
RESULTS
Demographics
Figure 1 shows the outcomes of the patients in the study. Baseline characteristics are as shown in Table 1. The overall mean follow-up was 4.2+1.9 years and was similar among those developing dnDSA and those in whom dnDSA was never detected. The incidence of dnDSA was 7.0% during this time frame. In our cohort, the transplant recipients were predominantly Caucasian and 82.3% (637/771) received their transplant from a living donor. There was no difference in gender, race, donor type, cause of ESRD, cPRA, prior organ transplant, or prior polyomavirus among patients who did or did not develop dnDSA, respectively. Patients who developed dnDSA were younger (mean 48.3±15.6 vs. 53.0±13.8, p=0.04) and had more HLA mismatches (mean 4.2±1.5 vs. 3.6±1.9, p<0.01). The majority of patients received thymoglobulin for induction immunosuppression, but there was a higher proportion of patients who received alemtuzumab in the dnDSA cohort than the non dnDSA cohort [31.5%(17/54) vs. 18.2%(130/717), p=0.03]. There were also more patients in the dnDSA group who had a prior acute cellular rejection episode [35.2% (19/54) vs. 15.8% (113/717), p<0.01] or had a documented history of medication nonadherence.
Figure 1.
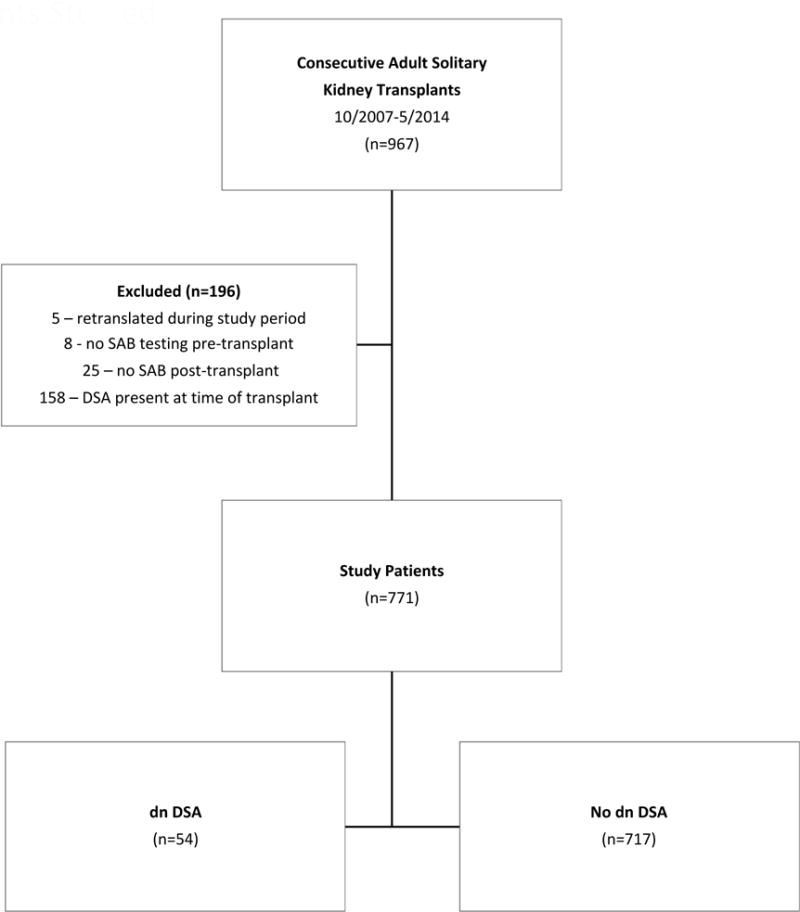
Patients Studied
Table 1.
Baseline demographics
| All patients | De Novo DSA | No De Novo DSA |
p-value | |
|---|---|---|---|---|
| N=771 | N=54 | N=717 | ||
|
| ||||
| Age mean±−std | 52.6 ±13.9 | 48.3 ±15.6 | 53.0 ± 13.8 | P=0.04 |
| 18–30 n(%) | 65(8.4) | 8(14.8) | 57(8.0) | |
| >30–40 n(%) | 78(10.1) | 8(14.8) | 70(9.8) | |
| >40–50 n(%) | 132(17.1) | 8(14.8) | 124(17.3) | |
| >50–60 n(%) | 205(26.5) | 17(31.5) | 188(26.2) | |
| >60 n(%) | 291(37.8) | 13(24.1) | 278(38.8) | |
|
| ||||
| Race n(%) Caucasian | 696(90.3) | 45(83.3) | 651(90.8) | |
| Hispanic | 18(2.3) | 2(3.7) | 16(2.2) | P=0.46 |
| African American | 31(4.0) | 4(7.4) | 27(3.8) | |
| Asian | 12(1.2) | 1(1.9) | 11(1.5) | |
| American Indian/Pacific Islander | 14(1.8) | 2(3.7) | 12(1.7) | |
|
| ||||
| Donor Type n(%) | ||||
| Deceased donor | 134(17.4) | 7(13.0) | 127(17.7) | P=0.13 |
| Living Related Donor | 295(38.3) | 16(29.6) | 279(38.9) | |
| Living Unrelated Donor | 342(44.4) | 31(57.4) | 311(43.4) | |
|
| ||||
| Gender (Male) n(%) | 483(62.6) | 30(55.6) | 453(63.2) | P=0.31 |
|
| ||||
| Cause of ESRD n(%) | ||||
| Diabetes | 143(18.5) | 7(13.0) | 136(19.0) | P=0.73 |
| Glomerulonephritis | 275(35.7) | 19(35.2) | 255(35.6) | |
| Hypertension | 45(5.8) | 5(9.3) | 40(5.6) | |
| Cystic renal diseases | 130(16.9) | 9(16.7) | 121(16.9) | |
| Other | 130(16.9) | 11(20.4) | 119(16.6) | |
| Unknown | 48(6.2) | 3(5.7) | 45(6.3) | |
|
| ||||
| cPRA % mean+/−std | 12.3 ±27.1 | 8.9 ±22.7 | 12.6±27.3 | P=0.27 |
|
| ||||
| Prior solid organ transplant n(%) | 131(17.0) | 13(24.07) | 108(16.5) | P=0.19 |
|
| ||||
| Induction n(%) | ||||
| Thymoglobulin | 388(50.3) | 27(50.0) | 361(50.4) | P=0.06 |
| Basiliximab | 235(30.5) | 10(18.5) | 224(31.3) | |
| Alemtuzumab | 147(19.1) | 17(31.5) | 130(18.2) | |
|
| ||||
| HLA mismatch (≥1) n(%) | P<0.01 | |||
| A | 573(74.9) | 50(93.0) | 523(72.9) | |
| B | 630(82.4) | 49(92.6) | 581(81.0) | |
| DR | 584(76.4) | 49(90.7) | 535(74.6) | |
| DQ | 535(69.5) | 49(90.7) | 486(67.8) | |
|
| ||||
| HLA mismatch mean+/−std | 3.3 ± 1.9 | 4.2± 1.5 | 3.6± 1.9 | P<0.01 |
|
| ||||
| Polyomavirus n(%)* | 34(4.4) | 5(9.3) | 29(4.0) | P=0.08 |
|
| ||||
| Acute cellular rejection* n(%) | 132(17.1) | 19(35.2) | 113(15.8) | P<0.01 |
|
| ||||
| Documented medication nonadherence n(%) | 63(8.2) | 18(33.3) | 45(6.3) | P<0.01 |
|
| ||||
| Follow-up (years) mean+/−std | 4.2 ±1.9 | 4.7 ±−2.0 | 4.2+/−1.9 | P=0.06 |
|
| ||||
| Follow-ud cost dn DSA (vears) mean+/−std | NA | 3.2 ±2.0 | NA | NA |
Present prior to dnDSA detection
Risk Factors for De novo DSA
Patients greater than age 60 were less likely to develop de novo DSA in our cohort based on univariate analysis [OR 0.5(0.3–1.0), p=0.04] Table 2. Risk factors for the development of dn DSA based on univariate analysis were alemtuzumab induction [OR 2.1(CI 1.1–3.8), p=0.03]; HLA mismatches at the A [OR 4.5(CI 1.6–12.5),p<0.01]; DR [OR 3.2(CI 1.3–8.1),p=0.01]; and DQ [OR 4.6(CI 1.8–11.7) loci; prior acute cellular rejection [OR 2.9(CI 1.6–5.2), p<0.01] and documented medication nonadherence [OR 7.5(CI 3.9–14.2), p<0.01]. Independent risk factors for de novo DSA determined by multivariate models were DQ mismatch [OR 4.8(2.0–14.3),p<0.01], prior history of acute cellular rejection [OR2.4(1.3–4.5), p<0.01] and documented medication nonadherence [OR 7.9 (3.9–15.4),p<0.01] Table 2 (Multivariate model #2).
Table 2.
Risk Factors for De novo DSA
| Univariate | Multivariate (#1) | Multivariate (#2) | ||||
|---|---|---|---|---|---|---|
|
| ||||||
| OR (CI) | P-value | OR (CI) | P-value | OR (CI) | P-value | |
|
| ||||||
| Age | ||||||
| 18–30 | 2.0(0.9–4.5) | P=0.12 | ||||
| >30–40 | 1.6(0.7–3.5) | P=0.24 | ||||
| >40–50 | 0.8(0.4–1.8) | P=0.85 | ||||
| >50–60 | 1.3(0.7–2.3) | P=0.43 | ||||
| >60 | 0.5(0.3–1.0) | P=0.04 | 0.7((0.3 – 1.4) | P=0.31 | ||
|
| ||||||
| Induction | ||||||
| Thymoglobulin | 1.0(0.6–1.7) | P=1.0 | ||||
| Basiliximab | 0.5(0.2–1.0) | P=0.05 | ||||
| Alemtuzumab | 2.1(1.1–3.8) | P=0.03 | 1.5(0.7–2.9) | P=0.26 | ||
|
| ||||||
| HLA mismatch (≥1) | ||||||
| A | 4.5(1.6–12.5) | P<0.01 | 2.5(0.82–9.5) | P=0.14 | ||
| B | 2.2(0.9–5.6) | P=0.10 | ||||
| DR | 3.2(1.3–8.1) | P<0.01 | 1.5(0.5––5.2) | P=0.48 | 4.8(2.0–14.3) | P<0.01 |
| DQ | 4.6(1.8–11.7) | P<0.01 | 3.5(1.4–10.7) | P=0.01 | ||
|
| ||||||
| HLA mismatch | NA | 1.1(1.3–0.9) per mismatch | P=0.42 | |||
|
| ||||||
| Acute cellular rejection* | 2.9(1.6–5.2) | P<0.01 | 2.6(1.3–5.1) | p=<0.01 | 2.4(1.3–4.5) | P<0.01 |
|
| ||||||
| Documented medication nonadherence | 7.5(3.9–14.2) | P<0.01 | 6.4(3.1–13.3) | P<0.01 | 7.9(3.9–15.4) | P<0.01 |
Prior to de novo DSA formation
De novo DSA characteristics
Overall, 7% of patients developed dnDSA. The mean time to de novo DSA detection post-transplant was 1.8 ±1.6 years Figure 2. 3.2% (25/771) of patients developed dnDSA within 1 year post-transplant. Anti-class I DSA alone was present in 9.3% (5/54), Class II alone in 70.4% (38/54), and Class I + II in 20.4% (11/54) of patients. In total 29.6% (16/54) had anti-class I de novo DSA and 90.7%(49/54) had anti-class II de novo DSA. The de novo DSA completely disappeared during follow-up in 16.7% (9/54) patients. The distribution of mean fluorescence intensity (MFI) of the de novo DSA is shown in Table 2.
Figure 2. Time to de novo DSA detection.
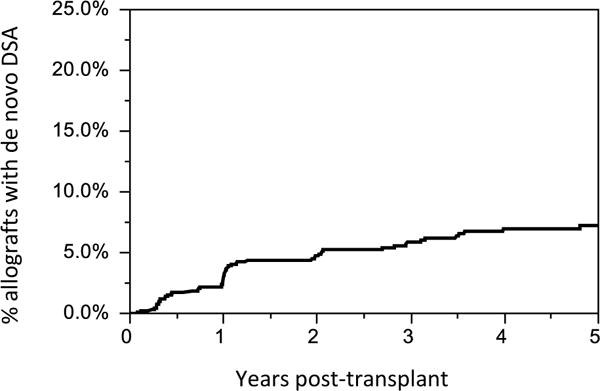
The mean time to de novo DSA detection post-transplant was 1.8±1.6 years. At our center, surveillance testing for dn DSA is performed at 4 months post-transplant and yearly thereafter. Testing for dn DSA is also obtained for clinical indication (i.e. acute cellular rejection).
Allograft survival
Patient and overall allograft survival were similar among patients who did or did not develop dnDSA as shown in Figure 3. However, patients with dnDSA had reduced death-censored allograft survival, p=0.01. Actuarial death-censored allograft survival was 87.0% in patients who developed dnDSA and 97.0% in patients who did not develop dnDSA, p=0.01. The mean time to death-censored allograft failure after dnDSA detection was 1.6 ±1.7 years.
Figure 3. Patient and Allograft Survival.

Patients with de novo DSA had reduced death-censored allograft survival, p= 0.01. At the end of follow-up, the actuarial death-censored allograft survival was 87.0% in the patients who developed dnDSA and 97.0% in patients who did not develop dnDSA, p=0.01. Cox regression with a time-dependent variable (dnDSA) was used to compare groups (Wald’s test at the 0.05 level).
Progression of clinical and subclinical antibody mediated rejection
A total 160 biopsies were obtained from 94.4% (51/54) of the studied patients at the time of dnDSA detection or afterwards (mean of 3 biopsies/patient). Biopsies were obtained at the time of dnDSA detection in 74.1% (40/54) of patients. At 1 year post dnDSA detection, biopsies were obtained in 68.0% (34/50) of the surviving patients with a functioning allograft.
At the time of dnDSA detection; 20.0% (8/40) of the biopsies met Banff criteria for acute cellular rejection (borderline grade or higher); 25.0 % (10/40) of the biopsies met criteria for acute, active AMR; and 7.5 % (3/40) of the biopsies showed chronic AMR (with concomitant acute, active AMR) Figure 4. Theaaaa prevalence of acute, active AMR and chronic AMR increased to 52.9%(18/34) and 38.2%(13/34) by 1 year following dnDSA detection (p=0.04 and p=0.02, respectively), while the prevalence of acute cellular rejection was unchanged [20.0%(8/40) vs 14.7%(5/34) p=0.76] Figure 4.
Figure 4. Allograft rejection at De Novo DSA detection and in 1 year.
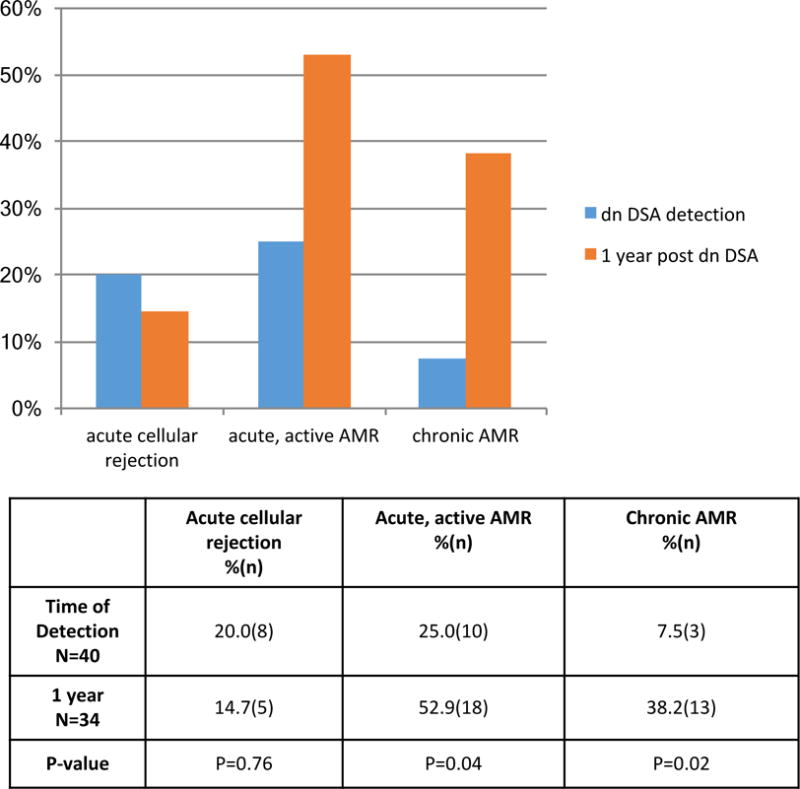
The prevalence of acute cellular rejection remained similar at 1 year post dnDSA detection, but there was increased acute, active and chronic AMR. The definition of acute, active, AMR was Banff 1) ptc + g score >2 or 2) ptc >0 or g> 0 and C4d >1. Chronic AMR was present if Banff cg score was >0. All patients with chronic AMR had concomitant acute, active AMR. McNemar’s paired analysis was used to compare serial biopsies.
65% (30/46) of the surviving allografts had biopsies 2 or more years after dnDSA detection. Acute, active AMR was present in 33.3% (10/30) and chronic AMR was present in 16.7% (5/30) of those remaining allografts. Only 3 patients (10% of patients who received a biopsy >1 year post dnDSA) had newly detected acute, active AMR that was not present at baseline or 1 year post-dnDSA.
The individual Banff scores at the time of dnDSA detection and at 1 year post dnDSA detection are presented in Figure 5. The prevalence of moderate glomerulitis was numerically increased the year following dnDSA detection, but this did not reach statistical significance [12.5% (5/40) up to 32.3% (11/34), p=0.07]. The prevalence of peritubular capillaritis, tubulitis, acute interstitial inflammation, endothelialitis, chronic vascular lesions, interstitial fibrosis, tubular atrophy, arteriolar hyalinosis, and C4d positivity was unchanged in the year following dnDSA detection; while the prevalence of chronic AMR (Banff cg score >0) increased [7.5% (3/40) up to 38.2%(13/34), p=0.02] Figure 5.
Figure 5. Allograft histology at De Novo DSA detection and in 1 year.
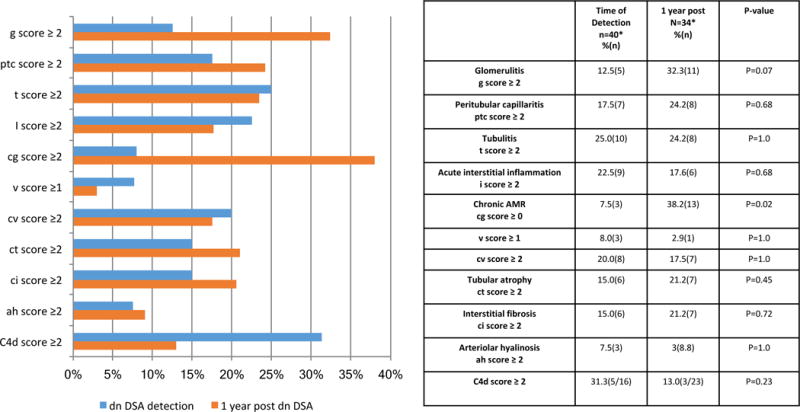
The prevalence of chronic AMR increased in the year following the detection of dnDSA. McNemar’s paired analysis was used to compare serial biopsies.
Allograft function
At the time of dnDSA detection, the mean iothalamate clearance was 55.0 ± 20.4 ml/min/BSA and at one year post detection, it decreased to 52.5 ± 18.6 ml/min/BSA, p<0.01 (paired t-test) Figure 6. At the end of follow-up (a mean of 3.2±2.0 years following dnDSA detection); the mean iothalamate GFR decreased to 44.5 ± 21.7 ml/min/BSA, p=0.01 (paired t-test). The 24 hour urine proteinuria increased from 391.4±865.5 to 603.6 ± 1035.8, but this did not reach statistical significance, p=0.24 (paired t test).
Figure 6. Allograft function and proteinuria when De Novo DSA detected and at follow-up.

At the time of dnDSA detection, the mean iothalamate clearance was 55.0± 20.4 ml/min/BSA and at one year post detection, it decreased to 52.5 ±18.6 ml/min/BSA, p<0.01 (paired t-test) During the entire follow-up following dnDSA detection (mean 3.2±2.0 years); the mean iothalamate GFR decreased to 44.5 ± 21.7 ml/min/BSA, p=0.01. During the same follow-up, the mean 24 hr. urine proteinuria increased from 391.4±865.5 to 603.6 ± 1035.8, but this did not reach statistical significance p=0.24.
Which patients with de novo DSA developed allograft failure or reduced eGFR?
Patients with dnDSA were followed 3.2 ± 2.0 years post dnDSA detection, and their outcomes were compared to those in patients without dnDSA. Patients with dnDSA had an increased incidence of allograft failure [13.0%(7/54) vs. 2.9%(21/717), p<0.01]; the composite end-point of graft failure and/or 50% reduction in eGFR [27.8%(15/54) vs. 9.6%(69/717), p<0.01]; acute, active AMR [54.9%(28/51) vs. 8.1%(57/702), p<0.01]; and chronic AMR [37.2%(19/51) vs. 6.8%(48/703), p<0.01] as compared to those patients without dnDSA Figure 7.
Figure 7. Allograft failure, eGFR decline, and AMR in patients with and without De novo DSA.
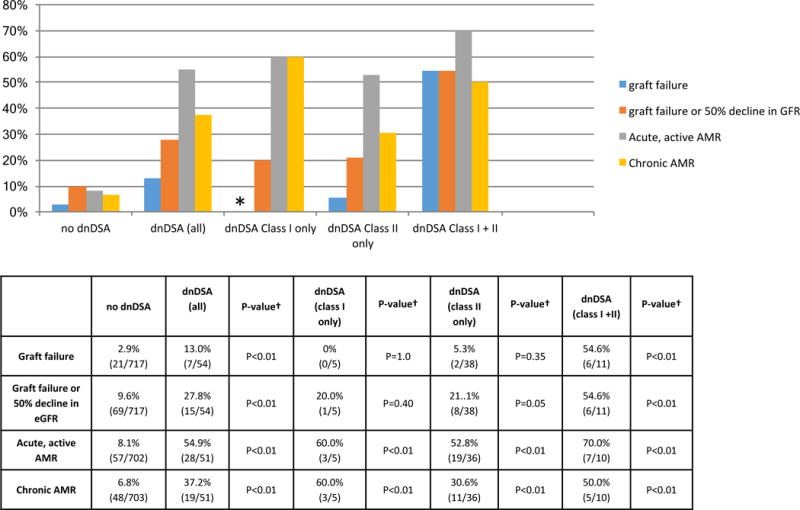
Graft failure, the composite end-point of graft failure and/or 50% reduction in GFR Acute, active AMR, and chronic AMR were higher in patients with dnDSA. Patients with both class I + II dnDSA had the highest rate of graft loss and 50% decline in eGFR. 94.4% (51/54) of patients received a biopsy. The mean follow-up post dn DSA was 3.2±2.0 years. * No patients with class I dnDSA only lost their allografts during follow-up. † All statistical comparisons were with the no dnDSA group.
The incidence of graft failure and the composite end-point was similar among patients with only class I, only class II, and no dnDSA detected during follow-up Figure 7. In contrast, both of these end-points were higher in patients with both class I and class II dnDSA detected. Graft failure and the composite end-point occurred in 54.6%(6/11) of patients with both class I and class II dnDSA (p<0.01 compared with no dnDSA) Figure 7.
However, the incidence of acute, active AMR and chronic AMR was higher in patients with dnDSA regardless of the class of dnDSA present Figure 7. The incidence of acute, active AMR was 60.0%(3/5), 52.8%(19/36), and 70.0%(7/10) in patients with class I, class I, and class I +II dnDSA, respectively (p<0.01 all classes). Chronic AMR was detected in 60.0% (3/5), 30.6% (11/36), and 50.0%(5/10) of patients with only class I, only class II, and both class I and II dnDSA, respectively (p<0.01 all classes).
No patients lost their allograft during follow-up if their dnDSA completely disappeared. The rates of the composite end-point; acute, active AMR; and chronic AMR; were similar in patients with transient de novo DSA as compared to patients without de novo DSA, Figure 8.
Figure 8. Allograft function and histology stratified by de novo DSA mean fluorescence intensity (MFI).
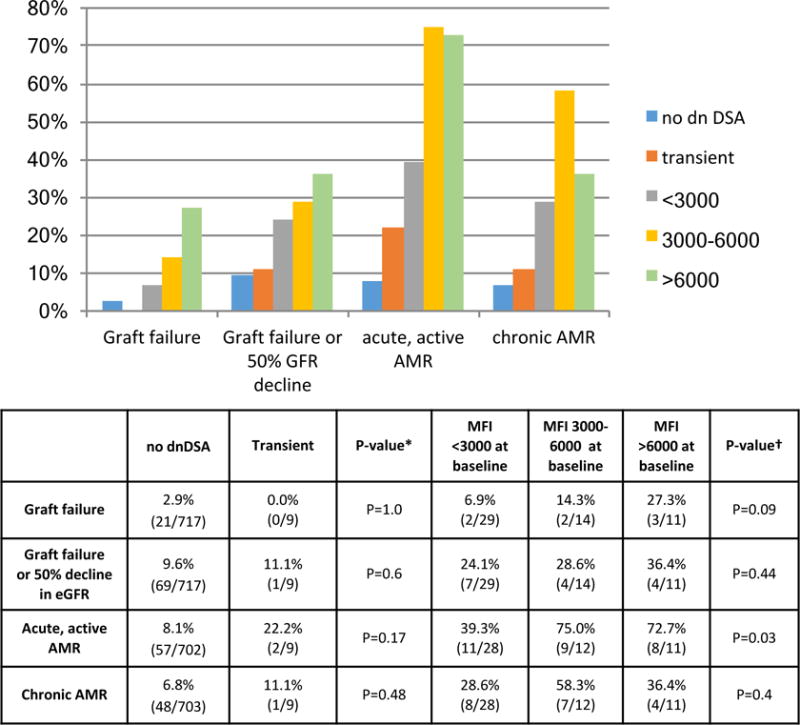
The rates allograft loss; composite end-point; acute, active AMR; and chronic AMR; were similar in patients with transient de novo DSA as compared to patients without de novo DSA. A higher sum MFI of dnDSA at baseline was associated with higher rates of acute, active, AMR (p=0.03, Cochran test for trend). * Comparison between outcomes in patients with no dnDSA and patients with transient dnDSA. †Cochran test for trend comparison outcomes in patients with dnDSA MFI < 3000, 3000–6000, and >6000 at baseline.
There were numeric trends toward increased allograft failure and the composite end-point in patients with a higher total sum MFI at baseline, but this did not reach statistical significance [p=0.09 and p=0.44 (Cochran test for trend); respectively]. Patients with a total MFI 3000–6000 and >6000 both had higher rates of acute, active AMR has compared to patients with a total MFI >3000 at baseline (p=0.03, Cochran test for trend). Specifically the rate of acute, active AMR was 39.3% (11/28) in patients with MFI < 3000 at baseline, 75.0% (8/11) in patients with MFI 3000–6000 at baseline, and 72.7%(8/11) if the MFI was >6000 at baseline. The rate of chronic AMR was similar in patients regardless of baseline total de novo DSA MFI Figure 8.
Of all the patients with dnDSA; only those patients with histologic evidence of acute, active, AMR either at DSA detection or on subsequent biopsy had an increased incidence of graft failure and/or 50% reduction in eGFR Figure 9. 21.4%(6/28) of the allografts failed in patients with dnDSA and AMR, while none of the allografts failed in patients with dnDSA and no AMR (p<0.01 dnDSA + AMR vs. no dnDSA; p=1.0 dnDSA without AMR vs no dnDSA). The incidence of graft failure and/or 50% reduction in eGFR occurred in 35.7% (10/28) of patients with dnDSA and AMR; 17.3% (4/23) of those with dnDSA and no AMR, and 9.6%(69/717) of patients with no dnDSA (p<0.01 dnDSA + AMR vs. no dnDSA; p=0.26 dnDSA without AMR vs. no dnDSA).
Figure 9. Acute, active AMR and dnDSA associated with allograft failure and eGFR decline.
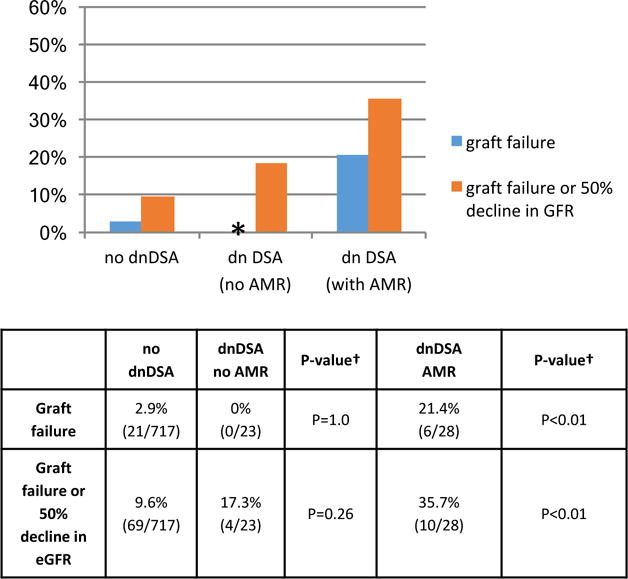
* No dnDSA patients without AMR lost their allograft during follow-up. † All statistical comparisons were to the no dnDSA group.
DISCUSSION
De novo DSA is associated with AMR and allograft loss, but most patients actually have a functioning allograft the first few years after dnDSA detection. In this study, patients with both anti class I and class II dnDSA had the highest rate of graft loss and the composite end-point of graft loss and/or 50% reduction in eGFR. Over half of this small subgroup of patients had allograft failure within 3.2 years following dnDSA detection. We also found that regardless of the class of dnDSA present, only those patients who developed AMR (i.e. microvascular inflammation) had allograft failure or the composite endpoint of allograft failure/50% eGFR, even when the vast majority of the AMR episodes in our cohort were subclinical. No patients in the dnDSA group without AMR had allograft loss.
The use of protocol biopsy allowed us to better understand the progression to AMR after dnDSA. When dnDSA was detected, only 25.0% had histologic findings of acute, active AMR but the incidence increased to 52.9% by 1 year post-dnDSA detection. Thus, patients without histologic evidence of AMR at the time of dnDSA detection may benefit from a follow-up biopsy within a year post dnDSA because AMR may be missed on the initial biopsy. Finding new AMR on biopsies performed beyond 1 year post dnDSA was unusual, which suggests that some patients with dnDSA never develop AMR. This deserves further study.
Although the single antigen bead output is semiquantitative, the sum MFI of de novo DSA at baseline has some prognostic value. The higher the sum MFI at baseline; the higher the incidence of acute, active AMR. Additionally, patients whose de novo DSA completely disappeared during follow-up had similar rates of graft failure, the composite end-point of graft failure and 50% decline in eGFR; acute, active, AMR; and chronic AMR as those without de novo DSA. De novo DSA completely disappeared in only a small number of patients—a phenomenon that also deserves further study.
Other studies on this subject have also reported detailed histologic findings following dnDSA, but most of the biopsies were obtained at the time of dnDSA detection(2) or for allograft dysfunction(3, 9). The incidence of AMR at the time of dnDSA detection was lower than that reported in other cohorts (6, 9), but that was likely because biopsies performed in our cohort were mainly performed for surveillance and not for allograft dysfunction. Our results are particularly informative because we studied biopsies at more than 1 time point (mean of 3 biopsies per patient). We also confirmed many previously reported findings. Like de Kort et al, we found that the presence of microvascular inflammation (acute, active AMR in our cohort) was associated with allograft failure(9). The overall incidence of dnDSA in our cohort was also consistent with that previously reported (2, 3, 6, 13) and we found that DQ mismatch, prior medication nonadherence, and acute cellular rejection were linked to the development of de novo DSA (2, 3, 6).
The main limitation of our study was the relatively short follow-up. We report the most comprehensive histologic follow-up after dnDSA; but the same patients did not have biopsies at all time points, which limited our ability to truly describe the evolution and timing of light microscopic findings. We also did not assess the impact of epitope mismatches on dnDSA development (19) or the effect of DSA characteristics such as titer, IgG subclasses, or C1q(20, 21) on prognosis. Lastly, we used a 50% reduction in eGFR as a clinical outcome, which is not currently approved by the FDA for clinical trials in transplantation (22, 23) (24).
These data re-emphasize the importance of developing effective therapy to either prevent dnDSA formation or treat its consequences, However, designing a clinical trial to study this is difficult. We believe a prevention trial is unreasonable given the relatively low incidence of dnDSA. As others have already discussed (6), a multicenter effort with thousands of patients would be required to adequately power a study and many patients would be treated unnecessarily. Even a treatment trial in patients with identified dnDSA would require a prolonged multicenter effort. The best approach may be to enroll dnDSA patients with acute, active AMR into a treatment trial as this is a large subset of patients at the greatest risk of graft failure. This approach would minimize the number of patients treated unnecessarily and maximize the potential to detect a meaningful effect from a potential therapeutic agent.
In conclusion, the development of dnDSA is associated with a progressive increase in antibody mediated injury in more than half of patients within one-year of detection. The patients who ultimately developed AMR were high risk for graft failure and/or 50% reduction in GFR. However, there are potentially modifiable risk factors including ensuring medication adherence and avoiding HLA mismatch, especially at the DQ loci.
Supplementary Material
Table S1: Individual diagnostic criteria for all cases of acute, active AMR.
Table 3.
De novo DSA Characteristics
| Class I (alone) | Class II (alone) | Class I + II | Class I (total) | Class II (total) | |
|---|---|---|---|---|---|
| % (n) | 9.3% (5) | 70.4% (38) | 20.4% (11) | 29.6% (16) | 90.7% (49) |
| Mean (± std) | 1668.2±1411.5 | 3612.0±3425.1 | 4348.2±5040.6 | 2075.8±2211.1 | 3949.5±4903.6 |
| Median (IQR) | 1492(1000–2708.5) | 1923(1274.5–4749.5) | 2800.5(1435–4881.5) | 1462(1083.75–2552) | 2176(1103–4117) |
Acknowledgments
This publication was made possible by CTSA Grant Number KL2 TR000136 from the National Center for Advancing Translational Sciences (NCATS), a component of the National Institutes of Health (NIH). I thank Byron Smith for his statistical support, and our nursing coordinators who help to make the long term follow-up of our patients possible.
Abbreviations
- AMR
antibody-mediated rejection
- dnDSA
de novo donor specific antibody
- SAB
single antigen bead
Footnotes
Supporting Information
Additional Supporting Information may be found in the online version of this article.
Disclosure: The authors of this manuscript have no conflicts of interest to disclose as described by American Journal of Transplantation.
References
- 1.Terasaki PI, Ozawa M. Predictive value of HLA antibodies and serum creatinine in chronic rejection: results of a 2-year prospective trial. Transplantation. 2005;80(9):1194–1197. doi: 10.1097/01.tp.0000174338.97313.5a. [DOI] [PubMed] [Google Scholar]
- 2.Wiebe C, Gibson IW, Blydt-Hansen TD, Karpinski M, Ho J, Storsley LJ, et al. Evolution and clinical pathologic correlations of de novo donor-specific HLA antibody post kidney transplant. Am J Transplant. 2012;12(5):1157–1167. doi: 10.1111/j.1600-6143.2012.04013.x. [DOI] [PubMed] [Google Scholar]
- 3.Everly MJ, Rebellato LM, Haisch CE, Ozawa M, Parker K, Briley KP, et al. Incidence and impact of de novo donor-specific alloantibody in primary renal allografts. Transplantation. 2013;95(3):410–417. doi: 10.1097/TP.0b013e31827d62e3. [DOI] [PubMed] [Google Scholar]
- 4.Hidalgo LG, Campbell PM, Sis B, Einecke G, Mengel M, Chang J, et al. De novo donor-specific antibody at the time of kidney transplant biopsy associates with microvascular pathology and late graft failure. Am J Transplant. 2009;9(11):2532–2541. doi: 10.1111/j.1600-6143.2009.02800.x. [DOI] [PubMed] [Google Scholar]
- 5.Hourmant M, Cesbron-Gautier A, Terasaki PI, Mizutani K, Moreau A, Meurette A, et al. Frequency and clinical implications of development of donor-specific and non-donor-specific HLA antibodies after kidney transplantation. J Am Soc Nephrol. 2005;16(9):2804–2812. doi: 10.1681/ASN.2004121130. [DOI] [PubMed] [Google Scholar]
- 6.Wiebe C, Gibson IW, Blydt-Hansen TD, Pochinco D, Birk PE, Ho J, et al. Rates and determinants of progression to graft failure in kidney allograft recipients with de novo donor-specific antibody. Am J Transplant. 2015;15(11):2921–2930. doi: 10.1111/ajt.13347. [DOI] [PubMed] [Google Scholar]
- 7.Cooper JE, Gralla J, Chan L, Wiseman AC. Clinical significance of post kidney transplant de novo DSA in otherwise stable grafts. Clin Transpl. 2011:359–364. [PubMed] [Google Scholar]
- 8.DeVos JM, Patel SJ, Burns KM, Dilioglou S, Gaber LW, Knight RJ, et al. De novo donor specific antibodies and patient outcomes in renal transplantation. Clin Transpl. 2011:351–358. [PubMed] [Google Scholar]
- 9.de Kort H, Willicombe M, Brookes P, Dominy KM, Santos-Nunez E, Galliford JW, et al. Microcirculation inflammation associates with outcome in renal transplant patients with de novo donor-specific antibodies. Am J Transplant. 2013;13(2):485–492. doi: 10.1111/j.1600-6143.2012.04325.x. [DOI] [PubMed] [Google Scholar]
- 10.Solez K, Colvin RB, Racusen LC, Haas M, Sis B, Mengel M, et al. Banff 07 classification of renal allograft pathology: updates and future directions. American journal of transplantation : official journal of the American Society of Transplantation and the American Society of Transplant Surgeons. 2008;8(4):753–760. doi: 10.1111/j.1600-6143.2008.02159.x. [DOI] [PubMed] [Google Scholar]
- 11.Solez K, Colvin RB, Racusen LC, Sis B, Halloran PF, Birk PE, et al. Banff ‘05 Meeting Report: differential diagnosis of chronic allograft injury and elimination of chronic allograft nephropathy (‘CAN’) American journal of transplantation : official journal of the American Society of Transplantation and the American Society of Transplant Surgeons. 2007;7(3):518–526. doi: 10.1111/j.1600-6143.2006.01688.x. [DOI] [PubMed] [Google Scholar]
- 12.Racusen LC, Solez K, Colvin RB, Bonsib SM, Castro MC, Cavallo T, et al. The Banff 97 working classification of renal allograft pathology. Kidney Int. 1999;55(2):713–723. doi: 10.1046/j.1523-1755.1999.00299.x. [DOI] [PubMed] [Google Scholar]
- 13.Hirai T, Furusawa M, Omoto K, Ishida H, Tanabe K. Analysis of predictive and preventive factors for de novo DSA in kidney transplant recipients. Transplantation. 2014;98(4):443–450. doi: 10.1097/TP.0000000000000071. [DOI] [PubMed] [Google Scholar]
- 14.Todeschini M, Cortinovis M, Perico N, Poli F, Innocente A, Cavinato RA, et al. In kidney transplant patients, alemtuzumab but not basiliximab/low-dose rabbit anti-thymocyte globulin induces B cell depletion and regeneration, which associates with a high incidence of de novo donor-specific anti-HLA antibody development. J Immunol. 2013;191(5):2818–2828. doi: 10.4049/jimmunol.1203261. [DOI] [PubMed] [Google Scholar]
- 15.Cai J, Terasaki PI, Bloom DD, Torrealba JR, Friedl A, Sollinger HW, et al. Correlation between human leukocyte antigen antibody production and serum creatinine in patients receiving sirolimus monotherapy after Campath-1H induction. Transplantation. 2004;78(6):919–924. doi: 10.1097/01.tp.0000134398.86243.81. [DOI] [PubMed] [Google Scholar]
- 16.Knechtle SJ, Pirsch JDH, Fechner JJ, Becker BN, Friedl A, Colvin RB, et al. Campath-1H induction plus rapamycin monotherapy for renal transplantation: results of a pilot study. Am J Transplant. 2003;3(6):722–730. doi: 10.1034/j.1600-6143.2003.00120.x. [DOI] [PubMed] [Google Scholar]
- 17.Bloom DD, Hu H, Fechner JH, Knechtle SJ. T-lymphocyte alloresponses of Campath-1H-treated kidney transplant patients. Transplantation. 2006;81(1):81–87. doi: 10.1097/01.tp.0000191940.13473.59. [DOI] [PubMed] [Google Scholar]
- 18.Bloom D, Chang Z, Pauly K, Kwun J, Fechner J, Hayes C, et al. BAFF is increased in renal transplant patients following treatment with alemtuzumab. Am J Transplant. 2009;9(8):1835–1845. doi: 10.1111/j.1600-6143.2009.02710.x. [DOI] [PMC free article] [PubMed] [Google Scholar]
- 19.Wiebe C, Pochinco D, Blydt-Hansen TD, Ho J, Birk PE, Karpinski M, et al. Class II HLA epitope matching-A strategy to minimize de novo donor-specific antibody development and improve outcomes. Am J Transplant. 2013;13(12):3114–3122. doi: 10.1111/ajt.12478. [DOI] [PubMed] [Google Scholar]
- 20.Guidicelli G, Guerville F, Lepreux S, Wiebe C, Thaunat O, Dubois V, et al. Non-Complement-Binding De Novo Donor-Specific Anti-HLA Antibodies and Kidney Allograft Survival. J Am Soc Nephrol. 2016;27(2):615–625. doi: 10.1681/ASN.2014040326. [DOI] [PMC free article] [PubMed] [Google Scholar]
- 21.Freitas MC, Rebellato LM, Ozawa M, Nguyen A, Sasaki N, Everly M, et al. The role of immunoglobulin-G subclasses and C1q in de novo HLA-DQ donor-specific antibody kidney transplantation outcomes. Transplantation. 2013;95(9):1113–1119. doi: 10.1097/TP.0b013e3182888db6. [DOI] [PubMed] [Google Scholar]
- 22.Coresh J, Turin TC, Matsushita K, Sang Y, Ballew SH, Appel LJ, et al. Decline in estimated glomerular filtration rate and subsequent risk of end-stage renal disease and mortality. Jama. 2014;311(24):2518–2531. doi: 10.1001/jama.2014.6634. [DOI] [PMC free article] [PubMed] [Google Scholar]
- 23.Levey AS, Inker LA, Matsushita K, Greene T, Willis K, Lewis E, et al. GFR decline as an end point for clinical trials in CKD: a scientific workshop sponsored by the National Kidney Foundation and the US Food and Drug Administration. Am J Kidney Dis. 2014;64(6):821–835. doi: 10.1053/j.ajkd.2014.07.030. [DOI] [PubMed] [Google Scholar]
- 24.Clayton PA, Lim WH, Wong G, Chadban SJ. Relationship between eGFR Decline and Hard Outcomes after Kidney Transplants. J Am Soc Nephrol. 2016 doi: 10.1681/ASN.2015050524. [DOI] [PMC free article] [PubMed] [Google Scholar]
Associated Data
This section collects any data citations, data availability statements, or supplementary materials included in this article.
Supplementary Materials
Table S1: Individual diagnostic criteria for all cases of acute, active AMR.


