

Abstract
Selumetinib (AZD6244, ARRY‐142886), a mitogen activated protein kinases (MEK1 and 2) inhibitor, has been granted orphan drug designation for differentiated thyroid cancer. The primary aim of this analysis was to characterize the population pharmacokinetics of selumetinib and its active metabolite N‐desmethyl‐selumetinib in patients with cancer. Concentration–time data from adult and pediatric clinical trials were pooled to develop a population pharmacokinetic model using a sequential approach where selumetinib and N‐desmethyl‐selumetinib data were modeled separately. A sequential zero‐ and first‐order absorption with lag time with a two‐compartment model for selumetinib and a two‐compartment model for N‐desmethyl‐selumetinib best described the concentration–time data. Intrapatient variability in absorption was higher than interpatient variability. The apparent drug clearance (CL/F) from the central compartment was 13.5 L/hr (RSE 4.9%). Significant covariates for CL/F were age, alanine aminotransferase, and body surface area. This study confirms that flat dosing is appropriate in adults, whereas body‐surface area based dosing should be used in pediatric patients.
Study Highlights.
WHAT IS THE CURRENT KNOWLEDGE ON THE TOPIC?
☑ Selumetinib, a potent and selective inhibitor of MEK1 and 2, is under clinical investigation for various solid tumors and hematological malignancies in children and adults. The noncompartmental pharmacokinetic parameters of selumetinib and N‐desmethyl‐selumetinib as well as the effect of food on pharmacokinetic parameters have been reported.
WHAT QUESTION DID THIS STUDY ADDRESS?
☑ This was the first population pharmacokinetic study of selumetinib and its active metabolite, N‐desmethyl‐selumetinib in children and adults with advanced cancer.
WHAT THIS STUDY ADDS TO OUR KNOWLEDGE
☑ This study identifies the sources of variability as well as quantifies inter‐ and intrapatient variability in selumetinib and N‐desmethyl‐selumetinib pharmacokinetics. The results of the study provide insight into selumetinib absorption and the effect of food on absorption.
HOW MIGHT THIS CHANGE DRUG DISCOVERY, DEVELOPMENT, AND/OR THERAPEUTICS?
☑ This study confirms that flat dosing is appropriate in adult patients whereas body‐surface area based dosing should be used in pediatric patients.
Selumetinib (AZD6244, ARRY‐142886) is a potent, selective, and adenosine triphosphate‐noncompetitive inhibitor of mitogen activated protein kinases (MEK)1/2. When tested in vitro using a panel of human cell lines, selumetinib selectively inhibited cell lines with BRAF and RAS mutations.1 Selumetinib exhibited an IC50 of <40 nM for inhibition of ERK1/2 phosphorylation in various solid tumor cell lines.2 In the Pediatric Preclinical Testing Program, selumetinib demonstrated modest in vitro and in vivo activity across a number of tumor panels despite inhibition of MEK1/2 activities.3 However, it was highly active against juvenile pilocytic astrocytoma xenografts (BT‐40) that harbor constitutively activated BRAF mutation, leading to complete tumor regressions.
Selumetinib has been evaluated for many adult and pediatric solid tumors or hematological malignancies as a single agent,4, 5, 6, 7, 8, 9, 10, 11, 12 in combination with cytotoxics,13, 14, 15, 16 or other targeted therapeutic agents.17 The initial formulation taken into adult phase I trials was a free‐base oral suspension, but it exhibited dose‐limited absorption due to low solubility/permeability.18 For easier administration and to achieve higher exposures, a capsule formulation of selumetinib as the hydrogen‐sulfate (Hyd‐sulfate) salt was developed for further investigation.19 The noncompartmental pharmacokinetics of selumetinib and N‐desmethyl‐selumetinib, an active metabolite with 3–5‐fold greater potency for MEK1 inhibition, were reported in that study. Selumetinib exhibited similar single‐dose (day 1) and steady‐state (day 8) pharmacokinetic parameters with minimal accumulation and a terminal elimination half‐life of 5.3–7.2 h. The median time to maximum concentration ranged between 1–1.5 h. Both the maximum plasma concentration (Cmax) and the area under the concentration–time curve (AUC) increased proportionally with increasing selumetinib dose. N‐desmethyl‐selumetinib exhibited a similar pharmacokinetic profile to selumetinib and the metabolite to parent AUC ratio was ∼0.15. As a result of that study, the recommended phase II dose was a flat‐dose of 75 mg twice daily (b.i.d.).19 In a randomized crossover study in cancer patients to evaluate the effect of food on selumetinib Hyd‐sulfate pharmacokinetics, absorption was decreased in the presence of food, resulting in a 62% and 19% reduction in Cmax and AUC, respectively.20
The aims of the present analysis were to characterize the population pharmacokinetics of selumetinib and its metabolite N‐desmethyl‐selumetinib in adults with advanced solid tumor and children with low‐grade glioma (LGG), to identify the sources of inter‐ and intrapatient pharmacokinetic variability, and to provide insights into selumetinib dosing in children and adults.
METHODS
Study design, population, and bioanalysis
Concentration–time data for selumetinib and N‐desmethyl‐selumetinib were pooled together from 107 patients in three different clinical trials (Study 16 includes adults with advanced non‐small cell lung cancer,21 Study 20 includes adults with advanced solid malignancies,20 and Study 29 includes children with recurrent LGG22) for developing the population pharmacokinetic model. An external validation of the model was performed using data from 44 children with recurrent LGG in a separate phase II clinical trial (Study 29B NCT01089101). Independent Ethics Committees approved all clinical studies, and all patients provided written informed consent. The details of these clinical studies are provided in the Supplemental Materials. All patients received selumetinib as an oral selumetinib Hyd‐sulfate capsule formulation. The details of the selumetinib and N‐desmethyl‐selumetinib LC MS/MS method are described in the Supplemental Materials.
Pharmacokinetic analysis
All data merging and manipulation were performed using R v. 3.0.1 (R Foundation for Statistical Computing, Vienna, Austria). A sequential two‐step analysis approach to model building was implemented. First, a population pharmacokinetic model of selumetinib was developed and then parent parameters were fixed to develop the population pharmacokinetic model for N‐desmethyl‐selumetinib. Pharmacokinetic data fitting was performed using NONMEM 7.3 (Icon Development Solutions, Ellicott City, MD). Parent drug concentrations that were below the lower limit of quantification (LLOQ) were fixed to zero, whereas metabolite concentrations that were below LLOQ were handled using the M4 method.23 Outliers were identified after fitting the base model to the dataset as the absolute values of weighted residuals greater than 6 (|WRES| >6) and corresponding observations were ignored from the dataset. Model selection criteria were based on the likelihood ratio test (LHR, P < 0.01) for nested models, Akaike Information Criteria (AIC) for nonnested models, diagnostic plots, the precision of parameter estimates, and a decrease in the interindividual and residual variability. Since the majority of individuals included sparse sampling, selumetinib population pharmacokinetic estimation was performed using the stochastic approximation expectation maximization (SAEM) method in combination with importance sampling using expectation step (EONLY=1) to run the covariance step.24, 25 N‐desmethyl‐selumetinib population pharmacokinetic estimation was performed using the Laplacian estimation method with interaction in combination with the importance sampling method using expectation step (EONLY=1) to run the covariance step.
Base model development
The actual sample collection times calculated with reference to last dosing time with their respective analyte concentration values were used for development of the base pharmacokinetic model. Based on visual inspection of raw concentration–time data, a two‐compartment model with different absorption models (e.g., zero‐order, first‐order, nonlinear, transit compartment, or sequential zero‐ and first‐order absorption models) was tested to determine a base model for selumetinib. Based on the differences seen in the concentration profiles under fed vs. fasted condition, the food condition was evaluated as a structural model covariate on the absorption parameters using a linear additive model for the selumetinib data. Bioavailability under the fasted condition was set to 1, and bioavailability for the fed condition was estimated as a change from 1. A one‐ and two‐compartment model was tested to determine a base model for N‐desmethyl‐selumetinib. During its model development, the pharmacokinetic parameters for selumetinib disposition were fixed for each patient/occasion to their individual post‐hoc estimates derived using the best‐fit selumetinib covariate model.26, 27 The volumes of the central compartment for selumetinib and N‐desmethyl‐selumetinib were assumed equal to avoid identifiability problem and the fraction of selumetinib metabolized to N‐desmethyl‐selumetinib was estimated.
Random effects (interindividual variability (IIV) and interoccasion variability (IOV)) associated with pharmacokinetic parameters were assumed to be log‐normally distributed. The correlation between etas and IOV were considered once the structural pharmacokinetic model was determined. Ultimately, a pharmacokinetic parameter was defined as:
where Pijk is the ith parameter for subject j and occasion k; θ 1 is the population parameter estimate for fasted condition; θ 2 is the covariate effect of fed condition on absorption parameters; ηij is the deviation from the population mean for subject j independent of occasion such that ; κijk is the deviation from the population mean for subject j and occasion k such that .
Residual variability was modeled using an additive and proportional error applied to linear concentrations for selumetinib and N‐desmethyl‐selumetinib as defined below:
where Yij and Fij are the observed and model predicted concentrations for subject i and time j; Eij,prop and Eij,add are proportional and additive residual errors, respectively such that . Additive residual variance was fixed considering assay quantification error of ∼20% at the LLOQ to minimize the weight of BLQ data in parameter estimation.
Covariate screening
The relationship between patient‐specific covariates and pharmacokinetic model parameters was incorporated into the model within the NONMEM model file using a predefined forward addition and backward elimination algorithm based on clinical relevance and plausibility. A full and reduced model for the effect of a covariate on a parameter was run and compared using the LHR test. A covariate was considered to be significant at P < 0.01 for forward addition and P < 0.001 for backward elimination. Continuous covariates were evaluated using a power model with a normalized covariate, whereas categorical covariates were evaluated using a power model. Estimated creatinine clearance (eCRCL), aspartate aminotransferase (AST), alanine transaminase (ALT), bilirubin, and albumin were evaluated for their effect on clearance parameters as continuous covariates. Age, height, body weight, and body surface area (BSA) were evaluated as continuous covariates, whereas sex and race were evaluated as categorical covariates on clearance and volume parameters. Creatinine clearance was estimated using the Schwartz formula for the pediatric patients,28 and Cockcroft‐Gault formula for adult patients.29 BSA was estimated using the Gehan and George formula.30 Race was self‐reported and categorized into Caucasian, non‐Caucasian, and others (includes unknown).
Population model performance and stability
The adequacy of the population pharmacokinetic model was evaluated based on various goodness‐of‐fit plots stratified by study and occasion, prediction‐corrected visual predictive check (pcVPC), nonparametric bootstrap, parameter shrinkages, and by external model validation (see Supplementary Materials for details).
Sensitivity analysis
The sensitivity analysis was performed using the final population pharmacokinetic model to evaluate the extent of the effect of a covariate on derived pharmacokinetic parameters (e.g., AUC0‐Inf and peak concentration at steady‐state (Cmax,SS)). The virtual patients for the sensitivity analysis were created by assigning different combinations of extreme (e.g., 5th and 95th percentile) and nominal values of the significant covariates observed for the adult and pediatric population in the analysis dataset. Pharmacokinetic parameters for virtual patients were calculated using 75 mg b.i.d. dosing of selumetinib for adult patients, whereas a dosage of 25 mg/m2 b.i.d. and a flat dose of 36 mg (25 mg/m2 * 1.44 m2 (median BSA)) b.i.d. were used for pediatric patients.
RESULTS
Study population
Data for 105 patients (72 adults and 33 children) were included in the population pharmacokinetic model development, and 44 pediatric patients were included in the external model validation (see Table 1). Two patients from Study 16 had no reported concentration–time data and were excluded from analysis. The model development cohort consisted of an approximately equal distribution of male (54%) and female (46%) patients with an age range of 5.6–79 years and weight range of 14–119 kg. Based on information provided in the data collection form, pediatric patients (Study 29) on 14 different occasions received drug with some form of food intake. However, the information regarding the amount, content, and timing relative to selumetinib administration was inadequate for modeling purposes (see below).
Table 1.
Patient demographic and laboratory parameters by study
| Parameters | Study 16 | Study 20 | Study 29 | Study 29B |
|---|---|---|---|---|
| N | 42 | 30 | 33 | 44 |
| Drug regimen | 75 mg b.i.d. | 75 mg | 25, 33, or 43 mg/m2 b.i.d. | 25 mg/m2 b.i.d. |
| Population | Advanced or metastatic non‐small cell lung cancer | Advanced solid malignancies | Recurrent or refractory low‐grade glioma | Recurrent or refractory low‐grade glioma |
| Age (years) |
60 (42, 79) |
60 (32, 77) |
13 (5.6, 21) |
10.0 (3.9, 20) |
| Body weight (kg) |
66.5 (41, 119) |
79.5 (42, 104) |
48.5 (14, 105) |
35.8 (15.7, 82.0) |
| Gender (M/F) | 20/22 | 21/9 | 16/17 | 23/21 |
| Race (Caucasian/Non‐Caucasian/Missing) | 40/1/1 | 27/2/1 | 30/2/1 | 38/6 |
| BSA (m2) |
1.76 (1.36, 2.46) |
1.97 (1.37, 2.29) |
1.45 (0.64, 2.17) |
1.19 (0.68, 1.90) |
| eCRCL (ml/min) |
69.6 (37.9, 143.4) |
86.5 (39.6, 160.4) |
90.0 (35.9, 175.9) |
93.9 (42.8, 155.5) |
| AST (units/L) |
18.8 (10, 41) |
21.0 (11, 97) |
24.0 (8, 49) |
22 (1, 43) |
| ALT (units/L) |
17.5 (7, 104) |
22.0 (9, 100) |
22.0 (12, 76) |
21 (1, 67) |
| Bilirubin (mg/dL) |
0.54 (0.19, 1.37) |
0.86 (0.40, 2.20) |
0.30 (0.10, 0.90) |
0.30 (0.10, 1.00) |
| Albumin (g/dL) |
4.1 (3.2, 5.7) |
4.1 (2.6, 5.1) |
4.1 (3.5, 5.0) |
4.1 (3.4, 4.8) |
| Food condition* (Fasted/Fed) | 79/0 | 28/30 | 48/14 | 35/9 |
Data are presented as median (min, max) unless indicated otherwise. *Food conditions were summarized considering individual occasions
A total of 2,418 selumetinib and N‐desmethyl selumetinib plasma concentration–time data points were included in the analysis. Approximately 8% of selumetinib concentrations were below the LLOQ, and were included in the analysis as zero, whereas 23% of the N‐desmethyl selumetinib concentrations were below LLOQ and were handled using the M4 method.23 Supplementary Figure 1 shows the raw concentration–time data for selumetinib and N‐desmethyl selumetinib concentrations under fasted and fed condition.
Best‐fit model development
Based on previously published data and an exploratory analysis of concentration–time data in this analysis, neither selumetinib nor N‐desmethyl‐selumetinib showed nonlinear disposition. We used a sequential modeling approach where we first developed a selumetinib model and then fixed the selumetinib parameters to their post‐hoc estimates to develop an N‐desmethyl‐selumetinib model.
During the initial selumetinib base model development, we tried to evaluate the information supplied by the pediatric patients (Study 29) regarding drug administration with food by fitting data from all studies with a two‐compartment model with sequential zero‐ and first‐order absorption in two different scenarios: 1) Pediatric data were considered as reported either under fed or fasted condition, 2) All pediatric data were assumed to be under fasted condition irrespective of reported condition. As depicted in Supplementary Figure 2, selumetinib concentration–time data in pediatric patients were better captured under the assumption of a fasted condition. For all subsequent modeling the concentration–time data from pediatric patients were treated as if collected under a fasted condition.
Among the different models tested, a two‐compartment model with sequential zero‐ and first‐order absorption best described plasma selumetinib disposition (Figure 1 , Step 1). This model resulted in the lowest AIC value (Supplementary Table 1) and on the basis of diagnostic plots gave better overall data fitting (Supplementary Figure 3). During base model development food was found to significantly affect the duration of first‐order input (D1), absorption lag‐time (ALAG1), and bioavailability (F1) with the rate and extent of selumetinib absorption decreased and the onset of drug absorption delayed. Therefore, food effect covariates were incorporated into the base model prior to covariate testing. Covariate analysis identified BSA and ALT as significant covariates for selumetinib apparent clearance (CL), and BSA and age as significant covariates for apparent volume of the central compartment (V2). All significant covariates showed a positive correlation with parameters except ALT. The IOV observed for D1 and ALAG1 relatively larger than their IIV (i.e., 50.3% and 55.9% vs. 41.3% and 40.6%).
Figure 1.
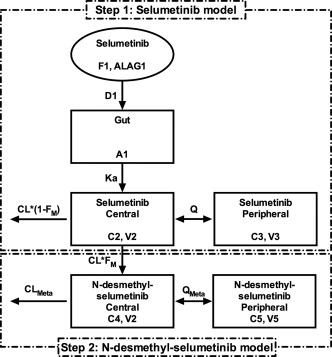
Population PK model diagram for selumetinib and its metabolite N‐desmethyl‐selumetinib. (“A,” “C,” and “V” are the amount, concentration, and volume of distribution, respectively, for indicated compartments. Other parameters are described along with their units in Table 2).
Among one‐ and two‐compartment models, we found that a two‐compartment model conditioned on the selumetinib population pharmacokinetic model and individual post‐hoc parameter estimates best described N‐desmethyl‐selumetinib plasma disposition (Figure 1 , Step 2). Since most of the below LLOQ metabolite data were in the terminal phase, use of the M4 method was necessary, and resulted in improved parameter estimation and model fitting (data not shown). The fraction of selumetinib metabolized to N‐desmethyl‐selumetinib (Fm) was ∼0.73 times lower at steady‐state than after a single dose (Supplementary Figure 4). Covariate analysis identified BSA as a significant covariate on Fm with a negative correlation. Estimation of IIV for intercompartmental clearance for metabolite (QMeta) and volume of the peripheral compartment for metabolite (V5) resulted in large standard errors of estimates (RSE >100%). Ultimately, IIV for these parameters was fixed to zero.
A full covariance structure was used to account for IIV in F1. The final model parameter structure is given by the following equations, whereas final model parameter estimates are given in Table 2.
Table 2.
Final parameter estimates for population plasma pharmacokinetic model of selumetinib and N‐desmethyl selumetinib
| Parameter (unit) | Parameter description | Parameter estimate | SE (RSE) |
Bootstrap summary Median (95% CI) |
|
|---|---|---|---|---|---|
| Population parameters for selumetinib | |||||
| θ1 (nmol/hr) | Duration of zero‐order drug input in the gut (D1) | 0.622 | 0.062 (10) | 0.612 (0.493–0.756) | |
| θ2 (hr) | Lag‐time for drug appearance in the gut (ALAG1) | 0.319 | 0.0279 (8.7) | 0.331 (0.293–0.376) | |
| θ3 (L/hr) | Apparent drug clearance from central compartment (CL/F) | 13.5 | 0.662 (4.9) | 13.6 (12.7–14.7) | |
| θ4 (L) | Apparent drug volume of distribution for central compartment (V2/F) | 32.6 | 1.78 (5.5) | 31.7 (16.9–37.9) | |
| θ5 (L) | Apparent drug volume of distribution for peripheral compartment (V3/F) | 55 | 5.34 (9.7) | 53.8 (43.7–67.0) | |
| θ6 (L/hr) | Apparent drug inter‐compartmental clearance (Q/F) | 8.2 | 0.557 (6.8) | 8.1 (6.3–10.4) | |
| θ7 (1/hr) | First‐order absorption rate constant for drug from gut (Ka) | 3.7 | 0.335 (9.1) | 3.7 (1.1–5.1) | |
| θ8 | Linear coefficient for drug bioavailability under fed condition | 0.117 | 0.0865 (73.9) | 0.119 (0.024–0.209) | |
| θ9 (nmol/hr) | Linear coefficient for duration of zero order drug input in the gut under fed condition | 4.09 | 0.335 (8.2) | 4.05 (2.46–4.57) | |
| θ10 (hr) | Linear coefficient for lag‐time in the gut under fed condition | 0.348 | 0.0209 (6.0) | 0.349 (0.303–0.475) | |
| θ11 | Power coefficient for influence of BSA on apparent drug clearance | 0.923 | 0.141 (15.3) | 0.892 (0.615–1.251) | |
| θ12 | Power coefficient for influence of BSA on apparent drug volume of central compartment | 1.24 | 0.367 (29.6) | 1.04 (0.22–2.08) | |
| θ13 | Power coefficient for influence of age on apparent drug volume of central compartment | 0.327 | 0.0956 (29.2) | 0.357 (0.137–0.596) | |
| θ14 | Power coefficient for influence of ALT on apparent drug clearance | 0.187 | 0.0453 (24.2) | 0.212 (0.110–0.316) | |
| Interindividual variability for selumetinib | |||||
| ωD1, IIV | Interindividual variance for D1 | 0.171 | 0.0005 (0.3) | 0.217 (0.084–0.495) | |
| ωALAG1, IIV | Interindividual variance for ALAG1 | 0.165 | 0.078 (47.2) | 0.168 (0.084–0.285) | |
| ωCL, IIV | Interindividual variance for CL | 0.070 | 0.017 (23.9) | 0.076 (0.042–0.118) | |
| ωV2, IIV | Interindividual variance for V2 | 0.201 | 0.062 (30.9) | 0.173 (0.074–0.478) | |
| ωV3, IIV | Interindividual variance for V3 | 0.388 | 0.083 (21.5) | 0.340 (0.193–0.552) | |
| ωQ, IIV | Interindividual variance for Q | 0.295 | 0.006 (2.20) | 0.279 (0.116–0.619) | |
| Corr(ηD1, ηALAG1) | Correlation between ηD1 and ηALAG1 | 0.664 | — | — | |
| Corr(ηD1, ηV2) | Correlation between ηD1 and ηV2 | 0.820 | — | — | |
| Corr(ηALAG1, ηV2) | Correlation between ηALAG1 and ηV2 | 0.578 | — | — | |
| Corr(ηCL, ηV2) | Correlation between ηCL and ηV2 | 0.519 | — | — | |
| Corr(ηV3, ηQ) | Correlation between ηV3 and ηQ | 0.623 | — | — | |
| Inter‐occasion variability for selumetinib | |||||
| ωD1,IOV | Inter‐occasion variance for D1 | 0.253 | 0.113 (44.7) | 0.257 (0.109–0.566) | |
| ωALAG1, IOV | Inter‐occasion variance for ALAG1 | 0.312 | 0.070 (22.5) | 0.297 (0.196–0.409) | |
| ωCL, IOV | Inter‐occasion variance for CL | 0.025 | 0.021 (85.9) | 0.027 (0.013–0.042) | |
| ωV2, IOV | Inter‐occasion variance for V2 | 0.190 | 0.044 (23.1) | 0.235 (0.115–0.655) | |
| Residual variability for selumetinib | |||||
|
|
Proportional residual error | 0.124 | 0.0156 (12.6) | 0.119 (0.102–0.137) | |
|
|
Additive residual error | 0.63 FIX | — | — | |
| Population parameters for N‐desmethyl‐selumetinib | |||||
| θ15 | Fraction of selumetinib metabolized to N‐desmethyl‐selumetinib (FM) | 1.37 | 0.127 (9.3) | 1.37 (1.28–1.44) | |
| θ16 (L/hr) | Apparent metabolite clearance from central compartment (CLMeta/F) | 240 | 20.4 (8.5) | 246 (232–275) | |
| θ17 (L/hr) | Apparent metabolite inter‐compartmental clearance (QMeta/F) | 49.5 | 7.07 (14.3) | 50.0 (43.7–58.9) | |
| θ18 (L) | Apparent metabolite volume of distribution for peripheral compartment (V5/F) | 413 | 54.2 (13.1) | 413 (349–505) | |
| θ19 (L/hr) | Linear coefficient for steady‐state on fraction metabolized | 0.274 | 0.0449 (16.4) | 0.274 (0.244–0.318) | |
| θ20 | Power coefficient for influence of BSA on fraction metabolized | 0.908 | 0.163 (18.0) | 0.909 (0.792–1.095) | |
| Interindividual variability for N‐desmethyl‐selumetinib | |||||
| ωFM,IIV | Inter‐individual variance for FM | 0.162 | 0.0463 (28.6) | 0.215 (0.121–1.542) | |
| ωCLMeta, IIV | Inter‐individual variance for CLMeta | 0.152 | 0.0397 (26.1) | 0.226 (0.109–1.326) | |
| Corr(ηFM, ηCLMeta) | Correlation between ηFM and ηCLMeta | 0.105 | ‐ | ‐ | |
| Inter‐occasion variability for N‐desmethyl‐selumetinib | |||||
| ωFM, IOV | Inter‐occasion variance for FM | 0.116 | 0.019 (16.4) | 0.138 (0.089–0.747) | |
| Residual variability for N‐desmethyl‐selumetinib | |||||
|
|
Proportional residual error | 0.288 | 0.0082 (2.9) | 0.294 (0.278–0.322) | |
|
|
Additive residual error | 0.63 FIX | ‐ | ‐ | |
Model evaluation
As shown in the goodness‐of‐fit plots (Supplementary Figures 5 and 6), predicted concentrations correlated well with observed concentrations, and weighted‐residual errors are distributed randomly around zero, suggesting that the best‐fit population pharmacokinetic model for selumetinib and N‐desmethyl‐selumetinib fitted concentration–time data well and without bias. Interindividual as well as residual variability were distributed symmetrically around zero. A high correlation (defined as an absolute value of the correlation coefficient greater than 0.60) between etas of D1 and ALAG1, D1 and V2, selumetinib volume of the peripheral compartment (V3) and intercompartmental clearance (Q), and FM and N‐desmethyl‐selumetinib clearance (CLMeta) was observed. The shrinkage for D1, ALAG1, CL, V2, V3, Q, FM, and CLMeta was 29%, 35%, 18%, 27%, 30%, 33%, 33%, and 34%, respectively. As depicted in Figure 2, pcVPC plots of selumetinib and N‐desmethyl‐selumetinib indicated good concordance between the 5th, 50th, and 95th percentile of the prediction interval and the observed concentrations over the time interval studied, suggesting the best‐fit model was effective to represent the disposition of parent and metabolite concentrations in plasma. Of note, a slight overprediction was observed at the lower range of selumetinib concentrations during the absorption phase. The bootstrap results were in good agreement with the final parameter estimates. The final parameter estimates were well within the 95% confidence intervals (CIs) derived from the bootstrap analysis. The bias of fixed effect parameters was <5% for all parameters except for θ12, θ13, and θ14, whereas the bias for random effect parameters was <27% for all parameters except for IIV for FM, and CLMeta.
Figure 2.
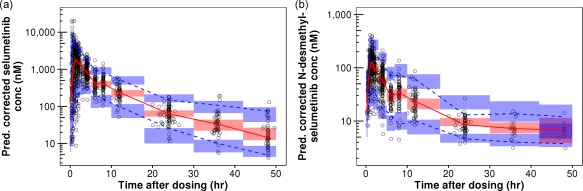
Prediction‐corrected visual predictive checks (pcVPC) plots for selumetinib (a) and N‐desmethyl‐selumetinib (b). Open circles represents prediction‐corrected observed concentrations. Blue bins represent a simulation‐based 95% CI for 5th and 95th prediction percentiles of prediction‐corrected concentrations, whereas red bin represents a simulation‐based 95% CI for 50th prediction percentiles of prediction‐corrected concentrations. Blue dashed lines represent observed 5th and 95th percentiles of prediction‐corrected concentrations, whereas red dashed‐line represents observed 50th percentile of prediction‐corrected concentrations.
A total of 258 selumetinib and metabolite concentration–time data from 44 pediatric patients (Study 29B) were used for external validation of the best‐fit population pharmacokinetic model. As demonstrated in the pcVPC plots (Supplementary Figure 7), the observed selumetinib and N‐desmethyl‐selumetinib concentrations were well within prediction intervals over most timepoints, suggesting the best‐fit population pharmacokinetic model adequately represented the external dataset. As shown in Figure 3, the Q‐Q plot suggests a normal distribution of NPDEs. Further, the Wilcoxon signed‐rank test (P = 0.16) suggested that the mean of the NPDEs was not significantly different from 0, the Fisher test (P = 0.60) suggested that the variance of NPDEs was not significantly different from 1, and the Shapiro–Wilks test (P = 0.43) suggested that NPDEs followed the normality assumption.
Figure 3.

Q‐Q plot for NPDEs: Observed quantiles of NPDEs calculated using post‐hoc Bayesian prediction of external validation dataset plotted against theoretical quantiles.
Effect of covariates on selumetinib pharmacokinetics
The effects of covariates on AUC0‐Inf and Cmax,SS were evaluated using the 95% CIs of the covariate values in the respective patient population relative to their nominal values. In adult patients (Figure 4) dosed with a flat 75 mg b.i.d. selumetinib, the covariates led to no more than a 23% difference in the AUC0‐Inf of parent drug or metabolite, but the presence of food did significantly alter (decrease by ∼50%) the Cmax,SS for parent drug and N‐desmethyl‐selumetinib. As depicted in Figure 5, children dosed with 25 mg/m2 b.i.d. selumetinib, the covariates were associated with < 23% change in the AUC0‐Inf and Cmax,SS relative to the nominal patient. The importance of dosing selumetinib by BSA in children is demonstrated in Supplementary Figure 8, where we show the results of a sensitivity analysis where children were dosed with a flat selumetinib dose (36 mg b.i.d.). For children with extreme values of BSA, the range of AUC0‐Inf and Cmax,SS was 66 to 176% relative to a nominal patient (Supplementary Figure 8). This was not the case in adult patients dosed with a flat selumetinib dose (75 mg b.i.d.), as the pharmacokinetic parameters for both parent drug and metabolite were within the range of 74–121% for the observed range of BSA values.
Figure 4.
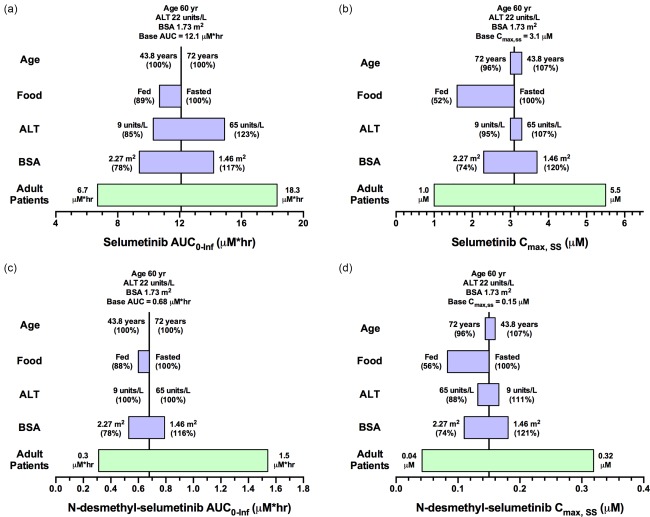
Sensitivity plot representing the effect of covariates on selumetinib AUC0‐Inf (a), selumetinib Cmax,ss (b), N‐desmethyl‐selumetinib AUC0‐Inf (c), and N‐desmethyl‐selumetinib Cmax,ss (d) for a representative adult patient. The base value of the pharmacokinetic parameter is represented using a vertical line and the value above the line represents the predicted parameter value in an adult patient with the nominal covariate value. The green horizontal bar with a value on each side represents the 5th and 95th percentile of the pharmacokinetic parameter range across the entire adult population. The blue bar represents the effect of the single covariate (in the range of the 5th and 95th percentile of the observed covariate) on the pharmacokinetic parameter after twice‐daily dosing of 75 mg selumetinib. Values in parentheses on each side of the blue bar represent the percent of the pharmacokinetic parameter compared to the base value (5th and 95th percentile of the covariate value, respectively) as indicated without parentheses.
Figure 5.
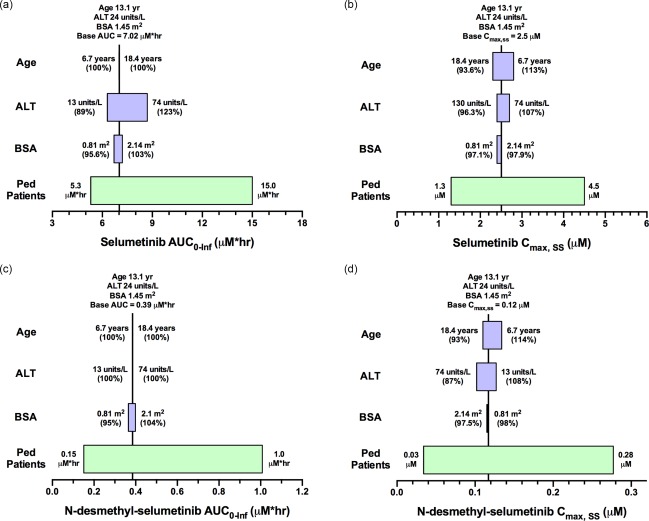
Sensitivity plot representing the effect of covariates on selumetinib AUC0‐Inf (a), selumetinib Cmax,ss (b), N‐desmethyl‐selumetinib AUC0‐Inf (c), and N‐desmethyl‐selumetinib Cmax,ss (d) for a representative pediatric patient. The base value of the pharmacokinetic parameter is represented using a vertical line and the value above the line represents the predicted parameter value in a pediatric patient with the nominal covariate value. The green horizontal bar with a value on each side represents the 5th and 95th percentile of the pharmacokinetic parameter range across the entire pediatric population. The blue bar represents the effect of the single covariate (in the range of the 5th and 95th percentile of the observed covariate) on the pharmacokinetic parameter after twice‐daily dosing of 25 mg/m2 selumetinib. Values in parentheses on each side of the blue bar represent the percent of the pharmacokinetic parameter compared to the base value (5th and 95th percentile of the covariate value, respectively) as indicated without parentheses.
DISCUSSION
This is the first analysis describing the population pharmacokinetics of selumetinib and N‐desmethyl‐selumetinib after oral administration in both adults and children with cancer. The pharmacokinetics of selumetinib was best described by a two‐compartment model with sequential zero‐ and first‐order absorption and a lag time, while N‐desmethyl‐selumetinib was best described by a two‐compartment model. We noted that intrapatient variability in absorption parameters was high compared to interpatient variability and food intake was a significant covariate on bioavailability, zero‐order drug input in the gut, and lag‐time.
Large inter‐ and intrapatient variability in absorption parameters (e.g., ALAG1) is commonly observed with orally administered drugs. Although selumetinib showed large inter‐ and intrapatient variability (>40%) with D1 and ALAG1, the pcVPC plot in the model development and validation cohorts (Figure 2 and Supplementary Figure 7) shows the model accounts for the overall selumetinib plasma disposition and variability. A slight overprediction was observed for the 5th percentile of observed concentrations during the absorption phase, which might be due to the patients with relatively large unexplained variability in ALAG1 or D1. However, the standard errors for inter‐ and intrapatient variability of the absorption parameters were <50%, indicating the estimates maintained precision despite the high variability in ALAG1 or D1.
The mean Fm after a single selumetinib dose was estimated to be greater than 1 and decreased by ∼25% during steady state. To avoid identifiability issues, we fixed the metabolite volume of the central compartment equal to the parent and estimated the Fm parameter. However, estimation of the Fm value greater than 1 suggested that the central volume of distribution for N‐desmethyl‐selumetinib might be lower than that of selumetinib. The underlying mechanism for a reduced Fm at steady state is unclear. Further, due to a structural identifiability problem it is not discernible whether this was related to Fm or the metabolite central volume of distribution (V4). Nevertheless, the contribution of a lower Fm at steady state would be minimal on overall selumetinib clearance. Previously, the Fm was estimated to be 15% based on a ratio of AUCs for N‐desmethyl‐selumetinib to that of selumetinib using molar concentrations.19 Hence, a decrease of Fm at steady state by 25.6% would alter the disposition of the parent drug selumetinib by <4%.
To utilize the data generated in the present study (i.e., covariates) to provide clinical recommendations about selumetinib dosing, it is important to thoroughly understand the exposure–efficacy and exposure–safety relationships. That information is not available from the present analysis because efficacy data were available from only one of the three datasets used for model development (Study 16). To our knowledge, no clinical study has reported a quantitative pharmacodynamic relationship for selumetinib, although Denton and Gustafson31 showed in a mouse model that selumetinib had a hysteretic relationship at systemic exposures similar to that observed in humans.
In the absence of specific exposure–response relationships, we performed sensitivity analyses to assess the effect of the significant covariates on pharmacokinetic parameters AUC0‐Inf and Cmax,SS. For adults administered a flat dose of selumetinib over the range of BSA values observed in the present study, we would predict selumetinib Cmax,SS would range from 74–120%, whereas AUC0‐Inf would range from 78–117%. For pediatric patients administered BSA‐based selumetinib dosing, BSA altered AUC0‐Inf and Cmax,SS marginally in the range of 95–104%. In contrast, when children received a flat dose of selumetinib, BSA altered pharmacokinetic parameters considerably, in the range of 66–170% (Supplementary Figure 8). Thus, these results suggested flat dosing is appropriate for adults, whereas BSA‐based dosing is appropriate for the pediatric patient.
The effect of variations in ALT on AUC0‐Inf and Cmax,SS was also examined by sensitivity analyses. Selumetinib and N‐desmethyl‐selumetinib are eliminated primarily via liver metabolism and biliary excretion; thus, it is likely that hepatic impairment could affect drug clearance. However, the observed range of ALT values caused minimal changes in pharmacokinetic parameters (85–123%), and hence did not warrant dosage adjustment. This is likely because all patients we studied had normal liver function as per exclusion criteria in the three clinical trials (e.g., patients with ALT or AST values greater than 2.5 × upper limit of normal are not eligible).
Prior attempts to develop a model based solely on pediatric data poorly characterized absorption due to a limited number of samples collected in that phase. The inclusion of densely sampled data from adults (Study 20) with 1–4 samples during the absorption phase (depending on food condition) allowed exploration of complex absorption models (e.g., nonlinear, transit compartment, sequential zero‐ and first‐order). Selumetinib showed rapid absorption when given under fasted conditions, but exhibited a delayed onset, decreased extent and rate of absorption when administered with a high‐fat meal. This phenomenon was best explained by a sequential zero‐ and first‐order absorption model with a lag time, where a high‐fat meal was assumed to delay tablet dissolution and decrease the zero‐order drug dissolution rate, but didn't impact first‐order absorption. As depicted in our sensitivity analysis (see Figure 4), a high‐fat meal decreased selumetinib AUC0‐Inf by 11% and Cmax,SS by 48%, and had a similar effect on the N‐desmethyl‐selumetinib AUC0‐Inf and Cmax,SS.
For children, the question of whether selumetinib should be administered with food is not easily addressed with the results from this study. Since the effect of food on selumetinib pharmacokinetics was not a primary objective of the pediatric clinical trial, data were not collected to directly address this question. Moreover, from our clinical experience in the pediatric oncology population, unless compelling evidence exists to take medications with food it is unlikely they will. Considering the recommendation for administration of selumetinib without food for adults (see above), it is highly likely that children will be able to take selumetinib without regard to food intake.
Food effect data are available for two other MEK inhibitors including trametinib and cobimetinib. With trametinib a high‐fat, high‐calorie meal decreased the AUC by 24%, Cmax by 70%, and delayed Tmax by ∼4 h as compared to fasted conditions.32 This led to the recommended dosing for trametinib, which is to “take at least 1 h before or 2 h after a meal,” indicating that food has some effect. The dosing recommendation for cobimetinib is that it can be given without regard to food, suggesting that food does not have an effect on cobimetinib disposition. Given the modest effect on overall plasma exposure (AUC0‐Inf), if the therapeutic effect of selumetinib is mediated by AUC, it should not be necessary to avoid food in adults.
In summary, a sequential zero‐ and first‐order absorption model after a lag time with a two‐compartment plasma disposition model for selumetinib and a two‐compartment model for N‐desmethyl‐selumetinib adequately described the pharmacokinetics of both parent drug and metabolite. Large intrapatient variability in absorption parameters was observed compared to interpatient variability. The flat dosing of 75 mg b.i.d. selumetinib is recommended in adult patients, whereas BSA‐based dosing of 25 mg/m2 b.i.d. selumetinib is recommended in pediatric patients under fasting condition. This population pharmacokinetic model of selumetinib and N‐desmethyl‐selumetinib can be used to guide the further clinical development of selumetinib in adult and pediatric populations.
Supporting information
Supporting Information
Supporting Information
Supporting Information
Supporting Information
Supporting Information
Supporting Information
Supporting Information
Supporting Information
Supporting Information
Supporting Information
Supporting Information
Supporting Information
Supporting Information
Acknowledgments
The authors acknowledge the support of AstraZeneca for the clinical trials from which the selumetinib and N‐desmethyl‐selumetinib pharmacokinetic data were derived. The authors acknowledge the contribution of the High Performance Computing Facility (HPCF) at St. Jude Children's Research Hospital for providing parallel processing resources for this data analysis. Supported in part by National Institutes of Health Grant No. U01 CA81457 to the Pediatric Brain Tumor Consortium, CA21765, and the American Lebanese Syrian Associated Charities. AstraZeneca provided support for Dr. Parul Patel's postdoctoral fellowship.
Author Contributions
C.F.S., Y.T.P., V.M.D., and D.J.C. wrote the article; C.F.S., Y.T.P., V.M.D., D.Z., J.F., P.D.M., and L.A. designed the research; C.F.S. and Y.T.P. performed the research; Y.T.P., P.P., and D.J.C. analyzed the data.
References
- 1. Davies, B.R. et al AZD6244 (ARRY‐142886), a potent inhibitor of mitogen‐activated protein kinase/extracellular signal‐regulated kinase kinase 1/2 kinases: mechanism of action in vivo, pharmacokinetic/pharmacodynamic relationship, and potential for combination in preclinical models. Mol. Cancer Ther. 6, 2209–2219 (2007). [DOI] [PubMed] [Google Scholar]
- 2. Yeh, T.C. et al Biological characterization of ARRY‐142886 (AZD6244), a potent, highly selective mitogen‐activated protein kinase kinase 1/2 inhibitor. Clin. Cancer Res. 13, 1576–1583 (2007). [DOI] [PubMed] [Google Scholar]
- 3. Kolb, E.A. et al Initial testing (stage 1) of AZD6244 (ARRY‐142886) by the Pediatric Preclinical Testing Program. Pediatr . Blood Cancer 55, 668–677 (2010). [DOI] [PMC free article] [PubMed] [Google Scholar]
- 4. Bekaii‐Saab, T. et al Multi‐institutional phase II study of selumetinib in patients with metastatic biliary cancers. J. Clin. Oncol. 29, 2357–2363 (2011). [DOI] [PMC free article] [PubMed] [Google Scholar]
- 5. Bodoky, G. et al A phase II open‐label randomized study to assess the efficacy and safety of selumetinib (AZD6244 [ARRY‐142886]) versus capecitabine in patients with advanced or metastatic pancreatic cancer who have failed first‐line gemcitabine therapy. Investig. New Drugs 30, 1216–1223 (2012). [DOI] [PubMed] [Google Scholar]
- 6. Catalanotti, F. et al Phase II trial of MEK inhibitor selumetinib (AZD6244, ARRY‐142886) in patients with BRAFV600E/K‐mutated melanoma. Clin. Cancer Res. 19, 2257–2264 (2013). [DOI] [PMC free article] [PubMed] [Google Scholar]
- 7. Farley, J. et al Selumetinib in women with recurrent low‐grade serous carcinoma of the ovary or peritoneum: an open‐label, single‐arm, phase 2 study. Lancet Oncol. 14, 134–140 (2013). [DOI] [PMC free article] [PubMed] [Google Scholar]
- 8. Hainsworth, J.D. et al A phase II, open‐label, randomized study to assess the efficacy and safety of AZD6244 (ARRY‐142886) versus pemetrexed in patients with non‐small cell lung cancer who have failed one or two prior chemotherapeutic regimens. J. Thorac. Oncol. 5, 1630–1636 (2010). [DOI] [PubMed] [Google Scholar]
- 9. Hayes, D.N. et al Phase II efficacy and pharmacogenomic study of Selumetinib (AZD6244; ARRY‐142886) in iodine‐131 refractory papillary thyroid carcinoma with or without follicular elements. Clin. Cancer Res. 18, 2056–2065 (2012). [DOI] [PMC free article] [PubMed] [Google Scholar]
- 10. Jain, N. et al Phase II study of the oral MEK inhibitor selumetinib in advanced acute myelogenous leukemia: a University of Chicago phase II consortium trial. Clin. Cancer Res. 20, 490–498 (2014). [DOI] [PMC free article] [PubMed] [Google Scholar]
- 11. Kirkwood, J.M. et al Phase II, open‐label, randomized trial of the MEK1/2 inhibitor selumetinib as monotherapy versus temozolomide in patients with advanced melanoma. Clin. Cancer Res. 18, 555–567 (2012). [DOI] [PMC free article] [PubMed] [Google Scholar]
- 12. O'Neil, B.H. et al Phase II study of the mitogen‐activated protein kinase 1/2 inhibitor selumetinib in patients with advanced hepatocellular carcinoma. J. Clin. Oncol. 29, 2350–2356 (2011). [DOI] [PMC free article] [PubMed] [Google Scholar]
- 13. Gupta, A. et al DOC‐MEK: a double‐blind randomized phase II trial of docetaxel with or without selumetinib in wild‐type BRAF advanced melanoma. Ann. Oncol. 25, 968–974 (2014). [DOI] [PubMed] [Google Scholar]
- 14. Hochster, H.S. et al Phase II study of selumetinib (AZD6244, ARRY‐142886) plus irinotecan as second‐line therapy in patients with K‐RAS mutated colorectal cancer. Cancer Chemother. Pharmacol. 75, 17–23 (2015). [DOI] [PubMed] [Google Scholar]
- 15. Patel, S.P. et al Clinical responses to selumetinib (AZD6244; ARRY‐142886)‐based combination therapy stratified by gene mutations in patients with metastatic melanoma. Cancer 119, 799–805 (2013). [DOI] [PubMed] [Google Scholar]
- 16. Robert, C. et al Selumetinib plus dacarbazine versus placebo plus dacarbazine as first‐line treatment for BRAF‐mutant metastatic melanoma: a phase 2 double‐blind randomised study. Lancet Oncol. 14, 733–740 (2013). [DOI] [PubMed] [Google Scholar]
- 17. Wilky, B.A. et al A phase I trial of vertical inhibition of IGF signalling using cixutumumab, an anti‐IGF‐1R antibody, and selumetinib, an MEK 1/2 inhibitor, in advanced solid tumours. Br. J. Cancer 112, 24–31 (2015). [DOI] [PMC free article] [PubMed] [Google Scholar]
- 18. Adjei, A.A. et al Phase I pharmacokinetic and pharmacodynamic study of the oral, small‐molecule mitogen‐activated protein kinase kinase 1/2 inhibitor AZD6244 (ARRY‐142886) in patients with advanced cancers. J. Clin. Oncol. 26, 2139–2146 (2008). [DOI] [PMC free article] [PubMed] [Google Scholar]
- 19. Banerji, U. et al The first‐in‐human study of the hydrogen sulfate (Hyd‐sulfate) capsule of the MEK1/2 inhibitor AZD6244 (ARRY‐142886): a phase I open‐label multicenter trial in patients with advanced cancer. Clin. Cancer Res. 16, 1613–1623 (2010). [DOI] [PubMed] [Google Scholar]
- 20. Leijen, S. et al A phase I, open‐label, randomized crossover study to assess the effect of dosing of the MEK 1/2 inhibitor Selumetinib (AZD6244; ARRY‐142866) in the presence and absence of food in patients with advanced solid tumors. Cancer Chemother. Pharmacol. 68, 1619–1628 (2011). [DOI] [PMC free article] [PubMed] [Google Scholar]
- 21. Janne, P.A. et al Selumetinib plus docetaxel for KRAS‐mutant advanced non‐small‐cell lung cancer: a randomised, multicentre, placebo‐controlled, phase 2 study. Lancet Oncol. 14, 38–47 (2013). [DOI] [PubMed] [Google Scholar]
- 22. Banerjee, A . et al A phase 1 study of AZD6244 in children with recurrent or refractory low‐grade gliomas: A Pediatric Brain Tumor Consortium report. 214 ASCO Annual Meeting 32 (2014).
- 23. Beal, S.L. Ways to fit a PK model with some data below the quantification limit. J. Pharmacokinet. Pharmacodyn. 28, 481–504 (2001). [DOI] [PubMed] [Google Scholar]
- 24. Karlsson, K.E. , Plan, E.L. & Karlsson, M.O. Performance of three estimation methods in repeated time‐to‐event modeling. AAPS J. 13, 83–91 (2011). [DOI] [PMC free article] [PubMed] [Google Scholar]
- 25. Liu, X. & Wang, Y. Comparing the performance of FOCE and different expectation‐maximization methods in handling complex population physiologically‐based pharmacokinetic models. J. Pharmacokinet. Pharmacodyn. 43, 359–370 (2016). [DOI] [PubMed] [Google Scholar]
- 26. Williams, M.L. et al Effects of protein calorie malnutrition on the pharmacokinetics of ketamine in rats. Drug Metab. Dispos. 32, 786–793 (2004). [DOI] [PubMed] [Google Scholar]
- 27. Zhang, L. , Beal, S.L. & Sheiner, L.B. Simultaneous vs. sequential analysis for population PK/PD data I: best‐case performance. J. Pharmacokinet. Pharmacodyn. 30, 387–404 (2003). [DOI] [PubMed] [Google Scholar]
- 28. Schwartz, G.J. et al New equations to estimate GFR in children with CKD. J. Am. Soc. Nephrol. 20, 629–637 (2009). [DOI] [PMC free article] [PubMed] [Google Scholar]
- 29. Cockcroft, D.W. & Gault, M.H. Prediction of creatinine clearance from serum creatinine. Nephron 16, 31–41 (1976). [DOI] [PubMed] [Google Scholar]
- 30. Gehan, E.A. & George, S.L. Estimation of human body surface area from height and weight. Cancer Chemother. Rep. 54, 225–235 (1970). [PubMed] [Google Scholar]
- 31. Denton, C.L. & Gustafson, D.L. Pharmacokinetics and pharmacodynamics of AZD6244 (ARRY‐142886) in tumor‐bearing nude mice. Cancer Chemother. Pharmacol. 67, 349–360 (2011). [DOI] [PMC free article] [PubMed] [Google Scholar]
- 32. Cox, D.S. et al Evaluation of the effects of food on the single‐dose pharmacokinetics of trametinib, a first‐in‐class MEK inhibitor, in patients with cancer. J. Clin. Pharmacol. 53, 946–954 (2013). [DOI] [PubMed] [Google Scholar]
Associated Data
This section collects any data citations, data availability statements, or supplementary materials included in this article.
Supplementary Materials
Supporting Information
Supporting Information
Supporting Information
Supporting Information
Supporting Information
Supporting Information
Supporting Information
Supporting Information
Supporting Information
Supporting Information
Supporting Information
Supporting Information
Supporting Information