I. INTRODUCTION
Oxygen is known to play a key role in cellular energetics. Both oxidation and other forms of energy production depend on a continuous supply of oxygen to the cells. In mammals, oxygen is extracted from the atmospheric air in the lungs, and carried by the bloodstream through the circulation to the tissue, where it is utilized mainly within the mitochondria. Behind this simple picture lie many questions concerning physical mechanisms of transport in different parts of the pathway. Is oxygen transported in blood mainly by pure convection, and what are the roles of diffusion and chemical kinetics? How important are the resistances to transport provided by various membranes (red blood cell, endothelial cell, parenchymal cell) along the pathway? Does oxygen cross these membranes by pure diffusion, or is the diffusion facilitated by a carrier? What are the mechanisms of transport inside the cells? Does active transport play any role in oxygen delivery? What is the main site of oxygen exchange between the blood and tissue: arterioles, capillaries, or venules? Are these sites different for different physiological conditions and for different tissues? Currently, we do not have definitive and complete answers to these important questions. A clear understanding of the physical mechanisms of oxygen transport throughout the pathway is a prerequisite to understanding the regulation of blood flow.
Krogh102 laid the foundation of the theory of oxygen transport to tissue. He proposed that oxygen is transported in the tissue by passive diffusion driven by gradients of oxygen tension (PO2). He then formulated a simple geometrical model of the elementary tissue unit supplied by a single capillary. This geometrical model is commonly referred to as the Krogh tissue cylinder or simply Krogh’s model. Together with his colleague, the mathematician Erlang, Krogh formulated a differential equation governing oxygen diffusion and uptake in the tissue cylinder. The solution to this equation expresses oxygen tension in the tissue as a function of spatial position within the tissue cylinder. This simple equation, known as the Krogh or Krogh-Erlang equation, has been the basis of most physiological estimates for the last 70 years.
The major subsequent advances in qualitative and quantitative understanding of oxygen transport to tissue have come from studies of hemoglobin-oxygen kinetics, the role of hemoglobin and myoglobin in facilitating oxygen diffusion, and the role of morphologic and hemodynamic heterogeneities.
This review focuses on theories of oxygen transport to tissue. It is intended to be comprehensive in that it systematically covers the pathway of oxygen molecules to and from the red blood cell, through the plasma, endothelial cell, other elements of the vascular wall, and through the extra- and intracellular space to the mitochondria. Mitochondrial oxygen transport is not considered here since, as an important area of biochemistry (oxidative phosphorylation), it is described in numerous textbooks and surveys. Only a few references are made to experimental studies and to physiological aspects of oxygen transport. The reader is referred to a recent monograph by Weibel186 and to several surveys that discuss the role of oxygen in regulation of blood flow in skeletal muscle,29,50 heart muscle,36 and brain.178
The present review reports the state of the art in theoretical studies of oxygen transport in living tissues. Several earlier reviews have addressed different aspects of the problem and other relevant issues. These include general reviews on oxygen transport in living tissues,38,99,106,118,121,137 the role of oxygen transport facilitation by hemoglobin,98,100,101 and myoglobin,85,101,194 blood oxygenation in extracorporeal devices,22,172 and transport in the corneal-contact lens systems.43 For completeness, this review discusses all important aspects of the theory of oxygen transport in living tissues; however, in the areas where other recent reviews are available (such as the facilitation of oxygen diffusion by hemoglobin and myoglobin), only a few major publications on the subject are referenced. The emphasis here is on the methodological issues of modeling, not on physiological conclusions drawn from application of the models to specific tissues. Such applications could be the subject of a separate review.
Whenever possible, standard notations are kept throughout the review. However, in some cases notations on the figures are different from the ones used in the text since it was not always practical to change the figures. In these cases, explanations of the nomenclature are given in the legends.
The review is divided into the following broad areas: oxygen transport in blood, oxygen transport in tissue, models of oxygen transport from blood vessels to tissue, oxygen transport in specific organs and tissues, and oxygen transport in disease. The goal is to provide the reader with information necessary to assess the role of oxygen transport models in physiological research.
II. REACTION-DIFFUSION PHENOMENA FOR OXYGEN, HEMOGLOBIN, AND MYOGLOBIN
A. OXYGEN-HEMOGLOBIN EQUILIBRIUM
Under normal conditions in human circulation, each milliliter of blood carries about 0.2 ml of oxygen. In arterial blood, about 98% of this oxygen is reversibly bound to a protein, hemoglobin, contained within the red blood cells, and the remaining oxygen is in a free form, dissolved in both blood plasma and in the hemoglobin solution inside the red blood cells. Therefore, it is very important to be able to calculate the amount of oxygen bound to hemoglobin accurately.
The ability of a medium to dissolve free oxygen is characterized by the (Bunsen) solubility coefficient, α, according to Henry’s law:
| (1) |
where [O2] denotes the concentration of dissolved oxygen, and P denotes the partial pressure of oxygen (oxygen tension), PO2. It is common to measure oxygen concentrations in moles per milliliter or, under specified conditions of temperature, barometric pressure, and humidity of air, in milliliters per milliliter. One set of standard conditions describing air is STPD: standard temperature (0°), pressure (760 torr), dry (water pressure 0 torr). Another set of standard air conditions is BTPS: body temperature (37°C in man), ambient pressure, fully saturated with water vapor, which results in a vapor pressure of 47 torr at body temperature. It is very important to specify the conditions along with the values of physical parameters. In this review, STPD conditions are used; 1 mol O2 corresponds to 22,400 ml O2 (STPD). The typical value for the solubility coefficient in plasma is α = 3·10−5 ml O2 (STPD) per ml per torr. Thus, at an oxygen tension of P = 100 torr typical for the arterial blood, the concentration of oxygen in the blood would be 0.003 ml O2 per milliliter blood.
Hemoglobin molecules in almost all vertebrates are tetramers, consisting of four peptide chains, each with an incorporated heme group. The oxygenation of hemoglobin takes place through O2 binding to the Fe atom in each of the heme groups. Binding of an oxygen molecule triggers a conformational change of the hemoglobin molecule, which affects its ability to further bind oxygen or other molecules. The fraction of available oxygen-binding sites occupied by oxygen is called hemoglobin-oxygen saturation, S or SO2; it is expressed as either a fraction or a percent. This section considers the relationships between Hb-O2 saturation and oxygen tension when the chemical reaction between oxygen and hemoglobin is in equilibrium. The next section deals with kinetic effects.
Now, the maximum amount of oxygen that can be carried by blood in the bound form can be estimated. In 1 ml of blood there is about 0.15 g of Hb4 whose molecular weight is approximately 65,000. Each mole of Hb4 can bind 4 mol of oxygen. The volume of oxygen bound to hemoglobin can be estimated: (22,400) (4) (0.15)/(65,000) = 0.201 ml O2 (STPD) per milliliter blood. Thus, combining this estimate with the above calculation for the amount of oxygen dissolved in plasma, we obtain the total amount of oxygen carried by blood as 0.204 ml O2 per milliliter blood, i.e., only 1.5% of oxygen is in the dissolved form provided that hemoglobin is completely saturated.
The chemical reaction between oxygen and hemoglobin is affected by a number of factors: temperature, pH, partial pressure of carbon dioxide (PCO2), and concentration of 2,3-diphosphoglycerate (DPG).2,118 Under standard conditions (T = 37°C, pHplasma = 7.4, PCO2 = 40 torr, [DPG] = 5 mM) values of Hb-O2 saturation plotted vs. PO2 form a sigmoid curve, called the oxyhemoglobin dissociation curve (ODC) or oxygen-hemoglobin equilibrium curve (OHEC). Both the shape and position of the ODC are affected by the above variables.118 The PO2 at which hemoglobin is 50% saturated with oxygen is denoted P50; for human blood P50 is approximately 26 torr. This parameter characterizes Hb oxygen affinity: the affinity is increased when P50 decreases and decreases when P50 increases. The dependence of the oxyhemoglobin dissociation curve on carbon dioxide concentration and pH is called the Bohr effect. In turn, oxygen binding to hemoglobin affects transport of other substances. Particularly, the dependence of CO2 transport on oxygen concentration is called the Haldane effect.
For mathematical modeling of oxygen transport, it is important to have accurate analytic expressions for SO2 as a function of PO2 and other parameters. The mathematical expressions for oxyhemoglobin dissociation curve fall into two categories: those derived from kinetic models of hemoglobin-oxygen reaction, and those constructed empirically without the help of a kinetic model. The first kinetic model was proposed by Hill63 before it was established that hemoglobin can bind four oxygen molecules:
| (2) |
where k′ and k are the association and dissociation rate coefficients, respectively. In equilibrium:
| (3) |
where K = k′/k is the equilibrium constant, and [O2] is the concentration of free oxygen in hemoglobin solution. Using Henry’s law (Equation 1), we can rewrite Equation 3 in the form:
| (4) |
where P50 = 1/(Knα) is the value of PO2 at which the hemoglobin is 50% saturated. Equation 4 is fairly accurate within the saturation range of 20 to 80% with n ≃ 2.7 for human blood (Figure 1). It is called the Hill equation, and n the Hill parameter; because of its simplicity, Equation 4 has been most commonly used in physiological and clinical applications. A convenient feature of Equation 4 is that it can be easily inverted:
| (5) |
FIGURE 1.
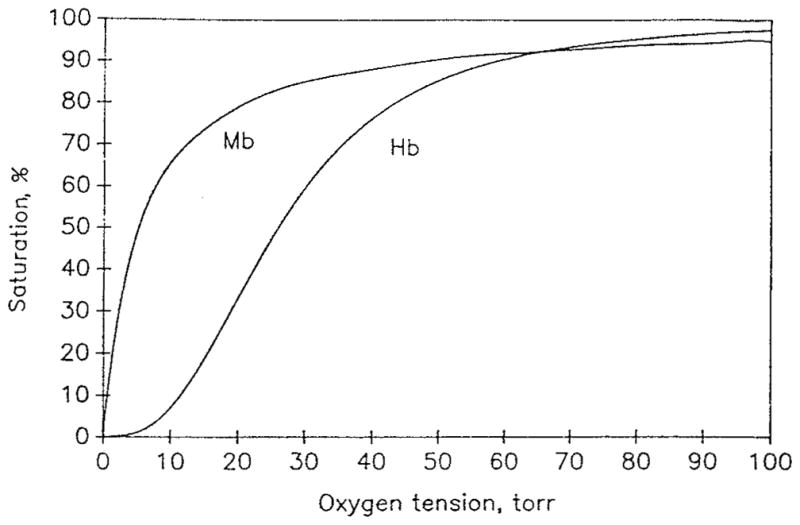
Oxygen dissociation curves for hemoglobin, Equation 4 (P50 = 26 torr, n = 2.7), and myoglobin, Equation 24, (P50 = 5.3 torr).
An important parameter that appears in mathematical models is the slope of the oxyhemoglobin dissociation curve; for the Hill equation
| (6) |
This function has a maximum at Pmax smaller than P50:
| (7) |
Adair1 recognized that each hemoglobin molecule contains four heme groups, and, therefore, intermediate compounds containing one, two, or three oxygen molecules could be formed (the intermediate compound hypothesis). He proposed a four-step chemical reaction:
| (8) |
In equilibrium, Equation 8 yields the Adair equation:
| (9) |
where S is expressed as the ratio of the number of oxygen molecules to the total number of heme groups:
| (10) |
Constants ai are called the Adair constants. They can be expressed in terms of the equilibrium constants Ki = ki′/ki,
| (11) |
The coefficients ai for human blood were tabulated by Winslow et al.193 for PO2 between 0 and 150 torr, pHplasma between 7.2 and 7.8, PCO2 between 7 and 70 torr, and [DPG] between 1 and 14 mM. The effect of temperature variation was reported by Hlastala et al.68
Equation 9 accurately describes experimental data within a wide range of PO2; however, it has rarely been used in mathematical modeling of oxygen transport to tissue. One possible reason is that the equation cannot be inverted analytically to express P in terms of S.
Both Hill’s and Adair’s equations are associated with kinetic models, Equations 2 and 8. Other, more complex kinetic theories of hemoglobin oxygenation have been proposed,30 but their discussion is outside the scope of this review.
A number of other descriptions of ODC were constructed empirically to fit experimental data and were not derived from kinetic models. The following expression for the oxygen dissociation curve:15,16
where
| (12) |
has been shown to be as accurate as the Adair equation in the saturation range between 0 and 95%. Equation 12 is invertable with respect to P:
| (13) |
The parameters R and K have been expressed in terms of PCO2, pH, [DPG], and T for human blood.
Other mathematical algorithms have been proposed that are either modifications of the Adair equation,117 or are unrelated to it.88,161,170,173
B. OXYGEN-HEMOGLOBIN KINETICS
The details of the kinetics of oxygen-hemoglobin reaction are not known to the same extent as the equilibrium relationships discussed above. The contributing factors are that the characteristic reaction time is very short, a fraction of a second, and therefore the dynamic measurements are difficult, and also there are more kinetic coefficients than equilibrium coefficients.
The chemical reaction (Equation 2) proposed by Hill with noninteger n is clearly unrealistic, even though it yields a practical expression to the oxyhemoglobin dissociation curve. Thus, attempts have been made to formulate alternative simple kinetic relationships for the hemoglobin-oxygen reaction. In some cases, it is convenient to express kinetic relationships in terms of molecular segments that contain one heme group, i.e., one quarter of the hemoglobin molecule. The molar concentration of such a segment is denoted [Hb]. The simplest oxygen-heme group one-step chemical reaction
| (14) |
with constant reaction rate coefficients k′ and k, corresponds to the rate of chemical reaction
| (15) |
and the following kinetic equations:
| (16) |
In equilibrium, the rate of chemical reaction equals zero, i.e., R = 0.
The coefficients k′ and k were experimentally estimated by Gibson et al.45 for human hemoglobin at 37°C and pH = 7.1 to be k′ = 3.5·106 M−1s−1, k = 44 s−1. These values correspond to half-time of oxygenation t1/2 = 5 to 10 ms. An alternative analysis of the data was presented by Middleman.121 However, the reaction rate (Equation 15) leads to a hyperbolic instead of a sigmoid equilibrium relationship (compare with Equation 3)
| (17) |
in disagreement with experimental data. Nevertheless, the kinetics (Equation 14) are useful in describing the system in the initial phase of the reaction. To overcome this deficiency, Moll123 proposed a variable rate coefficient model. In this model the dissociation rate coefficient, k, is constant, while the association rate coefficient, k′, is made a function of oxygen tension such that the relationship between S and P reduces to the chosen equilibrium relationship. For example, for the Hill Equation 4:
| (18) |
One-step kinetics (Equation 14) with variable association rate coefficient (Equation 18) have been used in several analyses of oxygen transport.8,19,35,169 Similarly, with an appropriate choice of k′ (P), the one-step kinetic equation can be made consistent with any functional form of oxygen dissociation curve, for example, with the Adair equation.195 Briefly, the following procedure can be used. The requirement that the equilibrium condition, R = 0, for Equation 15 be consistent with an arbitrary oxyhemoglobin dissociation curve S = F(P), yields:
| (19) |
If k is assumed constant, then the substitution of S = F(P) into Equation 19 yields the association rate coefficient as a function of oxygen tension, k′(P), and the reaction rate can be expressed as
| (20) |
Gutierrez58 proposed a somewhat different kinetic scheme. He defined the Hill parameter, n, in the Hill Equation 3 as a function of saturation in order to fit the equilibrium human blood data of Severinghaus.161 The relationship between k and k′ is still described by Equation 17, but the exponent n is a function of the saturation.
Chemical reactions (Equation 8) describing Adair’s intermediate compound hypothesis depend on eight rate constants (four for association and four for dissociation reactions, k′i and ki, respectively). The reaction rates
| (21) |
correspond to the kinetic equations:
| (22) |
In chemical equilibrium, R1 = R2 = R3 = R4 = 0.
The coefficients k′ and k were determined (Gibson46) for human hemoglobin at 21.5°C and pH = 7.0: k′1 = 17.7·104 M−1s−1; k1 = 1900 s−1; k′2 = 33.2·104 M−1s−1; k2 = 158 s−1; k′3 = 4.89·104 M−1s−1; k3 = 539 s−1; k′4 = 33.0·104 M−1s−1; k4 = 50 s−1. The applications of the four-step kinetics in the analysis of intracapillary transport are discussed below.
As has already been mentioned, the binding of oxygen at one hemoglobin site is coupled with binding of other substances at other sites due to a conformational change of the hemoglobin molecule. This phenomenon is called allosterism. In particular, oxygen binding to hemoglobin is affected by PCO2, pH, [DPG], and other factors, and, in turn, oxygen binding affects transport of other substances, such as carbon dioxide and hydrogen ions. Thus, a more complete description of oxygen transport can be achieved by considering simultaneous chemical reactions between oxygen, hemoglobin, carbon monoxide, carbon dioxide, hydrogen ions, and intermediate compounds in the corresponding reactions. It should be noted that among the substances on this list, only oxygen and carbon monoxide compete for the same binding sites in the heme groups, whereas other molecules and ions bind to other sites. Detailed mathematical analyses of the corresponding multisubstance transport equations are presented in a series of papers by Mochizuki and co-workers (see Mochizuki and Kagawa122, Ulanowicz and Frazier,179 Bidani and Flumerfelt,11 and Salathe et al.151). A detailed consideration of these processes is outside the scope of this review.
C. Oxygen-Myoglobin Kinetics
There are a variety of hemoglobin molecules with different physicochemical properties that occur in different species and tissues. The tissue hemoglobin found in vertebrate red skeletal muscles and hearts is called myoglobin (Mb). The myoglobin molecule is a monomer with a molecular weight of approximately 16,000 to 17,000. Concentrations of myoglobin vary significantly among different tissues, typically within the range 0 to 1 mM. As in the previous discussion of oxygen dissolved in the hemoglobin solution, we can compare the amounts of oxygen dissolved and bound in a unit volume of tissue. Assuming the tissue oxygen tension Pt = 20 torr, and oxygen solubility coefficient αt = 3·10−5 ml O2/ml/torr, we obtain [O2]free = αtPt = 6·10−4 ml O2/ml. If the concentration of myoglobin in the tissue is [MbT] = 0.5 mM, then the amount of oxygen bound to myoglobin at 100% saturation is [O2]bound = (0.5·10−6)(22.4·103) = 11.2·10−3 ml O2/ml, i.e., approximately 20 times larger then the concentration of free oxygen. If we assume an oxygen consumption rate for exercising muscle M = 1.3·10−3 ml O2/ml/s, then we can easily estimate the time that oxygen bound to myoglobin would last if oxygen delivery is interrupted, [O2]bound/M ≃ 8 s. For resting muscle, the oxygen consumption rate can be an order of magnitude lower, thus the myoglobin storage of oxygen would last for more than a minute. Therefore, myoglobin can play a significant role in O2 storage and can serve as a buffer during brief interruptions of blood flow.
Since myoglobin molecules are monomers and have only one binding site for oxygen, a one-step chemical reaction
| (23) |
with constant association and dissociation rate coefficients k′ and k, corresponds to a hyperbolic equilibrium dissociation relationship:
| (24) |
Here K = k′/k is the equilibrium constant, and S is the saturation fraction of myoglobin with oxygen. Denoting K = (αtP50)−1, we see that Equation 24 is the Hill equation with n = 1. This property is a result of myoglobin noncooperativity, i.e., each site binds O2 independently. This is unlike hemoglobin, which displays cooperativity, i.e., binding of O2 is affected by the status of other binding sites. Typically, P50 for myoglobin is significantly lower, P50 ≃ 5 torr, than P50 for hemoglobin, P50 ≃ 26 torr. Thus, myoglobin remains fully saturated until the tissue PO2 falls below 10 torr. Figure 1 shows typical equilibrium dissociation curves for hemoglobin and myoglobin.
D. FACILITATION OF OXYGEN DIFFUSION BY HEMOGLOBIN AND MYOGLOBIN
Diffusion of a substance in free form is governed by Fick’s law, which states that the amount of a substance crossing a surface of unit area per unit time, called diffusive flux, is proportional to the concentration gradient in the direction perpendicular to the surface:
| (25) |
The coefficient of proportionality D is called the diffusion coefficient. If concentration, c, varies spatially in three dimensions, then Fick’s law should be expressed in vector form
| (26) |
The diffusion equation can be derived from mass balance within a volume, by stating that the temporal rate of change of the amount of substance within the volume is equal to the net diffusion flux through the boundaries plus the rate of chemical reaction within the volume
| (27) |
If the substance can react reversibly with another substance, a carrier, then molecular transport of the substance can be enhanced or facilitated by the carrier that can transport the substance in bound form. This form of transport is called carrier-mediated or carrier-facilitated transport (Schultz et al.159). Hemoglobin and myoglobin can act as carriers of oxygen, hence hemoglobin- and myoglobin-facilitated diffusion. A large literature, including both experimental and theoretical studies, is devoted to the problem of oxygen transport facilitation by hemoglobin and myoglobin, and in-depth reviews are available on this subject.85,98,100,101,194
To illustrate the effect of hemoglobin-facilitated transport of oxygen, consider diffusion through a flat layer of hemoglobin solution bounded by two membranes permeable for oxygen but impermeable for hemoglobin. The diffusion coefficient for oxygen at a hemoglobin concentration typical for the interior of red blood cell is DO = 0.95·10−5 cm2/s, whereas for hemoglobin it is DHb = 1.44·10−7 cm2/s. (Because the diffusion coefficient is primarily determined by molecular weight, and the oxygen molecule is much smaller than hemoglobin, the diffusion coefficients for reduced and reacted hemoglobin can be accurately assumed to be the same.) Thus, hemoglobin molecules diffuse about 65 times slower than free oxygen molecules. How, then, can hemoglobin appreciably affect the transport of oxygen when its diffusion is so slow? It can because the amount of oxygen that can be bound to hemoglobin is many times larger than the amount of free oxygen (about 70 times at P = 100 torr, according to the estimate above). Mathematically, we can express the total diffusion flux of oxygen as the sum of free and bound components:
| (28) |
If we assume that the total concentration of hemoglobin, [HbT] = [Hb] + [HbO2], in the solution is uniform, we can recast Equation 28 in the form:
| (29) |
Assuming that the chemical reaction between oxygen and hemoglobin is in equilibrium, and therefore the relationship between their concentrations is governed by the oxyhemoglobin dissociation curve, we obtain:
| (30) |
The expression in parenthesis can be considered an effective diffusion coefficient, Deff. Using Equation 1, we conclude that the diffusion of oxygen is enhanced by a factor
| (31) |
Assume that the total hemoglobin concentration is [HbT] = 20.3 mM = 2.03·10−5 mol (heme monomer)/ml (this corresponds to 34 g% hemoglobin solution) and the solubility coefficient for oxygen in the hemoglobin solution is α = 1.56·10−9 mol/ml/torr (since the concentration of hemoglobin is expressed in moles, we also express the solubility coefficient in corresponding units). Consider the parameters of the Hill equation to be P50 = 26 torr, n = 2.7 and take the maximum slope of the oxyhemoglobin dissociation curve at P = 19.5 torr (Equations 6 and 7), then the maximum enhancement factor expressed by Equation 31 is Deff/DO = 6.9.
For myoglobin, the slope dS/dP is maximal at P = 0, as follows from Equation 6 for n = 1. Thus, the smaller the value of P, the larger the enhancement factor. For example, assuming for muscle tissue DMb = 1.5·10−6 cm2/s, DO = 2·10−5 cm2/s, α = 1.35·10−9 mol/ml/torr, [MbT] = 0.5 mM, and P50 = 5.3 torr, we obtain Deff/DO = 3.7 for P = 2 torr and Deff/DO = 5.4 for 0.5 torr.
The assumption of chemical equilibrium is not satisfied everywhere in the layer, however. If the reaction were in equilibrium, then the gradient of oxyhemoglobin concentration would be expressed in terms of the gradient of oxygen tension:
| (32) |
But the boundary is impermeable to hemoglobin molecules, hence ∂[HbO2]/∂n = 0 at the boundaries, whereas ∂P/∂n is proportional to the flux of oxygen through the layer and, therefore, is not equal to zero. This suggests that the assumption of equilibrium is not valid near the boundaries of the layer. These regions where chemical reaction is not in equilibrium are called boundary layers. The distribution of concentration then depends on the ratio of the characteristic thickness of the boundary layer and the thickness of the hemoglobin layer.
The concept of a boundary layer is common to analyses of many physical phenomena and is usually associated with a small dimensionless parameter (e.g., in fluid mechanics, the boundary layer is formed when the Reynolds number is large; therefore, its inverse is a small parameter). The characteristic length Lβ = (DOk′[HbT])1/2 is a measure of the thickness of the boundary layer where conditions are far from chemical equilibrium. The squared ratio of the characteristic geometrical dimension of the problem (thickness for a flat layer), L, to Lβ is called the Damköhler number:159
| (33) |
It can also be defined as the ratio of characteristic time of oxygen diffusion, τDO = L2/DO, to characteristic time of reaction, τKO = (k′[HbT])−1. When γ ≫ 1, the bulk of the solution is in equilibrium, and the nonequilibrium region is confined to thin layers adjacent to the boundaries. Conversely, when γ ≪ 1, the entire layer of hemoglobin solution is far from equilibrium. The problem of facilitated diffusion is discussed later in more detail in the context of oxygen unloading from red blood cells and diffusion in muscle fibers. Recent general mathematical treatment of the problem of carrier-facilitated transport can be found in Hoofd and Kreuzer,73 Kollka and Salathe,95 and Hoofd.75
III. MODELS OF OXYGEN TRANSPORT IN BLOOD
Oxygen transport in blood involves a number of phenomena, which are discussed in this section. Inside the red blood cell, oxygen reacts chemically with hemoglobin and is transported by both free and hemoglobin-facilitated diffusion. Oxygen diffuses through the cell membrane and is transported in blood plasma by free diffusion and by convection. Many issues considered in this section are briefly discussed in a recent review by Meldon.118
A. KINETICS OF OXYGEN UPTAKE AND RELEASE BY RED BLOOD CELLS IN RAPID-MIXING EXPERIMENTS
The uptake of oxygen by red blood cells has been studied experimentally and theoretically for more than 50 years (Hartridge and Roughton61), with one of the major objectives being to determine the resistance of the erythrocyte membrane to O2 diffusion. Rapid-mixing experiments in continuous or stopped-flow apparatus reveal that the rate of O2 uptake by red cells is about 40 times slower than by an equivalent solution of free hemoglobin (half-time of hemoglobin oxygenation in solution is t1/2 = 5 to 10 ms, whereas for whole blood t1/2 = 50 to 100 ms; Gibson et al.45). In rapid-mixing experiments on uptake and release of oxygen by red cells, the cells are quickly injected into a chamber and mixed with the solution having a specified concentration of O2. Following the injection, the degree of hemoglobin saturation is monitored spectrophotometrically. Hartridge and Roughton61 put forward possible explanations of the observed phenomenon. They proposed that red cell cytoplasm and the cell membrane could present a large resistance to O2 diffusion. Alternatively, the main resistance to diffusion could be provided by incompletely stirred solvent layers adjacent to the cell surface. Until recently, there had been considerable controversy surrounding this question and a large number of rapid-mixing experiments and analyses have been performed by different investigators; we refer here to the most recent reports (Coin and Olson,21 Huxley and Kutchai,79,80 Weingarden et al.,187,188 Kagawa and Mochizuki,86 Merchuk et al.,119 Vandergriff and Olson,180–182 Holland et al.,69 Hook et al.76) (see also review by Meldon118). In summary, it has been shown that oxygen transport through the red cell cytosol accounts for part of the difference and when this is taken into account the predicted half-time of uptake is about five times less than that observed experimentally. The red cell membrane resistance constitutes only a small fraction of the total resistance to oxygen transport, whereas the main portion of the remaining resistance is located within the incompletely stirred diffusion boundary layer immediately outside the erythrocyte surface. The most direct early experimental proof was given by Kreuzer and Yahr,97 who found that stagnant layers of packed red blood cells oxygenate as quickly as solutions of hemoglobin. Rapid-mixing experiments provided additional support of this result; however, their interpretation in most cases required sophisticated theoretical analyses.
Huxley and Kutchai79 expressed the total diffusion resistance outside the red cell cytosol as the sum of the membrane transport resistance and the diffusion boundary layer resistance. The best estimate from this study showed that only 5% of the total resistance could be attributed to the membrane. If it is assumed that all of the resistance is concentrated in the membrane, then the diffusion coefficient for oxygen in the membrane would have to be 1.2·10−7cm2/s, i.e., about 100 times smaller than in water. This conclusion would be in disagreement with the value of D for the membrane measured by the fluorescence quenching of pyrene (Fishkoff and Vanderkooi37). This method predicted a much larger value D = 0.7·10−5 cm2/s, i.e., approximately five times smaller than in water. These results suggest that the membrane poses a negligible resistance to oxygen transport.
In the above studies, the transport of oxygen inside the cell was not considered. In other studies the analysis of Roughton148 was extended to consider the processes within the hemoglobin inside the cell, in addition to processes outside the cell. Coin and Olson21 developed a one-dimensional mathematical model to take into account diffusion through an unstirred solvent outside the cell; the cell was represented as a plane layer of hemoglobin separated by a membrane from the surrounding solution. Linear kinetic equations (see Equation 15 above) were assumed for the hemoglobin-oxygen chemical reaction. The resulting system of equations was solved numerically. The best agreement with experimental data was obtained when the thickness of the unstirred layer was allowed to increase with time. Indeed, as oxygen is taken up by the cell from the solution, the oxygen molecules must diffuse over larger distances in the solution before they enter the cell. Vandergriff and Olson181 improved earlier analysis by using theoretical fluid-dynamical estimates for the thickness of unstirred layer. They assumed that red blood cells emerge from the mixing chamber with an unstirred layer of 1 μm and the thickness grows as the square root of time. The analysis was extended to cylindrical geometry of red blood cells (disks), which more realistically describes the shape of cells.
Thus, at present, there is a general agreement that an O2 diffusion boundary layer in plasma is responsible for a major part of the resistance to transport outside of the cell under special conditions of rapid-mixing experiments. The possible physiological significance of this resistance in vivo is discussed below.
B. OXYGEN TRANSPORT IN BLOOD CAPILLARIES
In the capillaries, oxygen is transported within red cells through the solution of hemoglobin, then through the cell membrane and the blood plasma. Since cells and plasma are in motion, both convection and diffusion (free and facilitated) may be important. It was recognized early that the red cell cytosol has a finite resistance to oxygen transport, which results in a gradient of oxygen tension between the interior of the cell and the plasma surrounding the cell (Hartridge and Roughton61). In fact, the rapid-mixing experiments and their analyses discussed above suggest that both the cell interior and the plasma surrounding the cell resist oxygen diffusion, and these same processes may be important in vivo. The arguments have been raised that this resistance may affect oxygen uptake in the lung (Roughton and Forster149). However, the notion that intracapillary resistance to transport may be a limiting factor in tissue oxygenation has arisen only recently.
Intracapillary resistance is determined by a number of factors. Hellums62 was the first to give a clear mathematical estimate of the effect of the particulate nature of blood on oxygen transport. He approximated erythrocytes by cylinders aligned along the capillary, and assumed that oxygen diffuses radially from the erythrocytes to the surrounding tissue, but not from the plasma gaps between the erythrocytes. Hence the term discrete cells model. In other words, the plasma gaps were assumed to have an infinite resistance to oxygen diffusion. Predictions of this model were compared to the continuum model in which the same amount of hemoglobin that is contained within the cells is distributed uniformly in the capillary. At a capillary hematocrit of 50%, only half the capillary area would be available for exchange in the discrete cells model. Thus, the discrete cells model would yield surface-averaged oxygen flux that is equal to half of the flux predicted by the continuum model if all other factors were the same. However, the oxygen diffusion coefficient for hemoglobin solution decreases with hemoglobin concentration; thus, free oxygen diffusion inside the cells would be slower than in the case of uniformly distributed hemoglobin. Using the Krogh cylinder model, Hellums estimated that the fraction of capillary resistance in the total (i.e., capillary plus tissue) resistance to oxygen diffusion was about 20% in the continuum model and 50% in the discrete model. This estimate could only serve as a first approximation because the model did not take into account oxygen transport in the plasma, oxygen diffusion facilitation by hemoglobin, or kinetic effects. All these factors have been subsequently incorporated into the theory by different investigators.
1. Transport in Plasma Gaps between Red Blood Cells
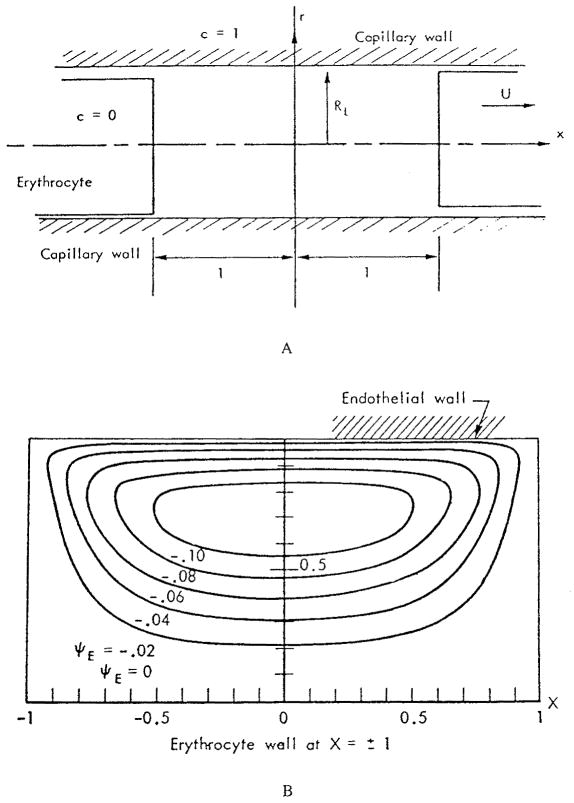
Oxygen in the plasma can be transported by both convection and diffusion. The first analysis of transport of a substance in the plasma gaps between red cells was presented by Aroesty and Gross.3 The geometry of the problem is depicted in Figure 2a. The authors considered two red cells separated by a distance 2 L moving with velocity U. All distances in the figure are made dimensionless by L. In particular, the dimensionless capillary radius is RL. In the frame of reference fixed in the cell, the motion of the capillary wall induces eddies in the plasma gap. Figure 2b shows these eddies in the upper part of the tube. This eddy motion could transport the substance convectively. In order to evaluate the effect of convection in the gap between two cells, the convective transport equation
FIGURE 2.
(a) Coordinate system for plasma gap between two red cells; all distances are nondimensionalized by L, the half distance between two cells; (b) Streamlines for eddy motion in the upper part of the gap in the coordinate system fixed on red cell. (From Aroesty, J. and Gross, J. F., Microvasc. Res., 2, 247, 1970. With permission.)
| (34) |
was written in dimensionless form such that u and v are the plasma velocity components, c is the substance concentration, and Pe = UL/D is the Peclet number that characterizes the ratio of convective to diffusive transport. The concentration was specified at the capillary wall
and at the ends of the cylinders representing red cells
In this formulation the tissue was assumed to be the source of the substance and the red cells to be the sink; however, the results can be easily applied to oxygen if we adopt a new definition of concentration: c′ = 1 − c. Thus, in the following we interpret the results in terms of oxygen concentration c′. Figure 3 shows the ratio of local flux at the wall at a given Peclet number to that where the Peclet number is zero, i.e., when convection is neglected, m = (∂c/∂r)Pe/(∂c/∂r)Pe = 0. The effect of convection is very small at Pe = 1 (the ratio is close to 1) and becomes significant at Pe = 10; however, even in the latter case, the total flux over the entire gap due to convection alone is small because the contributions at positive and negative values of x tend to cancel each other. To estimate the values of the Peclet number for capillary flow, we assume U = 0.1 – 2 mm/s, L = 5 μm, and D = 3·10−5cm2/s; hence Pe = 0.2 – 4. These are only typical values of Pe, clearly there could be situations where the values of Peclet number lie outside this range. The authors concluded that the effect of convection in most cases is negligible; however, convection may become important at higher Pe numbers.
FIGURE 3.
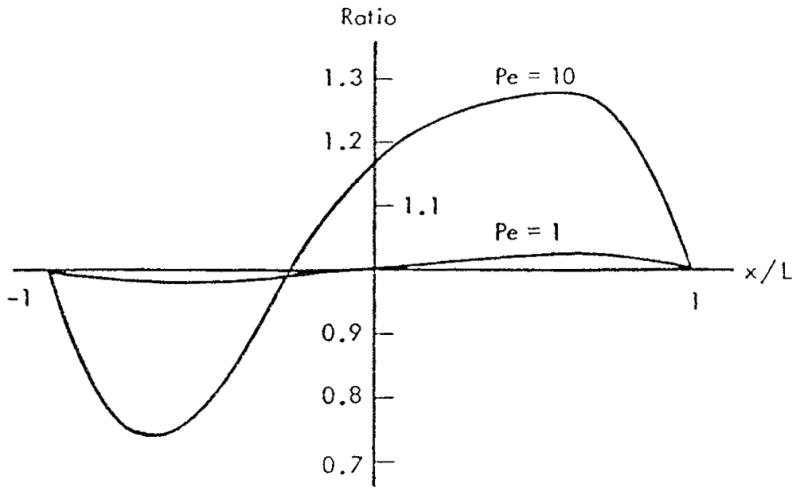
Effect of convection on local mass transfer rate at the capillary wall. Separation between cells equals one capillary diameter, (From Aroesty, J. and Gross, J. F., Microvasc. Res., 2, 247, 1970. With permission.)
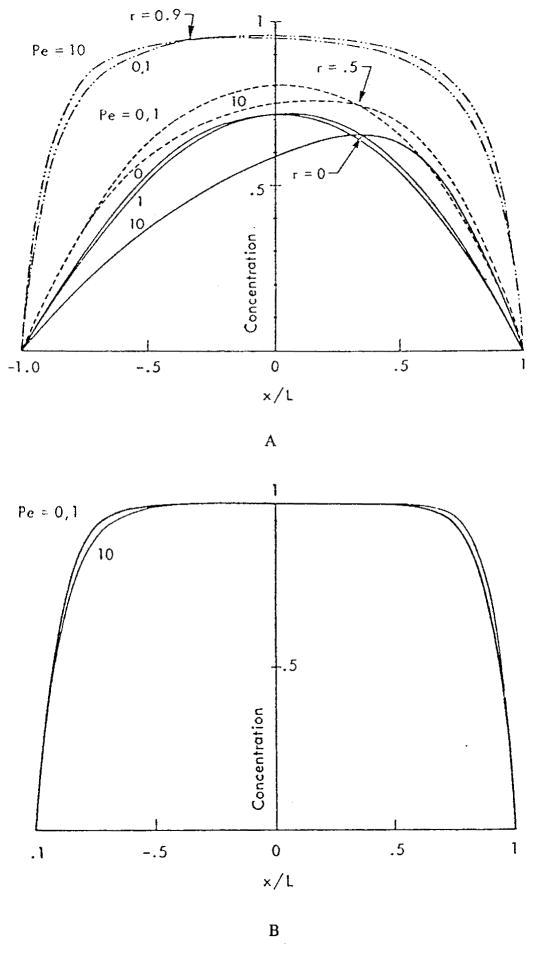
The concentration profiles in the plasma gaps between red blood cells are shown in Figure 4 for two values of dimensionless capillary radius RL. For the following discussion, it is more convenient to think of RL as the inverse red cell separation. Figure 4a shows that even when the cells are separated by a distance equal to the capillary diameter, RL = 1, the concentration at the center of the capillary is far from its value at the red cell surface. Thus, the gap is oxygen-depleted. However, there is still oxygen available to maintain positive flux at the capillary surface, even though the flux should decrease toward the midpoint between cells. The picture is different when the separation between red cells is equal to five capillary diameters, RL = 0.2 (Figure 4b). In this case, the concentration c′ differs from zero (c differs from unity) only in regions about 0.4 L in length (i.e., one capillary diameter) adjacent to the red cells. Thus, the oxygen flux from the plasma gap should be zero in the regions that are more than one capillary diameter away from the nearest red blood cell. Such regions exist if the separation between particles is larger than two capillary diameters. At any separation between cells, the mean concentration of oxygen in the plasma is smaller than the concentration at the cell surface, and the difference between the concentrations is a strong function of red cell separation.
FIGURE 4.
Concentration profiles c in plasma gap between red cells for Pe = 0, 1, and 10. Capillary axis is at r = 0, capillary wall at r = 1. (a) Separation equals one capillary diameter, RL = 1.0; (b) Separation equals five times capillary diameter, RL = 0.2. Profiles are shown for r = 0; profiles for r = 0.5 and 0.9 are similar. (From Aroesty, J. and Gross, J. F., Microvasc. Res., 2, 247, 1970. With permission.)
Based on the results shown in Figure 4b, we can schematically plot local oxygen flux at the capillary wall, j, vs. position along the capillary at different separations between red cells (Figure 5). Indeed, when PO2 in the plasma decreases, the oxygen flux also decreases in accordance with PO2 gradient and drops to zero when the distance from the closest cell becomes larger than about one capillary diameter. Interestingly, the authors3 did not discuss the implications of their finding, and it was not until a decade later that the physiological importance of these results was properly appreciated. The plasma gap contributes to oxygen transport, but its capacity is limited. Aroesty and Gross’s results can be expressed in terms of a resistance of the plasma gap between red cells; this resistance was assumed infinite in the analysis of Hellums.62
FIGURE 5.
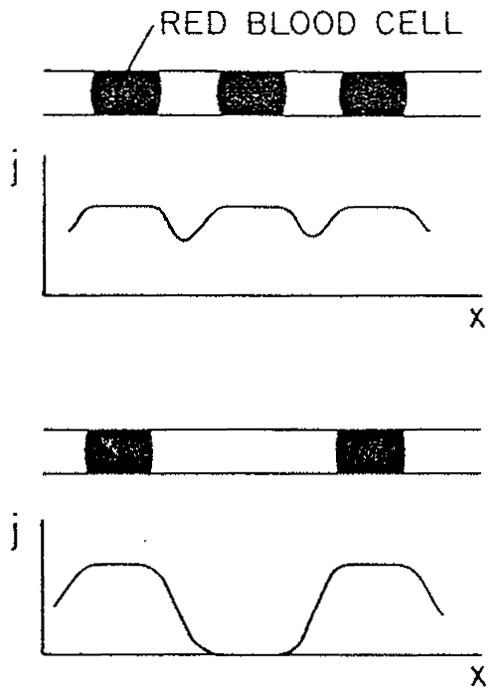
Schematic distribution of O2 flux from capillary into the tissue for different red cell separations.
The analysis discussed above3 assumed constant PO2 at the capillary wall. The problem can be posed differently, however. Instead of specifying PO2 at the capillary wall, one can specify oxygen flux, arguing that this quantity should be proportional to the tissue oxygen consumption. Clearly, in such formulation, a situation is possible where in order to maintain a given constant flux from the plasma gap, oxygen tension at the wall would have to drop to zero and even become negative. Since this is not physically possible, a range of parameters should be found for which a constant oxygen flux can be maintained. This approach was taken by Homer et al.70 and Federspiel and Sarelius.33 Based on the results of Aroesty and Gross,3 the convective transport was neglected, yielding the diffusion equation
| (35) |
which was solved together with the boundary conditions
| (36) |
where j is the constant flux at the wall that is specified, and Pc is the oxygen tension at the red cell surface. First, the problem can be approached analytically by averaging Equation 35 over capillary cross-section. The mean oxygen tension <P> satisfies the equation
| (37) |
Equation 37 can be solved with boundary conditions <P>(−L) = <P>(L) = Pc, and ∂P/∂x = 0 at x = 0. The solution is
| (38) |
where F = jR/(DαPc) is a dimensionless parameter, commonly referred to as the Nusselt number. Because the oxygen tension <P> must be non-negative, Equation 38 yields a condition on the separation between red cells:
| (39) |
(Remember that L is one half of cell separation.) For larger red cell separations, , Equation 38 gives negative values of <P> in a region near the center of the gap, thus the constant flux at the wall cannot be maintained. The parameter F is estimated to vary between 0.01 for resting muscle and 0.5 for contracting muscle.33 Assuming capillary diameter to be 5 μm, we obtain from Equation 39 for the critical red cell separation 2 for resting and 2 Lcr = 7 μm for contracting muscle.
It should be noted that Equation 38 is exact, not approximate. However, the actual bound for L can be somewhat stronger than Equation 39. Because there are not only axial, but also radial gradients of oxygen tension in the gap, PO2 at the wall can become negative, while the mean PO2 remains positive. We can estimate the radial PO2 gradient from the first boundary condition in Equation 36:
| (40) |
Thus, F ≃(ΔP)radiaI/Pc. Since F can be of the order of unity, the PO2 difference in the radial direction can be comparable to Pc. Thus, condition (Equation 39) is an upper bound for critical separation. To determine the exact upper bound for L, Equation 35 has to be solved with the condition P ≥ 0. This problem has been treated numerically.33 The reported numerical results appear to be close to those given by relationship 39.
The papers just cited33,70 should be credited with explicitly addressing the role of red cell separation on oxygen transport, even though the conclusions could have been obtained from the earlier study.3 These studies pointed to a separate role that the red-blood-cell flux or frequency (number of cells passing per unit time through any capillary cross-section) and red-cell separation play in tissue oxygenation.
A realistic boundary condition at the capillary wall should result from simultaneous consideration of intracapillary and extracapillary transport. At any instant, both PO2 and oxygen flux should be continuous at the wall. Thus, if we solve Equation 35 for the plasma gap simultaneously with a tissue model, we would not need additional boundary conditions at the capillary wall. Note that the problem is time-dependent because of the presence of red blood cells. The solution to this problem would make it possible to investigate whether constant PO2 or constant oxygen flux boundary condition at capillary wall is more realistic.
Without doing the proposed calculations, we can estimate how far the disturbances due to the inhomogeneity of intracapillary distribution of oxygen penetrate into the tissue. The characteristic time of the disturbance equals the red cell separation divided by red cell velocity. If we choose a separation of 20 μm, and velocity of 200 μm/s corresponding to resting muscle, we obtain tch = 0.1 s; for contracting muscle, if we choose 6 μm and 600 μm/s, the result is tch = 0.01 s. From the nonsteady diffusion equation we obtain the characteristic length of penetration of a disturbance into the tissue, Lch = (Dtch)1/2, which yields Lch = 12 and 3.8 μm, respectively. Thus, in both cases, PO2 in the tissue will respond transiently to the alternating cells and plasma gaps, and a combined consideration of intra- and extracapillary transport is required.
2. Transport within Red Blood Cells
The kinetic equations for Hb-O2 reaction and the transport in layers of hemoglobin have been discussed above. If convection inside the cells is negligible, the transport within red cells is described by the same equations as the transport in layers of hemoglobin, but the geometiy of the problem is different. We have already reviewed the modeling of oxygen transport inside red cells in application to rapid-mixing experiments. Now, we will consider the analyses of oxygen unloading from red cells in vivo.
Convective transport inside the red cell may result from experimentally observed tank-treading motion of cells in capillaries, i.e., rotation of the cell membrane around its interior causing shear flow of the hemoglobin solution inside the cell. Only order-of-magnitude analysis of this phenomenon is available.17 It was found that for molecular oxygen, the effect of convection is negligible. For the oxyhemoglobin, the ratio of convective and diffusive terms is around 1, and thus convection may be as important as facilitated diffusion of oxygen. Therefore, the answer can only be given by solving the governing reaction-diffusion differential equation. However, experimental data on red cell tank-treading in vivo are very limited, so the question remains open until more data are collected.
Ignoring convection, however, the problem of intracellular oxygen transport was treated by Sheth and Hellums169 for a plane layer geometry with constant flux boundary condition, by Baxley and Hellums8 for cylindrical geometry, and, finally, by Clark et al.,19 who developed the boundary layer analysis for a red blood cell of arbitrary shape. In all these studies, Moll’s variable rate coefficient model was used.123 The system of equations governing oxygen transport inside the cell is outlined below.
In the following, each hemoglobin molecule, Hb4, is replaced by four independent heme groups, 4Hb. The transport equations can be written in the form
| (41) |
| (42) |
| (43) |
where R is the net rate of chemical reaction, and the diffusivities DO, DHb, and DHbO are assumed constant. The variable rate coefficient model is used with the Hill equation for the oxyhemoglobin dissociation curve, hence the rate of chemical reaction equals:
| (44) |
(compare with Equation 20). Substituting Equation 44 into the transport Equations 41 to 43 and taking into account that hemoglobin cannot pass through the membrane and therefore the total heme density, [HbT], is constant, we obtain a pair of nonlinear partial differential equations for S and dimensionless concentration c = [O2]/(αP50)
| (45) |
| (46) |
Since S is proportional to the concentration of oxyhemoglobin that does not penetrate through the membrane, at the boundary n·∇S = 0, where n is the unit normal to a boundary. In addition, either O2 concentration or flux can be specified on the boundary.
Baxley and Hellums8 analyzed the problem of unsteady O2 diffusion from a cylindrical volume of hemoglobin with a constant flux boundary condition on its surface. The parameters were chosen to mimic deoxygenation of an erythrocyte traversing a capillary. Among several other factors, the authors studied the effect of the rate of chemical reaction. They found that the assumption of local chemical equilibrium is not accurate everywhere, and that the reaction kinetics should be taken into account. When the rate of chemical reaction is normal, the bulk of the cell is in chemical equilibrium and the deviations from equilibrium occur only near the cell membrane (Figure 6). The figure shows the profiles of percent deviation of O2 concentration from local chemical equilibrium along the capillary radius for a cylindrical capillary of 4 μm diameter at the entrance, middle, and end of the capillary.
FIGURE 6.
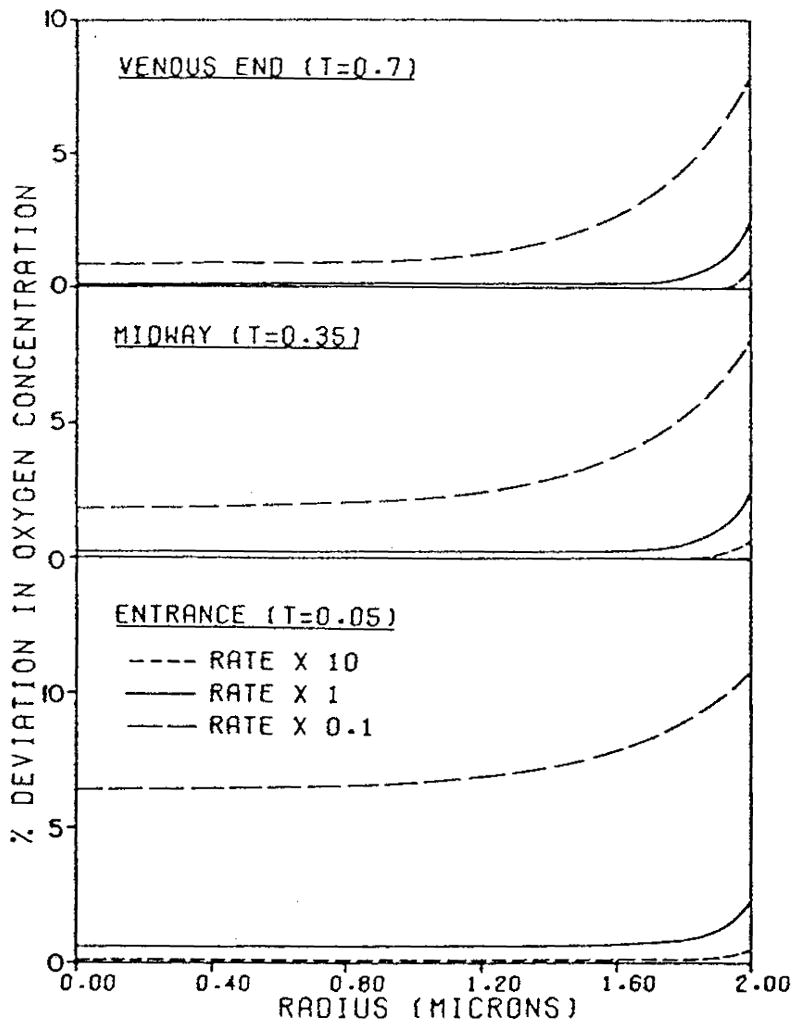
Percent deviation in oxygen concentration from local chemical equilibrium across a 4 μm capillary for different rates of Hb-O2 chemical reaction. (From Baxley, P. T. and Hellums, J. D., Ann. Biomed. Eng., 11, 401, 1983. With permission.)
Clark et al.19 approached the problem of oxygen unloading from red cells analytically. They derived a physical picture of oxygen distribution inside cells, similar to that shown in Figure 6, by analyzing spatial and temporal scales in the problem. It was concluded that there should be a boundary layer near the cell membrane where deviations from chemical equilibrium occur; the bulk of the interior is in chemical equilibrium, i.e., the relationship between hemoglobin saturation and PO2 is given by the equilibrium oxyhemoglobin dissociation curve. The transport resistance of this boundary layer is a major part of the total resistance in the cell. Using the method of matched asymptotic expansions, the authors reduced the system of two partial differential equations, Equations 45 and 46 to a single ordinary differential equation for the mean saturation in the cell, hence a lumped-parameter description. The lower bound for oxygen unloading time can be calculated by assuming zero oxygen concentration on the cell boundary. In this case, the governing equation takes the form
| (47) |
where tU is the characteristic time of oxygen unloading,
| (48) |
Here L is the ratio of the cell volume to surface area. Figure 7 shows the solution of Equation 47 for the volume-averaged oxygen saturation as a function of dimensional time for a red cell exposed to zero oxygen tension. Actual time of unloading in vivo would be longer since the red cell is exposed to PO2 values higher than zero and a complete solution of the geometrical problem is necessary to predict the unloading time. The lower bound is nevertheless a useful quantity since it permits one to estimate the residence or transit time of the cell in the capillary below which the unloading of oxygen from the cell would be limited by the intracellular resistance. For example, it follows from Figure 7 that ~0.04 s is required for the saturation to decrease from an initial 0.8 to 0.3 value. If the transit time of the cell in a capillary is smaller than this value, the final saturation may be larger than 0.3. Note that this and other numerical examples in this review are obtained for a certain set of parameter values and should not be considered universal results. The values of parameters may vary significantly for different species and conditions, thus caution should be exercised in generalizing the results obtained for a specific set of paremeters. Similar calculations were subsequently applied to the analysis of oxygen transport in working skeletal muscle.44
FIGURE 7.
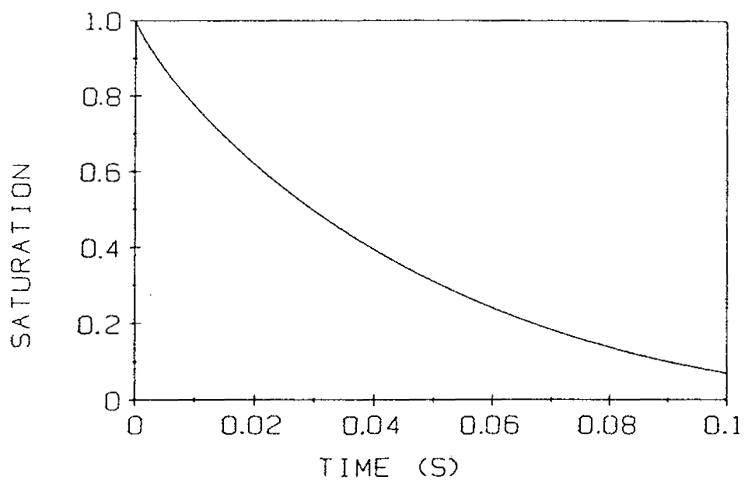
Mean red-cell hemoglobin saturation fraction as a function of dimensional time, according to Equation 47, for a red cell exposed to a zero oxygen tension at the cell boundary. The time required to go from an initial saturation SA to a saturation of SB is tB – tA, where tA and tB are the time coordinates corresponding to SA and SB on the graph. The slope of the curve decreases, hence unloading a given amount of O2 takes longer at lower saturation. (From Clark, A., Jr., Federspiel, W. J., Clark, P. A. A., and Cokelet, G. R., Biophys. J., 47, 171, 1985. With permission.)
The studies discussed above8,19,169 used the Hill equation for the oxyhemoglobin dissociation curve, which is not accurate at saturations S <0.2 and S >0.8. In addition, as was noted before, the one-step kinetic model is only used for mathematical simplicity and does not reflect true kinetic reactions between hemoglobin and oxygen. Thus, recently the solution was extended by Yap and Hellums195 to Adair’s four-step chemical kinetics, Equation 21. It was compared with a variable rate coefficient model, Equation 20, which is consistent with the Adair oxyhemoglobin dissociation curve. A cylindrical geometry was considered as in an earlier study.8 It was shown that for parameters in physiological range the results practically coincide, thus justifying the use of the simpler variable rate coefficient model.
3. Capillary Transport
In the analyses considered above, oxygen transport in plasma gaps between red cells and the transport within red cells were treated independently by specifying certain artificial boundary conditions. In reality, the processes inside and outside the cells are coupled, so, ideally, they should be described by simultaneous equations for the two phases. Calculations simultaneously taking into account the particulate nature of blood, O2 diffusion in plasma gaps, O2 diffusion facilitation by hemoglobin, and Hb-O2 kinetics using a variable rate coefficient model were presented by Federspiel and Popel.35 The problem was either two-dimensional, with the capillary modeled as a plane layer and the red cells represented by eccentrically situated circles, or three-dimensional axisymmetric with capillaries modeled as a cylindrical tube and red cells as spheres. At the cell-plasma boundary, the corresponding values of PO2 and oxygen fluxes were matched; at the capillary wall, the PO2 was set at a constant value, Pw, thus uncoupling the problem from the solution of transport in the tissue. The results were presented in terms of a mass transfer coefficient, k, defined as
| (49) |
where jm is the spatially averaged O2 flux at the wall, and Pc corresponds to the mean saturation of a particle through the Hill equation. In dimensionless form k* = kd/Dplα, where d is capillary diameter (or thickness of the plane capillary), and Dpl is the oxygen diffusion coefficient in plasma. Since the Hill equation was used, the analysis was restricted to the range of saturation S = 0.2 – 0.8. First, eccentricity was found to have little effect on the results.
As expected from earlier studies of oxygen transport in plasma gaps between cells,3,33,70 spacing between cells has a major effect on the mass transfer coefficient (Figure 8). The ratio of capillary to particle diameter, λ, called particle clearance, also affects k, but to a smaller degree. A hyperbolic dependence of k* on 2 L for large separations can be derived from the notion that the O2 flux from each red blood cell reaches a maximum when the cells are far from each other and are separated by regions of zero flux. In this case the average flux, represented by k*, is obtained by dividing the maximum flux by the area of capillary surface per red cell, 2 π R (2L + 2Rc), where Rc is red cell radius. The calculated values of the mass transfer coefficient were used to estimate the ratio of the intracapillary to total (equals intracapillary plus tissue) resistance to oxygen transport. We can recall that Hellums62 estimated this quantity to be about 0.5 at a hematocrit of 50%. The results of more detailed theory35 are in qualitative agreement with those estimates. However, Hellums neglected the transport in the plasma gaps entirely, and did not take into account either facilitated diffusion or chemical kinetics. Why then are the results in agreement? It is because the resistances in the plasma gaps and in the cells, present in both models, are the primary components of the intracapillary resistance. Diffusion in the plasma gaps and facilitated diffusion within red cells both decrease the intracapillary resistance, whereas diffusion in the plasma layers between the cells and the capillary wall contribute to the total resistance. These factors act in opposite directions and tend to cancel each other.
FIGURE 8.
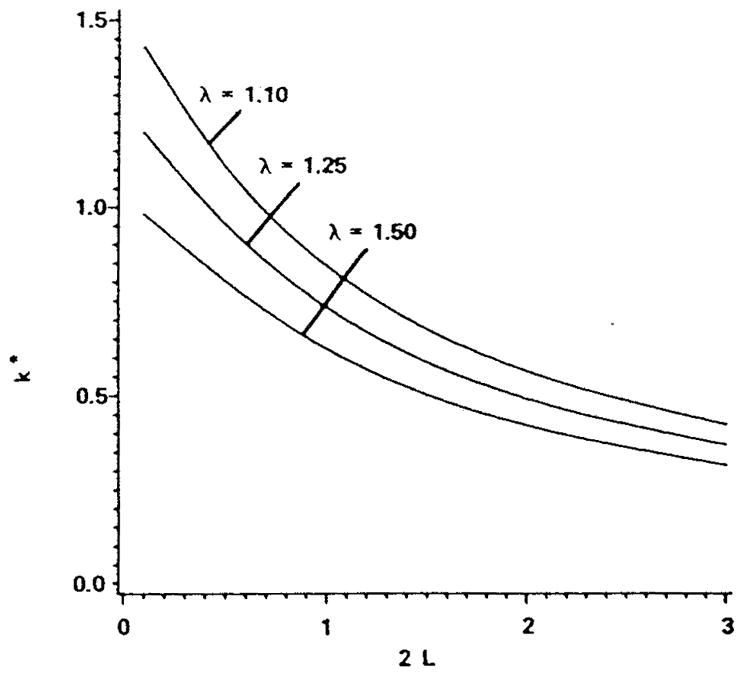
Effect of red cell spacing, 2 L, normalized by red cell diameter and clearance, λ (the ratio of capillary to red cell diameter) on the capillary mass transfer coefficient for the case of spherical red cells in a cylindrical capillary. The mass transfer coefficient is averaged for saturations in the range S = 0.2 to 0.8. (Modified from Federspiel, W. J. and Popel, A. S., Microvasc. Res., 32, 164, 1986. With permission.)
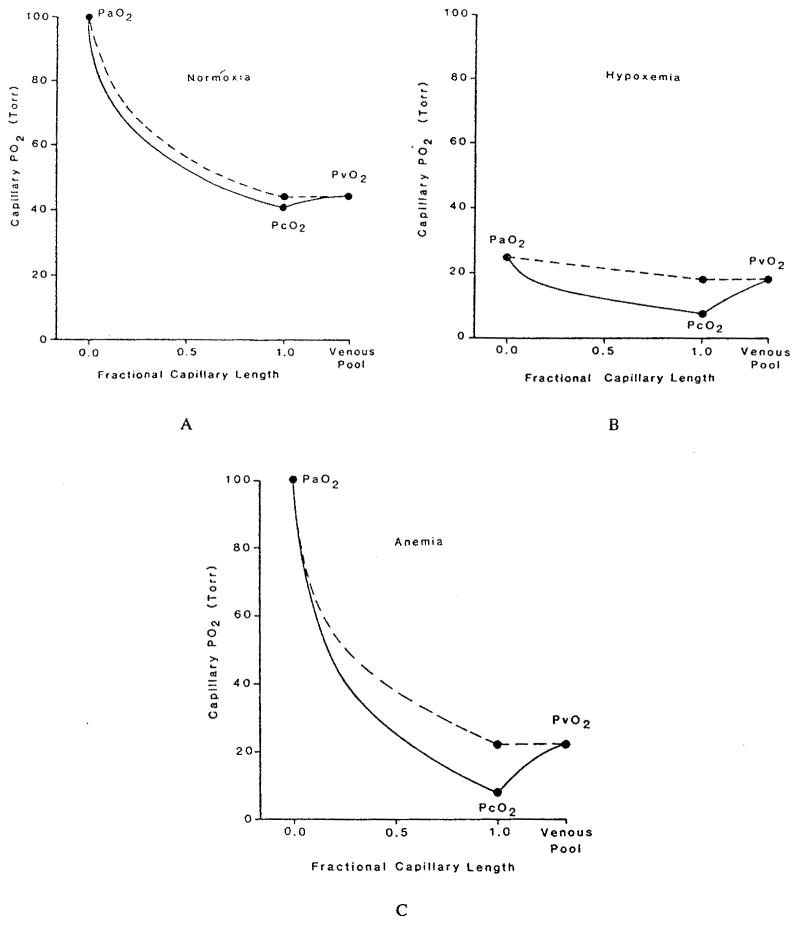
These studies have reaffirmed the role of red cell spacing, but they have left the question open whether Hb-O2 kinetics play a significant role under any conditions. This question was addressed by Gutierrez.58 He represented the blood as a homogeneous mixture of plasma and red cells, but, instead of expressing the transport in the form of partial differential equations, he formulated, in essence, difference equations for “compartments” along the capillary. For each compartment, the O2 and HbO2 concentrations were governed by two coupled ordinary differential equations. As has already been mentioned above, the reaction rate coefficients were chosen as functions of saturation in order to fit experimental data on human blood. The only component of intracapillary resistance to oxygen transport in this model is the kinetics of the chemical reaction. If the reaction is instantaneous, then the equations are reduced to the equilibrium oxyhemoglobin dissociation curve. The equations were solved numerically for the conditions of normoxia, hypoxic hypoxia (or hypoxemia, i.e., reduced arterial PO2), and anemic hypoxia (reduced hematocrit). The results are shown in Figure 9a,b,c. While the theory predicts only a small kinetic effect in normoxia, there is a large effect in hypoxic and anemic hypoxia, when the capillary plasma PO2 is significantly lower than the “equilibrium” PO2, corresponding to the hemoglobin saturation, and also lower than the venous PO2. The model predicts that, because the rate of the chemical reaction is finite, the oxygen is released from the plasma into the tissue, but the chemical reaction is limiting its replenishment from bound to free form; thus, the PO2 in the plasma lags behind the “equilibrium” PO2 by a considerable amount — as much as 10 torr at the venous end of the capillary. When the blood reaches the venous pool, it is re-equilibrated, which results in an increase of the PO2.
FIGURE 9.
Capillary PO2 profiles for different conditions of O2 supply computed assuming infinite rate of chemical reaction (dashed line) and finite rate (solid line). (a) Normal conditions; (b) hypoxic hypoxia (the arterial PO2 is 25 torr); (c) anemic hypoxia (the hemoglobin concentration is one third normal, equal to 5 g/100 ml). (From Gutierrez, G., Respir. Physiol., 63, 79, 1986. With permission.)
Kinetic effects were also considered by Artigue et al.5 and Niimi et al.127,128 These studies assumed a linear rate of chemical reaction, R = K(Pc – Ppl), and the coefficient K was specified. Groebe and Thews51 also considered kinetic effects using a chemical reaction rate described by Equation 15.
Although the described effects of intracapillary resistance to oxygen transport have not been directly validated experimentally (i.e., the gradients between the hemoglobin “equilibrium” PO2 corresponding to hemoglobin saturation and the plasma PO2 have not been measured), Honig et al.72 pointed to evidence for these gradients. The “dissociation” between plasma PO2 and venous PO2 would have important implications for interpretation of whole organ experiments in which the venous PO2 is regarded as an indicator of tissue PO2.
C. OXYGEN TRANSPORT IN RED BLOOD CELL SUSPENSIONS FLOWING IN VESSELS LARGER THAN CAPILLARIES
In capillaries, red cells are restricted to a single-file motion. In larger vessels, the walls do not impose such constraint on the cell motion, and when the blood is subjected to shear flow, its formed elements undergo random or pseudorandom motion, somewhat resembling the Brownian motion of molecules. These shear-induced particle migrations and the concomitant fluid motion can significantly augment transport of solutes, in particular of oxygen. The models of shear-induced augmentation of solute transport have recently been reviewed by Zydney and Colton.196
If red blood cell motion in sheared suspension is considered random, particle diffusion or dispersion coefficient can be introduced, analogous to the molecular diffusion coefficient
| (50) |
where is the mean square displacement, and Δt is the time between observations. For deformable particles (drops and red blood cells) of characteristic radius a in a local shear rate γ, the numerous data on particle diffusion can be empirically fitted by a curve196
| (51) |
where ϕp is the particle volume fraction or hematocrit. The best fit values for parameters k and n are k = 0.15, n = 0.8. For particles of size a = 1.6 – 3.5 μm, Equation 51 gives Dp = (1 – 5)10−9 γ cm2/s. Thus, Dp = 2·10−7–10−6 cm2/s for γ = 200 s−1, and Dp = 2·10−6–10−5 cm2/s for γ = 2000 s−1. In the limit ϕp = 1 the effective diffusivity decreases to zero. This is supported by experimental observations that in packed ghost cell suspensions tracer red cells undergo no significant lateral migrations.
A theory of shear-induced augmentation of oxygen transport in blood was proposed by Diller and Mikic.27 They assumed that red cells make radial movements in steps of length, and that they stay at the new position for a time, Δt/2. Since the cells have come to a new oxygen environment, reaction-diffusion processes occur during this time. In calculating the transport of oxygen inside the cell, the advancing front model was used. This model is based on an assumption that there is an advancing front of chemical reaction propagating into the cell. The reaction zone consists of a thin layer within which the reaction is not in equilibrium, followed by a layer where the reaction is in equilibrium, i.e., the relationship between oxygen and oxyhemoglobin concentrations is described by the equilibrium oxyhemoglobin dissociation curve. The red cells are assumed to be flat disks with their faces parallel to the wall; thus the oxygen transport calculations are done in one dimension for plane sheets of hemoglobin. In this problem, only the kinetics of the chemical reaction play a role; the diffusion facilitation by hemoglobin is not important. The calculations yield the following expression for the effective oxygen diffusion coefficient (Diller and Mikic,27 slightly corrected by Zydney and Colton196):
| (52) |
Here Do is the effective diffusion coefficient in the suspension under unsheared flow or no flow conditions, g is a measure of departure of the Hb-O2 reaction from equilibrium, 0 ≤ g ≤ 1, (g = 1 when the reaction is in equilibrium), and m is proportional to the slope of the oxyhemoglobin dissociation curve, m = CHbα−1dS/dP, where CHb is the oxygen-binding capacity of the hemoglobin solution. Figure 10a and b shows the results of the calculations together with experimental data. As follows from Equation 52, the slope of the oxyhemoglobin dissociation curve plays an important role in the augmentation: for fully saturated blood m = 0 and the augmentation is small, whereas for unsaturated blood the effective diffusion coefficient can increase severalfold.
FIGURE 10.
Comparison of predictions, Equation 52, for the effective oxygen diffusion coefficient with experimental data in tubes with diameter larger than 300 μm. γ is the shear rate, m is proportional to the slope of the oxyhemoglobin dissociation curve, and L is the assumed radial step in red cell movement. (a) Unsaturated blood; (b) saturated blood. (Modified from Diller, T. E. and Mikic, B. B., J. Biomech. Eng., 105, 346, 1986. With permission.)
This model’s ability to predict augmentation was further confirmed in Diller et al.,28 where it was applied to flowing hemoglobin solution with hemolyzed cells added to the flow.
This model has been validated for tubes of large diameter, over 300 μm. However, the flow in smaller vessels (arterioles and venules) is characterized by a nonuniform hematocrit distribution, at least by a reduced cell concentration near the wall. Modeling intravascular oxygen transport in these small vessels has not been attempted.
IV. MODELS OF OXYGEN TRANSPORT IN TISSUE
A. DIFFUSION IN HOMOGENEOUS TISSUE
Oxygen diffusion in homogeneous tissue is governed by the reaction-diffusion equation
| (53) |
where Pt is the tissue oxygen tension, Dt is the diffusion coefficient, αt is the solubility coefficient, and M is the rate of the irreversible chemical reaction in which oxygen is utilized. Note that this case is significantly different from the cases of reversible chemical reactions between oxygen and hemoglobin and myoglobin. The rate of chemical reaction can be a function of Pt. Commonly considered models of oxygen consumption are (a) Zero-order kinetics:
| (54) |
(b) First-order kinetics:
| (55) |
(c) Mixed zero and first-order kinetics:
| (56) |
(d) Michaelis-Menten kinetics:
| (57) |
Here Pm is the value of PO2 at which the rate of reaction is half-maximal. When Pm→O, the Michaelis-Menten kinetics approach zero-order kinetics, M→M0. For small values of oxygen tension, Pt ≪ Pm, the Michaelis-Menten kinetics approach first-order kinetics. The mixed kinetics (c) can be regarded as a piecewise linear approximation to (d). A generalization of the Michaelis-Menten kinetics was proposed, based on the hypothesis of two-cytochrome model of O2 metabolism:125
| (58) |
where 0 ≤ f ≤ 1, and Pm1 and Pm2 are constants.
A solution to Equation 53 can be easily obtained for steady state in the case of a semi-infinite layer of tissue occupying a space x ≥ 0, with the oxygen tension specified at the boundary, Pt = P0 at x = 0. In the case of zero-order kinetics, the solution is
| (59) |
where Lp = (2DtαtP0/M0)1/2 is the penetration depth beyond which the oxygen tension equals zero. This, and a number of other solutions of the diffusion Equation 53 for plane and cylindrical geometry were presented by Hill.64
For first-order kinetics the solution is
| (60) |
Thus, unlike the case of zero-order kinetics, tissue PO2 is positive everywhere, i.e., the oxygen molecules can penetrate infinitely far from the boundary. We can expect similar behavior for both mixed and Michaelis-Menten kinetics because at small values of Pt, they behave like the first-order kinetics.
Generally, Equation 53 can be integreated once:
| (61) |
Integration of Equation 61 with boundary condition Pt(0) = P0 gives the solution of Equation 53. An implicit solution of Equation 53 is
| (62) |
For certain functions M(P) the integrals in Equation 62 can be calculated analytically, e.g., for polynomial M(P), thus the solution can be expressed in closed form. For the Michaelis-Menten kinetics the external integral in Equation 62 cannot be calculated analytically, thus, numerical integration is necessary.
Hill64 considered simultaneous diffusion of oxygen and lactic acid for plane and cylindrical layers of tissue under steady and unsteady conditions. Solutions have been obtained for tissue diffusion in other geometries.40,108,110,115,124,136
Time-dependent solution of the problem with zero-order kinetics presents mathematical and computational difficulties because of the moving boundary separating regions of zero and non-zero PO2; finding the motion of the boundary is part of the solution.24,32,42 In the mathematical literature, such problems with moving boundaries are referred to as Stefan problems.
B. DIFFUSION IN HETEROGENEOUS TISSUE
The formulation discussed in the previous section assumed that tissue is spatially homogeneous. In reality, tissue consists of cells and extracellular spaces. Further, there are intracellular heterogeneities, for example, those caused by discrete oxygen consumption by mitochondria. These heterogeneities may affect the distribution of oxygen in the tissue.
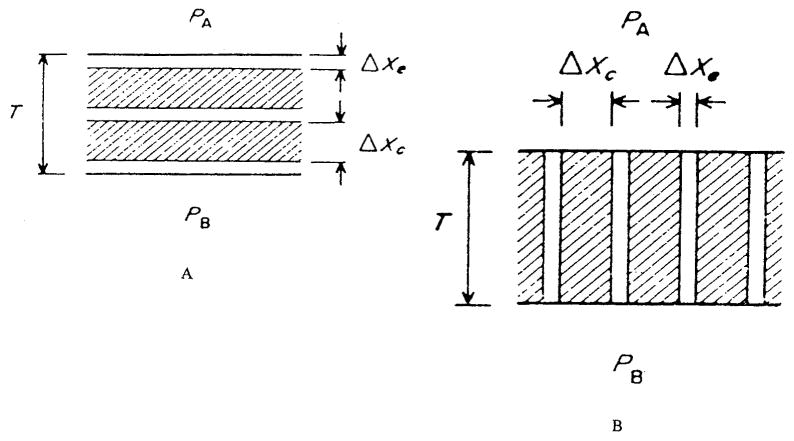
First, we consider tissue heterogeneities at the cellular level due to differences in diffusion inside and outside the cells. Qualitatively, the problem was analyzed by Hill.64 A model of tissue composed of plane layers with different diffusion characteristics was proposed by Tai and Chang,176 Figure 11. The product of diffusion and solubility coefficients is commonly called permeability or the Krogh coefficient, K = Dα. It is assumed that cellular and extracellular media can be characterized by permeabilities Kc and Ke, respectively, and that the cells consume oxygen at a constant rate m (zero-order kinetics). If ϕe is the volume fraction of the extracellular material, then volume-averaged tissue oxygen consumption is M = (l − ϕe)m The effective permeability of a layer of heterogeneous medium is defined as the permeability of a homogeneous medium with a uniform consumption rate M such that, for a given PO2 difference at the boundaries, the oxygen fluxes at the corresponding boundaries are equal. For parallel and series arrangements of cellular and extracellular layers in the model, the effective permeabilities are, respectively,
FIGURE 11.
Definition sketch of the heterogeneous tissue models: (a) Series model; (b) parallel model. (From Tai, R. C. and Chang, H. -K., J. Theor. Biol., 43, 265, 1974. With permission.)
| (63) |
| (64) |
Expressions 63 and 64 can be derived from equations presented in Tai and Chang.176 Note that Kp and Ks are independent of thickness of the tissue slice and depend only on permeabilities and on volume fraction of extracellular space. It can be shown by direct comparison that Kp ≥ Ks.
Tai and Chang176 also extended an earlier model67 to analyze a situation where, at a certain distance from the tissue boundary, the rate of cell respiration is submaximal. The rate is determined from the solution of the problem of oxygen distribution in a spherical or spheroidal cell with zero-order kinetics when the central part of the cell is anoxic.
Stroeve174 went a step further by solving the diffusion equation analytically in and around spherical cells following zero- or first-order kinetics and then volume-averaging the results. His approach followed the Maxwell’s classical approach to deriving transport properties of a heterogeneous material. For zero-order kinetics he obtained
| (65) |
It can be shown that the permeabilities (Equations 63 and 64) for parallel and series arrangements are upper and lower bounds, respectively, for permeabilities of media with other geometries; in particular, Ks ≤ K0 ≤ Kp. Equations 63 to 65 can be used for estimating the cellular permeability Kc if the effective permeability is measured experimentally and if the permeability of the extracellular medium is known. Stroeve174 estimated the ratio Ke/Kc from the three models (Equations 63 to 65) using experimental data on the cat cerebral cortex. The predicted values of Kc were several times larger than Ke, suggesting that much of the resistance to oxygen diffusion is localized within the cells. Subsequently, similar expressions were obtained for first-order kinetics (Equation 55) and mixed kinetics (Equation 56).184
Inside the cell, oxygen is consumed almost exclusively within mitochondria. Thus, it is possible, in principle, that intracellular PO2 distribution is highly heterogeneous, with large perimitochondrial PO2 drops and flat PO2 distribution in the rest of the cytosol. However, Clark and Clark18 and Clark et al.20 presented convincing arguments to show that the perimitochondrial PO2 drop should not exceed a few hundredths of a torr. For a spherical mitochondrion of radius Rm, this estimate can be easily obtained by solving the diffusion equation for oxygen distribution around the mitochondrion in spherical coordinates
| (66) |
where P∞ is the PO2 in the cell far from the mitochondrial surface, and Pm is the PO2 at the mitochondrial surface. Oxygen flux at the surface then equals j = K(P∞ − Pm)/Rm, where K is the oxygen permeability of cytosol. On the other hand, in the steady state oxygen flux multiplied by surface area should be equal to the amount of oxygen consumed by the mitochondrion
| (67) |
where is the volume of the mitochondrion, and mm the rate of O2 consumption per unit mitochondrial volume. From Equations 66 and 67 after simple algebraic calculations, we obtain:
| (68) |
Using values of parameters typical for skeletal muscle20 mm = 1.4·10−6 mol/ml/s, K = 2.13·10−14 mol/cm/s/torr, and Vm = 0.38 μm3, we get ΔPm = 0.04 torr. For other shapes of the mitochondrion this estimate may change by a factor of the order of unity, but in all cases remains well below a torr.
Thus, the resistance to oxygen diffusion in the tissue is distributed within the cell and not concentrated in narrow layers surrounding individual mitochondria. In other words, the discrete nature of oxygen consumption does not affect the overall pattern of oxygen distribution, provided that mitochondria are uniformly distributed.
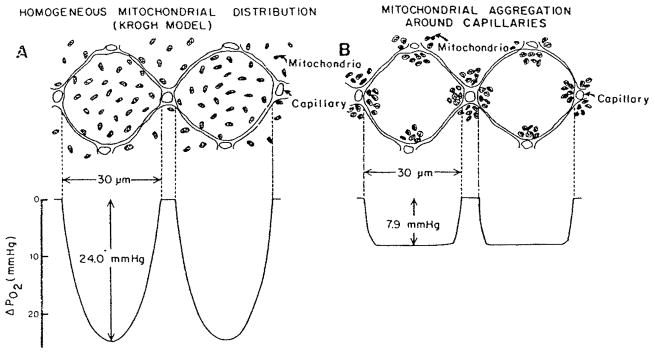
The distribution of oxygen in the cell could be altered, however, if there is significant clumping of mitochondria. There is experimental evidence of the mitochondrial clumping around capillaries and sarcolemma. Mainwood and Rakusan116 formulated a model of oxygen diffusion in the cell with simultaneous diffusion of ATP or creatine phosphate from mitochondria to the rest of the cell. An example of the predictions of the model in the extreme case where all the mitochondria are clustered within 3 μm of capillaries is shown in Figure 12. These calculations demonstrate a theoretical possibility that heterogeneity of the mitochondrial distribution may affect PO2 profile in the cell. However, a quantitative analysis of this effect based on systematically collected experimental data is not available at present.
FIGURE 12.
Distribution of PO2 in cylindrical cells with 1:1 cell-to-capillary ratio (a) Homogeneous mitochondrial distribution; (b) mitochondria are clustered within 3 μm of capillaries. (From Mainwood, G. W. and Rakusan, K., Can. J. Physiol. Pharmacol., 60, 98, 1982. With permission.)
Longmuir112 has drawn a radically different picture of intracellular oxygen transport. He has suggested that oxygen is transported from blood to mitochondria along channels of high solubility; the endoplasmic reticulum could serve to channel oxygen. The cytosol is largely free of oxygen because of its low solubility. However, theoretical and experimental validation of this hypothesis remains to be done.
V. MODELS OF OXYGEN TRANSPORT IN THE MICROCIRCULATION
This section reviews conceptual geometrical models of blood-tissue transport emphasizing the mathematical formulations and solutions. Applications of the models to specific tissues are discussed in Section VI.
A. CAPILLARY-TISSUE OXYGEN EXCHANGE
1. Krogh Tissue Cylinder Model of Capillary Transport
The Krogh tissue cylinder model of oxygen transport between blood capillaries and tissue102 has served as the foundation and starting point for many theoretical studies (see review by Kreuzer99). It has also been broadly used in physiological studies for estimating oxygen distribution in tissue. This section reviews the development of models based on the Krogh tissue cylinder geometry; these models are commonly referred to as Krogh’s models even through the original model of Krogh was based on a number of simplifying assumptions that have been relaxed in subsequent applications.
The essence of Krogh’s models lies in the assumption that the tissue can be subdivided into circular cylindrical units each of which has a capillary oriented along the axis, and the units do not exchange oxygen with each other (Figure 13). In formulating this geometrical model, Krogh had in mind the capillary geometry in skeletal muscle where muscle fibers have a preferential direction and capillaries tend to be oriented along the fibers.
FIGURE 13.
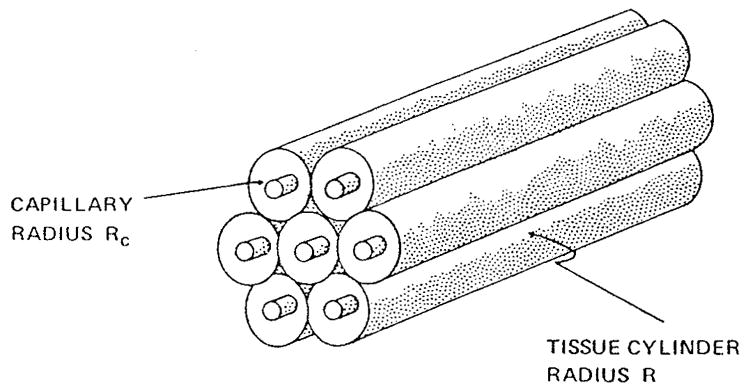
Geometry of the Krogh tissue cylinder model.
To formulate an equation governing tissue oxygen transport, the following assumptions were made:
-
1
PO2 distribution in the tissue cylinder is axisymmetric.
-
2
The permeability of tissue to oxygen, or the Krogh diffusion coefficient, K = Dtαt, is independent of spatial position.
-
3
Oxygen in the tissue is not bound to a carrier, e.g., to myoglobin in muscle.
Under these assumptions, the equation governing oxygen transport in the tissue can be written in the form
| (69) |
At the outer boundary of the tissue cylinder the flux of oxygen is zero in accordance with the assumption that adjacent units do not exchange oxygen:
| (70) |
Krogh made additional assumptions of:
-
4
A steady state (the term ∂Pt/∂t in Equation 69 is zero)
-
5
A constant oxygen consumption
-
6
Negligible axial diffusion (the term ∂2Pt/∂z2 is small)
He did not consider the transport of oxygen in the capillary; rather the PO2 at the capillary wall was specified:
| (71) |
The solution of Equation 69 with boundary conditions 70 to 71 is
| (72) |
This solution was derived by a colleague of Krogh, the mathematician Erlang. Equation 72 gives the radial distribution of tissue PO2 in terms of capillary and tissue cylinder radii and tissue permeability. In particular, it permits the calculation of the minimum tissue PO2, which occurs at the outer rim of the tissue cylinder, i.e., at r = R.
Oxygen transport in the capillary has already been discussed above. Because of the particulate nature of blood, we have two choices in the description of capillary transport: we can either treat it in a detailed fashion by explicitly considering red blood cells and plasma,3,19,35 or we can introduce variables averaged over a cross-section of the capillary and consider their variation along the capillary. The former approach, coupled with a model of transport in the tissue, would lead to a complicated unsteady problem that has not yet been explored. The latter approach can be outlined as follows. Under the assumption that the capillary is “well mixed” in the cross-section, we can express the volumetric flux of oxygen through any cross-section in the form:94
| (73) |
where Pb is the intracapillary oxygen tension, Qpl is the volumetric flow rate of plasma, Qc is the volumetric flow rate of red cells, αpl is the oxygen solubility coefficient in plasma, αHb is the oxygen solubility coefficient in the hemoglobin solution inside red cells, and CHb is the oxygen-binding capacity of the hemoglobin solution. The first term in Equation 73 represents the convective flux of free oxygen in plasma, the second term represents the convective flux of free oxygen inside the cells, and the third term represents the flux of oxygen bound to hemoglobin. If we express the volumetric flow rates of red cells and plasma in the form, Qc = QHD, Qpl = Q(l − HD), where HD is the discharge capillary hematocrit and Q is the volumetric blood flow rate, then we can rewrite the oxygen flux through a capillary cross-section as the sum of fluxes of free and bound oxygen
| (74) |
where αb = (l − HD)αpl + HDαHb is the oxygen solubility coefficient in blood, and C = HDCHb is the oxygen-binding capacity of blood.
The mass balance of oxygen in the capillary can be expressed as
| (75) |
where j is the flux of oxygen at the capillary-tissue interface. Implicit in the derivation of Equation 75 is the assumption:
-
7
Hb-O2 chemical reaction is instantaneous, i.e., the rate of the reaction is very fast compared with the processes taken into account in Equation 75.
At the capillary-tissue interface the flux of oxygen is continuous
| (76) |
and the relationship between intracapillary and tissue PO2 is given in terms of a mass transfer coefficient
| (77) |
In addition, the capillary PO2 is specified at the capillary inlet
| (78) |
The mass transfer coefficient was introduced by early researchers in the field,12,25 but was interpreted as the permeability of the capillary membrane. If k is infinite, there is no resistance to oxygen transport at the capillary level. At present, the finite value of k is attributed primarily to the resistance to oxygen transport inside red cells and in the plasma.35,62
A number of authors treated the problem differently, by postulating free diffusion in the capillary, and infinite mass transfer coefficient (e.g., Reneau et al.145,146). However, in view of more recent studies of intracapillary transport, the approach presented here is more consistent.
In a steady state in the absence of axial diffusion and at constant tissue oxygen consumption, the capillary-tissue oxygen flux is constant, j = π(R2 − Rc2)M independent of z, i.e., the oxygen that diffuses from the capillary at a position z is consumed in the slice of tissue z = constant. Thus, Equation 75 can be integrated:
| (79) |
The subscript “a” refers to the values at the arteriolar end of the capillary. If we disregard the concentration of free oxygen in comparison with that bound to hemoglobin and adopt the Hill Equation 4 for the oxyhemoglobin dissociation curve, we can use Equation 79 to express PO2 distribution along the capillary
| (80) |
where v = π(R2 − Rc2)ML/CQ and z* = z/L. Oxygen tension in the tissue at the capillary-blood interface can be found from Equation 77:
| (81) |
Relationships 72, 80, and 81 completely solve the problem under the simplifying assumptions (1 to 7).
A significant effort has been devoted over the years to assessing the validity of assumptions (1 to 7) under different physiologic conditions, to relaxing these assumptions, and to developing mathematical solutions, both numerical and analytical, to the complete problem of oxygen transport in Krogh’s geometry. Reneau and his colleagues (Reneau et al.,145,146 Knisely et al.96) performed a systematic numerical study of the problem using finite difference methods. Axial diffusion in the tissue was considered. Zero-order chemical kinetics for oxygen consumption was assumed, and the development of anoxic regions was described by the solution; cases of unsteady diffusion were also analyzed. When axial diffusion in the tissue is considered, additional boundary conditions for the tissue PO2 at the planes z = 0 and z = L are required; commonly, no-flux boundary conditions are specified. The authors included not only radial, but also axial diffusion of oxygen in the capillary. However, the effect of the capillary axial diffusion was shown to be negligible, and that of radial diffusion small under most conditions. A sample of their calculations, presented in Figure 14, shows the development of anoxic regions in tissue when the oxygen-binding capacity, C (denoted N in the figure), is reduced. Note that these cases require solution of a nonlinear diffusion equation in the tissue and are not described by analytical solutions 72 and 79. A characteristic feature of the Krogh tissue cylinder geometry is the “lethal corner”, the area of tissue at the outer rim of the cylinder in the plane of the venular end of the capillary. Tissue PO2 is least at the lethal corner; thus, when oxygen delivery is compromised, hypoxia and anoxia would begin in this region. As we shall see, other geometrical models of capillary-tissue transport do not lead to a “lethal corner” concept.
FIGURE 14.
(a) PO2 profiles in the capillary, according to Krogh’s model showing the effect of reduced hematocrit (oxygen binding capacity). Numbers along the abscissa are fractions of the total capillary length. Red blood cells are shown for illustration only, the blood was treated as a homogeneous hemoglobin solution: (b) Anoxic areas of tissue between parallel concurrent capillaries resulting from the reduced hematocrit. (From Knisely, M. H., Reneau, D. D., Jr., and Bruley, D. F., Angiology, 29, S1, 1969. With permission.)
If the spatial coordinates in the differential Equation 69 are properly nondimensionalized, r* = r/R, z* = z/L, then the second derivative with respect to z* is multiplied by a parameter ε2 = (R/L)2. In many important cases, in particular for skeletal muscle and myocardium, this parameter is small, and, as a result, a significant mathematical simplification of the problem is possible. Problems characterized by a small parameter at the derivative of highest order belong to a broad class of singular perturbation problems (for ε = 0 the order of equation changes, hence singularity). These problems can be treated by the method of matched asymptotic expansions.107 Salathe et al.150 used this method to obtain three terms in asymptotic expansions up to the order ε2 for the steady problem with constant oxygen consumption. Intracapillary resistance to oxygen transport was neglected. Analytical estimates of the terms contributed by axial diffusion were obtained. The method of matched asymptotic expansions was also applied to the problem of the development of anoxia following occlusion (Salathe and Wang153).
A somewhat similar problem of periodic capillary occlusion was solved numerically by Hyman et al.81 However, an additional effect was included of oxygen utilization by oxidative removal of the lactic acid produced in the tissue during hypoxia (oxygen debt). The concentration of lactic acid was converted into the concentration of oxygen that would be required to remove the lactic acid. Figure 15 shows the computed values of PO2 in the lethal corner and of PO2 spatially averaged over the tissue cylinder during recovery from ischemia. A solution was also obtained for the case of reactive hyperemia (Hyman and Artigue82).
FIGURE 15.
Krogh’s model used in calculations of recovery from occlusion. (a) Without oxygen debt; (b) following 2 min of occlusion with oxygen debt. (From Hyman, W. A., Grounds, D. J., and Newell, P. H., Jr., Microvasc. Res., 9, 49, 1975. With permission.)
Fletcher38 formulated the problem in a general form, which included, in addition to the axial diffusion and finite resistance at the capillary wall, the kinetic effects of the Hb-O2 reaction. He considered two equations for the capillary region, one for the free oxygen and one for the bound oxygen. He then obtained numerical solution of the problem and analyzed sensitivity for most parameters. The results suggest only a small effect of nonequilibrium kinetics on oxygen distribution.
2. Models of Capillary Transport with Non-Kroghian Geometries
The Krogh tissue cylinder model is, in a certain sense, universal and has been applied to a multitude of tissues, but with different parameters, such as tissue cylinder radius, capillary radius, capillary blood flow, oxygen consumption, and tissue permeability to oxygen. On the other hand, most models with non-Kroghian geometry reflect the morphological structure of a specific tissue. Thus, it would be logical to discuss these particular models in Section VI, where theoretical results on transport in different tissues are reviewed. Here, general model developments and features that are relevant for most tissues are considered.
We can outline the formulation of the mathematical problem for an arbitrary capillary geometry by generalizing the formulation for Krogh’s models, expressed by Equations 69 and 75. Consider an arbitrary capillary network surrounded by generally nonhomogeneous tissue. In the absence of an oxygen carrier in the tissue, the transport equation can be written in the form:
| (82) |
In general, diffusion of oxygen is three-dimensional, whereas in the Krogh model, Equation 69, only radial and axial diffusion are considered because of the axial symmetry of the problem. Also, in Equation 82 we allow the diffusion and solubility coefficients, as well as the oxygen consumption rate, to be functions of spatial coordinates. Hence transport characteristics are nonuniform. Such nonuniformities may occur at the cellular level, for example, muscle fibers of different biochemical composition, glial and neuronal cells in the brain, or at a larger scale, e.g., tissue damaged by ischemia adjacent to normal tissue. In anisotropic tissues (e.g., skeletal and heart muscles), the diffusion can also be anisotropic,71 so that the diffusion coefficients in different directions form a tensor.
If a well-mixed cross-section of the capillary is assumed, then Equation 75 is applicable with the only difference being that z should be replaced by curvilinear coordinate along the capillary, say q:
| (83) |
where the integral in the right-hand side is taken over the curve Γ that is the intersection of the plane q = constant with the capillary surface.
At the capillary-tissue interface:
| (84) |
where ∂/∂n is the derivative outward normal to the capillary surface.
Additional boundary conditions are required at the boundaries of the tissue domain. These conditions depend on the assumptions regarding the relationship between the domain and the surrounding tissue. In most cases, the domain is regarded as microcirculatory unit, so that the bulk of the tissue can be subdivided into the units arranged in periodic or symmetric fashion. Such a geometric structure would imply periodic or no-flux boundary conditions at the boundary of the unit. If tissue has an external surface through which oxygen can be exchanged with the environment, then a different boundary condition should be posed on the surface, for example, either PO2 at the surface or a mass transfer coefficient should be specified.
Non-Kroghian geometrical tissue models presented in the literature are particular cases of the above formulation. Krogh tissue cylinder can be regarded as the simplest microcirculatory unit, even though circular cylinders are not space filling. Hexagonal space-filling cylinders were considered by Thews177 and Hudson and Cater77 and square cylinders by Popel;134 the differences between these models and the Krogh model are only minor.
Grunewald and Sowa56 introduced microcirculatory units (MCU) supplied by four capillaries along which arteriolar inlets and venular outlets were placed (Figure 16). Different arrangements of these inlets and outlets result in different units, examples of which are shown in Figure 17. These different units can be obtained by systematic “helical” displacement of capillary ends. With this procedure, 256 microcirculatory units can be obtained, among which 21 are nonidentical. When all capillaries are concurrent (microcirculatory unit 1), the problem is essentially reduced to square Krogh tissue cylinders. In other cases, diffusional exchange (shunting) can occur between capillaries in the unit. No-flux boundary conditions were posed on the lateral surface of the unit and periodic conditions on the upper and lower surfaces. Because the tissue domain is a parallelepiped (rectangular box), the problem lends itself to a numerical solution by finite difference methods. This model was applied to skeletal muscle,56 heart,57 and, in a modified form, to brain.93
FIGURE 16.
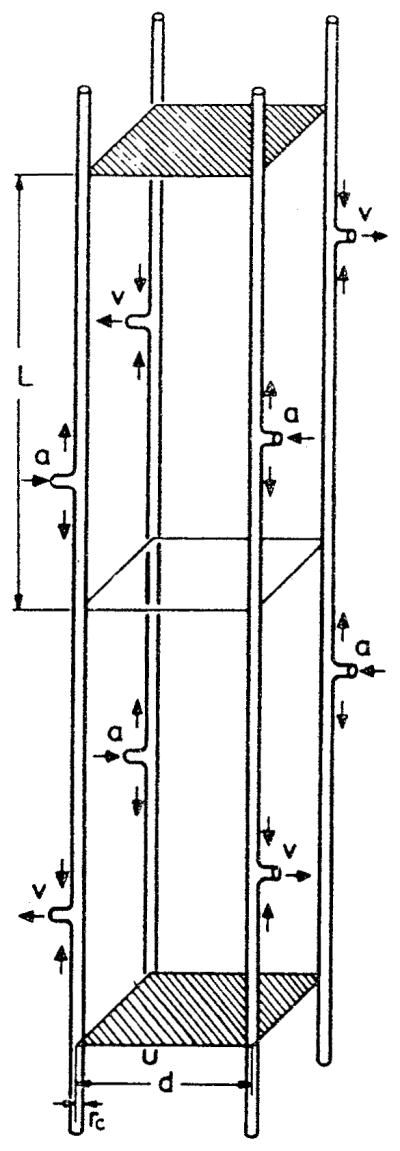
A microcirculatory unit (MCU) consists of tissue fragment of length 2 L and of 4 parallel-running capillaries, where L is identical to the capillary length, i.e., the distance between arterial inflow a and venous outflow v. The shortest distance between two capillaries is d; rc is the capillary radius. Short arrows denote direction of blood flow in capillaries. Upper and lower surface areas of the tissue fragment are hatched. (From Grunewald, W. A. and Sowa, W., Rev. Physiol. Biochem. Pharmacol., 77, 149, 1977. With permission.)
FIGURE 17.
Six microcirculatory units: MCU 1 with concurrent capillary blood flow (Krogh capillary structure); MCU 7 with partial concurrent and countercurrent capillary blood flow; MCU 19 with total countercurrent capillary blood flow; MCU 16 with spirally arranged arterial inflows (and venous outflows) shifted against one another by L/2 (helical structure); MCU 3 and 8 without specific geometry in arrangement of capillary ends (asymmetric capillary structure), a = arterial inflow, v = venous outflow. (From Grunewald, W. A. and Sowa, W., Rev. Physiol. Biochem. Pharmacol, 77, 149, 1977. With permission).
Popel134,138,140 extended Krogh’s model by considering a parallelepiped of tissue penetrated by an arbitrary number of parallel capillaries, each of which can be assigned a different value of velocity, oxygen-binding capacity, and inlet PO2. The axial diffusion was neglected, and only the diffusion in planes perpendicular to the capillary axes was considered. Hence it was a quasi two-dimensional problem. In Reference 134, the distribution of oxygen tension in the tissue was expressed analytically, using essentially the Green function method. The problem was then reduced to solution of nonlinear ordinary differential equations describing PO2 variation along the capillaries. The solution was utilized in systematic studies of oxygen diffusive shunts between neighboring capillaries.138,140 A finite-difference numerical solution was obtained141 in a study of statistical properties of PO2 distribution when capillary characteristics (red-blood-cell flux, inlet PO2) were assigned randomly, according to certain probability distributions (Monte Carlo simulation). Thus, distributions were calculated for an ensemble of randomly selected microcirculatory units that were subsequently ensemble averaged. The model was applied to striated muscle by Ellsworth et al.31
The stochastic nature of capillary oxygen exchange was also expressed in Reference 168, where an attempt was made to derive analytical expressions for probability distribution of Hb-O2 saturation in a capillary network assuming a linear distribution of saturation along capillary segments.
The studies discussed above were limited to parallel capillary geometries. However, even in skeletal muscle and heart that serve as prototypes for these models, the geometrical arrangements can be significantly different, whereas in a tissue like brain, the capillaries form what appears to be a random geometrical pattern. Metzger120 proposed a lattice-type microcirculatory unit (Figure 18) in which capillaries form a cubic mesh with mixed concurrent and countercurrent flow; he also considered a two-dimensional lattice (rectangular grid of capillaries). The model was applied to oxygen transport in brain.
FIGURE 18.
Three-dimensional cubic capillary mesh model. It consists of a tissue cube with 3×3×3 capillaries. Input and output points are located at opposite corners of the cube. By symmetry, only the tetrahedron shown has to be used for numerical simulation. (From Metzger, H., Math. Biosci., 30, 31, 1976. With permission.)
These models, even when formulated for a specific tissue, reflect the general architectural arrangement of capillary networks in different tissues. More specific geometrical models (e.g., brain, skin) are discussed in Section VI.
3. Continuum Description of Oxygen Transport
Heterogeneities in tissue transport occur at different spatial scales: (1) at the intracellular level; (2) at the cellular level, for example, adjacent cells with different oxygen consumption rates or a pair of countercurrent capillaries; (3) at the capillary network level, for example, adjacent capillary networks with high and low blood flow; (4) at the macroscopic organ level. Description of transport at these levels can be achieved by different mathematical approaches. Salathe152 stated that a description of the fine-scale intercapillary variation is not necessary for an understanding of the overall manner in which oxygen is supplied to a given organ. Thus, he addressed the problem of large-scale transport of oxygen in the tissue by smoothing the fine-scale variations with a volume-averaging procedure. Locally, capillaries were assumed to be parallel, although their direction could change from location to location. Also, fine-scale gradients were assumed to be small compared with large-scale gradients. A single oxygen concentration, c, was introduced that characterized both tissue and capillaries. The derivation resulted in a single partial differential equation for the concentration c:
| (85) |
where ψ is the fractional volume occupied by the capillaries, vc is the capillary blood velocity, and q is a coordinate along the capillaries. Equation 85 enables one to solve problems of diffusional interaction between tissue regions without having to calculate the distribution around individual capillaries. Figure 19 illustrates the interaction between two adjacent regions of tissue perfused by capillaries with different inlet blood concentrations.
FIGURE 19.
Capillary-tissue oxygen concentration distribution resulting from two adjacent groups of capillaries perfused with different initial concentrations. The x axis is along the capillaries; distances are in microns. (From Salathe, E. P., Math. Biosci., 58, 171, 1982. With permission.)
One of the limitations of this model is the minimum scale at which the variations of oxygen concentration could be predicted. In the derivation, the volume over which the concentration is averaged is not strictly specified; however, it is clear that this volume should be at least the size of the characteristic distance between capillaries. Thus, the model’s predictions of variations at a scale smaller than intercapillary distance would be unreliable.
B. MODELS OF PRE- AND POSTCAPILLARY TRANSPORT
The development of mathematical models of oxygen transport from arterioles to tissue and from tissue to venules was instigated by experimental findings in the last 2 decades that indicated that significant amounts of oxygen exchanged between arterioles and the surrounding tissue.133 There has also been intensive discussion of the possibility of countercurrent exchange of oxygen between paired arterioles and venules (Harris60). Such an anatomical arrangement is very common (Wiedeman189).
The first model of arteriolar-tissue transport was formulated by Popel and Gross.135 In this, as well as other models formulated thus far, the arteriolar cross-section is assumed to be well mixed and no intra-arteriolar resistance to oxygen transport is considered; hence the governing equation for the arteriolar lumen is the same as for the capillary, namely, Equation 83. Transport in the arteriolar wall is governed by a diffusion equation similar to Equation 82, since the arteriolar wall does not have a separate supply of oxygen and receives oxygen by diffusion from the lumen. The extravascular region, which contains parenchymal cells and blood capillaries, was modeled phenomenologically, i.e., without considering any details of the tissue structure. The transport in steady state was described by a linear equation
| (86) |
where P∞ is the background PO2 far from the arteriole, and ℓt is a phenomenological parameter called penetration depth; it characterizes the distance through which a disturbance from an oxygen source or sink can penetrate.
The equation was applied to the problem of arteriolar-tissue exchange (Popel and Gross,135 Pittman,133 Kuo and Pittman104) and to countercurrent exchange between paired arteriole and venule (Sharan and Popel166). In the latter case, Equation 86 was solved numerically and the problem then reduced to solution of a system of two coupled nonlinear ordinary differential equations for PO2 distribution along the two vessels. Comparison with experimental data showed that the theory significantly underestimated the flux of oxygen from arterioles.104
To overcome uncertainties of the phenomenological model, a new model was formulated that used explicit information on capillary network geometry and hemodynamics (Weerappuli and Popel185). The description of extra-arteriolar transport was based on Equation 85. The numerical solution of the problem predicts a significant diffusive interaction between an arteriole and the capillaries and tissue that surround it. Figure 20 shows the contours of PO2 around the arteriole (capillary flow is from left to right). As a result of the diffusive interaction, a long “wake” of elevated PO2 is formed downstream from the arteriole. Popel et al.142 applied the model to the analysis of recently obtained experimental data.104 The results are qualitatively consistent with the analysis done with the previous model;135 the model predicts an order of magnitude higher permeability of tissue to oxygen, K = Dtαt, than is currently accepted. Full implications of this prediction on other aspects of oxygen transport have not yet been explored.
FIGURE 20.
Contour plot showing variation of PO2 around an arteriole. On the blood-wall interface P = PIumen = 31.6 torr. The arteriolar lumen is shown in black. The avascular wall is not shown for the sake of clarity. Capillary flow is from left to right. A “wake” of elevated PO2 is formed behind the arteriole as a result of diffusive exchange between arteriole and the surrounding tissue. (From Weerappuli, D. P.V. and Popel, A. S., J. Biomech. Eng., 111, 24, 1989. With permission.)
Calculations of oxygen distribution for a small network consisting of an arteriolar segment and several discrete capillaries were presented by Secomb and Hsu.160 The Green’s function method was used that reduced the problem to the solution of an integro-differential equation. This method, however, is restricted to constant consumption in the tissue, and it is not applicable to cases where hypoxic regions are formed.
C. COMPARTMENTAL MODELS OF OXYGEN TRANSPORT
All the models discussed to this point were concerned with spatial variation of oxygen concentration, be it in plasma gaps between red cells in the capillary or in the tissue around arteriolar vessels. Consequently, such models are often referred to as distributed. On the other hand, a class of models that ignore spatial variation are referred to as compartmental models; they are dealing with exchange between domains, called compartments, with a single value of concentration assigned to each compartment. This division has no relevance to the size of the system: compartments can be intracellular, or they can represent entire organs. Mathematically, distributed models are described by differential equations containing derivatives with respect to coordinates and time (for unsteady problems), whereas compartmental models may only contain time derivatives. Therefore, compartmental models are described by either ordinary differential equations or by algebraic equations.
Detailed compartmental models that consider chemical interactions of oxygen with other substances in the erythrocyte, plasma, interstitial fluid, and intracellular fluid compartments are presented by Bidani and Flumerfelt,11 Hill et al.,65 and Salathe et al.151 On a larger scale, there are models dealing with arteriovenous diffusive shunt (Piiper et al.131).
Next, there are comparmental models of an organ circulation treating groups of “series” vessels as compartments in addition to one or more tissue compartments (Roth and Wade147). Figure 21 shows the scheme of the corresponding vascular and tissue arrangement. Larger arterioles and venules exchange oxygen through the connective tissue compartment. All other vessels exchange oxygen with the tissue compartment. Mass balance equations are formulated for oxygen in each compartment (vascular and tissue). For a steady problem, the procedure results in a system of nonlinear algebraic equations with respect to average PO2 in each compartment. Predictions of this model are discussed below in the context of skeletal muscle. An extended compartmental model was applied to the analysis of oxygen transport in the brain (Sharan et al.167).
FIGURE 21.
Compartmental model of muscle with diffusive gas exchange between tissue and all the vascular elements and with convective gas transport along the circulation. The arterioles (a0, a1, a2) and venules (v0, v1, v2) are separated into three compartments on the basis of vessel diameter; Q is the flow through the vascular compartments including the capillary compartment (C). There are two tissue compartments, one representing connective tissue (CT) between parallel segments of the larger arterioles and venules, and the other representing muscle tissue (T) with M equal to the metabolic rate. The Js represent the flux across compartmental boundaries with flux magnitudes governed by the spatially averaged partial pressures (P) and the diffusive conductances (E). (From Roth, A. C. and Wade, K., Microvasc. Res., 32, 64, 1986. With permission.)
Models that considered oxygen exchange only in the capillary compartment have been incorporated into a larger model that included hemodynamics and regulation (Granger and Shepherd,48 Granger and Granger49).
D. OPTIMALITY OF OXYGEN TRANSPORT
It is appropriate to mention here attempts to rationalize the structure of the capillary-tissue system from the standpoint of optimization of oxygen transport. Wilson192 formulated a model similar to Krogh’s with the difference that the total, not the local, flux at the outer surface of the tissue cylinder was required to be zero, and, in addition, the oxygen concentration was required to be constant at the surface. He then determined capillary density from the condition of the minimum of the volume-averaged entropy production; the local entropy production due to oxygen diffusion in the tissue is proportional to the square of the oxygen concentration gradient. Kamiya et al.87 formulated a model of tissue with spherical rather than cylindrical tissue elements and determined the number of capillaries in the entire body from the condition of minimum of a cost function. In both studies, the calculated capillary density was in a reasonable agreement with experimental values. Khanin and Bukharov89,90 analyzed a whole-body oxygen balance based on the principle of minimum power.
VI. MODELS OF OXYGEN TRANSPORT IN SPECIFIC TISSUES AND ORGANS
A. SKELETAL MUSCLE
A characteristic feature of skeletal, or, more generally, striated muscle, is that its capillary bed has an apparently more regular structure than that of most other tissues. Muscle fibers have a preferential direction along which muscle can contract, and blood capillaries tend to be oriented along the fibers (Wiedeman189). This anatomical structure lends itself to the simple geometrical model proposed by Krogh,102 Figure 13. Skeletal muscle can operate in a continuum of physiological states between rest and maximum work. Both blood flow and oxygen consumption can increase by an order of magnitude in exercise, accompanied by changes in the number of functioning capillaries.50 Krogh’s model has been used extensively over the past 70 years in quantitative predictions of oxygen distribution in muscle under different physiological conditions.59 However, over the years, a number of factors have been identified that call for reassessment of the model, most important of which are transport heterogeneity, intracapillary resistance to oxygen transport, and facilitation of oxygen transport by myoglobin (Honig et al.72).
Krogh was well aware of anatomical irregularities in the capillary bed — in particular the presence of capillary anastomoses not aligned with muscle fibers and the heterogeneity of capillary hemodynamics.103 However, theoretical foundations for studying the heterogeneity of oxygen transport have been developed only in the last decade. Grunewald and Sowa56 investigated oxygen distribution in microcirculatory units supplied by four capillaries (Figure 16). PO2 histograms for different microcirculatory units were generated and compared with experimental PO2 histograms obtained with tissue electrodes in human resting muscle. The best agreement with the data was obtained when PO2 histograms corresponding to different microcirculatory units were weight-averaged in certain proportions. However, representing the tissue as a conglomerate of different microcirculatory units is inconsistent with no-flux boundary conditions that were imposed on the lateral boundaries of the units. In fact, it was shown that different microcirculatory units placed next to each other may exchange substantial amounts of oxygen. 140 The model was utilized in other studies of oxygen exchange in skeletal muscle.113,114
Klitzman et al.94 analyzed the data obtained with an oxygen microelectrode in superfused resting and contracting hamster cremaster muscle. When PO2 measurements are combined with intravital microscopy for identification of the position of the microelectrode with respect to the capillaries, the measurements are limited to depths of several muscle fibers from the surface of the tissue. The distribution of oxygen near the tissue surface could be affected by the solution superfusing the surface. The model utilized in the analysis took into account oxygen exchange at the surface (Popel139), Figure 22. Capillaries were concurrent and arranged in square arrays. The experimental data consisted of measurements of PO2 in the tissue near the venous end of the capillaries. The data were used to estimate the oxygen consumption rate and inlet capillary PO2, neither parameter had been measured in the experiments. Interestingly, the predicted inlet capillary PO2 in resting muscle was around 30 torr, consistent with other experimental and theoretical reports of large precapillary loss of oxygen. Calculated capillary PO2 distributions are shown in Figure 23a for three different values of oxygen tension at the tissue surface, Ps. Also shown are the predictions of the Krogh model with the same parameters except that the surface of the muscle was made impermeable to oxygen. Figure 23b shows the PO2 isobars in the plane through the venous ends of capillaries in resting and contracting muscle. Clearly, the superfusing solution has an important effect on oxygen distribution in the surface layers of tissue, especially at high values of Ps, and should be taken into account in data analysis.
FIGURE 22.
Geometrical model of the hamster cremaster muscle covered by an oxygenated solution. There are n capillary layers. Capillaries are assumed parallel to each other and concurrent. PO2 is specified at the muscle surface. (From Klitzman, B., Popel, A. S., and Duling, B. R., Microvas. Res., 25, 108, 1983. With permission.)
FIGURE 23.
(a) Predicted intracapillary PO2 for each capillary layer, Pci, as a function of position along the capillary, z*, at three values of muscle surface oxygen tension, Ps, for the geometry shown in Figure 22. Also shown are intracapillary PO2 values predicted by the Krogh cylinder model (PK) which assumes no O2 supply from the surface, (b) Distribution of tissue PO2 in the plane z* = 1.0 at the venous end of capillaries for different values of surface oxygen tension, Ps. Panels A to C are for resting muscle and panel D is for a muscle contracting at 1 Hz. Lines are PO2 isobars. Solid circles represent perfused capillaries. (From Klitzman, B., Popel, A. S., and Duling, B. R., Microvasc. Res.. 25, 108, 1983. With permission.)
Ellsworth et al.31 used microspectrophotometry to make in vivo measurements of oxygen saturation in individual capillaries of the hamster cheek-pouch retractor muscle and analyzed the data with the help of a mathematical model. The model considers a block of tissue penetrated by parallel concurrent capillaries, Figure 24, with either uniform or nonuniform length distribution. The model’s formulation follows Equations 82 to 84, except that the axial diffusion is neglected. The measurements of hemoglobin saturation, SO2, at the arterial end are used as boundary conditions, and the predicted values of SO2 at the venous end are compared with the experimental data. It is shown that under resting conditions, diffusive shunting is so prominent that the effect of heterogeneities at the arterial end almost disappears toward the venous end in the model with uniform capillary length, Figure 25a. This is contrary to the experimental findings that show an increased heterogeneity of SO2 toward the venous end. However, nonuniformity of capillary pathlength was found to be an important factor, and taking it into account led to at least a qualitative agreement with experimental data. For quantitative comparisons, a network model reflecting a more realistic pathlength distribution is necessary. Simulations of oxygen transport in contracting muscle lead to entirely different predictions of the effect of heterogeneities. While most differences between capillaries are erased in resting muscle due to diffusive shunts, the differences are amplified in contracting muscle, leading to a large dispersion of SO2 at the venous end, even when capillary pathlength is uniform (Figure 25b). These predictions have yet to be tested experimentally.
FIGURE 24.
Geometry of the mathematical models, (a) Uniform capillary flow path length; (b) nonuniform capillary flow path length. Capillaries are assigned experimental values of red blood cell flux and inlet hemoglobin saturation. (From Ellsworth, M. L., Popel, A. S., and Pittman, R. N., Mi-crovasc. Res., 35, 341, 1988. With permission.)
FIGURE 25.
Predictions of the distribution of hemoglobin saturation (SO2) in 6 of the 16 parallel capillaries with uniform flow pathlength (labeled 1 to 6 in Figure 24). (a) Resting muscle; (b) contracting muscle. (From Ellsworth,-M. L., Popel, A. S., and Pittman, R. N., Microvasc. Res., 35, 341, 1988. With permission.)
The role of myoglobin in storing oxygen in skeletal muscle and releasing it when the supply is interrupted has long been appreciated and understood. The myoglobin was taken into account in a Krogh cylinder model that was solved numerically for the circumstance of occlusion (stopped blood flow).4,82 However, it is the role of myoglobin in facilitating the diffusion of oxygen that has been elucidated in recent years by mathematical models.23,34,39,129,154,175 See also reviews.85,100,101 Since myoglobin molecules are restricted to muscle fiber and cannot penetrate through the plasma membrane, it was suggested85 that a muscle fiber surrounded by blood capillaries would be a more appropriate model of an elementary microcirculatory unit than the Krogh tissue cylinder model (Figure 26a). Federspiel34 solved the problem numerically using the values of parameters for the maximally respiring dog gracilis muscle. The effect of capillaries was simulated by specifying PO2 on the fiber surface as a periodic function of the angular coordinate. The effect of myoglobin facilitation is shown in Figure 26b for different total myoglobin concentrations. It was shown that myoglobin-rich muscle fibers can sustain high oxygen consumption with a low PO2 at the sarcolemma (a few torr) due to the large facilitation of oxygen diffusion by myoglobin.
FIGURE 26.
(a) Two-dimensional (r, θ) model of oxygen diffusion into a myoglobin-containing skeletal muscle fiber. The evenly spaced capillaries are located at the θi angular positions and the midcapillary angular positions are the θim. The oxygen tension at the sacrolemma, PS(θ), varies along the sacrolemma to model the discrete capillary oxygen supply, (b) Maximal radial gradients of oxygen tension are studied by considering radial profiles of P(r, θ = θ1) normalized by P50. The effect of myoglobin concentration is presented. Parameters correspond to the dog gracilis contracting muscle. (From Federspiel, W. J., Biophys. J., 49, 857, 1986. With permission.)
In skeletal muscle, mitochondria are not distributed uniformly in the fiber, but are concentrated in bands at uniform intervals throughout the tissue. Covell and Jacquez23 simulated mitochondrial distribution in a muscle fiber by considering periodic oxygen consumption in a slab of tissue. They also reached a conclusion that, for red skeletal muscle at maximum respiration at PO2 values below 10 torr, myoglobin provides a significant increase of oxygen delivery to mitochondria.
The mechanisms of intracapillary resistance to oxygen have been discussed in Section II. Groebe and Thews51 made an attempt to incorporate this resistance into a model of a muscle fiber (Figure 27a), along with myoglobin-facilitated diffusion. An example of computations for a fiber surrounded by four capillaries is shown in Figure 27b; the steepest PO2 gradient is predicted inside and in the immediate vicinity of the capillaries, with a shallow profile in the bulk of the fiber. These predictions are in qualitative agreement with microspectro-photometric measurements of myoglobin saturation in frozen sections of dog gracilis muscle. Thus, the intracapillary resistance and myoglobin-facilitated diffusion were identified as major factors in oxygen exchange in skeletal muscle, with nonequilibrium Hb-O2 chemical reaction possibly playing only a minor role.
FIGURE 27.
(a) Geometry of a fiber surrounded by blood capillaries; (b) PO2 distribution in a cross-section of muscle fiber surrounded by four capillaries. The fiber is surrounded by a thin concentric layer of extracellular fluid. (From Groebe, K. and Thews, G., Adv. Exp. Med. Biol., 200, 495, 1986. With permission.)
Groom et al.52 studied the angioarchitecture of the capillary bed in strongly contracted muscle. They found that capillaries were folded and formed a dense mesh around each fiber. Based on this picture, they suggested that a uniform PO2 at the sarcolemma might be an appropriate boundary condition for a contracted fiber (solid cylinder model). The predictions of the solid cylinder model and the Krogh cylinder model were compared by Piiper and Scheid.132
Finally, Roth and Wade147 used a compartmental model, discussed above (Figure 21), to predict oxygen distribution throughout the entire skeletal muscle microcirculation in rest and exercise. Parameters for the calculations were compiled from different sources, not all of them from a muscle tissue. The distributions are shown in Figure 28 for several levels of arterial PO2. These calculations suggest that at an elevated level of oxygen consumption capillaries become almost the exclusive source of oxygen to the tissue, with only small amounts contributed by arterioles and venules. In contrast, in low-consumption states, a substantial fraction of oxygen is exchanged through arteriolar walls.
FIGURE 28.
The longitudinal distribution of compartment PO2s at various input (ENTR.) PO2 at rest (—) and during moderate exercise (---). CT denotes connective tissue compartment. (From Roth, A.C. and Wade, K., Microvasc. Res., 32, 64, 1986. With permission.)
B. MYOCARDIUM
The models described above for skeletal muscle are generally applicable to capillary-tissue transport in the heart muscle, since capillary-tissue geometries are similar. However, despite the known importance of oxygen for the heart,36 only a few theoretical studies have been devoted to this organ.
Rakusan143 evaluated oxygen distribution under various physiologic conditions using the Krogh model. He and his co-workers formulated models of a capillary surrounded by a noncircular tissue cylinder (an extension of Krogh’s model) and of a fiber surrounded by capillaries (Rakusan et al.,144 Hoofd et al.74). The model described above,56 Figure 16, was also applied to the myocardium (Grunewald and Sowa57). Napper and Schubert126 utilized the Krogh cylinder geometry in an attempt to interpret experimental PO2 distributions obtained with an oxygen microelectrode in the heart perfused by an oxygenated solution. Because of the small intercapillary distances in the heart, tissue PO2 was assumed uniform in the tissue cylinder cross-section, but the axial diffusion was taken into account. However, in order to obtain an agreement between theoretical and experimental PO2 histograms, a diffusion coefficient ten times larger than accepted values had to be assumed.
Wieringa190 considered a large network of parallel capillaries, cross-connected by anastomoses. Arteriolar inputs and venular outputs were placed randomly. The simulated flow in the capillary network showed qualitative similarity with experimental flow distribution in the coronary microcirculation. In particular it exhibited a pattern of countercurrent flow. For oxygen diffusion calculations, the axial diffusion was neglected and the contribution of anastomoses, other than their effect on flow distribution, was not considered. Neither myoglobin facilitation nor intracapillary resistance were taken into account. The solution was obtained numerically by the finite element method.
C. BRAIN
The brain is an organ whose normal function depends critically on an uninterrupted delivery of oxygen. Unlike skeletal muscle that can survive for hours without oxygen, brain cells show irreversible damage within minutes from the onset of oxygen deficiency. Thus, theoretical studies have special importance for understanding how oxygen is distributed in different structures of the brain under normal and hypoxic conditions.
Theoretical work on oxygen transport in the brain began with applications of the Krogh equation (Opitz and Schneider130) and extension of the Krogh model to hexagonal space-filling tissue cylinders (Thews177). A systematic analysis of oxygen transport in the brain with the Krogh model was performed by Reneau and his co-workers.96,145,146 They used the numerical finite-difference method to obtain solutions of steady and unsteady problems of physiological importance. Examples of these calculations are shown in Figure 14.
However, the architecture of the capillary network in the brain does not provide support for the Krogh model. Other models have been formulated that reflect the heterogeneity of capillary architecture and hemodynamics. Metzger120 proposed a cubic-lattice model for a brain microcirculatory unit (Figure 18). Flow in the capillaries was calculated by applying Kirchhoff’s laws; thus, flow heterogeneity was simulated, although in an idealized way. Kislyakov and Ivanov93 adapted the four-capillary microcirculatory unit proposed earlier by Grunewald and Sowa56 to represent a spherical neuron surrounded by a mass of glial cells (Figure 29) (see also Kislyakov,91 Ivanov and Kislyakov83). The oxygen consumption rate within the neuron is about ten times higher than in the glial cells, and that has a significant effect on oxygen distribution. A more realistic geometry of capillary-cell structure was incorporated in a model by Ivanov et al.;84 an example of this geometry with two capillaries around a spindle-shaped neuron is shown in Figure 30. The geometry of neurons and capillaries in their model can be taken directly from three-dimensional anatomical reconstruction studies. The model was also used to study the dynamics of oxygen transport during alteration of blood flow and respiratory activity of the neurons.92 In these and other studies from this group of investigators, the treatment of capillary transport was different from the description given by Equations 83 and 84. Their formulation was not derived from rigorous mass-balance formulations. Thus, even though the geometry of the models84,93 is a significant step from the Krogh model, the results may be dependent, in an unknown way, on the ad hoc treatment of the capillary transport.
FIGURE 29.
(a) Schematic representation of a microcirculatory unit with the spherical neuron at the center; (b) PO2 distribution in cross-sections of the unit. (From Kislyakov, Y. Y. and Ivanov, K. P., J. Biomech. Eng., 108, 28, 1986. With permission.)
FIGURE 30.
(a) A neuron surrounded by two capillaries (K1 and K2); (b) PO2 distribution in cross-sections (cell and capillaries are indicated by hatching and dashed lines, respectively). Lines in section are isobars, with values indicating PO2 levels (torr). (From Ivanov, K. P., Kislyakov, Y. Y. and Samoilov, M. O., Microvasc. Res., 18, 434, 1979. With permission.)
In most studies of oxygen transport, the governing differential equations are solved numerically by a discretization method, either finite difference or finite element. A probabilistic scheme, commonly known as Monte Carlo simulation, has been developed by Bruley and his associates.13,191 The authors suggest that the Monte Carlo method has advantages compared with discretization methods, especially for problems with complex geometry, but so far it has only been applied to simplified geometries and its utility for more realistic problems has yet to be demonstrated.
There is experimental evidence that significant precapillary loss of oxygen occurs in the cerebral circulation. In order to include transport in the pre- and postcapillary microcirculation, Sharan et al.167 modified the compartmental model of Roth and Wade147 and applied it to oxygen transport in the brain. The model considered 11 vascular compartments and a tissue compartment. The transport coefficients for arterioles and venules were calculated from the model of Popel and Gross.135 Countercurrent diffusive shunting between large arterioles and venules was included in the model, but the results indicated that the shunt is not important. The calculations were done for different types of hypoxia (hypoxic hypoxia, carbon monoxide hypoxia, and anemic hypoxia) using characteristics of sheep and lamb brains.
D. LUNGS
The problem of oxygen loading in the blood capillaries of the lung is, in a sense, inverse to the problem of oxygen unloading in other tissues. Thus, the equations describing capillary transport in the lung are similar to those formulated above for other tissues. There are certain important differences, however. First, a capillary in the lung can be more accurately described as a slit rather than a circular tube. Second, the blood in the capillaries is separated from the air in the alveoli by a membrane whose resistance to oxygen transport has to be taken into account. Third, changes in the concentration of carbon dioxide along the capillary are interdependent with the transport of oxygen through the Bohr and Haldane effects. Thus, for a better understanding of oxygen transport, simultaneous analysis of oxygen and carbon dioxide transport is necessary. A summary of the mechanisms involved in oxygen exchange in the lung was presented by Weibel.186 An analysis of transport in the lung capillaries was put forward in a classic work by Roughton and Forster.149 Ulanowicz and Frazier179 considered five major reactions involving oxygen and carbon dioxide in hemoglobin solution, and investigated one-dimensional diffusion through a quiescent plane layer of hemoglobin. Hill et al.65 used a similar approach in a compartmental model of pulmonary exchange.
Singh et al.171 considered a model of a capillary slit exchanging O2 and CO2 through the plane walls. They formulated five balance equations for O2, CO2, Hb, HbO2, and HbCO2, and presented an order-of-magnitude analysis of the problem. The equations describe convection of substances along the capillary, chemical reactions between the substances, and diffusion of all substances across the capillary. Thus, facilitated transport of oxygen and carbon dioxide were included in the model. These researchers used the governing equations subsequently in a series of publications that presented numerical solution to the problem,162 took into account axial diffusion in the capillary163 and pulmonary membrane resistance,165 and considered unsteady processes.164 However, the equations governing O2-CO2-Hb reactions171 appear to be based on the assumption that oxygen and carbon dioxide compete for the same sites on the hemoglobin molecules; therefore, these equations differ significantly from descriptions used by other researchers of pulmonary exchange.65,148,179 This difference has not been critically discussed in the literature, and it is not clear how the results in References 162–165, 171 are affected by the assumptions made in the formulation.
E. ARTERIAL WALL
The wall of large arteries is supplied with oxygen from two sources: from the lumen and from a special circulation, vasa vasorum, located in the adventitia and the outer part of the media. The inner part of the wall (the intima and much, if not all of the media) is avascular. In small arteries, the entire wall is avascular. Oxygen deficiency in the arterial wall has been linked to atherosclerosis, which has stimulated investigations of oxygen transport. Theoretical studies of oxygen transport in the wall were aimed at a better understanding of the complex relationships between blood flow pattern in the lumen and oxygen distribution in the wall. A recent review of the arterial wall oxygen transport was published by Goldstick and Dobrin.47
Back6 presented analytical estimates of transport in the vessel lumen and in the avascular wall for steady and pulsatile flow. Standard transport equations were written for the blood region, and the avascular wall, with the matching conditions of continuity of oxygen flux and oxygen tension. PO2 in the bloodstream far from the wall and at the outer boundary of the avascular region was specified. Using the data for rabbit abdominal aorta, he concluded that resistance to transport in blood was about twice that of the wall. Pulsatile flow effects were found to influence the oxygen concentration only in a narrow region in the vicinity of the lumen. It is well known that in the bloodstream a cell-free or cell-depleted layer, several microns thick, is formed adjacent to the wall. Schneiderman and Goldstick156 obtained a numerical solution of the problem, taking into account the cell-free layer and concluded that oxygen gradients in the blood phase extend significantly beyond the layer; thus a major transport resistance lies in the flowing blood. A more general solution was presented by Schneiderman et al.,158 where the pulsatility of blood flow was accounted for. The distribution of oxygen in the human thoracic aorta is illustrated in Figure 31. Significant PO2 gradients in the blood are predicted as far as 100 μm from the wall. Pulsatility has practically no effect on the exchange. A similar model was applied to the analysis of in vivo and in vitro experimental data on PO2 distributions obtained with oxygen microelectrode (Buerk and Goldstick14). Extensions of the model address the problem of oxygen transport in diseased vessels (Back et al.7, Schneiderman et al.157) and the effect of carbon monoxide hypoxia (Schneiderman and Goldstick155).
FIGURE 31.
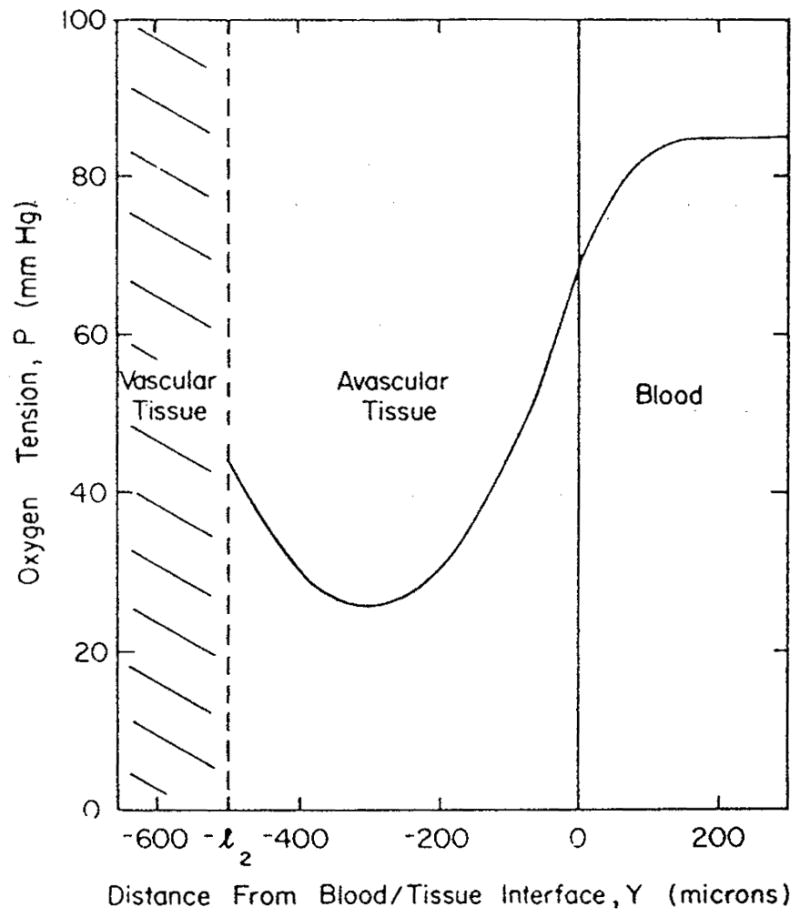
PO2 profile in human thoracic aorta for steady flow. The time-averaged profile with pulsatile flow would be imperceptibly different. A large resistance to oxygen transport is located in the flowing blood. (From Schneiderman, G., Mockros, L. F., and Goldstick, T. K., J. Biomech., 15, 849, 1982. With permission.)
F. SKIN
Microcirculation in the skin has a very specific organization. Capillaries form loops that extend toward the surface of the skin. The transport of heat, in addition to oxygen, is an important function of the skin microcirculation. A model of the skin microcirculatory unit was formulated by Grossmann,54 Figure 32a. Diffusion in the capillary was considered. The model also included equations of heat transfer. The mass and heat transport equations were coupled through the temperature dependence of the oxyhemoglobin dissociation curve. An example of PO2 distribution in a cross-section drawn through the capillary loop is shown in Figure 32b. Heating and cooling the skin surface as well as different types of oxygen environment were considered. The model was also used to investigate time-dependent regimes (Grossmann and Winkler55).
FIGURE 32.
(a) Microcirculatory unit of the skin (ed, dead epidermis; ev, viable epidermis; sp, stratum papillare; a, arterial inflow; v, venous outflow); (b) PO2 distribution over a cross-section of the microcirculatory unit through the capillary loop. Resting blood flow, skin surface in contact with oxygen-free medium, homogeneous temperature of 37°C. (From Grossmann, U., Math. Biosci., 61, 205, 1982. With permission.)
G. OTHER ORGANS
Oxygen transport has been studied theoretically in several other tissues and organs. The calculations of PO2 distribution were done for the carotid body (Grossmann et al.,53 Degner and Acker26), retina (Friedland41) and cornea of the eye (Lin109), and nerve (Lagerlund and Low105). Also, compartmental models were applied to the analysis of oxygen transport to the intestine (Granger and Shepherd,48 Granger and Granger49), fetal circulation (Huikeshoven et al.78), and placental circulation (Hill et al.66).
VII. MODELS OF OXYGEN TRANSPORT IN DISEASE: SICKLE CELL ANEMIA
Oxygen is involved in a crucial way in sickle cell anemia through a chain of hemor-heological and transport processes. When oxygen is unloaded in the capillaries, red blood cells get stiffer, which leads to an increase in viscosity of blood and, consequently, to a decrease in blood flow. This, in turn, limits oxygen delivery and leads to a further decrease of flow, until the circulation is blocked. Thus, in a theoretical model it is necessary to combine the oxygen transport problem with the mechanical problem of red blood cell motion in the capillary, making the mechanics dependent on the level of oxygen. Lomen and Gross111 and Berger and King9,10 investigated this problem in detail, by combining the Krogh model with Lighthill and Fitz-Gerald’s model of capillary flow. Recently, the compartmental model of Granger and Shepherd48 was extended to describe microcirculatory oxygen delivery in sickle cell disease (Vayo et al.183).
VIII. CONCLUDING REMARKS
Mathematical models have been formulated that take into account important features of oxygen transport: anatomically realistic geometry of capillary network, intracapillary resistance to transport, myoglobin facilitation of oxygen diffusion, and intracellular heterogeneities due to nonuniform distribution of mitochondria. However, no model for any tissue has included all the features deemed important for the tissue, although steps in this direction are being made. Methodological studies aimed at the development of new models or formulating mathematical solutions of existing models constitute the main body of theoretical work on oxygen transport, whereas applications to specific tissues, especially other than skeletal muscle and brain, are relatively scarce and rarely definitive. At present none of the models of oxygen transport (including Krogh’s model) has been carefully tested against experimental data. The main reason appears to be the lack of accurate measurements of oxygen tension and hemoglobin saturation in vivo with the spatial resolution necessary for validation of distributed transport models. However, with the advent of new microcirculatory technologies, such data have begun to emerge. Thus, for the first time it should become possible to validate mathematical models by direct experiments.
Only a decade ago, the picture of oxygen delivery from cells to the sites of oxygen consumption had not differed qualitatively from that described by Krogh. In the past 10 years, Krogh’s concept of radial PO2 gradients in the tissue from the capillary has undergone drastic changes and has all but reversed. Indeed, it is now proposed that the dominant PO2 gradients on the pathway from hemoglobin to mitochondria occur not in the tissue but inside the vessels. These new concepts require further experimental validation and new theoretical developments. However, if they are valid, then much of our understanding of oxygen transport to tissue will have to be reassessed.
Acknowledgments
I wish to thank Drs. M. L. Ellsworth and D. P. V. Weerappuli for critical comments, and Ms. Brenda D. Pope for the excellent secretarial help. Supported by NIH grant HL-18292.
Footnotes
Reprinted from the Critical Reviews in Biomedical Engineering, Vol. 17, Issue 3, pages 257–321
References
- 1.Adair GS. The hemoglobin system. VI The oxygen dissociation curve of hemoglobin. J Biol Chem. 1925;63:529. [Google Scholar]
- 2.Altman PL, Dittmer DS, editors. Respiration and Circulation. Federation of American Societies for Experimental Biology; Bethesda: 1971. [Google Scholar]
- 3.Aroesty J, Gross JF. Convection and diffusion in the microcirculation. Microvasc Res. 1970;2:247. doi: 10.1016/0026-2862(70)90016-6. [DOI] [PubMed] [Google Scholar]
- 4.Artigue RS, Hyman WA. The effect of myoglobin on the oxygen concentration in skeletal muscle subjected to ischemia. Ann Biomed Eng. 1976;4:128. doi: 10.1007/BF02363643. [DOI] [PubMed] [Google Scholar]
- 5.Artigue R, Bruley D, Von Rosenberg D, Mochizuki M. The effect of the red cell deoxigenation rate on oxygen delivery to tissue. Bibl Anat. 1977;15:405. [PubMed] [Google Scholar]
- 6.Back LH. Analysis of oxygen transport in the avascular region of arteries. Math Biosci. 1976;31:285. [Google Scholar]
- 7.Back LH, Radbill JR, Crawford DW. Analysis of oxygen transport from pulsatile, viscous blood flow to diseased coronary arteries of man. J Biomech. 1977;10:763. doi: 10.1016/0021-9290(77)90090-2. [DOI] [PubMed] [Google Scholar]
- 8.Baxley PT, Hellums JD. A simple model for simulation of oxygen transport in the microcirculation. Ann Biomed Eng. 1983;11:401. doi: 10.1007/BF02584216. [DOI] [PubMed] [Google Scholar]
- 9.Berger SA, King WS. The flow of sickle-cell blood in the capillaries. Biophys J. 1980;29:119. doi: 10.1016/S0006-3495(80)85121-6. [DOI] [PMC free article] [PubMed] [Google Scholar]
- 10.Berger SA, King WS. Diffusion and convection in the capillaries in sickle-cell disease. Blood Cells. 1982;8:153. [PubMed] [Google Scholar]
- 11.Bidani A, Flumerfelt RW. Transient response of muscle and nonbrain tissue to adjustments in O2 and CO2 balance. Ann Biomed Eng. 1981;9:89. doi: 10.1007/BF02363532. [DOI] [PubMed] [Google Scholar]
- 12.Blum JJ. Concentration profiles in and around capillaries. Am J Physiol. 1960;198:991. doi: 10.1152/ajplegacy.1960.198.5.991. [DOI] [PubMed] [Google Scholar]
- 13.Bruley DF. Probabilistic solutions and models: oxygen transport in the brain microcirculation. In: Gross JF, Popel AS, editors. Mathematics of Microcirculation Phenomena. Raven Press; New York: 1980. p. 133. [Google Scholar]
- 14.Buerk DG, Goldstick TK. Arterial wall oxygen consumption rate varies spatially. Am J Physiol. 1982;243:H948. doi: 10.1152/ajpheart.1982.243.6.H948. [DOI] [PubMed] [Google Scholar]
- 15.Buerk DG. An evaluation of Easton’s paradigm for the oxyhemoglobin equilibrium curve. Adv Exp Med Biol. 1984;180:333. doi: 10.1007/978-1-4684-4895-5_32. [DOI] [PubMed] [Google Scholar]
- 16.Buerk DG, Bridges EW. A simplified algorithm for computing the variation in oxyhemoglobin saturation with pH, PCO2, T, and DPG. Chem Eng Commun. 1986;47:113. [Google Scholar]
- 17.Clark A, Jr, Cokelet GR, Federspiel WJ. Erythrocyte motion and oxygen transport. Bibl Anat. 1981;20:385. [Google Scholar]
- 18.Clark A, Jr, Clark PAA. Local oxygen gradients near isolated mitochondria. Biophys J. 1985;48:931. doi: 10.1016/S0006-3495(85)83856-X. [DOI] [PMC free article] [PubMed] [Google Scholar]
- 19.Clark A, Jr, Federspiel WJ, Clark PAA, Cokelet GR. Oxygen delivery from red cells. Biophys J. 1985;47:171. doi: 10.1016/s0006-3495(85)83890-x. [DOI] [PMC free article] [PubMed] [Google Scholar]
- 20.Clark A, Jr, Clark PAA, Connett RJ, Gayeski TEJ, Honig CR. How large is the drop in PO2 between cytosol and mitochondrion? Am J Physiol. 1987;252:C583. doi: 10.1152/ajpcell.1987.252.6.C583. [DOI] [PubMed] [Google Scholar]
- 21.Coin JT, Olson JS. The rate of oxygen uptake by human red blood cells. J Biol Chem. 1979;254:1178. [PubMed] [Google Scholar]
- 22.Colton CK. Fundamentals of gas transport in blood. In: Zapol WM, Qvist J, editors. Artificial Lungs for Acute Respiratory Failure. Academic Press; New York: 1979. p. 3. [Google Scholar]
- 23.Covell DG, Jacquez JA. Does myoglobin contribute significantly to diffusion of oxygen in red skeletal muscle? Am J Physiol. 1987;252:R341. doi: 10.1152/ajpregu.1987.252.2.R341. [DOI] [PubMed] [Google Scholar]
- 24.Crank J, Gupta RS. A moving boundary problem arising from the diffusion of oxygen in absorbing tissue. J Inst Math Its Appl. 1972;10:19. [Google Scholar]
- 25.Davis EJ, Cooney DO, Chang R. Mass transfer between capillary blood and tissues. Chem Eng J. 1974;7:213. [Google Scholar]
- 26.Degner F, Acker H. Mathematical analysis of tissue PO2 distribution in the cat carotid body. Pflugers Arch. 1986;407:305. doi: 10.1007/BF00585307. [DOI] [PubMed] [Google Scholar]
- 27.Diller TE, Mikic BB. Oxygen diffusion in blood: a translation model of shear-induced augmentation. J Biomech Eng. 1983;105:346. doi: 10.1115/1.3138431. [DOI] [PubMed] [Google Scholar]
- 28.Diller TE, Pattantyus IA, Britts WC. Augmentation and facilitation of oxygen transfer in flowing hemoglobin solutions. Adv Exp Med Biol. 1984;180:545. doi: 10.1007/978-1-4684-4895-5_52. [DOI] [PubMed] [Google Scholar]
- 29.Duling BR, Klitzman B. Local control of microvascular function: role in tissue oxygen supply. Annu Rev Physiol. 1980;42:373. doi: 10.1146/annurev.ph.42.030180.002105. [DOI] [PubMed] [Google Scholar]
- 30.Edelstein SJ, Edsall JT. Linkage between ligand binding the dimer-tetramer equilibrium in the Monod-Wyman-Changeux model of hemoglobin. Proc Natl Acad Sci USA. 1986;83:3796. doi: 10.1073/pnas.83.11.3796. [DOI] [PMC free article] [PubMed] [Google Scholar]
- 31.Ellsworth ML, Popel AS, Pittman RN. Assessment and impact of heterogeneities of convective oxygen transport parameters in capillaries of striated muscle: experimental and theoretical. Microvasc Res. 1988;35:341. doi: 10.1016/0026-2862(88)90089-1. [DOI] [PMC free article] [PubMed] [Google Scholar]
- 32.Evans NTS, Gourlay AR. The solution of a two-dimensional time-dependent diffusion problem concerned with oxygen metabolism in tissues. J Inst Math Its Appl. 1977;19:239. [Google Scholar]
- 33.Federspiel WJ, Sarelius IH. An examination of the contribution of red cells spacing to the uniformity of oxygen flux at the capillary wall. Microvasc Res. 1984;27:273. doi: 10.1016/0026-2862(84)90059-1. [DOI] [PubMed] [Google Scholar]
- 34.Federspiel WJ. A model study of intracellular oxygen gradients in a myoglobin-containing skeletal muscle fiber. Biophys J. 1986;49:857. doi: 10.1016/S0006-3495(86)83715-8. [DOI] [PMC free article] [PubMed] [Google Scholar]
- 35.Federspiel WJ, Popel AS. A theoretical analysis of the effect of the particulate nature of blood on oxygen release in capillaries. Microvasc Res. 1986;32:164. doi: 10.1016/0026-2862(86)90052-x. [DOI] [PMC free article] [PubMed] [Google Scholar]
- 36.Feigl EO. Coronary physiology. Physiol Rev. 1983;63:1. doi: 10.1152/physrev.1983.63.1.1. [DOI] [PubMed] [Google Scholar]
- 37.Fischkoff S, Vanderkooi JM. Oxygen diffusion in biological and artificial membranes determined by the fluorochrome pyrene. J Gen Physiol. 1975;65:663. doi: 10.1085/jgp.65.5.663. [DOI] [PMC free article] [PubMed] [Google Scholar]
- 38.Fletcher JE. Mathematical modeling of the microcirculation. Math Biosci. 1978;38:159. [Google Scholar]
- 39.Fletcher JE. On facilitated oxygen diffusion in muscle tissues. Biophys J. 1980;29:437. doi: 10.1016/S0006-3495(80)85145-9. [DOI] [PMC free article] [PubMed] [Google Scholar]
- 40.Franko AJ, Freedman HI. Model of diffusion of oxygen to spheroids grown in stationary medium. I Complete spherical symmetry. Bull Math Biol. 1984;46:205. [Google Scholar]
- 41.Friedland AB. A mathematical model of transmural transport of oxygen to the retina. Bull Math Biol. 1978;40:823. doi: 10.1007/BF02460609. [DOI] [PubMed] [Google Scholar]
- 42.Galib TA, Bruch JC, Jr, Sloss JM. Solution of an oxygen diffusion-absorption problem. Int J Biomed Comput. 1981;12:157. doi: 10.1016/0020-7101(81)90006-4. [DOI] [PubMed] [Google Scholar]
- 43.Garr-Peters JM, Ho CS. Oxygen transfer in the corneal-contact lens systems. CRC Crit Rev Biomed Eng. 1987;14:289. [PubMed] [Google Scholar]
- 44.Gayeski TEJ, Federspiel WJ, Honig CR. A graphical analysis of the influence of red cell transit time, carrier-free layer thickness, and intracellular PO2 on blood-tissue O2 transport. Adv Exp Med Biol. 1988;222:25. doi: 10.1007/978-1-4615-9510-6_3. [DOI] [PubMed] [Google Scholar]
- 45.Gibson QH, Kreuzer F, Meda E, Roughton FJW. The kinetics of human hemoglobin in solution and in the red blood cell at 37°C. J Physiol (London) 1955;129:65. doi: 10.1113/jphysiol.1955.sp005339. [DOI] [PMC free article] [PubMed] [Google Scholar]
- 46.Gibson QH. The reaction of oxygen with hemoglobin and the kinetic basis of the effect of salt on binding of oxygen. J Biol Chem. 1970;245:3285. [PubMed] [Google Scholar]
- 47.Goldstick TK, Dobrin PB. Arterial wall oxygen transport and its relationship to atherosclerosis. In: Skalak R, Chien S, editors. Handbook of Bioengineering. 1 Vol. 22. McGraw-Hill; New York: 1987. [Google Scholar]
- 48.Granger HJ, Shepherd AP., Jr Intrinsic microvascular control of tissue oxygen delivery. Microvasc Res. 1973;5:49. doi: 10.1016/s0026-2862(73)80006-8. [DOI] [PubMed] [Google Scholar]
- 49.Granger DN, Granger HJ. Systems analysis of intestinal hemodynamics and oxygenation. Am J Physiol. 1983;245:G786. doi: 10.1152/ajpgi.1983.245.6.G786. [DOI] [PubMed] [Google Scholar]
- 50.Granger HJ, Meininger GA, Borders JL, Morff RJ, Goodman AH. Microcirculation in skeletal muscle. In: Mortillaro NA, editor. The Physiology and Pharmacology of the Microcirculation. Vol. 2. Academic Press; New York: 1984. p. 182. [Google Scholar]
- 51.Groebe K, Thews G. Theoretical analysis of oxygen supply to contracted skeletal muscle. Adv Exp Med Biol. 1986;200:495. doi: 10.1007/978-1-4684-5188-7_62. [DOI] [PubMed] [Google Scholar]
- 52.Groom AC, Ellis CG, Potter RF. Microvascular geometry in relation to modeling oxygen transport in contracted skeletal muscle. Am Rev Respir Dis. 1984;129:S6. doi: 10.1164/arrd.1984.129.2P2.S6. [DOI] [PubMed] [Google Scholar]
- 53.Grossmann U, Wodick R, Acker H, Lubbers DW. Mathematical analysis of oxygen partial pressure distribution of the carotid body tissue. In: Acker H, Fidone S, Pallot D, Eyzaguirre C, Lubbers DW, Torrance RW, editors. Chemoreception in the Carotid Body. Springer-Verlag; New York: 1977. p. 240. [Google Scholar]
- 54.Grossmann U. Simulation of combined transfer of oxygen and heat through the skin using a capillary-loop model. Math Biosci. 1982;61:205. [Google Scholar]
- 55.Grossmann U, Winkler P. Transients of gas exchange processes in the upper skin calculated by the capillary loop model. Adv Exp Med Biol. 1984;180:35. doi: 10.1007/978-1-4684-4895-5_3. [DOI] [PubMed] [Google Scholar]
- 56.Grunewald WA, Sowa W. Capillary structures and O2 supply to tissue. An analysis with a digital diffusion model as applied to the skeletal muscle. Rev Physiol Biochem Pharmacol. 1977;77:149. [PubMed] [Google Scholar]
- 57.Grunewald WA, Sowa W. Distribution of the myocardial tissue PO2 in the rat and the inhomogeneity of the coronary bed. Pflugers Arch. 1978;374:57. doi: 10.1007/BF00585697. [DOI] [PubMed] [Google Scholar]
- 58.Gutierrez G. The rate of oxygen release and its effect on capillary O2 tension: a mathematical analysis. Respir Physiol. 1986;63:79. doi: 10.1016/0034-5687(86)90032-0. [DOI] [PubMed] [Google Scholar]
- 59.Hansson-Mild K, Linderholm H. Some factors of significance for respiratory gas exchange in muscle tissue. A mathematical analysis of a capillary model. Acta Physiol Scand. 1981;112:395. doi: 10.1111/j.1748-1716.1981.tb06835.x. [DOI] [PubMed] [Google Scholar]
- 60.Harris PD. Movement of oxygen in skeletal muscle. News Physiol Sci. 1986;1:147. [Google Scholar]
- 61.Hartridge H, Roughton FJW. The rate of distribution of dissolved gases between the red blood corpuscle and its fluid environment. J Physiol (London) 1927;62:232. doi: 10.1113/jphysiol.1927.sp002354. [DOI] [PMC free article] [PubMed] [Google Scholar]
- 62.Hellums JD. The resistance to oxygen transport in the capillaries relative to that in the surrounding tissue. Microvasc Res. 1977;13:131. doi: 10.1016/0026-2862(77)90122-4. [DOI] [PubMed] [Google Scholar]
- 63.Hill AV. The possible effects of the aggregation of the molecules of haemoglobin on its dissociation curve. J Physiol (London) 1910;41:iv. [Google Scholar]
- 64.Hill AV. The diffusion of oxygen and lactic acid through tissues. Proc R Soc London. 1928;B104:39. [Google Scholar]
- 65.Hill EP, Power GG, Longo LD. Mathematical simulation of pulmonary O2 and CO2 exchange. Am J Physiol. 1973;224:904. doi: 10.1152/ajplegacy.1973.224.4.904. [DOI] [PubMed] [Google Scholar]
- 66.Hill EP, Power GG, Longo LD. A mathematical model of carbon dioxide transfer in the placenta and its interaction with oxygen. Am J Physiol. 1973;224:283. doi: 10.1152/ajplegacy.1973.224.2.283. [DOI] [PubMed] [Google Scholar]
- 67.Hills BA. Respiration of tissue as a medium of heterogeneous permeability. Bull Math Biophys. 1970;32:219. doi: 10.1007/BF02476887. [DOI] [PubMed] [Google Scholar]
- 68.Hlastala MP, Woodson RD, Wranne B. Influence of temperature on hemoglobin-ligand interaction in whole blood. J Appl Physiol. 1977;43:545. doi: 10.1152/jappl.1977.43.3.545. [DOI] [PubMed] [Google Scholar]
- 69.Holland RAB, Shibata H, Scheid P, Piiper J. Kinetics of O2 uptake and release by red cells in stopped-flow apparatus: effects of unstirred layer. Respir Physiol. 1985;59:71. doi: 10.1016/0034-5687(85)90020-9. [DOI] [PubMed] [Google Scholar]
- 70.Homer LD, Weathersby PK, Kiesow LA. Oxygen gradients between red blood cells in the microcirculation. Microvasc Res. 1981;22:308. doi: 10.1016/0026-2862(81)90099-6. [DOI] [PubMed] [Google Scholar]
- 71.Homer LD, Shelton JB, Dorsey CH, Williams TJ. Anisotropic diffusion of oxygen in slices of rat muscle. Am J Physiol. 1984;246:R107. doi: 10.1152/ajpregu.1984.246.1.R107. [DOI] [PubMed] [Google Scholar]
- 72.Honig GR, Gayeski TEJ, Federspiel W, Clark A, Jr, Clark P. Muscle O2 gradients from hemoglobin to cytochrome: new concepts, new complexities. Adv Exp Med Biol. 1984;169:23. doi: 10.1007/978-1-4684-1188-1_2. [DOI] [PubMed] [Google Scholar]
- 73.Hoofd L, Kreuzer F. A new mathematical approach for solving carrier-facilitated steady-state diffusion problems. J Math Biol. 1979;8:1. doi: 10.1007/BF00280581. [DOI] [PubMed] [Google Scholar]
- 74.Hoofd L, Turek Z, Rakusan K. Diffusion pathways in oxygen supply of cardiac muscle. Adv Exp Med Biol. 1987;215:171. doi: 10.1007/978-1-4684-7433-6_20. [DOI] [PubMed] [Google Scholar]
- 75.Hoofd L. PhD Dissertation. University of Nijmegen; 1987. Facilitated Diffusion of Oxygen in Tissue and Model Systems. [Google Scholar]
- 76.Hook C, Yamaguchi K, Scheid P, Piiper J. Oxygen transfer of red blood cells: experimental data and model analysis. Respir Physiol. 1988;72:65. doi: 10.1016/0034-5687(88)90080-1. [DOI] [PubMed] [Google Scholar]
- 77.Hudson JA, Cater DB. An analysis of factors affecting tissue oxygen tension. Proc R Soc London. 1964;B161:247. doi: 10.1098/rspb.1964.0092. [DOI] [PubMed] [Google Scholar]
- 78.Huikeshoven FJ, Hope ID, Power GG, Gilbert RD, Longo LD. Mathematical model of fetal circulation and oxygen delivery. Am J Physiol. 1985;249:R192. doi: 10.1152/ajpregu.1985.249.2.R192. [DOI] [PubMed] [Google Scholar]
- 79.Huxley VH, Kutchai H. The effect of the red cell membrane and a diffusion boundary layer on the rate of oxygen uptake by human erythrocytes. J Physiol (London) 1981;316:75. doi: 10.1113/jphysiol.1981.sp013773. [DOI] [PMC free article] [PubMed] [Google Scholar]
- 80.Huxley VH, Kutchai H. Effect of diffusion boundary layers on the initial uptake of O2 by red cells. Theory versus experiment. Microvasc Res. 1983;26:89. doi: 10.1016/0026-2862(83)90058-4. [DOI] [PubMed] [Google Scholar]
- 81.Hyman WA, Grounds DJ, Newell PH., Jr Oxygen tension in a capillary-tissue system subject to periodic occlusion. Microvasc Res. 1975;9:49. doi: 10.1016/0026-2862(75)90051-5. [DOI] [PubMed] [Google Scholar]
- 82.Hyman WA, Artigue RS. Oxygen and lactic acid transport in skeletal muscle. Effect of reactive hyperemia. Ann Biomed Eng. 1977;5:260. doi: 10.1007/BF02407873. [DOI] [PubMed] [Google Scholar]
- 83.Ivanov KP, Kislyakov YY. Energy Requirements and Oxygen Supply of the Brain (in Russian) Nauka, Leningrad: 1979. [Google Scholar]
- 84.Ivanov KP, Kislyakov YY, Samoilov MO. Microcirculation and transport of oxygen to neurons of the brain. Microvasc Res. 1979;18:434. doi: 10.1016/0026-2862(79)90049-9. [DOI] [PubMed] [Google Scholar]
- 85.Jacquez JA. The physiological role of myoglobin: more than a problem in reaction-diffusion kinetics. Math Biosci. 1984;68:57. [Google Scholar]
- 86.Kagawa T, Mochizuki M. Numerical solution of partial differential equation describing oxygenation rate of the red blood cell. Jpn J Physiol. 1982;32:197. doi: 10.2170/jjphysiol.32.197. [DOI] [PubMed] [Google Scholar]
- 87.Kamiya A, Takeda S, Shibata M. Optimum capillary number for oxygen delivery to tissue in man. Bull Math Biol. 1987;49:351. doi: 10.1007/BF02460125. [DOI] [PubMed] [Google Scholar]
- 88.Kelman GR. Digital computer subroutine for the conversion of oxygen tension into saturation. J Appl Physiol. 1966;21:1375. doi: 10.1152/jappl.1966.21.4.1375. [DOI] [PubMed] [Google Scholar]
- 89.Khanin MA, Bukharov IB. A mathematical model of the functional state of the oxygen transport system. Bull Math Biol. 1980;42:627. doi: 10.1007/BF02460984. [DOI] [PubMed] [Google Scholar]
- 90.Khanin MA, Bukharov IB. A mathematical model of the pathological functional state of the oxygen transport system. Bull Math Biol. 1984;46:115. doi: 10.1007/BF02463725. [DOI] [PubMed] [Google Scholar]
- 91.Kislyakov YY. Mathematical Modeling of Blood Flow and Gas Exchange in the Brain (in Russian) Nauka, Leningrad: 1975. [Google Scholar]
- 92.Kislyakov YY, Samoilov MO, Ivanov KP, Luchakov YI. The dynamics of oxygen transport from capillaries to the cortical neurons of the brain. Sechenov Physiol J USSR. 1983;69:63. [PubMed] [Google Scholar]
- 93.Kislyakov YY, Ivanov KP. O2 transport in cerebral microregions (mathematical simulation) J Biomech Eng. 1986;108:28. doi: 10.1115/1.3138576. [DOI] [PubMed] [Google Scholar]
- 94.Klitzman B, Popel AS, Duling BR. Oxygen transport in resting and contracting hamster cremaster muscles: experimental and theoretical microvascular studies. Microvasc Res. 1983;25:108. doi: 10.1016/0026-2862(83)90047-x. [DOI] [PubMed] [Google Scholar]
- 95.Kolkka RW, Salathe EP. A mathematical analysis of carrier-facilitated diffusion. Math Biosci. 1984;71:147. [Google Scholar]
- 96.Knisely MH, Reneau DD, Jr, Bruley DF. The development and use of equations for predicting the limits on the rates of oxygen supply to the cells of living tissues and organs. A contribution to the biophysics of health and disease. Angiology J Vase Diseases. 1969;20:S1. doi: 10.1177/0003319769020011s01. [DOI] [PubMed] [Google Scholar]
- 97.Kreuzer F, Yahr WZ. Influence of red cell membrane on diffusion of oxygen. J Appl Physiol. 1960;15:1117. doi: 10.1152/jappl.1960.15.6.1117. [DOI] [PubMed] [Google Scholar]
- 98.Kreuzer F. Facilitated diffusion of oxygen and its possible significance; a review. Respir Physiol. 1970;9:1. doi: 10.1016/0034-5687(70)90002-2. [DOI] [PubMed] [Google Scholar]
- 99.Kreuzer F. Oxygen supply to tissues: the Krogh model and its assumptions. Experientia. 1982;38:1415. doi: 10.1007/BF01955753. [DOI] [PubMed] [Google Scholar]
- 100.Kreuzer F, Hoofd L. Facilitated diffusion of oxygen: possible significance for blood and muscle. Adv Exp Med Biol. 1983;159:3. doi: 10.1007/978-1-4684-1188-1_1. [DOI] [PubMed] [Google Scholar]
- 101.Kreuzer F, Hoofd LJC. Facilitated diffusion of oxygen and carbon dioxide. In: Fahri LE, Tenney SM, editors. Handbook of Physiology, Section 3: The Respiratory System, Vol 4, Gas Exchange. Am. Physiol. Soc; Bethesda: 1987. p. 89. [Google Scholar]
- 102.Krogh A. The number and distribution of capillaries in muscles with calculations of the oxygen pressure head necessary for supplying the tissue. J Physiol (London) 1919;52:409. doi: 10.1113/jphysiol.1919.sp001839. [DOI] [PMC free article] [PubMed] [Google Scholar]
- 103.Krogh A. The Anatomy and Physiology of Capillaries. Yale University Press; New Haven: 1922. [Google Scholar]
- 104.Kuo L, Pittman RN. Effect of hemodilution on oxygen transport in arteriolar networks of hamster striated muscle. Am J Physiol. 1988;254:H331. doi: 10.1152/ajpheart.1988.254.2.H331. [DOI] [PubMed] [Google Scholar]
- 105.Lagerlund TD, Low PA. A mathematical simulation of oxygen delivery in rat peripheral nerve. Microvasc Res. 1987;34:211. doi: 10.1016/0026-2862(87)90054-9. [DOI] [PubMed] [Google Scholar]
- 106.Leonard EF, Jorgensen SB. The analysis of convection and diffusion in capillary beds. Annu Rev Biophys Bioeng. 1974;3:293. doi: 10.1146/annurev.bb.03.060174.001453. [DOI] [PubMed] [Google Scholar]
- 107.Lin CC, Segel LA. Mathematics Applied to Deterministic Problems in the Natural Sciences. Macmilian; New York: 1974. [Google Scholar]
- 108.Lin SH. Oxygen diffusion in a spherical cell with nonlinear oxygen uptake kinetics. J Theor Biol. 1976;60:449. doi: 10.1016/0022-5193(76)90071-0. [DOI] [PubMed] [Google Scholar]
- 109.Lin SH. Oxygen tension in the in vivo cornea. Bull Math Biol. 1976;38:269. doi: 10.1007/BF02459559. [DOI] [PubMed] [Google Scholar]
- 110.Lin SH. Nonlinear diffusion in biological systems. Bull Math Biol. 1979;41:151. [Google Scholar]
- 111.Lomen DO, Gross JF. A mathematical model of the effect of oxygen consumption on the resistance to flow of sickle cell blood in capillaries. Math Biosci. 1977;37:63. [Google Scholar]
- 112.Longmuir IS. Channels of oxygen transport from blood to mitochondria. Adv Physiol Sci. 1980;25:19. [Google Scholar]
- 113.Lyabakh EG, Ivanov KP. Physiological regulation of oxygen transport in muscles (from results of mathematical analysis of experimental data) Proc Acad Sci USSR. 1979;248:1154. [PubMed] [Google Scholar]
- 114.Lyabakh EG. The significance of intercapillary distance for oxygen transport in muscle. Sechenov Physiol J USSR. 1980;65:1193. [Google Scholar]
- 115.Mahler M. Diffusion in an elliptical cylinder, and a numerical method for calculating time-varying diffusant sink rates, with special reference to diffusion of oxygen in the frog sartorius muscle. Math Biosci. 1985;73:109. [Google Scholar]
- 116.Mainwood GW, Rakusan K. A model for intracellular energy transport. Can J Physiol Pharmacol. 1982;60:98. doi: 10.1139/y82-016. [DOI] [PubMed] [Google Scholar]
- 117.Margaria R. A mathematical treatment of the blood dissociation curve for oxygen. Clin Chem. 1963;9:745. [PubMed] [Google Scholar]
- 118.Meldon JH. Blood-gas equilibria, kinetics and transport. Chem Eng Sci. 1987;42:199. [Google Scholar]
- 119.Merchuk JC, Tzur Z, Lightfoot EN. Diffusional resistances to oxygen transfer in whole blood. Chem Eng Sci. 1983;38:1315. [Google Scholar]
- 120.Metzger H. The influence of space-distributed parameters on the calculation of substrate and gas exchange in microvascular units. Math Biosci. 1976;30:31. [Google Scholar]
- 121.Middleman S. Transport Phenomena in the Cardiovascular System. John Wiley & Sons; New York: 1972. [Google Scholar]
- 122.Mochizuki M, Kagawa T. Numerical solution of partial differential equations describing the simultaneous O2 and CO2 diffusion in the red blood cells. Jpn J Physiol. 1986;36:43. doi: 10.2170/jjphysiol.36.43. [DOI] [PubMed] [Google Scholar]
- 123.Moll W. The influence of hemoglobin diffusion on oxygen uptake and release by red cells. Respir Physiol. 1969;6:1. doi: 10.1016/0034-5687(68)90014-5. [DOI] [PubMed] [Google Scholar]
- 124.Mueller-Klieser W. Method for the determination of oxygen consumption rates and diffusion coefficients in multicellular spheroids. Biophys J. 1984;46:343. doi: 10.1016/S0006-3495(84)84030-8. [DOI] [PMC free article] [PubMed] [Google Scholar]
- 125.Nair PK, Buerk DG, Whalen WJ. Cat carotid body oxygen metabolism and chemoreception described by a two-cytochrome model. Am J Physiol. 1986;250:H202. doi: 10.1152/ajpheart.1986.250.2.H202. [DOI] [PubMed] [Google Scholar]
- 126.Napper SA, Schubert RW. Mathematical evidence for flow-induced changes in myocardial oxygen consumption. Ann Biomed Eng. 1988;16:349. doi: 10.1007/BF02364623. [DOI] [PubMed] [Google Scholar]
- 127.Niimi H, Sugihara M, Yamakawa T. Hemorheological factors of oxygen transfer in capillary tissue unit. Biorheology. 1983;20:603. doi: 10.3233/bir-1983-20517. [DOI] [PubMed] [Google Scholar]
- 128.Niimi H, Sugihara M. Hemorheological approach to oxygen transport between blood and tissue. Biorheology. 1984;21:445. doi: 10.3233/bir-1984-21405. [DOI] [PubMed] [Google Scholar]
- 129.Ohta I, Ohta A, Shibata M, Kamiya A. Oxygen transport to tissue during recurrent blood flow supply by grouped capillaries in skeletal muscle with or without facilitated diffusion. Adv Exp Med Biol. 1988;222:105. doi: 10.1007/978-1-4615-9510-6_12. [DOI] [PubMed] [Google Scholar]
- 130.Opitz E, Schneider M. Uber die Sauerstoffversorgung des Gehirns und den Mechanismus von Mangelwirkungen. Erg Physiol. 1950;46:126. [Google Scholar]
- 131.Piiper J, Meyer M, Scheid P. Dual role of diffusion in tissue gas exchange: blood-tissue equilibration and diffusion shunt. Respir Physiol. 1984;56:131. doi: 10.1016/0034-5687(84)90099-9. [DOI] [PubMed] [Google Scholar]
- 132.Piiper J, Scheid P. Cross-sectional PO2 distributions in Krogh cylinder and solid cylinder models. Respir Physiol. 1986;64:241. doi: 10.1016/0034-5687(86)90118-0. [DOI] [PubMed] [Google Scholar]
- 133.Pittman RN. Oxygen delivery and transport in the microcirculation. In: McDonagh PF, editor. Microvascular Perfusion and Transport in Health and Disease. Karger; Basel: 1978. p. 60. [Google Scholar]
- 134.Popel AS. Analysis of capillary-tissue diffusion in multicapillary systems. Math Biosci. 1978;39:187. doi: 10.1016/0025-5564(78)90053-6. [DOI] [PMC free article] [PubMed] [Google Scholar]
- 135.Popel AS, Gross JF. Analysis of oxygen diffusion from arteriolar networks. Am J Physiol. 1979;237:H681. doi: 10.1152/ajpheart.1979.237.6.H681. [DOI] [PubMed] [Google Scholar]
- 136.Popel AS. Diffusion in tissue slices with metabolism obeying Michaelis-Menten kinetics. J Theor Biol. 1979;80:325. doi: 10.1016/0022-5193(79)90097-3. [DOI] [PubMed] [Google Scholar]
- 137.Popel AS. Mathematical modeling of convective and diffusive transport in the microcirculation. In: Gross JF, Popel AS, editors. Mathematics of Microcirculation Phenomena. Raven Press; New York: 1980. p. 63. [Google Scholar]
- 138.Popel AS. Oxygen diffusion from capillary layers with concurrent flow. Math Biosci. 1980;50:171. doi: 10.1016/0025-5564(80)90035-8. [DOI] [PMC free article] [PubMed] [Google Scholar]
- 139.Popel AS. Mathematical modeling of oxygen transport near a tissue surface: effect of the surface PO2. Math Biosci. 1981;55:231. doi: 10.1016/0025-5564(81)90097-3. [DOI] [PMC free article] [PubMed] [Google Scholar]
- 140.Popel AS. Oxygen diffusive shunts under conditions of hetergeneous oxygen delivery. J Theor Biol. 1982;96:533. doi: 10.1016/0022-5193(82)90229-6. [DOI] [PubMed] [Google Scholar]
- 141.Popel AS, Charny CK, Dvinsky AS. Effect of heterogeneous oxygen delivery on the oxygen distribution in skeletal muscle. Math Biosci. 1986;81:91. doi: 10.1016/0025-5564(86)90164-1. [DOI] [PMC free article] [PubMed] [Google Scholar]
- 142.Popel AS, Pittman RN, Ellsworth ML, Weerappuli DPV. Measurements of oxygen flux from arterioles imply high permeability of perfused tissue to oxygen. Adv Exp Med Biol. 1989;247:215. doi: 10.1007/978-1-4684-5643-1_26. [DOI] [PubMed] [Google Scholar]
- 143.Rakusan K. Oxygen in the Heart Muscle. Charles C Thomas; Springfield, IL: 1971. [Google Scholar]
- 144.Rakusan K, Hoofd L, Turek Z. The effect of cell size and capillary spacing on myocardial oxygen supply. Adv Exp Med Biol. 1984;180:463. doi: 10.1007/978-1-4684-4895-5_44. [DOI] [PubMed] [Google Scholar]
- 145.Reneau DD, Jr, Bruley DF, Knisely MH. A mathematical simulation of oxygen release, diffusion, and consumption in the capillaries and tissue of the human brain. In: Hershey D, editor. Chemical Engineering in Medicine and Biology. Plenum Press; New York: 1967. p. 135. [Google Scholar]
- 146.Reneau DD, Jr, Bruley DF, Knisely MH. A digital simulation of transient oxygen transport in capillary-tissue systems (cerebral gray matter). Development of a numerical method for solution of transport equations describing coupled convection-diffusion systems. AlChE J. 1969;15:916. [Google Scholar]
- 147.Roth AC, Wade K. The effect of transmural transport in the microcirculation: a two gas species model. Microvasc Res. 1986;32:64. doi: 10.1016/0026-2862(86)90044-0. [DOI] [PubMed] [Google Scholar]
- 148.Roughton FJW. Diffusion and chemical reaction velocity as joint factors in determining the rate of uptake of oxygen and carbon monoxide by the red blood cell corpuscle. Proc R Soc London. 1932;B111:1. [Google Scholar]
- 149.Roughton FJW, Forster RE. Relative importance of diffusion and chemical reaction rates in determining rate of exchange of gases in the human lung, with special reference to true diffusing capacity of pulmonary membrane and volume of blood in the lung capillaries. J Appl Physiol. 1957;11:290. doi: 10.1152/jappl.1957.11.2.290. [DOI] [PubMed] [Google Scholar]
- 150.Salathe EP, Wang TC, Gross JF. Mathematical analysis of oxygen transport to tissue. Math Biosci. 1980;51:89. [Google Scholar]
- 151.Salathe EP, Fayad R, Schaffer SW. Mathematical analysis of carbon dioxide transport by blood. Math Biosci. 1981;57:109. [Google Scholar]
- 152.Salathe EP. Mathematical modeling of oxygen transport in skeletal muscle. Math Biosci. 1982;58:171. [Google Scholar]
- 153.Salathe EP, Wang TC. The development of anoxia following occlusion. Bull Math Biol. 1982;44:851. doi: 10.1007/BF02465185. [DOI] [PubMed] [Google Scholar]
- 154.Salathe EP, Kolkka RW. Reduction of anoxia through myoglobin-facilitated diffusion of oxygen. Biophys J. 1986;50:885. doi: 10.1016/S0006-3495(86)83529-9. [DOI] [PMC free article] [PubMed] [Google Scholar]
- 155.Schneiderman G, Goldstick TK. Carbon monoxide-induced arterial wall hypoxia and atherosclerosis. Atherosclerosis. 1978;30:1. doi: 10.1016/0021-9150(78)90148-x. [DOI] [PubMed] [Google Scholar]
- 156.Schneiderman G, Goldstick TK. Significance of luminal plasma layer resistance in arterial wall oxygen supply. Atherosclerosis. 1978;31:11. doi: 10.1016/0021-9150(78)90032-1. [DOI] [PubMed] [Google Scholar]
- 157.Schneiderman G, Ellis CG, Goldstick TK. Mass transport to walls of stenosed arteries: variation with Reynolds number and blood flow separation. J Biomech. 1979;12:869. doi: 10.1016/0021-9290(79)90172-6. [DOI] [PubMed] [Google Scholar]
- 158.Schneiderman G, Mockros LF, Goldstick TK. Effect of pulsatility on oxygen transport to the human arterial wall. J Biomech. 1982;15:849. doi: 10.1016/0021-9290(82)90050-1. [DOI] [PubMed] [Google Scholar]
- 159.Schultz JS, Goddard JD, Suchdeo SR. Facilitated transport via carrier-mediated diffusion in membranes. I Mechanistic aspects, experimental systems and characteristic regimes. AIChE J. 1974;20:417. [Google Scholar]
- 160.Secomb TW, Hsu R. Analysis of oxygen delivery to tissue by microvascular networks. Adv Exp Med Biol. 1988;222:95. doi: 10.1007/978-1-4615-9510-6_11. [DOI] [PubMed] [Google Scholar]
- 161.Severinghaus JW. Simple, accurate equations for human blood O2 dissociation computations. J Appl Physiol. 1979;46:599. doi: 10.1152/jappl.1979.46.3.599. [DOI] [PubMed] [Google Scholar]
- 162.Sharan M, Singh MP. Numerical simulation of pulmonary O2, and CO2 exchange. Int J Bio-Med Comput. 1985;16:59. doi: 10.1016/0020-7101(85)90045-5. [DOI] [PubMed] [Google Scholar]
- 163.Sharan M, Aminataei A, Singh MP. The process of gas exchange in the pulmonary circulation incorporating the contribution of axial diffusion. Int J Bio-Med Comput. 1987;20:191. doi: 10.1016/0020-7101(87)90029-8. [DOI] [PubMed] [Google Scholar]
- 164.Sharan M, Aminataei A, Singh MP. A numerical study of the nonsteady transport of gases in the pulmonary capillaries. J Math Biol. 1987;25:433. doi: 10.1007/BF00277167. [DOI] [PubMed] [Google Scholar]
- 165.Sharan M, Singh MP, Aminataei A. A numerical model for blood oxygenation in the pulmonary capillaries — effect of pulmonary membrane resistance. BioSystems. 1987;20:355. doi: 10.1016/0303-2647(87)90053-0. [DOI] [PubMed] [Google Scholar]
- 166.Sharan M, Popel AS. A mathematical model of countercurrent exchange of oxygen between paired arterioles and venules. Math Biosci. 1988;91:17. doi: 10.1016/0025-5564(88)90022-3. [DOI] [PMC free article] [PubMed] [Google Scholar]
- 167.Sharan M, Jones MD, Jr, Koehler RC, Traystman RJ, Popel AS. A compartmental model for oxygen transport in brain microcirculation. Ann Biomed Eng. 1989;17:13. doi: 10.1007/BF02364271. [DOI] [PubMed] [Google Scholar]
- 168.Sharikov AN, Zaiko VM. About the importance of account of some microcirculation parameters dispersion in modeling oxygen transport. Biorheology. 1982;19:331. doi: 10.3233/bir-1982-191-235. [DOI] [PubMed] [Google Scholar]
- 169.Sheth BV, Hellums JD. Transient oxygen transport in hemoglobin layers under conditions of the microcirculation. Ann Biomed Eng. 1980;8:183. doi: 10.1007/BF02364475. [DOI] [PubMed] [Google Scholar]
- 170.Siggaard-Andersen O, Wimberley PD, Göthgen I, Siggaard-Andersen M. A mathematical model of the hemoglobin-oxygen dissociation curve of human blood and of the oxygen partial pressure as a function of temperature. Clin Chem. 1984;30:1646. [PubMed] [Google Scholar]
- 171.Singh MP, Khetarpal K, Sharan M. A theoretical model for studying the rate of oxygenation of blood in pulmonary capillaries. J Math Biol. 1980;9:305. doi: 10.1007/BF00276496. [DOI] [PubMed] [Google Scholar]
- 172.Spaeth EE. Blood oxygenation in extracorporeal devices: theoretical considerations. CRC Crit Rev Biomed Eng. 1973;1:383. [PubMed] [Google Scholar]
- 173.Spencer JL, Firouztale E, Mellins RB. Computational expressions for blood oxygen and carbon dioxide concentrations. Ann Biomed Eng. 1979;7:59. doi: 10.1007/BF02364439. [DOI] [PubMed] [Google Scholar]
- 174.Stroeve P. Diffusion with irreversible chemical reaction in heterogeneous media: application to oxygen transport in respiring tissue. J Theor Biol. 1977;64:237. doi: 10.1016/0022-5193(77)90354-x. [DOI] [PubMed] [Google Scholar]
- 175.Stroeve P. Myoglobin-facilitated oxygen transport in heterogeneous red muscle tissue. Ann Biomed Eng. 1982;10:49. doi: 10.1007/BF02366998. [DOI] [PubMed] [Google Scholar]
- 176.Tai RC, Chang HK. Oxygen transport in heterogeneous tissue. J Theor Biol. 1974;43:265. doi: 10.1016/s0022-5193(74)80059-7. [DOI] [PubMed] [Google Scholar]
- 177.Thews G. Die Sauerstoffdiffusion im Gehirn. Ein Beitrag lur Frage der Sauerstroffversorgung der Organe. Pflugers Arch. 1960;271:197. [Google Scholar]
- 178.Traystman RJ. Microcirculation of the brain. In: Mortillaro NA, editor. The Physiology and Pharmacology of the Microcirculation. Vol. 1. Academic Press; New York: 1984. p. 237. [Google Scholar]
- 179.Ulanowicz RE, Frazier GC., Jr The transport of oxygen and carbon dioxide in hemoglobin systems. Math Biosci. 1970;7:111. [Google Scholar]
- 180.Vandegriff KD, Olson JS. Morphological and physiological factors affecting oxygen uptake and release by red blood cells. J Biol Chem. 1984;259:12619. [PubMed] [Google Scholar]
- 181.Vandegriff KD, Olson JS. A quantitative description in three dimensions of oxygen uptake by human red blood cells. Biophys J. 1984;45:825. doi: 10.1016/S0006-3495(84)84226-5. [DOI] [PMC free article] [PubMed] [Google Scholar]
- 182.Vandegriff KD, Olson JS. The kinetics of O2 release by human red blood cells in the presence of external sodium dithionite. J Biol Chem. 1984;259:12609. [PubMed] [Google Scholar]
- 183.Vayo MM, Lipowsky HH, Karp N, Schmalzer E, Chien S. A model of microvascular oxygen transport in sickle cell disease. Microvasc Res. 1985;30:195. doi: 10.1016/0026-2862(85)90050-0. [DOI] [PubMed] [Google Scholar]
- 184.Venkataraman K, Wang T, Stroeve P. Oxygen diffusion into heterogeneous tissue with combined oxygen consumption kinetics. Ann Biomed Eng. 1980;8:17. doi: 10.1007/BF02363168. [DOI] [PubMed] [Google Scholar]
- 185.Weerappuli DPV, Popel AS. A model of oxygen exchange between an arteriole or venule and the surrounding tissue. J Biomech Eng. 1989;111:24. doi: 10.1115/1.3168335. [DOI] [PubMed] [Google Scholar]
- 186.Weibel ER. The Pathway for Oxygen Structure and Function in the Mammalian Respiratory System. Harvard University Press; Cambridge, MA: 1984. [Google Scholar]
- 187.Weingarden M, Mizukami H, Rice SA. Transient effects on the initial rate of oxygenation of red blood cells. Bull Math Biol. 1982;44:119. doi: 10.1007/BF02459423. [DOI] [PubMed] [Google Scholar]
- 188.Weingarden M, Mizukami H, Rice SA. Factors defining the rate of oxygen uptake by the red blood cell. Bull Math Biol. 1982;44:135. doi: 10.1007/BF02459424. [DOI] [PubMed] [Google Scholar]
- 189.Wiedeman M. Architecture. In: Renkin EM, Michel CC, editors. Handbook of Physiology, Section 2, Vol. 4, Microcirculation. I. Am. Physiol. Soc; Bethesda: 1984. p. 11. [Google Scholar]
- 190.Wieringa P. PhD Dissertation. Technical University of Delft; Delft: 1985. The Influence of the Coronary Capillary Network on the Distribution and Control of Local Blood Flow. [Google Scholar]
- 191.Williford CW, Bruley DF, Artigue RS. Probabilistic modeling of oxygen transport in brain tissue. Neurol Res. 1980;2:153. doi: 10.1080/01616412.1980.11739577. [DOI] [PubMed] [Google Scholar]
- 192.Wilson TA. Capillary spacing for minimum entropy production. J Theor Biol. 1966;11:436. doi: 10.1016/0022-5193(66)90103-2. [DOI] [PubMed] [Google Scholar]
- 193.Winslow RM, Samaja M, Winslow NJ, Rossi-Bernardi L, Shrager RI. Simulation of continuous blood O2 equilibrium curve over physiological pH, DPG and PCO2 range. J Appl Physiol. 1983;54:524. doi: 10.1152/jappl.1983.54.2.524. [DOI] [PubMed] [Google Scholar]
- 194.Wittenberg JB. Myoglobin-facilitated oxygen diffusion: role of myoglobin in oxygen entry into muscle. Physiol Rev. 1970;50:559. doi: 10.1152/physrev.1970.50.4.559. [DOI] [PubMed] [Google Scholar]
- 195.Yap EW, Hellums JD. Use of Adair four-step kinetics in mathematical simulation of oxygen transport in the microcirculation. Adv Exp Med Biol. 1987;215:193. doi: 10.1007/978-1-4684-7433-6_22. [DOI] [PubMed] [Google Scholar]
- 196.Zydney AL, Colton CK. Augmented solute transport in the shear flow of a concentrated suspension. PhysicoChem Hydrodynamics. 1988;10:77. [Google Scholar]


