

Abstract
Response to prescribed analgesic drugs varies between individuals, and choosing the right drug/dose often involves a lengthy, iterative process of trial and error. Furthermore, a significant portion of patients experience adverse events such as post-operative urinary retention (POUR) during inpatient management of acute postoperative pain.
To better forecast analgesic responses, we compared conventional machine learning methods with modern neural network architectures to gauge their effectiveness at forecasting temporal patterns of postoperative pain and analgesic use, as well as predicting the risk of POUR. Our results indicate that simpler machine learning approaches might offer superior results; however, all of these techniques may play a promising role for developing smarter post-operative pain management strategies.
I. Introduction
Worldwide over 100 million people undergo surgery each year, and over 60% of these patients will suffer from uncontrolled postoperative pain [1]. Apart from the imparted suffering, poor management of postoperative pain can lead to a host of postoperative complications ranging from urinary retention, nausea, and vomiting to addiction, respiratory insufficiency and even cardiovascular collapse. Inadequate postoperative pain management stems from a range of factors, but chief amongst them is a lack of an analytical mechanism for matching patient-specific predictions and observations on postoperative pain with optimal analgesic selection to prevent or satisfactorily ameliorate the anticipated suffering and complications [2]. Modern “deep learning” research has demonstrated the power of neural networks to solve many real-world problems [3]. They may also offer a new perspective into surgerys most primordial limitation by forecasting pain, analgesic requirements and the consequences.
Neural networks are a class of biologically-inspired artificial intelligence techniques that attempt to algorithmically model our current understanding of neurons. A linear combination of inputs is passed through a nonlinear activation function in a single layer, and this can be repeated using multiple layers until terminating at a loss function. Parameters are trained via gradient descent and differentiation using the chain rule from calculus, a procedure called “backpropagation”.
Neural network architectures are attractive because they demonstrate an ability to learn salient features of the data on their own as well as solve very complex problems. We explored two neural network architectures to gauge their effectiveness at addressing some issues relevant to postoperative pain management, namely, assessing the risk of Post-operative urinary retention (POUR) and pain prediction.
POUR is a common occurrence after anesthesia [4]. To assess the risk of POUR, we built a classification neural network, called a multi-layer perceptron (MLP), which relies on stacked neural network layers and outputs a probability estimate for risk of complication. While MLP’s have been around for many years, we utilized modern strategies to improve the MLP-regularization, which sets an upper limit on neuron weight vector norms similar to ridge regression [5], and helps prevent overfitting; dropout layers, which randomly discard neural units and their connections and also help to prevent overfitting; and rectified linear unit (ReLU) activation functions, which improve training effectiveness [3].
The Long Short-Term Memory (LSTM) architecture is a type of recurrent neural network used to model sequences and forecast future values [6]. It utilizes embedded gates, which operate using piecewise multiplication of input and output data with vectors containing parameters that either magnify or diminish data to retain useful information while discarding noise (Fig. 1). This has been shown to alleviate many of the challenges faced with sequence modeling. We applied the LSTM to predict what the next measured pain score will be after administration of an analgesic drug, and compared the results with simpler techniques. Our objective was to compare the performance of conventional vs. state of the art machine learning techniques in predicting pain response.
Fig. 1.
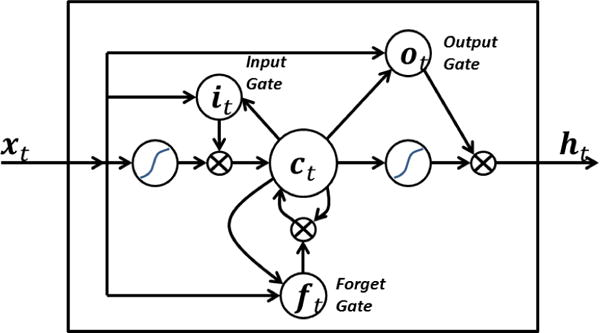
LSTM neural network architecture. Input, output, and forget gates magnify or discard incoming data vector elements using piecewise multiplication. Reprinted from “Long short term memory,” by BiObserver.1
II. Related Work
Previous work in predicting POUR risk has focused on identifying risk factors in isolation [4]. Major indicators include age, gender, and type of surgery. To our knowledge this is the first study which examined the capability of machine learning techniques to predict POUR across a wide range of variables.
Most efforts to forecast pain focus on long-term trajectories and daily trends [7] [8]. Tighe et al. used Markov decision processes to model pain transition states [9]. Intraday fluctuations and short-term analgesic response remains an open area of research, one in which machine learning may play an important role.
In our classification task (POUR prediction), we utilized temporal features derived from pain score sequences using a time series discretization technique called Symbolic Aggregate Approximation (SAX) [10]. A sliding window is placed at the start of the time series and moved stepwise to the end. At each step, window values are averaged (Piecewise Aggregate Approximation, or PAA, which is a technique known as dimensionality reduction [10]), and that average value is assigned one of a fixed-size domain of alphabet letters that indicate the aggregate intensity (e.g. in a domain of 5 SAX letters, “A” indicates that the window’s time series values are very low, “C” indicates moderate intensity, and “E” indicates the upper range of possible values). We used a similar strategy to Ordóñez et al. who vectorized SAX letter transitions for classification purposes [11].
III. Methods
A. Predicting POUR
Our goal is to predict the risk of POUR based on patient and surgical characteristics. Patients were split into classes of equal size – one group containing patients who experienced POUR and the other having no complications.
We extracted 200 features for each patient in the electronic medical records (EMR) data. Basic features included patient age, gender, Chalson comorbidity index, body mass index (BMI), ethnicity, and International Classification of Diseases 9th edition (ICD9) code class. Pain score proportions were included, calculated as the quantity of individual pain scores divided by the total number of pain scores collected for the patient. Patient pain scores were linearly interpolated to 10-minute intervals, then reduced in dimensionality using PAA with a window width of 60 minutes, and finally discretized using a 5-letter SAX domain. A sliding window extracted the frequency of each two-letter score transitions (AA, AB, CC, etc), and these counts were included as features [11]. Another class of features included was analgesic medication administration, calculated as the sum dosage of each unique medication name and administration method (intravenous, oral tablet, etc.) given during recovery. Mobility records for each patient were calculated as counts of patient activity recorded by hospital staff, including bed-rest, chair, ambulate in room, etc.; range-of-motion indicators included passive, active, right/left arm, etc.; indicators which measured level of assistance needed by the patient as well as devices used for assistance and factors contributing to mobility impairment; and anti-embolism device usage indicators (antiembolism stockings, sequential compression device, etc) were counted and included as features as well. Categorical feature values (e.g. gender, ethnicity) were binarized so that each unique category was a unique feature set to one or zero.
The data were split into training, validation, and test sets using a 60:20:20 ratio. From the training set, we determined the most discriminative features using a random forest and sorted the features by descending importance [12]. We evaluated logistic regression and support vector machine (SVM) classifiers [5] for each subset of top-k features and simultaneously optimized the C regularization parameters for both types of models. Models were fit to the training set, and the parameter values and feature subsets were selected which corresponded to the highest validation set accuracy. Performance was evaluated as the accuracy achieved on the test set by the chosen model. The scikit-learn python library was utilized for the logistic regression and SVM classifiers.
We utilized a multilayer perceptron (MLP) neural network architecture, which consisted of three hidden layers terminating at an output layer with softmax activation. Each hidden layer was a 32-node fully-connected layer with a L2 weight regularizer of 0.0001. Hidden layers utilized tanh activation functions and passed through a dropout layer with 50% dropout probability. This architecture was chosen using the same training-validation sets described in the previous paragraph. The network was trained for 10 rounds, and performance was evaluated as the accuracy achieved on the test set. The Keras deep learning python library was used for neural network development.
Given that current approaches to POUR identification do not necessarily include time stamps associated with each incident, it was not feasible to reliably specify when complications occurred for the purposes of excluding data collected after the incident. In an effort to correct this, we trained and evaluated seven instances of the models, each containing data recorded up to a given post-operative day (data from day one, days one and two, days one through three, etc.), and measured prediction accuracy at each trial to determine whether accuracy was affected by the collection of more data. We also trained and evaluated the models using all of the data as a comparative baseline.
B. Forecasting Pain Levels
The second goal in this experiment was to train a neural network on pain levels preceding analgesic administration, and associate those patterns with subsequent pain levels so that the model can forecast the anticipated reduction in pain following administration. To simplify the model for the purposes of developing a proof of concept, we limited evaluation to those instances in which 10 mg oxycodone was given orally, since this was the most common analgesic administration event in the data set, and represented a simpler mechanistic model for initial experimentation.
As Fig. 2 shows, and in keeping with the known pharmacokinetic profile of oral oxycodone, pain scores tended to stabilize approximately 50–60 minutes after drug administration on average; therefore, our strategy was to give the network sequences of 100 interpolated pain score values prior to drug administration (i.e. 500 minutes worth of interpolated scores; we refer to these as “lead-up sequences”) as input and the first score measured between 40 and 120 minutes afterwards as output.
Fig. 2.
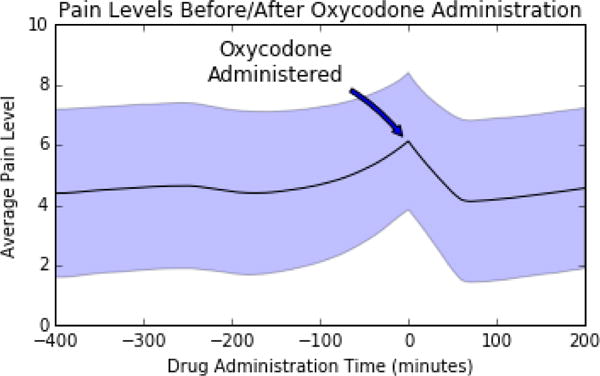
Average pain scores leading up to and following the oral administration of 10 mg oxycodone, with shaded region indicating one standard deviation confidence interval.
Our network architecture was one in which two divergent paths reconverge before the objective function. In one path, lead-up sequences were given as-is to an LSTM [6] (every LSTM in our network consisted of 256 memory cells), which was connected to another LSTM through an intermediary 50% dropout layer, and finally passed through a Rectified Linear Unit (ReLU) activation function [3]. The other path consisted of similar steps, but lead-up sequences were first reversed (this step has been shown to perform favorably in sequence translation [13]). The outputs from these two paths were merged into a single 50% dropout layer and finally combined into a dense layer with a ReLU activation function which returned a forecasting prediction.
One third of the data was set aside for testing, and the remaining two-thirds were split into 75% training and 25% validation to choose the network architecture. Performance was evaluated as the mean squared error (MSE) between the predicted and observed post-administration score. The network was trained for 10 rounds.
We compared neural network performance to a baseline solution, defined as selecting an interpolated score shortly before drug administration and subtracting a value. We also evaluated an Elastic Net regression model (linear regression with both L1 and L2 regularization) and support vector regression (SVR). Parameters for all models were selected by minimizing MSE and utilized the same train-validation-test split as the neural network.
IV. Experiments
A. Description of the Data
This was a retrospective study, approved by the University of Florida Institutional Review Board and conducted in accordance with the STROBE guidelines. surgical case data were obtained from the University of Florida’s integrated data repository. subjects included patients who underwent non-ambulatory/non-obstetric surgery at Shands Medical Center at the University of Florida between May 1, 2011 and March 31, 2014, totaling 26,090 records. All pain scores were documented by clinical staff and encoded on a scale ranging from 0 (no pain) to 10 (unbearable pain).
B. Results
There was no significant trend in test accuracy between the SVM and logistic regression models truncated after any postoperative day; however, there was a mild increase in accuracy with the MLP model. Table I lists the accuracies achieved by each of the models trained on all of the data (i.e. not truncated on any postoperative day). The SVM model was the top performer. The top ten features are enumerated in Table II. The feature importance column lists relative predictive power of the features as determined by the random forest. The No POUR Average Value and Complication Average Value columns give average feature values between the groups that did not and did experience POUR, respectively (note that, in the case of categorical data, these values correspond to proportions, since the binarized features were assigned values of one or zero). P-values are listed for testing the null hypothesis that feature values between the POUR and No POUR groups came from the same population, as determined by a two-tailed Mann-Whitney U test.
TABLE I.
POUR prediction accuracy by model.
| Model | # Features | Test Accuracy |
|---|---|---|
| SVM | 34 | 66.0% |
| Logistic Regression | 22 | 64.2% |
| Neural Network | 200 | 61.8% |
TABLE II.
POUR Top Predictive Features
| Feature | Feature Importance | No POUR Average Value | POUR Average Value | p-value |
|---|---|---|---|---|
| Age | 0.125 | 56.62 | 63.76 | 1.888 × 10⁻²⁶ |
| Earliest BMI | 0.091 | 29.05 | 28.18 | 4.479 × 10−04 |
| Modified Charlson | 0.066 | 1.60 | 1.94 | 1.062 × 10−05 |
| ICD-9 Class: Injury and Poisoning | 0.013 | 0.16 | 0.21 | 2.438 × 10−02 |
| Gender: Male | 0.012 | 0.48 | 0.63 | 2.499 × 10⁻¹² |
| Gender: Female | 0.012 | 0.52 | 0.37 | 2.499 × 10⁻¹² |
| Race: White | 0.012 | 0.73 | 0.78 | 4.525 × 10−02 |
| Race: Black | 0.012 | 0.17 | 0.11 | 5.322 × 10−03 |
| Pain Motif Count: BA | 0.012 | 0.72 | 1.33 | 6.792 × 10⁻¹⁷ |
| Pain Motif Count: AA | 0.011 | 8.65 | 15.93 | 5.591 × 10⁻¹³ |
Table III lists the performance of the forecasting models and includes the MSE and Pearson correlation coefficient between predicted and observed scores. Elastic Net was found to be superior relative to the other models. The optimal baseline solution was determined to be the interpolated score 15 minutes prior to drug administration, minus 1.8.
TABLE III.
Pain response to analgesic model performance
| Model | MSE | Correlation Coefficient |
|---|---|---|
| Neural Network | 5.54 | 0.604 |
| Elastic Net | 4.96 | 0.606 |
| SVR | 5.14 | 0.593 |
| Baseline Solution | 6.09 | 0.545 |
V. Conclusions and Future Work
We explored the use of various neural network architectures and other machine learning approaches to address some challenges faced in anesthesiology, specifically forecasting patient pain response to analgesic and predicting postoperative urinary retention.
Our findings in predicting POUR corroborate previous work relating patient characteristics to post-operative urinary retention risk [4]. We further demonstrated that the combination of these indicators and usage of machine learning classifiers allows for more a powerful prediction.
A drawback of our efforts was that the electronic medical records system did not have a timestamp attached to POUR incidence; thus, it was difficult to determine which features were influenced by the accumulation of more data. We addressed this issue by incrementally truncating data after later postoperative days and retraining the models on increasing amounts of data. While there was no trend in accuracy as affected by the inclusion of more or less data in the SVM and logistic regression models, there was a mild increase in accuracy with the MLP model over time. However, the most important features (determined by the random forest) were set on patient intake and did not change over time (see table Table II). Future efforts will involve improving data acquisition efforts in an attempt to determine exactly when a complication occurred and utilize only that data leading up to the incident.
To forecast pain levels after the administration of a specific pain medication (10 mg oral oxycodone), we constructed a neural network based on the Long Short-Term Memory (LSTM) architecture and trained it on pain score patterns. The neural network was compared with Elastic Net regression, support vector regression (SVR), and a baseline solution. The Elastic Net model was found to be the top performer; however, we suspect that training the LSTM with other vital signs collected alongside pain scores will improve results, since recurrent neural networks have been shown to learn interdependencies and patterns between multiple concurrent time series. At the time of our analysis, however, our data set was limited to post-operative pain scores and thus the network only had information on scores before and after drug administration.
While preliminary, our results show promise for researchers seeking to improve postoperative pain management with intelligent systems. With more descriptive record collection and the inclusion of more temporal data (e.g. other vital signs), these results will likely improve. Other strategies from modern deep learning research may further increase predictive ability. Our experiments demonstrate that these machine learning techniques may offer much benefit for developing smarter postoperative pain management strategies.
Acknowledgments
This work was supported by grants R01 GM114290 and K23 GM102697.
Footnotes
Online at https://commons.wikimedia.org/wiki/ File:Long Short Term Memory.png (2016, feb)
References
- 1.Apfelbaum JL, Chen C, Mehta SS, Gan TJ. Postoperative pain experience: results from a national survey suggest postoperative pain continues to be undermanaged. Anesthesia & Analgesia. 2003;97(2):534–540. doi: 10.1213/01.ANE.0000068822.10113.9E. [DOI] [PubMed] [Google Scholar]
- 2.Tighe P, Buckenmaier CC, Boezaart AP, Carr DB, Clark LL, Herring AA, Kent M, Mackey S, Mariano ER, Polomano RC, et al. Acute pain medicine in the united states: A status report. Pain Medicine. 2015;16(9):1806–1826. doi: 10.1111/pme.12760. [DOI] [PMC free article] [PubMed] [Google Scholar]
- 3.Bengio Y, Goodfellow IJ, Courville A. Deep learning. 2015 book in preparation for MIT Press. [Google Scholar]
- 4.Baldini G, Bagry H, Aprikian A, Carli F. Postoperative urinary retention anesthetic and perioperative considerations. The Journal of the American Society of Anesthesiologists. 2009;110(5):1139–1157. doi: 10.1097/ALN.0b013e31819f7aea. [DOI] [PubMed] [Google Scholar]
- 5.Bishop CM. Pattern Recognition and Machine Learning (Information Science and Statistics) Secaucus, NJ, USA: Springer-Verlag New York, Inc; 2006. [Google Scholar]
- 6.Hochreiter S, Schmidhuber J. Long short-term memory. Neural computation. 1997;9(8):1735–1780. doi: 10.1162/neco.1997.9.8.1735. [DOI] [PubMed] [Google Scholar]
- 7.Lavandhomme PM, Grosu I, France M-N, Thienpont E. Pain trajectories identify patients at risk of persistent pain after knee arthroplasty: an observational study. Clinical Orthopaedics and Related Research®. 2014;472(5):1409–1415. doi: 10.1007/s11999-013-3389-5. [DOI] [PMC free article] [PubMed] [Google Scholar]
- 8.Chapman CR, Zaslansky R, Donaldson GW, Shinfeld A. Postoperative pain trajectories in cardiac surgery patients. Pain research and treatment. 2012;2012 doi: 10.1155/2012/608359. [DOI] [PMC free article] [PubMed] [Google Scholar]
- 9.Tighe PJ, Bzdega M, Fillingim RB, Rashidi P, Aytug H. Markov chain evaluation of acute postoperative pain transition states. Pain. 2015 doi: 10.1097/j.pain.0000000000000429. [DOI] [PMC free article] [PubMed] [Google Scholar]
- 10.Lin J, Keogh E, Lonardi S, Chiu B. A symbolic representation of time series, with implications for streaming algorithms. Proceedings of the 8th ACM SIGMOD workshop on Research issues in data mining and knowledge discovery ACM. 2003:2–11. [Google Scholar]
- 11.Ordonez P, Armstrong T, Oates T, Fackler J. Using modified multivariate bag-of-words models to classify physiological data. Data Mining Workshops (ICDMW), 2011 IEEE 11th International Conference on IEEE. 2011:534–539. [Google Scholar]
- 12.Geurts P, Ernst D, Wehenkel L. Extremely randomized trees. Machine learning. 2006;63(1):3–42. [Google Scholar]
- 13.Sutskever I, Vinyals O, Le QV. Sequence to sequence learning with neural networks. Advances in neural information processing systems. 2014:3104–3112. [Google Scholar]