

Abstract
Using a special-purpose module implemented in the Health and Retirement Study, we evaluate financial sophistication in the American population over the age of 50. We combine several financial literacy questions into an overall index to highlight which questions best capture financial sophistication and examine the sensitivity of financial literacy responses to framing effects. Results show that many older respondents are not financially sophisticated: they fail to grasp essential aspects of risk diversification, asset valuation, portfolio choice, and investment fees. Subgroups with notable deficits include women, the least educated, non-Whites, and those over age 75. In view of the fact that retirees increasingly must take on responsibility for their own retirement security, such meager levels of knowledge have potentially serious and negative implications.
Keywords: Financial knowledge, framing, gender differences, retirement security
Americans are increasingly likely to hold individual retirement accounts such as IRAs or 401(k) plans, have expensive mortgages, and take on personal debt; these factors imply that they will need to become financially sophisticated to be able to manage assets and debt sensibly over their lifetimes. Moreover, older individuals are also being asked to manage their money sensibly during retirement to ensure that their resources last a lifetime. Nevertheless, only half of those over the age of 50 in the United States surveyed in a special module of the 2004 Health and Retirement Study (HRS) could correctly answer two simple questions regarding inflation and compound interest. Only one-third correctly answered these two questions as well as a third question about risk diversification (Lusardi and Mitchell, 2008, 2011b). Low levels of financial sophistication are also evident for younger respondents in surveys including the Rand American Life Panel (ALP) and the Survey of Consumers (Hilgert, Hogarth and Beverly, 2003; Lusardi and Mitchell, 2009; Lusardi, Mitchell and Curto, 2010). Moreover, financial illiteracy is especially marked for specific subgroups including minorities and those with low income and education (Lusardi and Mitchell, 2007, 2008; Seligman, 2012). Such illiteracy can also have important financial consequences: for instance, those who are less financially literate are much less likely to plan for retirement (Lusardi and Mitchell, 2007, 2009, 2011a, 2011b); less likely to invest in stocks (Kimball and Shumway, 2006; van Rooij, Lusardi and Alessie, 2011; Yoong, 2011); use high-cost borrowing channels (Lusardi and Tufano, 2009a); default on risky mortgages (Gerardi, Goette, and Meier, 2013), and end up with little wealth close to retirement (Lusardi and Mitchell, 2007). Moreover, more financially sophisticated individuals are better able to determine which mutual funds have lower fees (Hastings and Tejeda-Ashton, 2008; Hastings and Mitchell, 2011), implying they will be better able to build up pension accumulations.
This paper analyzes new data from the HRS on financial sophistication among the older American population, focusing specifically on persons over the age of 50.1 While prior studies have examined simple measures of financial literacy, relatively little attention has been devoted to financial sophistication among pre-retirees and their older counterparts. Our research study is informative in three important ways. First, our findings can be used to help design financial education programs that can be more effective in fostering saving and informing investment choice. By examining knowledge about the behavior of the stock market, investment fees, and asset prices, explicit suggestions can be offered regarding topics that can usefully be covered in financial education programs. Second, our paper identifies which older population subgroups are most likely to be financially unsophisticated and thus potentially be most prone to poor financial decision-making. Third, we make a methodological contribution by examining alternative ways to combine answers to financial literacy questions into an overall index in order to help identify which particular questions are best at capturing financial sophistication. While some are starting to ask how to combine different financial literacy questions into a single index, our method offers a rigorous way to account for different levels of financial sophistication and weight questions according to their level of difficulty and informativeness.2
Prior Research
Much previous empirical research on older Americans’ financial literacy has found quite widespread knowledge shortfalls, drawing on evidence from a short 2004 HRS experimental module by Lusardi and Mitchell (2011b). These results were replicated among Early Baby Boomers who were also found to have low levels of numeracy and lack of knowledge of fundamental economic concepts such as interest compounding (Lusardi and Mitchell 2007). In addition, particular sub-groups of the population labor under even greater financial literacy deficits. For instance, women tend to score more poorly on financial literacy questions than men (Lusardi and Mitchell, 2008, 2011d; Seligman, 2012), and the least educated and low income are also less financially knowledgeable (Lusardi and Mitchell, 2007; Smith and Stewart, 2008; Seligman, 2012).
These results are troublesome given the increasing complexity of financial instruments and the many transactions older households must undertake that require sound economic understanding. For instance, Moore (2003) reported that mortgage borrowers in Washington State knew little about compound interest and were confused about the terms of their mortgages. Campbell (2006) found that many households failed to refinance their mortgages over the 2001–2003 period when interest rates fell. Furthermore, financial illiteracy can have significant long-term financial consequences. For example, those who underestimate the power of interest compounding are more likely to end up with excessive debt (Lusardi, 2009; Lusardi and Tufano, 2009a). Homeowners who fail to refinance or to correctly estimate the amount by which interest rates might change will pay significantly more in mortgage interest (Campbell, 2006).3
The “3 big” HRS experimental module questions we asked in 2004 have now been used very successfully to explore the links between financial literacy and retirement planning as well as retirement wealth accumulation (Lusardi and Mitchell, 2011b,d). These questions have also been included in related surveys around the world, including Australia, France, Switzerland, Romania. Germany, Italy, the Netherlands, Sweden, Russia, New Zealand, and Japan; results reveal similar patterns of widespread illiteracy (Lusardi and Mitchell 2011c and 2014). Nevertheless, those three questions were designed to elicit basic knowledge of three economic concepts, namely interest compounding, inflation, and risk diversification. For this reason, we have recently expanded our investigation into financial knowledge among the older population by asking additional questions which have also been added to other surveys. For instance, we developed questions on financial knowledge for the American Life Panel, which we first piloted in the Dutch DNB Household Survey (Lusardi and Mitchell, 2009; van Rooij, Lusardi and Alessie, 2011). These new measures evaluate more sophisticated financial knowledge, eliciting what people know about the difference between bonds and stocks, how the stock market works, and basic asset pricing. This additional evidence on financial knowledge influenced the wording of a new HRS module fielded in 2008, described in more detail below. Using this more extensive information, we can now better classify respondents in terms of financial sophistication and address specific knowledge lacunae.4
It is also important, when measuring financial sophistication, to present respondents with alternative question wordings to assess whether people actually understand the questions posed. For our recent HRS module, we tested this by randomly assigning respondents to one of two sets of alternative question wordings. As an example, the first set of respondents was asked whether the following statement is true or false: ‘If you invest for the long run, the annual fees of mutual funds are important’; while the second group was asked: ‘If you invest for the long run, the annual fees of mutual funds are unimportant.’5 This procedure allows us to evaluate whether respondents understood the questions posed to them, which is important when measuring financial sophistication and knowledge of advanced financial concepts. In what follows, we describe our empirical approach, followed by a discussion of key findings. A final section offers conclusions and policy implications.
Data and Methodology
In 2008, we queried about 1,300 randomly-selected HRS respondents using a special module assessing knowledge of the stock market and asset prices, investment strategies, risk diversification, the importance of fees, and related topics. Respondents’ average age was 67, and about half (55%) were female. About 15% had less than a high school education, 32% had completed high school, 24% had some college education, and 28% had college or advanced degrees. Most (81%) of the respondents were White, with 9% African-American, and 8% Hispanic (see the Appendix for summary statistics).6
We group the ten financial knowledge questions of key interest here into four categories according to the topics they cover: knowledge of capital markets, risk diversification, knowledge of fees, and savvy/numeracy. Table 1 reports the specific language used in each question employed for the analysis; in each case with the answer which a sophisticated individual would provide indicated in bold:
Table 1.
Financial Sophistication Questions: Percent Correct
| 1st | 2nd | Chi-squared | ||
|---|---|---|---|---|
| Pooled | Wording | Wording | p-value | |
| Knowledge of capital markets | ||||
| An employee of a company with publicly traded stock should have [a lot/little or none] of his or her retirement savings in the company’s stock. | 51.9 | 72.2 | 33.2 | 0.00 |
| If the interest rate falls, bond prices will [rise/fall]. | 40.0 | 44.7 | 35.7 | 0.00 |
| [If/Even if] you are smart, it is [easy/hard] to pick individual company stocks that will have better than average returns. | 56.4 | 37.6 | 73.7 | 0.00 |
| Risk diversification | ||||
| You should invest [most of your money in a few good stocks that you select rather than in lots of stocks or in mutual funds/in either mutual funds or a large number of different stocks instead of just a few stocks]. | 64.9 | 60.3 | 69.1 | 0.00 |
| When an investor spreads money between 20 stocks, rather than 2, the risk of losing a lot money [decreases/increases]. | 61.0 | 61.4 | 60.6 | 0.93 |
| Knowledge of fees | ||||
| If you invest for the long run, the annual fees of mutual funds are [unimportant/important]. | 65.7 | 59.9 | 71.0 | 0.00 |
| It is [hard/easy] to find mutual funds that have annual fees of less than one percent of assets. | 39.4 | 42.7 | 36.3 | 0.02 |
| Savvy/numeracy | ||||
| To make money in the stock market, you [should not/have to] buy and sell stocks [too/] often. | 62.9 | 62.3 | 63.3 | 0.98 |
| Using money in a bank savings account to pay off credit card debt is usually a [good/bad] idea. | 58.3 | 59.8 | 57.0 | 0.07 |
| If you start out with $1,000 and earn an average return of 10% per year for 30 years, after compounding, the initial $1,000 will have grown to [more/less] than $6,000. | 61.8 | 70.2 | 54.0 | 0.00 |
Source: Authors’ computations; see text.
Knowledge of capital markets
-
(1)
An employee of a company with publicly traded stock should have [a lot/little or none] of his or her retirement savings in the company’s stock.
Little or none
-
(2)
(Please indicate whether you think each statement is true or false. If you are not sure, give your best guess.) If the interest rate falls, bond prices will [rise/fall].
Rise
-
(3)
(Please indicate whether you think each statement is true or false. If you are not sure, give your best guess.) [If/Even if] you are smart, it is [easy/hard] to pick individual company stocks that will have better than average returns.
Even if/hard
Results in Table 1 show that older Americans lack understanding about key concepts related to risk diversification, bond prices, and portfolio choice. For instance, many respondents expressed support for holding own-employer company stock, despite the fact that, from a risk diversification viewpoint, it is unlikely to be wise to hold much own-employer stock.7 We also find it of interest that answers are sensitive to how the questions are phrased. Respondents given the first wording8 of this question (an employee of a company with publicly traded stock should have a lot of his retirement savings in the company’s stock) state that holding a lot of company stock is not a good idea. Yet when presented with the reverse wording, most reject the proposal to hold little or no money in company stock. This discrepancy suggests that the question was not fully understood.9 Recalling that this module was fielded in the midst of 2008, it is particularly interesting to see how little respondents knew about key financial concepts.
A large majority of respondents (60%) also did not know about asset pricing, which we evaluated by asking whether people knew about the inverse relationship between bond prices and interest rates. This is a particularly useful question for assessing financial sophistication because it is difficult (if not impossible) to know or infer the correct answer to this question without having some knowledge of finance. When we piloted this question in both the ALP and the Dutch DNB, we found that few (always less than half) of respondents knew about bond pricing; there the wording order of the question influenced answers. Both conclusions are also true for the older U.S. population. When presented with the statement ‘If the interest rate falls, bond prices will fall’ (second wording), only about one-third (35.7%) of respondents answered correctly; when the wording was reversed (first wording: ‘If the interest rate falls, bond prices will rise’), more answered correctly (44.7%) and this difference is statistically significant. The low fraction of financially sophisticated respondents is consistent with the U.S. 2009 Financial Capability Study where knowledge about asset pricing was low for both older and younger respondents (Lusardi, 2011).
Many respondents were aware that ‘Even if you are smart, it is hard to pick individual company stocks that will have better than average returns.’ However here, too, responses varied depending on how the question was asked: in one case 73.7% got the correct answer, but only 37.6% got it correct using the reverse ordering. In other words, few know much about investment in this regard.
Risk diversification
-
(4)
(Please indicate whether you think each statement is true or false. If you are not sure, give your best guess.) You should invest [most of your money in a few good stocks that you select rather than in lots of stocks or in mutual funds/in either mutual funds or a large number of different stocks instead of just a few stocks].
Most of your money in either mutual funds or a large number of different stocks instead of just a few stocks
-
(5)
When an investor spreads money between 20 stocks, rather than 2, the risk of losing a lot of money [decreases/increases].
Decreases
Knowledge of risk diversification is important when considering what to invest in. Table 1 indicates that almost two-thirds of respondents knew that it is not a good idea ‘to invest most of your money in a few good stocks that you select rather than in lots of stocks or in mutual funds,’ which might be thought to imply some sophistication about risk. Yet this question jointly tests knowledge of risk diversification and awareness of mutual funds, which is confirmed by respondent sensitivity to reversing the question wording. The second risk question attempted to avoid this by simplifying the question and using less financial terminology; now, we find that most knew that spreading money across 20 stocks rather than two decreased the risk of losing money (and here, word order did not matter). We hypothesize that some of the sensitivity regarding question wording may be due to the use of financial jargon or terminology. For instance, many respondents might not know what a mutual fund is or the fact that mutual funds invest in pools of stocks.
Knowledge of fees
-
(6)
If you invest for the long run, the annual fees of mutual funds are [unimportant/important].
Important
-
(7)
It is [hard/easy] to find mutual funds that have annual fees of less than one percent of assets.
Easy
Two of the module questions sought to assess people’s knowledge of investment fees, an important topic since higher fees erode retirement saving and wealth. Several prior studies have reported that investors often overlook fees when deciding how to invest (e.g., Mitchell, Todd, and Bravo, 2008; Choi, Laibson, and Madrian, 2010). In our sample of older Americans, around two-thirds seemed to know that mutual fund fees are important when investing for the long run. Nonetheless, responses were again sensitive to question wording, perhaps due to the fact that respondents needed to know both about mutual funds and investing for the long run. Additionally, a majority of respondents reported it would be difficult to locate mutual funds charging annual fees of less than one percent of assets, suggesting that many respondents may not know about low-cost mutual funds. The fact that there is again some sensitivity to question wording confirms that, here too, respondents have difficulty with financial terminology (fees, mutual funds, etc.).
Savvy/numeracy
-
(8)
To make money in the stock market, you [should not/have to] buy and sell stocks [too/] often.
Should not/too
-
(9)
Using money in a bank savings account to pay off credit card debt is usually a [good/bad] idea.
Good
-
(10)
If you start out with $1,000 and earn an average return of 10% per year for 30 years, after compounding, the initial $1,000 will have grown to [more/less] than $6,000.
Sophisticated investor: more10
Not only it is important to evaluate whether people understand fees associated with investing; it is also important to know whether people understand they can do something to reduce these fees. Table 1 indicates what our HRS respondents knew. Most (over 60%) were savvy regarding stock churning, and there was little sensitivity to wording order for this question. We also explored other financial behaviors along with day-to-day financial management such as dealing with credit cards. Most respondents knew that using money in a bank account to pay off credit card debt is usually a good idea, and responses were not particularly sensitive to question wording, probably due to the simplicity of the question. By contrast, the questions assessing whether people knew about interest compounding and whether they could do complex calculations involving interest rates were far more difficult. Some 60% could figure out that an initial investment of $1,000 would grow more than six-fold when invested at an interest rate of 10% for 30 years, but the alternative wording generated different answers, so at least some respondents were guessing.
Constructing a Financial Literacy Index
While the questions just described do measure knowledge required for financial decisionmaking, analysts often construct summary measures or indexes of responses to all questions to help categorize respondents as relatively more or less sophisticated. One approach would be to simply sum the number of questions answered correctly, which we do, subtract it from the mean, and divide by ten: the result is centered on zero (with a standard deviation of 0.2; see the Appendix). Yet a disadvantage of such a measure is that it weights each question equally, despite the fact that in Table 1 it is clear that some questions are much harder than others for people to answer correctly.
For this reason we also develop a second, more sophisticated, index that relies on a weighting scheme that takes into consideration the relative difficulty of each question. Specifically we employ a weighted scoring mechanism called PRIDIT designed to deal with difficult-to-observe outcomes with indicator variables that proxy for a dependent variable that is binary or categorical.11 Moreover, as a scoring mechanism, the PRIDIT index weights questions according to how difficult and how informative they are. This index is constructed in two steps. First, each individual’s response to a given question is rescaled according to how many people answered that question correctly. That is, PRIDIT applies a negative penalty for a question answered incorrectly, and the penalty is greater when a larger proportion of the sample answered the question correctly. Conversely, the procedure gives more credit for a correct response to a question that few people answered correctly. Next, principal components analysis is used to analyze the rescaled responses, a process that takes into account the amount of correlation across questions.12 Weights are computed from the principal components analysis so that questions that are less correlated with a linear combination of the other questions are given more weight because they are more informative. The mean of the resulting PRIDIT variable is also zero (with a standard deviation of 0.03; see the Appendix).
In our dataset, the resulting PRIDIT measure and the simple index discussed previously prove to be highly correlated, at 0.977. This suggest that one would expect both measures to do a reasonably good job of capturing the variation in financial literacy measured with our questions. Yet the PRIDIT model tells us more, namely which questions are most informative about overall financial sophistication levels. Interestingly, as shown in Figure 1, Questions 4, 5, 8, and 10 are the most informative. These are the items related to knowledge of risk diversification, financial savvy, and numeracy. We interpret this to mean that if one were to design a survey aimed at measuring financial literacy, it would be most useful to ask questions assessing knowledge of those specific topics. Interestingly, studies that have used alternative indicators or indexes for financial literacy report similar results. For example, among the 20 questions used by Knoll and Houts (2012) to measure financial literacy, knowledge of risk diversification proved to be particularly important. That is consistent with our finding that Question 5, which measures knowledge of risk diversification, has the highest PRIDIT weight. Similarly, Schmeiser and Seligman (2013) report that knowing about interest compounding is a particularly useful measure of financial knowledge: indeed not only was it the most difficult question for people to answer in their own survey, but it was the only question consistently associated with wealth changes. Similarly, in our module Question 10 which measures knowledge of interest compounding, has the second-highest PRIDIT weight.
Figure 1.
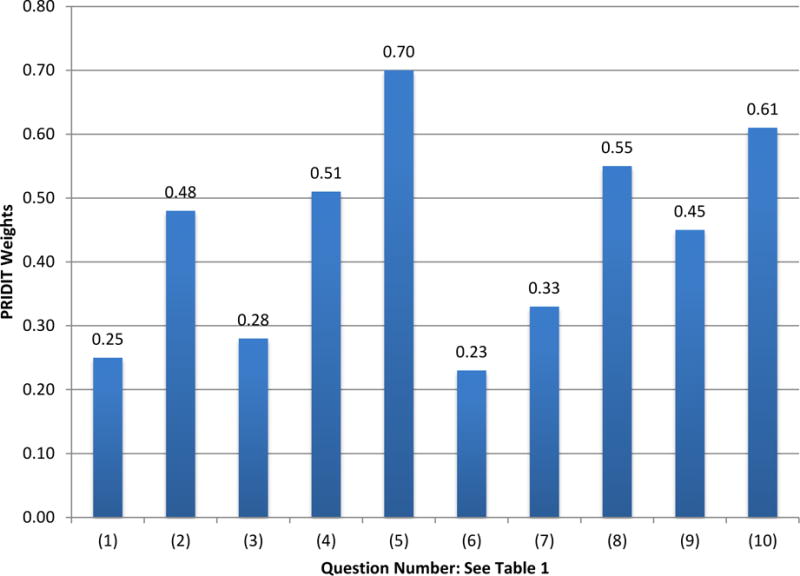
Question Weights Used to Generate the PRIDIT Index of Financial Sophistication
Source: Authors’ computations; see text.
The Distribution of Financial Sophistication in the Older Population
Next we look more closely at how financial sophistication is distributed across the older population. Table 2 reports multivariate regression results using the simple financial literacy index as the dependent variable, while Table 3 uses the PRIDIT index. We focus first on columns 1–6, were the vector of control variables encompasses those now standard in this literature including age, sex, education, and race/ethnicity. We also include measures of respondents’ self-reported planning horizon, attitudes toward risk aversion, and cognitive function intended to capture mental acumen.13
Table 2.
Multivariate Regression Models Using the Simple Financial Sophistication Index
| (1) | (2) | (3) | (4) | (5) | (6) | (7) | (8) | (8′) | |
|---|---|---|---|---|---|---|---|---|---|
| Female | −0.058 *** (0.014) |
−0.046 *** (0.014) |
−0.048 *** (0.014) |
−0.083 *** (0.021) |
0.070 *** (0.027) |
||||
| High School Graduate | 0.118 *** (0.019) |
0.035 * (0.020) |
0.037 * (0.021) |
0.050 * (0.029) |
−0.021 (0.040) |
||||
| College Graduate | 0.160 *** (0.021) |
0.059 *** (0.022) |
0.062 *** (0.022) |
0.061 * (0.033) |
0.003 (0.045) |
||||
| Graduate Plus | 0.237 *** (0.020) |
0.111 *** (0.022) |
0.113 *** (0.022) |
0.074 ** (0.033) |
0.084 * (0.044) |
||||
| African American | −0.139 *** (0.020) |
−0.123 *** (0.021) |
−0.123 *** (0.021) |
−0.139 *** (0.031) |
0.035 (0.042) |
||||
| Hispanic | −0.211 *** (0.024) |
−0.161 *** (0.026) |
−0.160 *** (0.027) |
−0.129 *** (0.034) |
−0.080 (0.052) |
||||
| Other Race | −0.023 (0.032) |
0.008 (0.032) |
0.005 (0.031) |
−0.018 (0.040) |
0.033 (0.063) |
||||
| Age: 65–74 | −0.014 (0.016) |
−0.006 (0.014) |
−0.007 (0.014) |
−0.013 (0.020) |
0.007 (0.028) |
||||
| Age: 75+ | −0.072 *** (0.017) |
−0.028 (0.019) |
−0.028 (0.019) |
−0.025 (0.026) |
−0.007 (0.037) |
||||
| Planning horizon | 0.017 *** (0.006) |
0.005 (0.006) |
0.005 (0.006) |
0.005 (0.008) |
−0.003 (0.011) |
||||
| Risk aversion | −0.017 ** (0.007) |
−0.011 (0.007) |
−0.011 (0.007) |
0.006 (0.011) |
−0.034 ** (0.014) |
||||
| Total cognition score | 0.011 *** (0.002) |
0.005 *** (0.002) |
0.005 *** (0.002) |
0.005 ** (0.003) |
0.001 (0.003) |
||||
| First wording | 0.021 (0.013) |
0.072 (0.099) |
0.072 (0.099) |
||||||
|
| |||||||||
| N | 1,331 | 1,331 | 1,331 | 1,331 | 1,147 | 1,147 | 1,147 | 1,147 | 1,147 |
| R-squared | 0.017 | 0.123 | 0.091 | 0.017 | 0.083 | 0.197 | 0.199 | 0.228 | 0.228 |
Note: Columns with ′ have interaction variables with First wording. Source: Author’s computations; see text
Table 3.
Multivariate Regression Models Using the PRIDIT Sophistication Index
| (1) | (2) | (3) | (4) | (5) | (6) | (7) | (8) | (8′) | |
|---|---|---|---|---|---|---|---|---|---|
| Female | −0.008 *** (0.002) |
−0.006 *** (0.002) |
−0.007 *** (0.002) |
−0.011 *** (0.002) |
0.009 *** (0.003) |
||||
| High School Graduate | 0.014 *** (0.002) |
0.004 * (0.002) |
0.005 * (0.002) |
0.006 * (0.004) |
−0.002 (0.005) |
||||
| College Graduate | 0.020 *** (0.002) |
0.007 *** (0.003) |
0.008 *** (0.003) |
0.008 * (0.004) |
0.000 (0.005) |
||||
| Graduate Plus | 0.029 *** (0.002) |
0.014 *** (0.003) |
0.014 *** (0.003) |
0.010 ** (0.004) |
0.008 (0.005) |
||||
| African American | −0.018 *** (0.002) |
−0.015 *** (0.003) |
−0.015 *** (0.003) |
−0.017 *** (0.004) |
0.004 (0.005) |
||||
| Hispanic | −0.025 *** (0.003) |
−0.019 *** (0.003) |
−0.019 *** (0.003) |
−0.016 *** (0.004) |
−0.007 (0.006) |
||||
| Other Race | −0.005 (0.004) |
0.000 (0.004) |
0.000 (0.004) |
−0.003 (0.005) |
0.004 (0.008) |
||||
| Age: 65−74 | −0.002 (0.002) |
−0.001 (0.002) |
−0.001 (0.002) |
−0.002 (0.002) |
0.001 (0.003) |
||||
| Age: 75+ | −0.009 *** (0.002) |
−0.004 * (0.002) |
−0.004 * (0.002) |
−0.003 (0.003) |
−0.002 (0.004) |
||||
| Planning horizon | 0.002 *** (0.001) |
0.001 (0.001) |
0.001 (0.001) |
0.001 (0.001) |
−0.001 (0.001) |
||||
| Risk aversion | −0.002 ** (0.001) |
−0.001 (0.001) |
−0.001 (0.001) |
0.000 (0.001) |
−0.003 * (0.002) |
||||
| Total cognition score | 0.001 *** 0.000 |
0.001 *** 0.000 |
0.001 *** 0.000 |
0.001 ** 0.000 |
0.000 0.000 |
||||
| First wording | 0.003 ** (0.002) |
0.011 (0.012) |
0.011 (0.012) |
||||||
|
| |||||||||
| N | 1,331 | 1,331 | 1,331 | 1,331 | 1,147 | 1,147 | 1,147 | 1,147 | 1,147 |
| R−squared | 0.022 | 0.139 | 0.100 | 0.021 | 0.104 | 0.231 | 0.234 | 0.255 | 0.255 |
Note: Columns with ′ have interaction variables with First wording. Source: Author’s computations; see text
Both tables confirm the importance of sex differences in financial sophistication. That is, irrespective of which index and which particular set of controls are used, women are consistently less financially savvy than men (column 1) and this result persists after controlling for many demographic characteristics (column 6). This result extends findings using only the simple financial literacy index in Lusardi and Mitchell (2007; 2011b) and is supportive of similar evidence in a wide range of countries.14 The magnitudes for the sex differences are not large in Column 6 of both Tables 2 and 3. However, women answer between a quarter to a half of a standard deviation fewer questions correctly.
The better-educated are also found to be more financially sophisticated in both tables, with those having a college degree or more having the greatest advantage compared to the reference case, a high school dropout. With the simple index, those with graduate degrees are about a third of a standard deviation more likely to respond correctly, while using the PRIDIT index the magnitude is a bit larger, at half a standard deviation. Race/ethnicity factors also play a role. Specifically, African-American and Hispanic respondents have lower measured levels of financial sophistication than do their White counterparts (the reference group in columns 3 and 6–8 of both tables). Relatively speaking, Hispanic respondents are at the greatest disadvantage, underscoring about a third to a half a standard deviation across tables. This corroborates our findings from prior waves of the HRS that measured only basic financial knowledge (Hilgert et al., 2003; Moore, 2005; Lusardi and Tufano, 2009a,b; Lusardi and Mitchell, 2011b). African-Americans’s shortfalls are statistically significant, though quantitatively smaller.
In this older population of Americans, there is only weak evidence that age is related to financial literacy scores. That is, once we include our full set of controls in Column 6 (Tables 2 and 3), only very weak age effects remain differentiating other groups from the reference category (age 55–64). This is due to the fact that age is correlated with cognition, risk aversion, and planning controls, as is evident from a comparison of Columns 4 and 5. Since we have a single HRS cross-section with which we can examine the key outcomes of interest, naturally we cannot disentangle age and cohort effects (Lusardi and Mitchell, 2011b). Interestingly, only the cognition score retains its statistical significance in Column 6 of both tables when all other controls are included, though in both cases the estimated magnitudes are quite small. Nevertheless, in other work (Behrman et al., 2012) we have shown that even small increases in the PRIDIT index is associated with almost 6 percent more net wealth.
Another contribution of this paper is to examine whether and how responses varied according to the order of question wording. Tables 2 and 3 offer additional information on this point in two ways. First, Column 7 adds a simple control variable to the set of regressors indicating which wording each respondent received first. Here we see that the patterns of financial sophistication documented earlier are not attenuated with this control, which is statistically significant when using the PRIDIT index (Table 3) Nor are controls on risk aversion and financial planning horizon influential for the financial literacy outcomes we examine here. Second, to check for differential sensitivity by group, Columns 8 and 8′ in both tables offer a fully saturated model where the first wording dummy is interacted with all other variables. One key subgroup stands out as influenced by the order of the question, namely women. Thus when women were shown the first wording, they were more likely to score better on both simple and PRIDIT sophistication indexes, holding other factors constant.15
To explore this in more detail, Table 4 illustrates exactly which wording induced HRS women to be more likely to answer questions correctly. Panel 4A examines differences by sex in the mean percentage of ‘Do not know’ responses for each of the survey questions where we report p-values for the statistical significance of mean differences. Panel 4B instead uses a tally of each person’s total number of ‘Do not know’ responses as the dependent variable (we have also subtracted the mean and divided by 10 as before). We then show three specifications identical to columns 6 and 8–8′ in Tables 2 and 3.
Table 4A.
Financial Sophistication: Summary Measures of ‘Do Not Know’ Responses by Sex
| Pooled | First Wording | Second Wording | ||||||||||
|---|---|---|---|---|---|---|---|---|---|---|---|---|
| All | Male | Female | Chi-squared Test p-value | All | Male | Female | Chi-squared Test p-value | All | Male | Female | Chi-squared Test p-value | |
|
|
|
|
||||||||||
| Knowledge of capital markets | ||||||||||||
| An employee of a company with publicly traded stock should have [a lot/little or none] of his or her retirement savings in the company’s stock. | 8.2 | 4.2 | 11.5 | 0.000 | 6.7 | 4.5 | 8.3 | 0.061 | 9.5 | 3.9 | 14.7 | 0.000 |
| If the interest rate falls, bond prices will [rise/fall]. | 21.3 | 13.8 | 27.4 | 0.000 | 23.0 | 16.3 | 27.7 | 0.003 | 19.8 | 11.8 | 27.1 | 0.000 |
| [If/Even if] you are smart, it is [easy/hard] to pick individual company stocks that will have better than average returns. | 11.2 | 6.8 | 14.7 | 0.000 | 13.6 | 10.3 | 15.9 | 0.024 | 8.9 | 4.0 | 13.4 | 0.000 |
| Risk diversification | ||||||||||||
| You should invest [most of your money in a few good stocks that you select rather than in lots of stocks or in mutual funds/in either mutual funds or a large number of different stocks instead of just a few stocks]. | 8.1 | 4.6 | 10.9 | 0.000 | 7.7 | 5.7 | 9.1 | 0.002 | 8.4 | 3.7 | 12.8 | 0.000 |
| When an investor spreads money between 20 stocks, rather than 2, the risk of losing a lot money [decreases/increases]. | 11.2 | 6.9 | 14.8 | 0.000 | 12.4 | 8.4 | 15.2 | 0.005 | 10.2 | 5.7 | 14.4 | 0.000 |
| Knowledge of fees | ||||||||||||
| If you invest for the long run, the annual fees of mutual funds are [unimportant/important]. | 12.6 | 6.5 | 17.5 | 0.000 | 12.5 | 8.0 | 15.7 | 0.015 | 12.7 | 5.3 | 19.4 | 0.000 |
| It is [hard/easy] to find mutual funds that have annual fees of less than one percent of assets. | 28.7 | 21.8 | 34.2 | 0.000 | 26.4 | 21.5 | 29.9 | 0.064 | 30.7 | 22.1 | 38.7 | 0.000 |
| Savvy/numeracy | ||||||||||||
| To make money in the stock market, you [should not/have to] buy and sell stocks [too/] often. | 7.4 | 3.3 | 10.7 | 0.000 | 7.4 | 5.6 | 8.7 | 0.130 | 7.4 | 1.5 | 12.9 | 0.000 |
| Using money in a bank savings account to pay off credit card debt is usually a [good/bad] idea. | 4.4 | 3.2 | 5.5 | 0.001 | 5.5 | 5.2 | 5.8 | 0.504 | 3.4 | 1.6 | 5.1 | 0.000 |
| If you start out with $1,000 and earn an average return of 10% per year for 30 years, after compounding, the initial $1,000 will have grown to [more/less] than $6,000. | 15.9 | 8.8 | 21.7 | 0.000 | 14.2 | 11.1 | 16.4 | 0.057 | 17.5 | 7.0 | 27.2 | 0.000 |
Source: Authors’ computations; see text.
Two important conclusions emerge from this analysis. First, older women are far more likely to answer ‘do not know’, and in many cases, around twice as likely as men. Second, the rate of ‘do not know’ responses among women is lower when the first wording order was used. This is evident both from the lower significance levels of the chi-squared tests performed on the First Wording group in Table 4A, as well as from the strongly negative coefficient on the female and first wording interaction term in Table 4B. From these two facts, we conclude that women are susceptible to framing effects and are also much more likely to respond ‘do not know’ when such confusion arises. This is somewhat puzzling but it confirms with evidence from other countries. For instance, Lusardi and Mitchell (2011c, 2014) show that women respond similarly in countries as different as Sweden, Italy, Germany, New Zealand, Australia and Russia; i.e., they were disproportionately more likely to indicate they did not know the answers to financial literacy questions. Because of a lack of confidence or perhaps due to lack of knowledge, women are sensitive to how the question was framed.
Table 4B.
Multivariate Regression Models of Financial Sophistication: Do Not Know Responses by Sex
| (1) | (2) | (2′) | (3) | (4) | (4′) | |
|---|---|---|---|---|---|---|
| Female | 0.087 *** (0.013) |
0.124 *** (0.018) |
−0.077 *** (0.025) |
0.080 *** (0.014) |
0.113 *** (0.019) |
−0.074 *** (0.027) |
| High School Graduate | −0.026 (0.025) |
−0.065 ** (0.033) |
0.061 (0.047) |
0.006 (0.026) |
−0.019 (0.032) |
0.038 (0.047) |
| College Graduate | −0.047 * (0.024) |
−0.062 * (0.032) |
0.023 (0.047) |
−0.009 (0.024) |
−0.018 (0.030) |
0.015 (0.047) |
| Graduate Plus | −0.056 ** (0.023) |
−0.048 (0.034) |
−0.029 (0.046) |
−0.008 (0.024) |
0.000 (0.032) |
−0.026 (0.046) |
| African American | 0.035 (0.025) |
0.051 (0.040) |
−0.037 (0.050) |
0.041 (0.027) |
0.066 (0.044) |
−0.055 (0.054) |
| Hispanic | 0.120 *** (0.038) |
0.057 (0.039) |
0.148 ** (0.073) |
0.122 *** (0.039) |
0.040 (0.035) |
0.188 ** (0.074) |
| Other Race | −0.059 ** (0.028) |
−0.021 (0.052) |
−0.062 (0.059) |
−0.079 *** (0.023) |
−0.059 (0.041) |
−0.013 (0.051) |
| Age: 65–74 | 0.017 (0.015) |
0.028 (0.020) |
−0.021 (0.029) |
0.020 (0.015) |
0.030 (0.019) |
−0.021 (0.029) |
| Age: 75+ | 0.037 ** (0.016) |
0.027 (0.022) |
0.017 (0.032) |
0.013 (0.018) |
0.003 (0.020) |
0.020 (0.035) |
| Planning horizon | −0.004 (0.006) |
0.002 (0.008) |
−0.011 (0.012) |
|||
| Risk aversion | 0.005 (0.006) |
−0.012 (0.009) |
0.032 *** (0.012) |
|||
| Total cognition score | −0.004 * (0.002) |
−0.002 (0.002) |
−0.002 (0.004) |
|||
| First wording | −0.005 (0.013) |
0.015 (0.046) |
−0.001 (0.014) |
0.001 (0.106) |
0.001 (0.106) |
|
|
| ||||||
| N | 1,331 | 1,331 | 1,147 | 1,147 | 1,147 | |
| R-squared | 0.085 | 0.108 | 0.083 | 0.125 | 0.125 | |
Note: Columns with ′ have interaction variables with First wording. Source: Author’s computations; see text
Other studies have also suggested that context also matters for financial literacy questions. For example, Schmeiser and Seligman (2013) report that the proportion of correct answers changed if a question was posed in the context of math, medicine, or consumer decisions. They also show that the proportion of correct answers to the same HRS financial literacy questions changed in ways consistent with lack of knowledge and/or guessing, as reported here.
Conclusion and Discussion
This paper documents a quite striking dearth of financial sophistication among the older American population. Our special-purpose HRS module has permitted us to quantify just how little respondents know regarding capital markets, risk diversification, fees, financial savvy, and investing. Furthermore, we have exploited differences in question wording to show that people are likely guessing and are often influenced by the way in which survey questions are framed. Finally, we make a methodological contribution by examining alternative ways to combine answers to financial literacy questions into an overall index. This helps identify which particular questions are most valuable in measuring financial literacy at older ages.
To sum up, in our HRS sample of older respondents, people lacked a good grasp of asset pricing, risk diversification, portfolio choice, and investment fees, despite having made many financial decisions over their lifetimes including having taken out mortgages and loans, saved and invested, and made retirement accumulation/decumulation decisions. Moreover, we showed that the PRIDIT index we used is highly correlated with an alternative measure that simply sums correct answers, indicating for the older population that both approaches do a reasonably good job in capturing observed variation in financial sophistication. Yet the PRIDIT approach has the advantage of telling us which questions are most informative about overall financial sophistication levels. In our module, the questions related to knowledge of risk diversification, financial savvy, and numeracy were most informative. For this reason, those seeking to measure financial literacy and sophistication will find it helpful in measuring knowledge of these specific topics.
We also conclude that some subgroups of the population are significantly less sophisticated about financial matters, and these include the least educated, women, those age 75+, African-Americans, and Hispanics. Women are particularly sensitive to questions’ framing when financial terminology is being used. This suggests that it would be fruitful to study how financial sophistication questions are framed, so as to determine whether and how people develop a fuller understanding of retirement saving and investment. Moreover, the analyst must in mind that some questions are not effectively gender neutral.
Our findings will be of interest to those seeking to enhance retirement security in the older population. As employees and retirees are increasingly being asked to take on tasks requiring financial sophistication including saving, investment, and dissaving pre- and post-retirement, they are likely to do better if they are equipped with more and better financial decision-making capacity. One way to do this is to build human capital via educational and retirement planning programs, particularly starting young (Lusardi, Mitchell, and Curto 2010). And a one-size-fits-all approach is unlikely to address saving shortfalls for all the elderly, in view of the very different patterns discerned by sex, age, educational levels, and race/ethnicity. Instead, targeted programs are likely to better serve people who differ in terms of financial sophistication.
Acknowledgments
The research reported herein was conducted pursuant to grants from the U.S. Social Security Administration (SSA) to the Financial Literacy Center and the Michigan Retirement Research Center funded via the Financial Literacy Research Consortium and the Retirement Research Consortium. Additional support was provided by the Pension Research Council and Boettner Center at the Wharton School of the University of Pennsylvania, and the FINRA Investor Education Foundation. We are grateful to Richard Derrig for sharing his PRIDIT code and to our editor, Julie Agnew, and anonymous referees for comments. Opinions and errors are solely those of the authors and not of the institutions with which the authors are affiliated.
Appendix: Descriptive Statistics for the HRS Analysis Sample
| Mean | Min | Max | SD | |
|---|---|---|---|---|
| Financial Literacy Index | 0.000 | −0.56 | 0.44 | 0.219 |
| PRIDIT: Pooled Sample | 0.003 | −0.06 | 0.05 | 0.026 |
| Do Not Know Index | 0.000 | −0.13 | 0.87 | 0.221 |
| Female | 0.551 | 0 | 1 | 0.498 |
| High School Graduate | 0.324 | 0 | 1 | 0.468 |
| College Graduate | 0.241 | 0 | 1 | 0.428 |
| Graduate Plus | 0.281 | 0 | 1 | 0.450 |
| African American | 0.090 | 0 | 1 | 0.286 |
| Hispanic | 0.079 | 0 | 1 | 0.269 |
| Other Race | 0.023 | 0 | 1 | 0.151 |
| Age: 65–74 | 0.280 | 0 | 1 | 0.449 |
| Age: 75+ | 0.223 | 0 | 1 | 0.416 |
| Planning horizon | 3.100 | 1.00 | 5.00 | 1.234 |
| Risk aversion | 3.289 | 1.00 | 4.00 | 1.044 |
| Total cognition score | 23.379 | 0.00 | 34.00 | 4.747 |
Source: Authors’ computations; see text.
Footnotes
JEL: D91, G11.
This module was designed by the authors of this paper in collaboration with Miles Kimball and Tyler Shumway.
For other examples of how to construct indexes of financial literacy and sophistication, see van Rooij, Lusardi, and Alessie (2011), Lusardi and Mitchell (2009), Knoll and Houts (2012), and Seligman (2012).
For a review of the literature on financial literacy as well as the costs and consequences of financial illiteracy, see Lusardi and Mitchell (2014).
Other authors have offered alternative approaches to evaluating financial knowledge; for example, Knoll and Houts (2012) combine questions used in the HRS, the Financial Capability Study, and the American Life Panel. Those authors used Item Response Theory to develop their own summary financial knowledge measure. Schmeiser and Seligman (2013) use panel HRS data to ask whether financial literacy measures seem stable over time and are effective predictors of future changes in wealth. These papers offer useful discussions of prior financial literacy measures.
The Dutch DNB Household Survey and the American Life Panel used a related approach for a small subset of the questions, and the wording of the questions did matter, especially for items measuring financial sophistication (Lusardi and Mitchell, 2009; van Rooij, Lusardi and Alessie, 2011).
For more information on the HRS dataset see http://hrsonline.isr.umich.edu/.
This is because the typical US worker has a large part of his total wealth in human capital, so that labor earnings are highly correlated with his employer’s financial stability. For a discussion of the pros and cons of employer stock, see Benartzi et al. (2004) and Ruffino (2011).
Note that we report the wordings for these questions exactly as they appear in the HRS documentation. Thus, the “first” wording is simply the first selection that appears in brackets; the designation of “first” versus “second” wording has no particular significance and is arbitrary.
As noted above, the first question was not worded to make it easier to understand or answer, not did it suffer less from an agreeability bias.
For all of these questions, it was also possible to answer with “do not know” or to refuse to answer.
This approach was devised by Brockett et al. (2002), who use it to assess insurance fraud, where investigators use several indicator variables (such as whether an individual had time gaps between medical treatments or experienced many hospital visits) to assess whether a given claim might be fraudulent. This approach has recently been used to measure financial literacy in Chile (see Behrman et al., 2012).
More precisely, we calculate the principal components and use the principal component vector with the largest corresponding eigenvalue. This principal component vector captures more variance in the data than any of the other eigenvectors. We then use this vector to compute the PRIDIT weights that are used to construct the PRIDIT index.
The planning horizon and risk aversion questions are derived by St. Clair et al. (2010) made available in the RAND datafile for the HRS. Planning horizon refers to the time period over which the respondent makes financial decisions: new few months (1), next year (2), next few years (3), next 5–10 years (4), or longer than 10 years (5). Risk aversion is measured using questions about income gambles and answers range from least risk averse (1), next higher risk averse (2), next higher risk averse (3), and most risk averse (4). We construct the cognition index following Ofstedahl et al. (2005) who generated a sum of scores using tests of word recall (immediate and delayed), date naming, backwards counting, and serial 7s. The maximum possible score was 35, and the minimum zero. See also Loibl and Hira (2011).
This is true in the United States ((Lusardi and Mitchell, 2008; Lusardi and Tufano, 2009a,b; Loibl and Hira, 2011; Seligman, 2012), and also in many other nations around the world. For instance see Christelis, Jappelli and Padula (2010) and Lusardi and Mitchell (2011c).
While respondents assigned the “First” wording did fare slightly better overall, for individual questions the designation of “first” wording is arbitrary and not necessarily associated with a higher correct response rate (as explained in Table 1).
Contributor Information
Annamaria Lusardi, The George Washington School of Business, 2201 G Street, NW. Suite 450E, Duquès Hall, Washington, D.C. 20052.
Olivia S. Mitchell, The Wharton School, University of Pennsylvania, 3620 Locust Walk, Ste. 3000 SH-DH, Philadelphia, PA 19104
Vilsa Curto, Department of Economics, Stanford University, 579 Serra Mall, Stanford, CA 94305.
References
- Behrman J, Mitchell OS, Soo C, Bravo D. Financial literacy, schooling, and wealth accumulation. American Economic Review. 2012;102(3):300–304. doi: 10.1257/aer.102.3.300. [DOI] [PMC free article] [PubMed] [Google Scholar]
- Benartzi S, Thaler RH, Utkus SP, Sunstein CR. John M Olin Law and Economics Working Paper 218. University of Chicago; Chicago, IL, USA: 2004. Jul, Company stock, market rationality, and legal reform. [Google Scholar]
- Brockett P, Derrig RA, Golden LL, Levine A, Alpert M. Fraud classification using principal component analysis of RIDITs. Journal of Risk and Insurance. 2002;69:341–371. [Google Scholar]
- Campbell J. Household finance. Journal of Finance. 2006;61:1553–1604. [Google Scholar]
- Choi J, Laibson D, Madrian B. Why does the law of one price fail? An experiment on index mutual fund. Review of Financial Studies. 2010;23:1405–1432. doi: 10.1093/rfs/hhp097. [DOI] [PMC free article] [PubMed] [Google Scholar]
- Christelis D, Jappelli T, Padula M. Cognitive abilities and portfolio choice. European Economic Review. 2010;54:18–39. [Google Scholar]
- Gerardi K, Goette L, Meier S. Numerical Ability Predicts Mortgage Default. Proceedings of the National Academy of Sciences. 2013;110:11267–11271. doi: 10.1073/pnas.1220568110. [DOI] [PMC free article] [PubMed] [Google Scholar]
- Hastings J, Mitchell OS. How financial literacy and impatience shape retirement wealth and investment behaviors. NBER Working Paper No 16740. 2011 doi: 10.1017/s1474747218000227. [DOI] [PMC free article] [PubMed] [Google Scholar]
- Hastings J, Tejeda-Ashton L. Financial literacy, information, and demand elasticity: Survey and experimental evidence from Mexico. NBER Working Paper No 14538 2008 [Google Scholar]
- Hilgert M, Hogarth J, Beverly S. Household financial management: The connection between knowledge and behavior. Federal Reserve Bulletin. 2003:309–332. [Google Scholar]
- Kimball M, Shumway T. Investor sophistication and the participation, home bias, diversification, and employer stock puzzle. University of Michigan Working Paper 2006 [Google Scholar]
- Knoll M, Houts C. The financial knowledge scale: An application of item response theory to the assessment of financial literacy. The Journal of Consumer Affairs. 2012;46:381–410. [Google Scholar]
- Loibl C, Hira T. Know your subject: A gender perspective on investor information search. Journal of Behavioral Finance. 2011;12:117–130. [Google Scholar]
- Lusardi A. U.S. household savings behavior: The role of financial literacy, information and financial education programs. In: Foote C, Goette L, Meier S, editors. Policymaking Insights from Behavioral Economics. Federal Reserve Bank of Boston; Boston, MA, USA: 2009. pp. 109–149. [Google Scholar]
- Lusardi A. Americans’ financial capability. NBER Working Paper No 17103 2011 [Google Scholar]
- Lusardi A, Mitchell OS. Baby boomer retirement security: The role of planning, financial literacy, and housing wealth. Journal of Monetary Economics. 2007;54:205–224. [Google Scholar]
- Lusardi A, Mitchell OS. Planning and financial literacy: How do women fare? American Economic Review P&P. 2008 May;:413–417. [Google Scholar]
- Lusardi A, Mitchell OS. How ordinary consumers make complex economic decisions: Financial literacy and retirement readiness. NBER Working Paper No 15350 2009 [Google Scholar]
- Lusardi A, Mitchell OS. The outlook for financial literacy. In: Mitchell OS, Lusardi A, editors. Financial Literacy: Implications for Retirement Security and the Financial Marketplace. Oxford University Press; Oxford, UK: 2011a. pp. 1–16. [Google Scholar]
- Lusardi A, Mitchell OS. Financial literacy and planning: Implications for retirement wellbeing. In: Mitchell OS, Lusardi A, editors. Financial Literacy: Implications for Retirement Security and the Financial Marketplace. Oxford University Press; Oxford, UK: 2011b. pp. 17–49. [Google Scholar]
- Lusardi A, Mitchell OS. Financial literacy around the world: An overview. Journal of Pension Economics and Finance. 2011c;10(4):497–508. doi: 10.1017/S1474747211000448. [DOI] [PMC free article] [PubMed] [Google Scholar]
- Lusardi A, Mitchell OS. Financial literacy and retirement planning in the United States. Journal of Pension Economics and Finance. 2011d;10(4):509–525. doi: 10.1017/S1474747211000448. [DOI] [PMC free article] [PubMed] [Google Scholar]
- Lusardi A, Mitchell OS. The economic importance of financial literacy: Theory and evidence Forthcoming. Journal of Economic Literature. 2014 doi: 10.1257/jel.52.1.5. [DOI] [PMC free article] [PubMed] [Google Scholar]
- Lusardi A, Mitchell OS, Curto V. Financial literacy among the young. Journal of Consumer Affairs. 2010;44:358–380. [Google Scholar]
- Lusardi A, Tufano P. Debt literacy, financial experience, and overindebtedness. NBER Working Paper No 14808 2009a [Google Scholar]
- Lusardi A, Tufano P. Teach workers about the peril of debt. Harvard Business Review. 2009b Nov;:22–24. [Google Scholar]
- Mitchell OS, Todd P, Bravo D. Learning from the Chilean experience: The determinants of pension switching. In: Lusardi A, editor. Overcoming the Saving Slump: Making Financial Education and Saving Programs More Effective. University of Chicago Press; Chicago, IL: 2008. pp. 301–323. [Google Scholar]
- Moore D. Survey of Financial Literacy in Washington State: Knowledge, Behavior, Attitudes, and Experiences. Social and Economic Sciences Research Center, Washington State University; Pullman, WA, USA: 2003. (Technical Report No. 03-39). [Google Scholar]
- Ofstedal MB, Fisher GG, Herzog AR. Documentation of cognitive functioning measures in the Health and Retirement Study HRS/AHEAD Documentation Report. ISR, University of Michigan; Ann Arbor: 2005. [Google Scholar]
- Ruffino D. Resuscitating businessman risk a rationale for familiarity-based portfolios. 2011 Available at SSRN: http://ssrn.com/abstract=1013342.
- Schmeiser M, Seligman J. Using the right yardstick: Assessing financial measures by way of financial well-being. The Journal of Consumer Affairs. 2013;47:243–262. [Google Scholar]
- Seligman J. Evidence on the financial capability of older workers facing lump-sum retirement plan distribution. Accounting and Finance Research. 2012;1:177–195. [Google Scholar]
- Smith B, Stewart F. Learning from the experience of OECD countries: Lessons for policy, programs and evaluations. In: Lusardi A, editor. Overcoming the Saving Slump: How to Increase the Effectiveness of Financial Education and Saving Programs. University of Chicago Press; Chicago, IL, USA: 2008. pp. 345–367. [Google Scholar]
- St Clair P, Blake D, Bugliari D, Chien S, Hayden O, Hurd M, Ilchuk S, Kung F, Miu A, Panis C, Pantoja P, Rastegar A, Rohwedder S, Roth E, Carroll J, Zissimopoulos J. RAND HRS Data Documentation, Version J. Labor and Population Program, RAND Center for the Study of Aging; Santa Monica: 2010. [Google Scholar]
- van Rooij M, Lusardi A, Alessie R. Financial literacy and stock market participation. Journal of Financial Economics. 2011;101:449–472. [Google Scholar]
- Yoong J. Financial illiteracy and stock market participation: Evidence from the RAND American Life Panel. In: Mitchell OS, Lusardi A, editors. Financial Literacy: Implications for Retirement Security and the Financial Marketplace. Oxford University Press; Oxford, UK: 2011. pp. 76–100. [Google Scholar]