Abstract
Pancreas cancer (PC), a highly aggressive tumour type with uniformly poor prognosis, is an exemplar of the classical view of cancer development based on stepwise progression1. The current progression model, based on analyses of precursor lesions termed pancreatic intraepithelial neoplasm (PanINs) lesions, makes two predictions: 1) PC develops through a particular sequence of genetic alterations2–5 (KRAS > CDKN2A > TP53/SMAD4); and 2) the evolutionary trajectory of PC progression is gradual because each alteration is acquired independently. One shortcoming of this nearly two decade old contention is that clonally expanded precursor lesions have been identified that do not always belong to the tumour lineage2,5–9, indicating that the evolutionary trajectory of the tumour lineage and precursor lesions can be divergent. This prevailing view of tumourigenesis has contributed to the clinical notion that PC evolves slowly and presents at a late stage10. However, the propensity for this disease to rapidly metastasize and the inability to improve patient outcomes despite efforts aimed at early detection11, argue that PC progression is anything but gradual. By tracking DNA copy number changes and their associated rearrangements from tumour-enriched genomes using novel informatics tools, we found that PC tumourigenesis neither is gradual nor follows the accepted mutation order. Two-thirds of tumours harbour complex rearrangement patterns associated with mitotic errors, consistent with punctuated equilibrium as the principal evolutionary trajectory12. In a subset of cases, the consequence of such errors was the simultaneous, rather than sequential, knockout of canonical preneoplastic genetic drivers that likely set-off invasive cancer growth. These findings challenge the current model of PC tumourigenesis and provide novel insights into the mutational processes giving rise to these aggressive tumours.
PC will be the second leading cause of cancer-related death within a decade, and the biological basis for the aggressive nature of this disease is largely undefined. Motivated by this, we explored the PC genome to address this concern. PC genomes are highly unstable13, as evidenced by the drastic modifications to their DNA copy number (CN) landscape. Although this instability is further exacerbated with metastatic progression14, it remains unclear when the instability begins relative to the key genetic alterations that give rise to the invasive clone. Also, whether this instability propagates through single CN changes that accumulate one after another or through large numbers of concurrent changes, remains an unsettled facet of the PC progression model. These questions have important basic and translational implications for this lethal disease. As a first step, the mechanisms at the root cause of this instability need to be identified. Mutational phenomena such as chromothripsis and polyploidization have been linked to unstable tumours15,16 and aggressive tumour behaviour, raising the possibility that they play a role in PC development. These particular mutational phenomena are considered to accelerate cancer evolution because the DNA damage ensuing from such mitotic errors must be resolved in one or few rounds of cell division; otherwise the cell would die. To date, the extensive fibrosis in PC has obstructed the sequencing resolution needed to clearly decipher these events. In this study, we performed an in-depth analysis of over 100 whole genomes (Extended Data Fig. 1) from purified primary and metastatic PC (referring to ductal adenocarcinoma only) with a focus on mutational phenomena linked to rapid tumour progression.
To evaluate polyploidization, we developed and validated a new informatic tool, termed CELLULOID, which can estimate tumour ploidy and CN from whole genome data (Fig. 1a; Extended Data Fig. 2). We found that 45% (48/107) of tumours displayed CN changes consistent with polyploidization (Ploidy solutions in Supplement). In polyploid tumours, 88% (42/48) were tetraploid and the rest were hexaploid. The mean ploidy of diploid tumours was 1.95 versus those tumours that underwent genome duplication and triplication was 3.03 and 5.21 (relative to 4 and 6), implying that a larger proportion of the genome was lost in the latter subgroup (Extended Data Fig. 3a,b), which is consistent with previous data16. Polyploid tumours were enriched for mutations in TP53 (Extended Data Fig. 1e; p=0.02, Fisher’s exact test), and harboured 1.5 fold higher CN alterations compared to diploid tumours (median: 112 versus 77, p=0.003, t-test; Extended Data Fig. 3c). The dramatic loss of genomic material relative to baseline ploidy and increased number of CN alterations in polyploids demonstrates that their genomes are highly unstable.
Figure 1. Mutational dynamics of polyploidization.
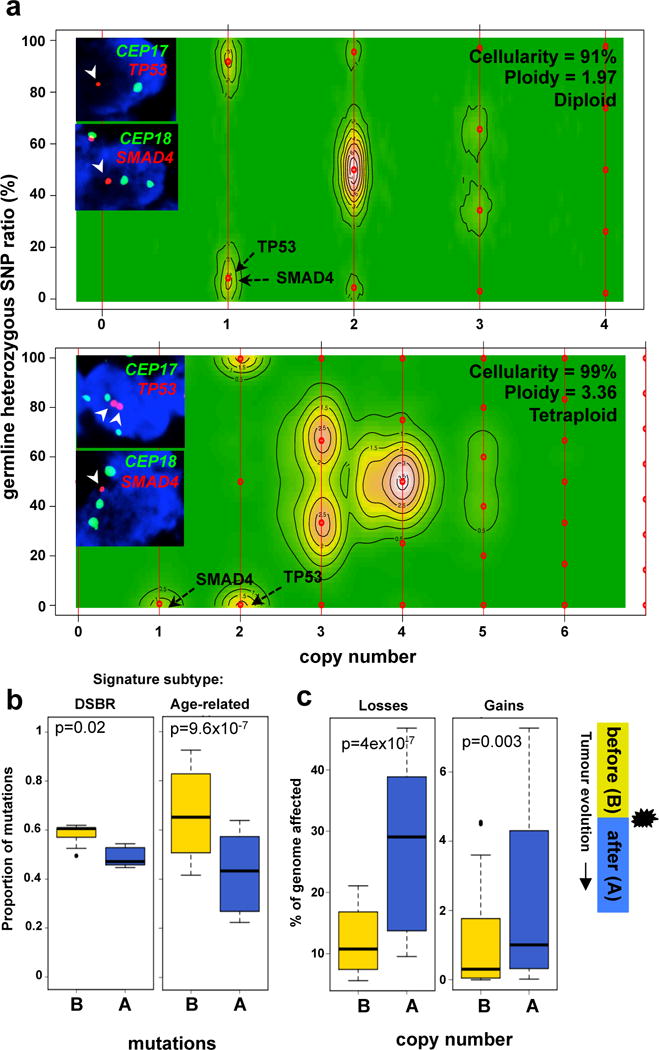
(a) CELLULOID profiles of a diploid (top – Ashpc_0008) and a tetraploid (bottom – Ashpc_0005) case that underwent tumour purification by flow cytometry followed by whole genome sequencing. Absolute copy number of of SMAD4 and TP53 allelic losses as predicted by CELLULOID is shown with black arrows on the contour plot. FISH validation of tumour copy number of SMAD4 and TP53 genes and corresponding centromeres (CEP17 and CEP18) are shown as an inset. (b) Proportion of mutations that occurred before (yellow) or after (blue) polyploidization event in the two predominant mutational signature subtypes of PC: DSBR (n=5; left) and Age-related (n=32; right) mutational signature. Due to increased instability in polyploids, mutations at a copy number of 4 in tetraploids were utilized in this analysis. (c) Fraction of the genome lost and gained either before (yellow) or after (blue) polyploidization. Legend is shown on the right of this plot. Box whisker plots represent 10–90% quartiles. p values were derived using t-test. A detailed description of these data is given in Supplementary results.
We then used mutation data to infer the timing of the polyploidization event in tumour evolution (Supplementary results). All cases were first categorized according to their dominant mutational signature since specific aetiologies drive mutation accrual17. Two subgroups were evident: one where C>T transitions dominated, likely related to cytosine deamination with aging (termed ‘Age-related’: ~80%); and a second where all six classes of base substitutions were more or less balanced, a phenomenon linked to defects in double-strand break repair (termed DSBR: 17%; Extended Data Fig. 3d). Accordingly, half of the DSBR cases carried germline or somatic mutations in BRCA1/213. The remaining cases were comprised of heterogeneous signatures previously identified by Alexandrov et al17 (Extended Data Fig. 3d).
We found that most mutations preceded polyploidization in both the Age-related and DSBR subgroups (Fig. 1b). By contrast, most CN losses and gains occurred after polyploidization, an effect that was dramatically magnified when the size of the CN change was taken into account (losses: p=4.3×10⁻⁷; gains: p=0.003, t-test; Fig. 1c and Extended Data Fig. 3e). This implies that CN changes that precede polyploidization were smaller and focal; whereas, those that came after were larger and more structurally damaging to the genome. Some of these larger changes are likely a consequence of the improper segregation of chromosomal material gained during polyploidization. CN alterations corresponding to the polyploidization event commonly resided at integer values indicating that such events are near or fully clonal (CELLULOID solutions in Supplement). Two conclusions emerge from these data: 1) polyploidization occurs after an extended diploid phase of mutation accrual; 2) the CN changes related to polyploidization come to rapidly dominate in a shorter timeframe suggesting they are relevant to disease progression.
Many diploid and polyploid tumours harboured focal CN alterations that oscillated between a few DNA copy states, a telltale sign of chromothripsis15. We developed a sensitive algorithm, termed Chrom-AL, to differentiate chromothripsis from localized gradual events that accumulate over time (Supplementary Results). We found that a striking 65.4% (70/107) of PC harboured at least one chromothripsis event (Chrom-AL solutions in Supplement). A similar frequency was observed in an independent genome cohort (60%, n=50/84, Supplementary Results). Eleven percent of all chromothripsis events resided on chr18 (Extended Data Fig. 4a) resulting in the loss of a key tumour suppressor gene, SMAD4. By comparing the consensus CN profiles of cases with and without chromothripsis, we found that SMAD4 loss was accompanied by a gain in a region of chr18 that harbours GATA6, an oncogene implicated in PC development (Extended Data Fig. 4b, top panel; Supplementary Fig. 1). Furthermore, 8% percent of events were observed on chr12. The consensus CN profile of these cases revealed a focal amplification in the region of KRAS (Extended Data Fig. 4b, middle panel). These amplifications commonly affected the mutant KRAS allele either directly when chromothripsis and breakage-fusion-bridge cycles were combined (Extended Data Fig. 4c, Pcsi_0290), or indirectly when polyploidization was subsequent to a chromothripsis event that removed the wildtype copy (Extended Data Fig. 4c, Pcsi_0356). There was significantly more chromothripsis in polyploids than in diploids, agreeing with greater genomic instability in the former subgroup (Extended Data Fig. 4d; p=0.013, Fisher’s exact test). We observed a worse overall survival for patients whose tumours had such an event (p=0.025, log-rank test; Supplementary Fig. 2). The high prevalence of chromothripsis in PC combined with the previously established link between chromothripsis and aggressive tumour behaviour in other cancers15,18, strongly implicate this mutational processes as a key part of PC development. Importantly, these data directly support the ‘catastrophic’ model of PC progression proposed by Real19 more than a decade ago.
We next performed a series of focused analyses using individual cases to illustrate the broad principles of the approach applied to the genome cohort. An important question arising from the above data is how much of the overall genomic instability in these tumours can be attributed to a single chromothripsis event. In Pcsi_0082, a tetraploid tumour, 63% of all CN changes could be attributed to five distinct chromothripsis events on chr8, chr13, chr15, chr16 and chr18 (Extended Data Fig. 5a). As chromothripsis is sustained and resolved in a single cell division20,21, we can approximate that more than half of the genomic damage in Pcsi_0082 was incurred from roughly five aberrant mitoses. Because Pcsi_0082 had undergone polyploidization, we were able to infer the timing of chromothripsis events relative to the genome doubling using the magnitude of the CN changes. Considering that chromothripsis occurs on one copy of DNA, the events sustained on chr13, chr16 and chr18 occurred after polyploidization because the CN changes on these chromosomes vary mostly by one (Extended Data Fig. 5a, ➁,
 ,
,
 ). By contrast, the chromothripsis on chr8 and chr15 occurred before polyploidization when the tumour was still diploid since these CN changes vary in multiples of two as a result of genome doubling (➀,
 ). Across all polyploid tumours, we observed that more than half (59%) of all chromothripsis events transpired before polyploidization (Chrom-AL solutions). This suggests that polyploidization further exacerbates the preexisting genomic instability in these tumours. Overall, many CN alterations in PC are acquired through rapid bursts of genetic change from a single or few cataclysmic events (Extended Data Fig. 5b) rather than a set of gradual events that accumulate overtime.
To investigate these mitotic cataclysms in disease progression, we analyzed the genomes of 15 distinct metastases from six cases (Extended Data 6; Supplementary results). In one case of fulminant metastatic progression (Pcsi_0410), eight distinct metastases were sequenced (progression timeline: Fig. 2a). All metastases were polyploid and also carried two distinct chromothripsis events: one on chr6, and another on chr8 that resulted in the striking amplification of c-MYC (20 – 40 copies) resembling a double minute or a variant of a cancer neochromosome22 (Fig. 2b,c; Extended Data Fig. 7a). The final CN in areas of loss of heterozygosity (LOH) in both chromothripsis events reside at 2 indicating they occurred before polyploidization (Extended Data Fig. 7b). Using FISH, we confirmed that the primary tumour was also polyploid and harboured chromothripsis (Fig. 2c; Supplementary Fig. 3a,b). Thus, we can infer that both chromothripsis events preceded polyploidization, and systemic spread of the disease ensued after polyploidization by a clone that harboured all three cataclysms (Fig. 2d). An additional chromothripsis event was detected on chr13 in the adrenal gland metastasis (Supplementary Fig. 3c), consistent with previous data on ongoing instability with metastatic progression14. Overall, we observed that chromothripsis was maintained in metastases if present in the primary tumour (Extended Data Fig. 6d). These data support that the bulk of genomic instability precedes metastases and is fostered early in tumourigenesis. If the dominant clonal lineage of the primary tumour arises from these types of mitotic errors, it leads to the hypothesis that intra-tumoural heterogeneity in PC10 follows this event, akin to the ‘big-bang’ model proposed for colon cancer23.
Figure 2. Characterization of genomic events in a patient with fulminant metastatic progression.
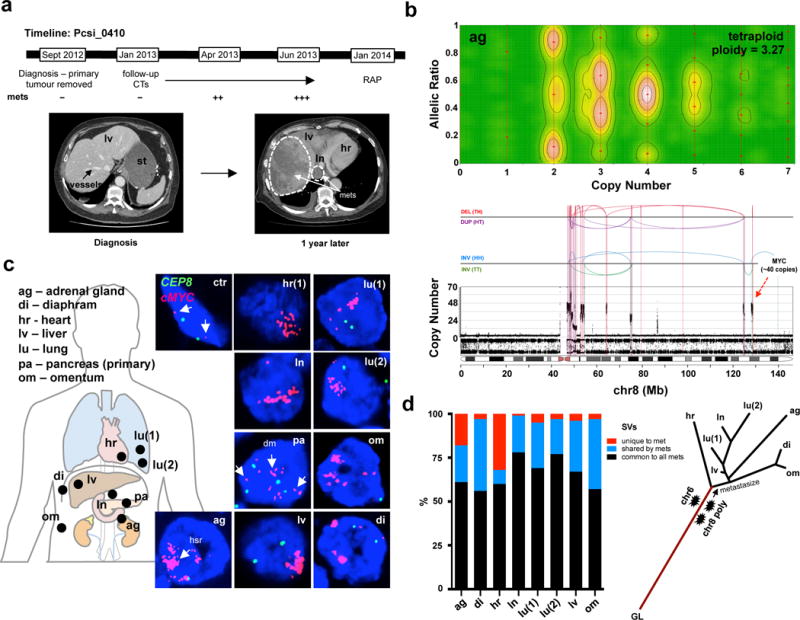
(a) Top: Progression timeline of patient Pcsi_0410. Bottom: Computerized tomography (CT) images of the abdomen at diagnosis (right) and one year later (left). No metastases are present in the liver at diagnosis. Within a year, the liver was decimated with metastases (right – white hashed line). At the rapid autopsy (RAP), 8 distinct metastases (see image in c) were harvested for sequencing. (b) Representative image of polyploidization (top) and chromothripsis (bottom) event from the adrenal gland metastasis. Analyses of all metastases are shown in Extended Data Figure 7. (c) FISH analysis c-MYC amplification in primary tumour and all metastases. Fibroblasts surrounding the tumour cells were used as a control (ctr - white arrows). Scattered nuclear staining in the primary tumour is consistent with presence of double minutes (dm – white arrow in pa). Homogenous staining areas (hsr – white arrow in ag) suggest reintegration into the genome22. (d) Proportion of SVs common to all (black), shared by two or more (blue), or unique to each metastases is shown on the left. CN and SVs were used to reconstruct radial phylogenetic tree of metastatic progression (right). The primary tumour was surgically removed one year before autopsy and fresh frozen material was not available for WGS. It is possible that branch lengths of the phylogenetic tree would vary if the primary tumour were included in this analysis. Lines are to scale with CN based clustering dendrogram presented in Supplementary Figure 15, with the exception of germline origin (GL) that is half the length.
The central tenet of the PanIN progression model posits that alterations in KRAS, CDKN2A, TP53 and SMAD4 are acquired as part of consecutive events. To directly test this model, we used DNA rearrangements to reconstruct the evolutionary history of allelic losses of tumour suppressors based on evidence that allelic alterations are the first hit in tumourigenesis (Supplementary results and Luttges et al5). Ashpc_0005, a tetraploid tumour, had a complex pattern of rearrangements involving chromosomes 9, 17 and 18 where CDKN2A, TP53 and SMAD4 reside (Fig. 3a). Several features of this rearrangement pattern facilitate the reconstruction of the mutational events in this tumour. First, there are two independent sets of rearrangements on chr9 (Fig. 3b; window 1 and window 2) that flank CDKN2A indicating that the two copies of this gene were lost as part of independent chromothripsis events. Second, there are distinct amplified DNA segments in window 2 (Fig. 3c) bounded by a specific type of rearrangement referred to as a fold-back inversion which leave behind steep CN drops (>2) indicative of a cycle of breakage-fusion-bridge (BFB)14. Three steep CN drops in window 2 are evidence of three cycles of BFB (Fig. 3c). Third, the intervening CN change (from 10 to 8) on one of these amplified segments, suggests that chromothripsis event followed three cycles of BFB and was likely the final major event that stabilized the derivative chromosome24 (Fig. 3c, second to last panel). Fourth, all CN changes in the event are in multiples of two, indicating that polyploidization followed the BFB cycles and chromothripsis (Fig. 3a). Finally, the CN change on chr18 from 3 to 1 (instead of 4 to 2) indicates that one wildtype copy of this chromosome was lost after polyploidization (Fig. 3a). The relative order of the first and the second copy losses of CDKN2A cannot be deciphered, but a single cataclysmic event involving BFB and chromothripsis knocked out a single copy of CDKN2A, TP53 and SMAD4 in synchronized fashion (Fig. 3d,e). Using rearrangements to reconstruct the sequence of events in a second case (Pcsi_0171) demonstrated a single chromothripsis simultaneously knocked out CDKN2A and SMAD4 (Extended Data Fig. 8). Notably, rearrangement patterns in 16% of cases (17/107) combined allelic alterations in KRAS, CDKN2A, TP53 and SMAD4 genes, predominantly as double knockouts (14% if only tumour suppressor genes are considered; Supplementary Fig. 4). In a proof of principle experiment using single cell sequencing in a tumour where rearrangements did not span these genes, we found an ancestral clone that harboured a SMAD4 loss but retained TP53 and CDKN2A (Extended Data Fig. 9). These data provide direct evidence that a number of cases do not conform to the accepted mutational hierarchy predicted by the PanIN progression model and warrant future investigation into the sequence of mutational events that give rise to these aggressive tumours.
Figure 3. Simultaneous knockout of driver genes in PC evolution.
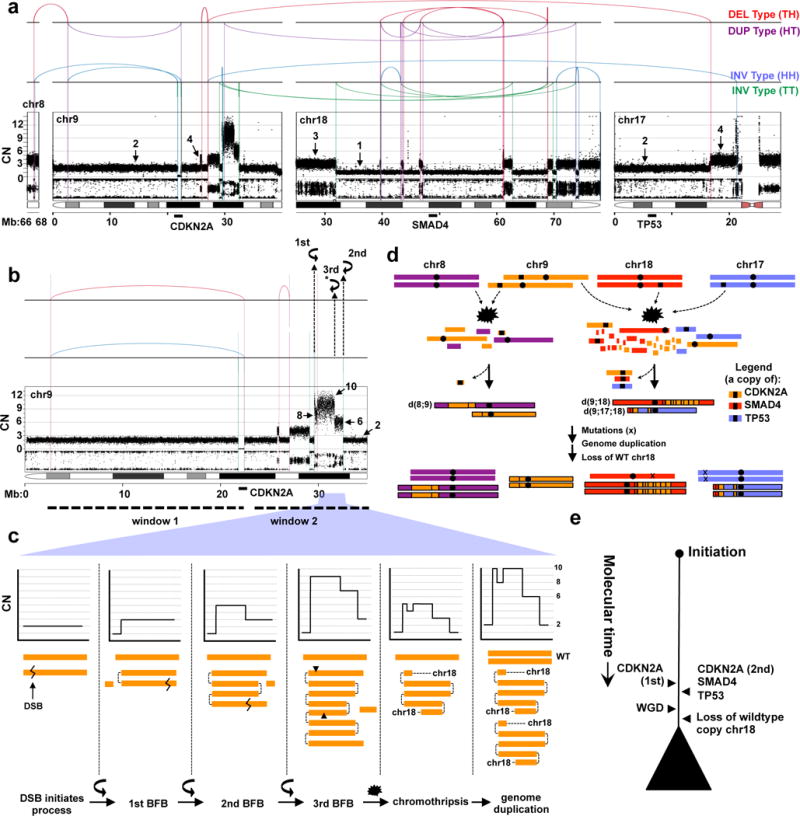
(a) Rearrangement and CN profile of a chromothripsis event in Ashpc_0005. The positions of CDKN2A, TP53, and SMAD4 genes are shown bottom of the plot. (b) A detailed view of chr9 with two distinct sets of rearrangements (window 1 and window 2), each responsible for the loss of one copy of CDKN2A. In window 2, three fold-back inversions (2 mapped and 1 unmapped*) highlighted with curved black arrows indicate three cycles of BFB. The final CN state of amplifications resulting from BFB cycles are shown on the plot (arrows). Zigzag symbol denotes DNA double strand break required to initiate a BFB cycle. (c) Schematic depiction of the three cycles of BFB that generated the final CN state of the amplifications shown in window 2 in b. (d) Temporal order of events derived from rearrangement profile for Ashpc_0005. The leftover TP53 and SMAD4 allele carry inactivating mutations (x). As both TP53 alleles carry the mutations (ploidy >1), this mutation was acquired prior to genome duplication. The relative timing of the SMAD4 mutation cannot be inferred because there is only one copy of this allele leftover and the mutation is fully clonal. (e) Summary of tumour evolution in Ashpc_0005.
Studies dating back two decades have been critical in molding the current perspective of how PC develops1. Key features of our data provide a framework to broaden this view. First, analysis on polyploid tumours revealed that most mutations accumulate when these tumours are still diploid. Assuming that preneoplastic cells are diploid, a fraction of these mutations must be preneoplastic. In line with this reasoning, Murphy et al. have demonstrated that preneoplasms in PC acquire extensive mutation burden but remain non-invasive25. This suggests a prolonged preneoplastic phase predates the onset of invasive disease and that CN events are crucial for transformation (Extended Data Fig. 10). These data carry implications for the design of future studies on early detection of PC11. Second, CN changes from chromothripsis are essentially clonal suggesting that these events are sustained early in tumourigenesis. The inactivation of well-known preneoplastic drivers (CDKN2A, TP53, SMAD4) en bloc strongly supports this notion and implies that chromothripsis can be a transforming event under the right gene context18,24. Our data also raise the possibility that some PCs may not progress through a linear series of PanIN lesions19. Why cataclysmic phenomena are so frequent in PC cannot be easily answered. Perhaps the extensive fibrosis in these tumours, known to suppress tumour development26,27, plays a role in applying a selective pressure that favours punctuated events over gradual ones. Lastly, PC is well known for its proclivity to metastasize. In mouse models of PC, genomic instability contributes to metastatic progression28. If chromothripsis is indeed the transforming event in some tumours, as our data suggests, a single event could thus confer a cell with both invasive and metastatic properties. In this scenario, there would be a very short latency period between the birth of the invasive clone and the ability of that clone to send volleys of metastatic seeds29,30. This fits the logic of why 80% of PC patients present with advanced disease at diagnosis. How these mutational processes contribute to disease progression and metastatic phenotype becomes a critical topic of investigation; such knowledge will be essential to guide more effective screening and therapeutic strategies for PC and conceivably for other aggressive tumour types as well.
METHODS
A full description of the methods is provided in the Supplementary Information file.
Extended Data
Extended Data Figure 1. Tumour enrichment and overview of somatic alterations in the cohort used in this study.
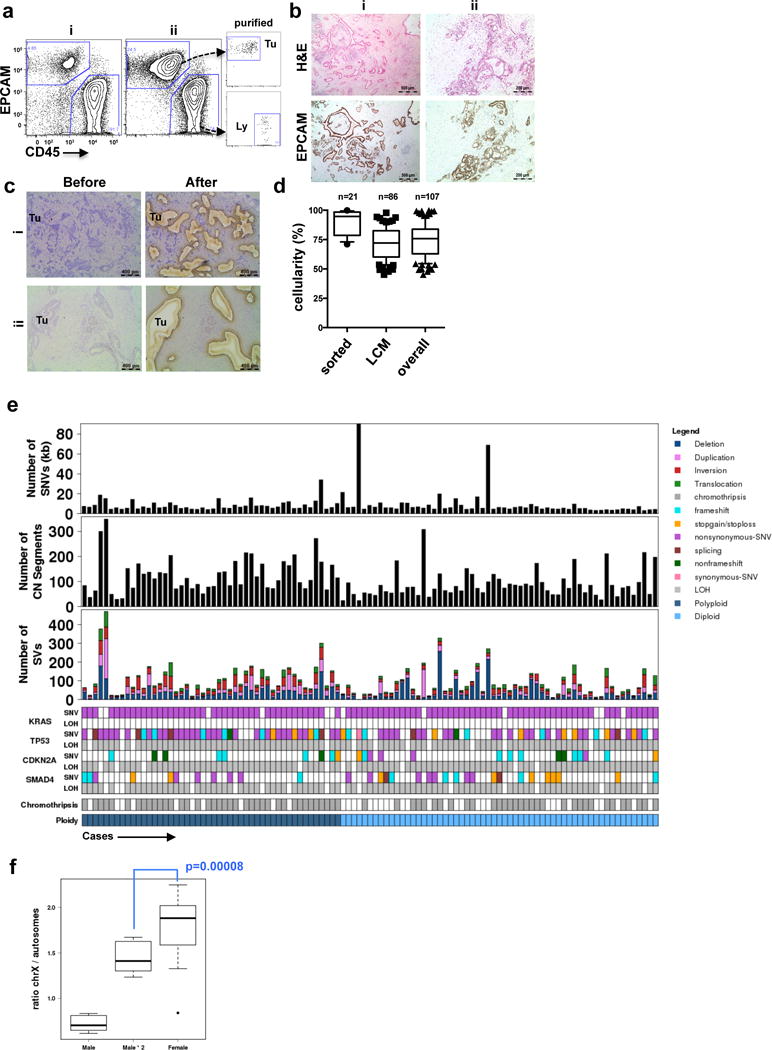
(a) Flow cytometric profiles of EpCAM and CD45 from two representatives cases of pancreas ductal adenocarcinoma (PDA) (i,ii). On the right, post-sort analysis of EpCAM+ cells (Tu) and CD45+ lymphocytes (Ly) demonstrates the high level of purity obtained from flow sorting. (b) Immunohistochemical analysis of formalin-fixed tumours using the EpCAM clone for flow sorting in a (H&E – hematoxylin and eosin). Two independent cases are shown (i,ii). (c) Profiles of hematoxylin stained sections of PDA before and after LCM from two representative cases (i,ii). (d) Box whisker plots showing median tumour cellularity of flow-sorted (n=21), LCM (n=86) and the total cohort (n=107). Dashed line depicts cellularity of bulk tumours that have not undergone enrichment. (e) Overview of somatic alterations of the cohort used in the study. (f) X chromosome mutation ratio in diploid PC genomes showing hypermutation on this chromosome in females. Males were corrected for single copy of X chromosome by doubling the raw value. p values were derived from t-test. A more detailed description of these data is provided in Supplementary results.
Extended Data Figure 2. CELLULOID validation.
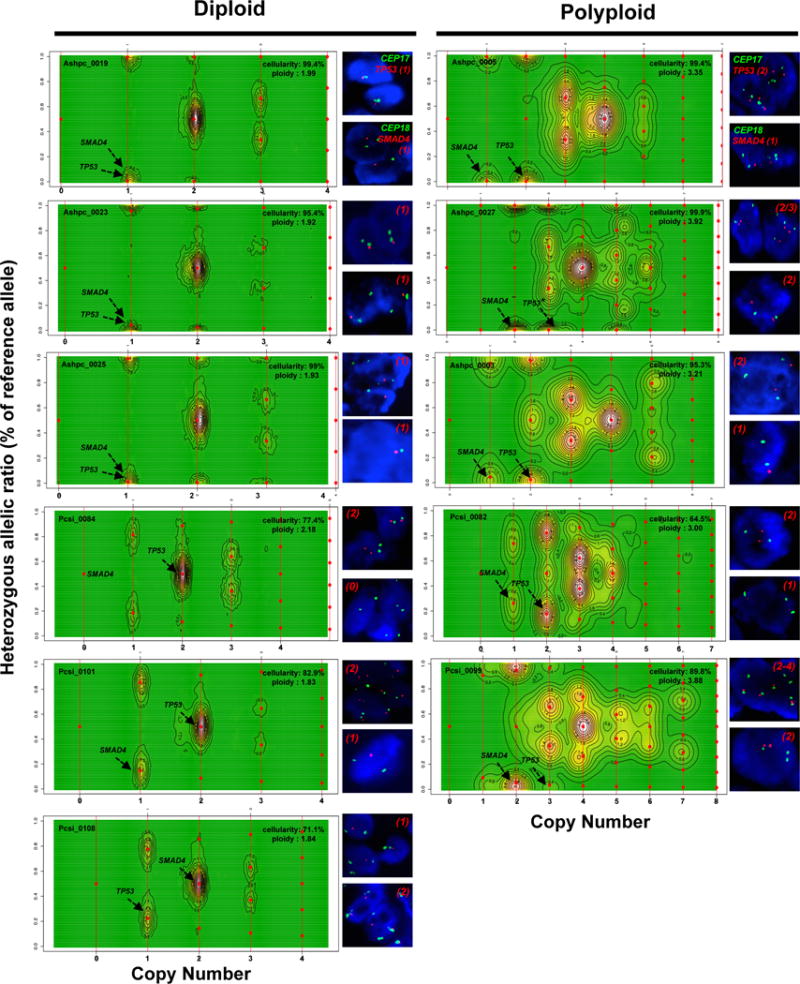
Copy number for common alterations (TP53, SMAD4 – shown by black arrow) was derived from ploidy estimates generated by CELLULOID. Six diploid and five polyploid tumours analyzed by FISH (shown on the right of each contour plot). In all cases, CN from CELLULOID ploidy estimates were confirmed. In Pcsi_0084 (diploid), CELLULOID predicted zero copies of SMAD4. The allelic ratio in this region was 50% (heterozygous) as only reads from normal cells spanned this region. In Ashpc_0027, both CELLULOID and FISH indicate that this tumour is polyploid. The CELLULOID plot demonstrates that there is a further subclonal amplification in TP53 from polyploid clone (copy state = 3.2 derived from one allele). FISH analysis shows tumour cells with 2 or 3 copies of TP53 supporting this is subclonal. Copy number by FISH for SMAD4 (top right of each plot) and TP53 (top right of each plot) is indicated in red.
Extended Data Figure 3. Tumour ploidy and genomic instability in PC.
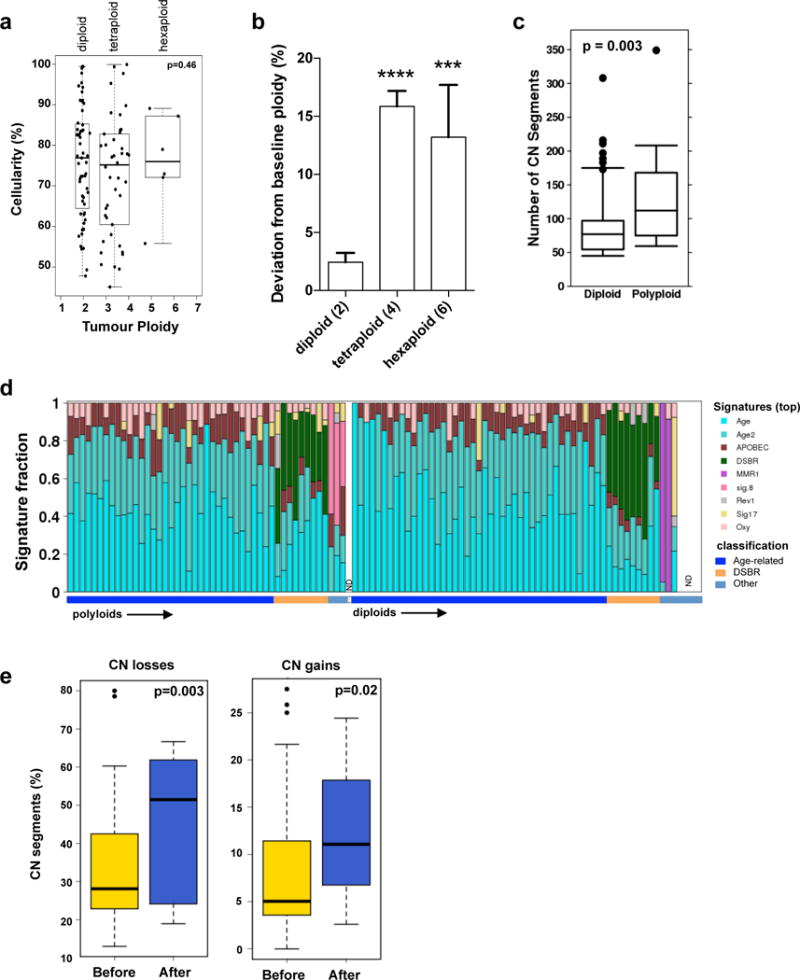
(a) Tumour ploidy and sample cellularity estimates are interconnected: while the ploidy of a tumour can always be doubled and still provide CN segments at integer levels (albeit only at even values), the estimate of cellularity would have to be decreased. Indeed, in order to maintain an allelic ratio at a given value, the proportion of tumour cells has to be reduced to compensate the higher number of copies in them (from a cellularity value t to a value t/(2-t) in the case of a doubling of the ploidy). A test can thus be designed to verify that ploidy estimates have not been systematically over- or underestimated, simply by comparing the distribution of cellularity estimates stratified by ploidy. p value was derived using Kruskal-Wallis test. (b) Deviation from baseline ploidy in diploids (ploidy = 2), tetraploids (ploidy = 4) and hexaploids (ploidy = 6) indicates dramatic loss of genomic material in polyploids. (c) Box whisker plots of total CN alterations in polyploid and diploid tumours. (d) Mutational signatures of the 107 genomes used in this study. The signatures were derived using the trinucleotide mutation context as previously published17. The proportion of individual signature operative in each tumour is shown in the bar plot. The overall classification of each case is indicated on the bottom. Signatures of polyploidy tumours is shown on the left versus diploids is shown on the right. (ND – not done – 1 polyploid and 4 diploid cases). Detailed analysis of mutational signatures in PDA is covered in another manuscript under review (Connor et al.) (e) Percentage of CN losses (left) and gains (right) that occurred before (yellow) or after (blue) genome duplication for each polyploid tumour. Box whisker plots depict median +/− 10–90 percentile. p values were derived using t-test.
Extended Data Figure 4. Characterization of chromothripsis events in PC.
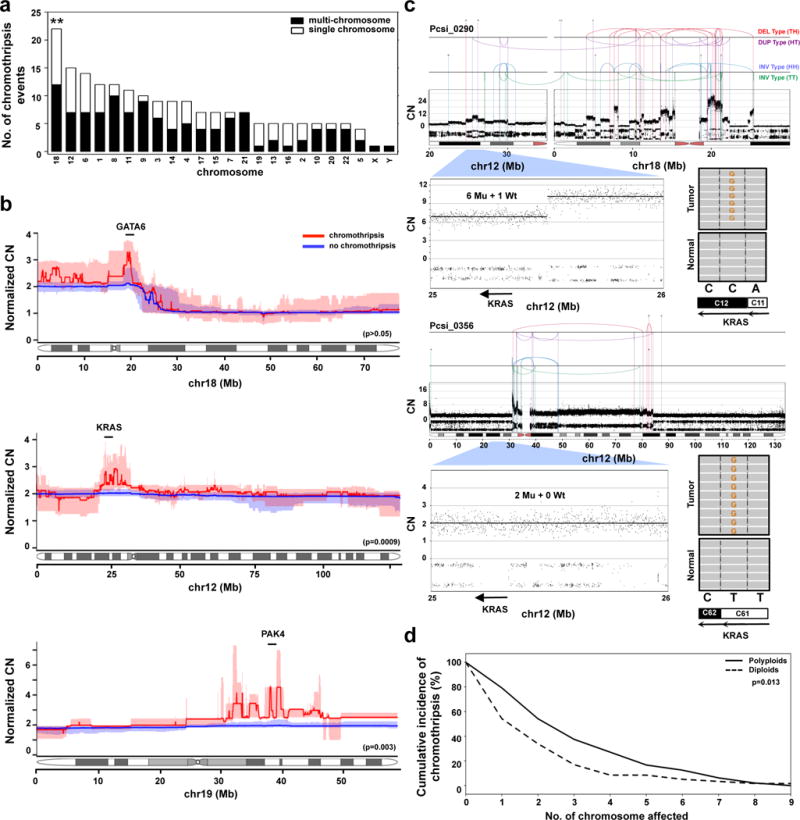
(a) The distribution of chromothripsis events across the genome (single chromosome – white; multi-chromosome – black). **, p<0.001 (Monte Carlo Sampling, Supplementary methods). (b) The specific effects of chromothripsis on the CN of chr18 (top, n=22), chr12 (middle, n=15), and chr19 (bottom, n=5). Statistical differences in CN between the groups were performed using Wilcoxon test using 10kb bins that covered GATA6 (chr18), KRAS (chr12) and PAK4 (chr19) genes (description of PAK4 event is covered in supplementary results). CN profiles of polyploids were adjusted according to tumour ploidy to allow comparison against diploids (referred to as Normalized CN on the y-axis). Interquartile ranges for chromothripsis cases are indicated in pale red, and for non-chromothripsis cases in pale blue. (c) Two cases of chromothripsis resulting in the amplification of the mutant KRAS allele. In Pcsi_0290, the mutant allele was amplified as part of a multi-chromosomal with chr18 (top). In Pcsi_0356, the chromothripsis event was coopted with cycles of BFB to knockout the wildtype allele (bottom). The absolute CN of the locus encompassing KRAS and mutation is shown for each case. (d) Cumulative incidence of chromothripsis events in polyploid and diploid tumours (p=0.013, Fisher’s exact test).
Extended Data Figure 5. Most CN alterations arise from individual chromothripsis events.
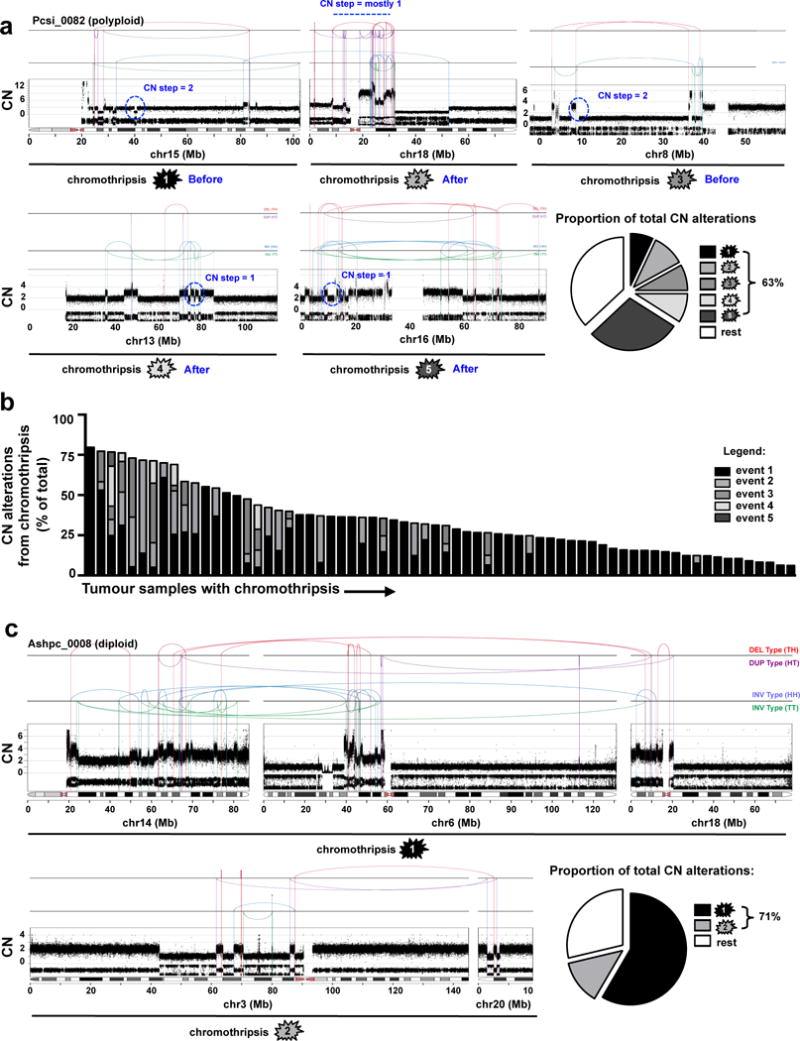
(a) In Pcsi_0082, five distinct chromothripsis events on chr15 (top, ➀), chr18 (top, ➁), chr8 (top, ➂), chr13 (bottom, ➃), and chr16 (bottom, ➄) are displayed. CN steps on chr15 (➀), chr8 (➁) are 2 or greater indicating that these events occurred before polyploidization. Single CN steps on chr18 (➁), chr13 (➃) and chr16 (➄) indicate that these events were sustained after polyploidization. The single rearrangement between chr15 and chr18 appears to be independent from the chromothripsis on chr18. Pie graphs depict the proportion of CN alterations derived from each chromothripsis event. (b) Distribution of CN alterations due to chromothripsis for all cases where such an event was detected by Chrom-AL. (c) In Ashpc_0008, two multi-chromosomal chromothripsis events joining chr14, chr6, chr18 (top - ➀), and chr3, chr20 (bottom - ➁) are shown (discussed in supplementary results).
Extended Data Figure 6. Characterization of chromothripsis and polyploidy in metastases.
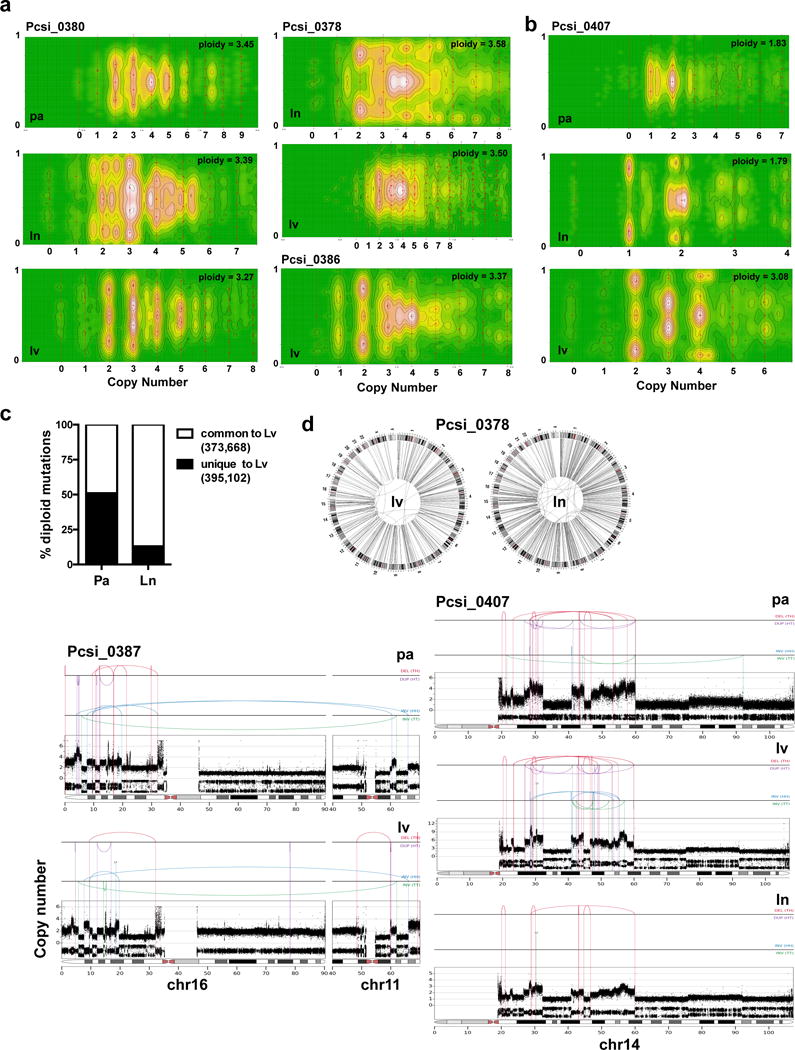
(a) CELLULOID plots illustrating polyploidy in metastases. In Pcsi_0380, the primary tumour was directly available for analysis. Similarly to Pcsi_0378, multiple metastases were polyploid suggesting primary tumour was also polyploid. The primary tumour was unavailable for sequencing in this case. (b) A case (Pcsi_0407) with discordant ploidy amongst different metastases. (c) Percent of diploid mutations from liver metastases that are shared (white) or unique (black) in comparison to the primary tumour or the lymph node metastasis. (d) Plots of chromothripsis events in metastases. pa – primary tumour; lv – liver; ln – lymph node.
Extended Data Figure 7. Chromothripsis and polyploidy in Pcsi_0410 (accompany to Figure 2).
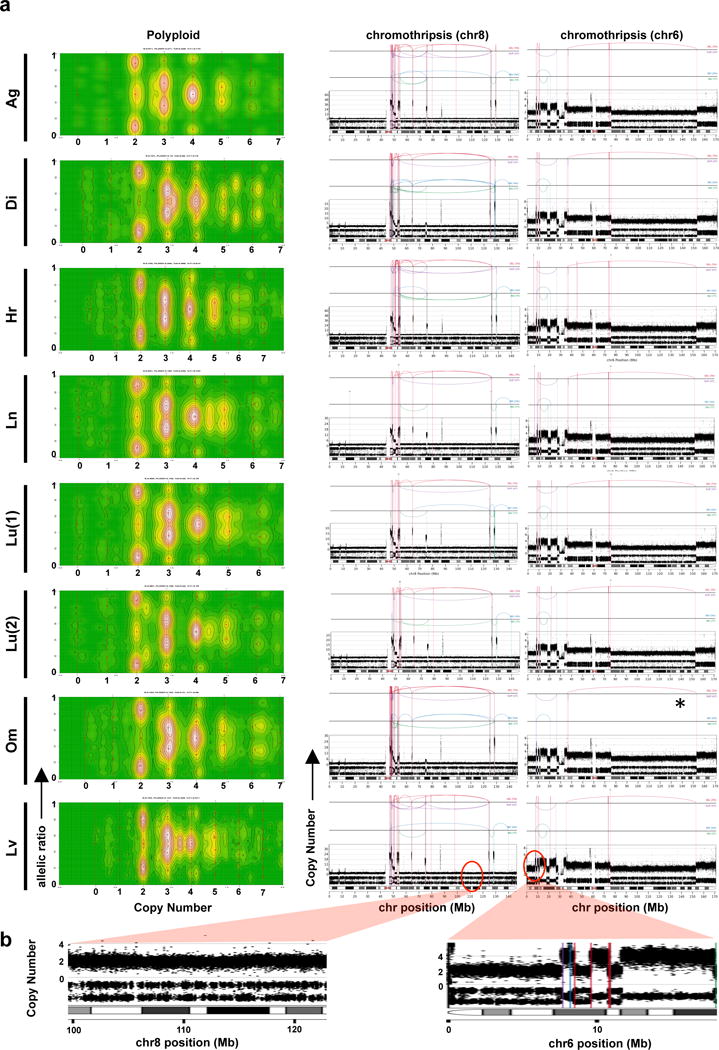
(a) CELLULOID (left) and chromothripsis plots (middle and right panels) of the different metastases from a patients with fulminant metastatic progression. (b) CN and LOH from chr8 (left) and chr6 (right) chromothripsis events indicate that these events were sustained before polyploidization.
Extended Data Figure 8. Case of a simultaneous loss of CDKN2A and SMAD4 due to a chromothripsis event.
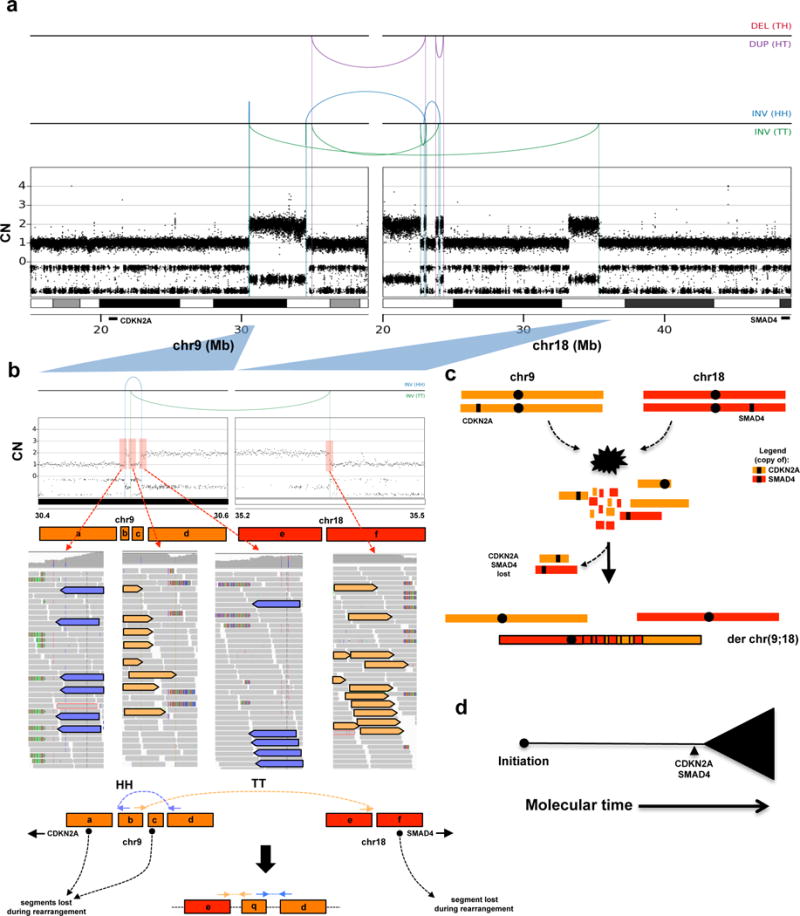
(a) Rearrangement and CN profile of a multi-chromosome chromothripsis event between chr9 and chr18 (Pcsi_0171). (b) Detailed view of the two inversions (one head-head –HH, the other tail-tail – TT) in the chromothripsis event that resulted in the concurrent loss of CDKN2A and SMAD4. (c) Schematic depiction of the temporal order of events derived from the rearrangement profile shown in A. (d) Summary of tumour evolution in Pcsi_0171. A more detailed description of Pcsi_0171 is provided in Supplementary results.
Extended Data Figure 9. Reconstruction of the evolutionary events in a case where rearrangements did not span the classical PC drivers using single cell sequencing.
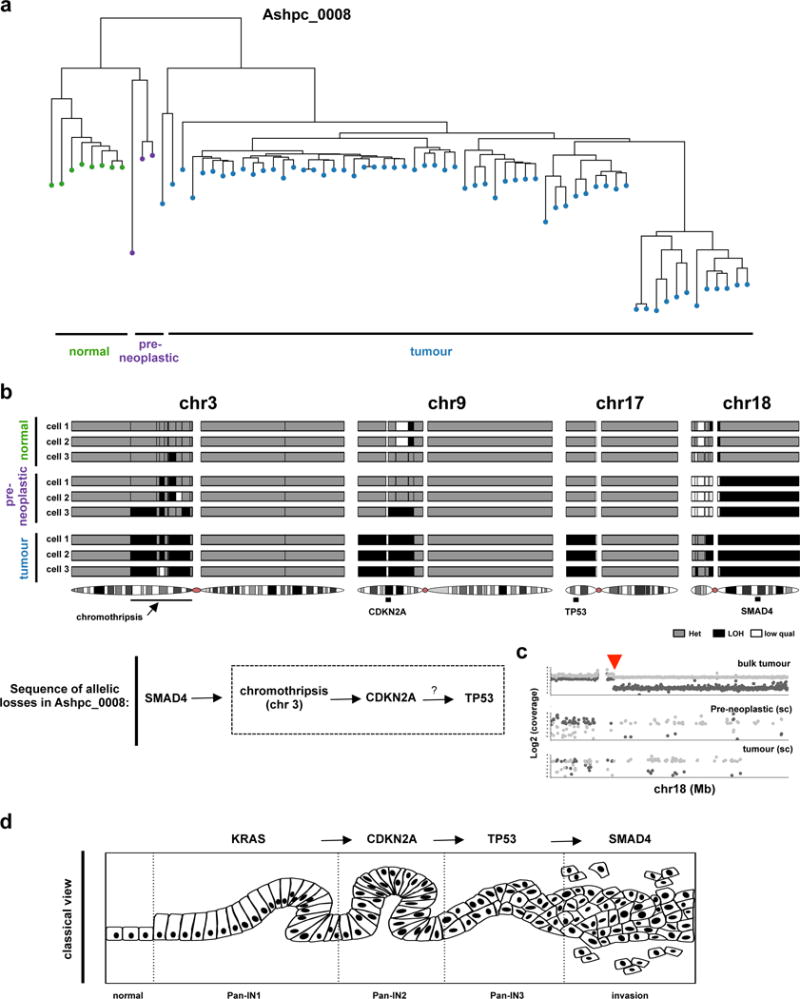
(a) Fresh tumour specimen (Ashpc_0008) was dissociated and single tumour cells were deposited using flow sorting. 96 single cells were whole genome amplified using REPLI-g and paired end whole genome sequencing was performed using HiSeq 2500. Single cells were sequenced to a median whole genome depth of 3.9X (Supplementary Fig. 18). Only cells with enough whole genome coverage (n=70) were used in the analysis. This sequencing depth allowed us to track heterozygous SNPs across the whole genome in single cells. Using this methodology, we were able to follow LOH events across the whole genome in single cells with high concordance with bulk tumour (Supplementary Fig. 18). Hierarchical clustering based on LOH events across the whole genome was performed and found 4 independent cell clusters. (b) Specific LOH events on chr3, chr9, chr17 and chr18 are shown from representative single cells. The chromothripsis event on chr3 is shown in greater detail in Fig. 2a. Summary of the sequence of allelic losses is shown on the bottom. Supportive data that allelic losses precede mutational inactivation is shown in Supplementary Figure 13 and Supplementary Figure 14. (c) Representative plot of the shared chromosomal breakpoint on chr18 on the bulk (top), preneoplastic single cell (middle) and tumour single cell (bottom). (d) Classical model of pancreas tumour progression.
Extended Data Figure 10. Theoretical model of PC tumour progression.
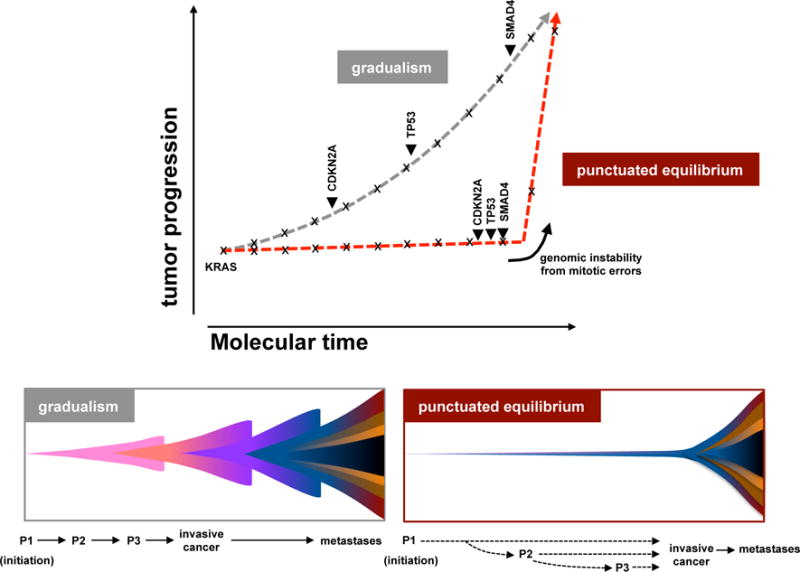
The classical model of tumour evolution driven by a gradual pace (grey), and an alternate model driven by punctuated equilibrium (red). In gradualism, there is a period of latency between driver alterations that lead to tumour development, and multiple, independent transforming events are required for tumour development (top – grey line; bottom left). In punctuated equilibrium, tumour development can be divided into two major events: the cancer-initiating event and cancer-transforming event (top – red; bottom right). Under this model, most mutations (indicated with x) would accrue in an extended phase of preneoplastic tumour development. Transformation, likely due to a genomic instability from copy number changes (arrow heads) ensuing from cataclysmic event, would rapidly lead to invasive cancer and metastases. Classical drivers (KRAS, CDKN2A, TP53, SMAD4) from the PanIN progression model are overlaid onto these models. Theoretical PanIN stages are shown as P1–P3.
Supplementary Material
Acknowledgments
We would like to thank N. Simard and Sherry Zhao and members of the Sickkids-UHN Flow facility for technical support. Funding sources for this study include grants to the Pancreatic Cancer Sequencing Initiative program from the Ontario Institute for Cancer Research (OICR), through generous support from the Ontario Ministry of Research and Innovation, the Canada Foundation for Innovation; Research award to FN from the OICR and the Canadian Institutes for Health Research (CIHR); Canadian Friends of the Hebrew University, the SMGS Family Foundation, NCI grant P50 CA102701 (Mayo Clinic SPORE in Pancreatic Cancer) and NCI grant R01 CA97075 (Pancreatic Cancer Genetic Epidemiology Consortium). FN is supported by a fellowship award from CIHR and is a recipient of a scholar’s research award from the Ontario Institute of Cancer Research (OICR), through generous support from the Ontario Ministry of Research and Innovation. GZ is a Clinician-Scientist of the Fonds de la Recherche en Sante du Quebec. PJC is a Wellcome Trust Senior Clinical Fellow. TJH, LDS, JDM and SG are recipients of Senior or Clinician-Scientist Awards from the Ontario Institute for Cancer Research.
Footnotes
AUTHOR CONTRIBUTIONS: Data analysis and interpretation – FN, ML, YL, MCSY, GWW, AAC, FXR, PCJ, SG, TJH; tumour enrichment – SBL, IL, FN; Pathological assessment: TW, MST, JMSB, MHR, SHB; genomics – RED, AMKB, KN, JCK, LT, NB, DP, LH, EI, GHJ, JJ, LGTJ, JDM, LDS, LIS, LIH, JED, CKY, TB, LBA; FISH – OL; Celluloid – ML; Single cell analysis – GWW, JTS, FN. Sample acquisition, annotation and collection from institutes external to UHN – GMP, MAH, GZ, CL; Sample acquisition, annotation and collection from UHN: JMW, AB, SG, SPC; Study design – FN, TJH, SG; manuscript writing and preparation – FN; manuscript editing – ML, SG, FXR, JED, PCJ, TJH, SG.
References
- 1.Hruban RH, Goggins M, Parsons J, Kern SE. Progression model for pancreatic cancer. Clinical cancer research: an official journal of the American Association for Cancer Research. 2000;6:2969–2972. [PubMed] [Google Scholar]
- 2.Moskaluk CA, Hruban RH, Kern SE. p16 and K-ras gene mutations in the intraductal precursors of human pancreatic adenocarcinoma. Cancer research. 1997;57:2140–2143. [PubMed] [Google Scholar]
- 3.Wilentz RE, et al. Inactivation of the p16 (INK4A) tumor-suppressor gene in pancreatic duct lesions: loss of intranuclear expression. Cancer research. 1998;58:4740–4744. [PubMed] [Google Scholar]
- 4.Wilentz RE, et al. Loss of expression of Dpc4 in pancreatic intraepithelial neoplasia: evidence that DPC4 inactivation occurs late in neoplastic progression. Cancer research. 2000;60:2002–2006. [PubMed] [Google Scholar]
- 5.Lüttges J, et al. Allelic loss is often the first hit in the biallelic inactivation of the p53 and DPC4 genes during pancreatic carcinogenesis. The American journal of pathology. 2001;158:1677–1683. doi: 10.1016/S0002-9440(10)64123-5. [DOI] [PMC free article] [PubMed] [Google Scholar]
- 6.Martincorena I, et al. Tumor evolution. High burden and pervasive positive selection of somatic mutations in normal human skin. Science. 2015;348:880–886. doi: 10.1126/science.aaa6806. [DOI] [PMC free article] [PubMed] [Google Scholar]
- 7.Cooper CS, et al. Analysis of the genetic phylogeny of multifocal prostate cancer identifies multiple independent clonal expansions in neoplastic and morphologically normal prostate tissue. Nature genetics. 2015 doi: 10.1038/ng.3221. [DOI] [PMC free article] [PubMed] [Google Scholar]
- 8.Ross-Innes CS, et al. Whole-genome sequencing provides new insights into the clonal architecture of Barrett’s esophagus and esophageal adenocarcinoma. Nature genetics. 2015 doi: 10.1038/ng.3357. [DOI] [PMC free article] [PubMed] [Google Scholar]
- 9.Stachler MD, et al. Paired exome analysis of Barrett’s esophagus and adenocarcinoma. Nature genetics. 2015 doi: 10.1038/ng.3343. [DOI] [PMC free article] [PubMed] [Google Scholar]
- 10.Yachida S, et al. Distant metastasis occurs late during the genetic evolution of pancreatic cancer. Nature. 2010;467:1114–1117. doi: 10.1038/nature09515. [DOI] [PMC free article] [PubMed] [Google Scholar]
- 11.Chari ST, et al. Early detection of sporadic pancreatic cancer: summative review. Pancreas. 2015;44:693–712. doi: 10.1097/MPA.0000000000000368. [DOI] [PMC free article] [PubMed] [Google Scholar]
- 12.Eldredge N, Gould SJ. In: Models in Paleobiology. Thomas JM, editor. Freeman, Cooper and Company; 1972. pp. 82–115. [Google Scholar]
- 13.Waddell N, et al. Whole genomes redefine the mutational landscape of pancreatic cancer. Nature. 2015;518:495–501. doi: 10.1038/nature14169. [DOI] [PMC free article] [PubMed] [Google Scholar]
- 14.Campbell PJ, et al. The patterns and dynamics of genomic instability in metastatic pancreatic cancer. Nature. 2010;467:1109–1113. doi: 10.1038/nature09460. [DOI] [PMC free article] [PubMed] [Google Scholar]
- 15.Stephens PJ, et al. Massive Genomic Rearrangement Acquired in a Single Catastrophic Eventduring Cancer Development. 2011;144:27–40. doi: 10.1016/j.cell.2010.11.055. [DOI] [PMC free article] [PubMed] [Google Scholar]
- 16.Zack TI, et al. Pan-cancer patterns of somatic copy number alteration. Nature genetics. 2013;45:1134–1140. doi: 10.1038/ng.2760. [DOI] [PMC free article] [PubMed] [Google Scholar]
- 17.Alexandrov LB, et al. Signatures of mutational processes in human cancer. Nature. 2013;500:415–421. doi: 10.1038/nature12477. [DOI] [PMC free article] [PubMed] [Google Scholar]
- 18.Rausch T, et al. Genome Sequencing of Pediatric Medulloblastoma Links Catastrophic DNARearrangements with TP53 Mutations. 2012;148:59–71. doi: 10.1016/j.cell.2011.12.013. [DOI] [PMC free article] [PubMed] [Google Scholar]
- 19.Real FX. A ‘catastrophic hypothesis’ for pancreas cancer progression. Gastroenterology. 2003;124:1958–1964. doi: 10.1016/s0016-5085(03)00389-5. [DOI] [PubMed] [Google Scholar]
- 20.Zhang CZ, et al. Chromothripsis from DNA damage in micronuclei. Nature. 2015 doi: 10.1038/nature14493. [DOI] [PMC free article] [PubMed] [Google Scholar]
- 21.Maciejowski J, Li Y, Bosco N, Campbell PJ, de Lange T. Chromothripsis and Kataegis Induced by Telomere Crisis. Cell. 2015;163:1641–1654. doi: 10.1016/j.cell.2015.11.054. [DOI] [PMC free article] [PubMed] [Google Scholar]
- 22.Garsed DW, et al. The architecture and evolution of cancer neochromosomes. Cancer cell. 2014;26:653–667. doi: 10.1016/j.ccell.2014.09.010. [DOI] [PubMed] [Google Scholar]
- 23.Sottoriva A, et al. A Big Bang model of human colorectal tumor growth. Nature genetics. 2015 doi: 10.1038/ng.3214. [DOI] [PMC free article] [PubMed] [Google Scholar]
- 24.Li Y, et al. Constitutional and somatic rearrangement of chromosome 21 in acute lymphoblastic leukaemia. Nature. 2014;508:98–102. doi: 10.1038/nature13115. [DOI] [PMC free article] [PubMed] [Google Scholar]
- 25.Murphy SJ, et al. Genetic alterations associated with progression from pancreatic intraepithelial neoplasia to invasive pancreatic tumor. Gastroenterology. 2013;145:1098–1109 e1. doi: 10.1053/j.gastro.2013.07.049. [DOI] [PMC free article] [PubMed] [Google Scholar]
- 26.Özdemir BC, et al. Depletion of carcinoma-associated fibroblasts and fibrosis induces immunosuppression and accelerates pancreas cancer with reduced survival. Cancer cell. 2014;25:719–734. doi: 10.1016/j.ccr.2014.04.005. [DOI] [PMC free article] [PubMed] [Google Scholar]
- 27.Rhim AD, et al. Stromal elements act to restrain, rather than support, pancreatic ductal adenocarcinoma. Cancer cell. 2014;25:735–747. doi: 10.1016/j.ccr.2014.04.021. [DOI] [PMC free article] [PubMed] [Google Scholar]
- 28.Hingorani SR, et al. Trp53R172H and KrasG12D cooperate to promote chromosomal instability and widely metastatic pancreatic ductal adenocarcinoma in mice. Cancer cell. 2005;7:469–483. doi: 10.1016/j.ccr.2005.04.023. [DOI] [PubMed] [Google Scholar]
- 29.Haeno H, et al. Computational modeling of pancreatic cancer reveals kinetics of metastasis suggesting optimum treatment strategies. Cell. 2012;148:362–375. doi: 10.1016/j.cell.2011.11.060. [DOI] [PMC free article] [PubMed] [Google Scholar]
- 30.Rhim AD, et al. EMT and dissemination precede pancreatic tumor formation. Cell. 2012;148:349–361. doi: 10.1016/j.cell.2011.11.025. [DOI] [PMC free article] [PubMed] [Google Scholar]
Associated Data
This section collects any data citations, data availability statements, or supplementary materials included in this article.


