ABSTRACT
Macroautophagy/autophagy defects have been identified as critical factors underlying the pathogenesis of neurodegenerative diseases. The roles of the bioactive signaling lipid sphingosine-1-phosphate (S1P) and its catabolic enzyme SGPL1/SPL (sphingosine phosphate lyase 1) in autophagy are increasingly recognized. Here we provide in vitro and in vivo evidence for a previously unidentified route through which SGPL1 modulates autophagy in neurons. SGPL1 cleaves S1P into ethanolamine phosphate, which is directed toward the synthesis of phosphatidylethanolamine (PE) that anchors LC3-I to phagophore membranes in the form of LC3-II. In the brains of SGPL1fl/fl/Nes mice with developmental neural specific SGPL1 ablation, we observed significantly reduced PE levels. Accordingly, alterations in basal and stimulated autophagy involving decreased conversion of LC3-I to LC3-II and increased BECN1/Beclin-1 and SQSTM1/p62 levels were apparent. Alterations were also noticed in downstream events of the autophagic-lysosomal pathway such as increased levels of lysosomal markers and aggregate-prone proteins such as APP (amyloid β [A4] precursor protein) and SNCA/α-synuclein. In vivo profound deficits in cognitive skills were observed. Genetic and pharmacological inhibition of SGPL1 in cultured neurons promoted these alterations, whereas addition of PE was sufficient to restore LC3-I to LC3-II conversion, and control levels of SQSTM1, APP and SNCA. Electron and immunofluorescence microscopy showed accumulation of unclosed phagophore-like structures, reduction of autolysosomes and altered distribution of LC3 in SGPL1fl/fl/Nes brains. Experiments using EGFP-mRFP-LC3 provided further support for blockage of the autophagic flux at initiation stages upon SGPL1 deficiency due to PE paucity. These results emphasize a formerly overlooked direct role of SGPL1 in neuronal autophagy and assume significance in the context that autophagy modulators hold an enormous therapeutic potential in the treatment of neurodegenerative diseases.
KEYWORDS: α-synuclein/SNCA, amyloid precursor protein, autophagy, lysosomes, neuropathology, phosphatidylethanolamine, sphingosine-1-phosphate lyase
Introduction
Autophagy is crucial for the survival of postmitotic cells with high energy demands like neurons.1 It is used by neurons not only for homeostatic and waste-recycling functions but also as an effective strategy to eliminate aggregate-prone proteins that are normally diluted by cell division in mitotic cells.2 Accordingly, defective autophagy is often associated with neuronal dysfunction, and enhancing autophagy in neurons is currently being focused on as an approach to combat neurodegenerative diseases.2-4
Sphingosine-1-phosphate (S1P), sphingosine and ceramide are important metabolites of the sphingolipid network that emerged as bioactive signaling molecules mediating critical cellular functions.5 Particularly, the diverse roles of S1P in autophagy are increasingly being recognized.6,7 Recent reports have deciphered how S1P-related autophagic pathways might affect neurodegeneration.8 The dynamic balance of S1P, which is maintained by sphingosine kinases (SPHK1/SK1 and SPHK2/SK2) catalyzing its formation, and S1P phosphatases (SGPP1/SPP1 and SGPP2/SPP2) as well as SGPL1 (sphingosine phosphate lyase 1), catalyzing its degradation, is a critical determinant of S1P-associated cellular functions.9 Hence studying the enzymes regulating S1P balance is a promising route to understand S1P-regulated autophagic mechanisms.8,10,11 In neurons, cytosolic SPHK1 responsible for S1P generation enhances flux through autophagy, whereas S1P-degrading enzymes such as SGPPs or SGPL1 decrease this flux.8 In non-neuronal cells SPHK1 (S1P)-induced autophagy is nutrient sensitive and characterized by the inhibition of MTOR (mechanistic target of rapamycin [serine/threonine kinase]).11 Alternatively, depletion of SGPP1/SPP1 induced autophagy even in the presence of nutrients via an MTOR-independent mechanism.10 Notably, several studies have described extrinsic S1P acting via its receptors as an inhibitor of autophagy through activation of the MTOR pathway.6,12
Another important aspect of S1P-mediated autophagy regulation, which has not been investigated so far, is the role of the S1P degradation product ethanolamine phosphate. The latter can be converted to CDP-ethanolamine by PCYT2 (phosphate cytidylyltransferase 2, ethanolamine) to be incorporated subsequently into phosphatidylethanolamine (PE).13 PE functions as an anchor to phagophore membranes for LC3. This PE anchor is added to LC3-I in a post-translational lipidation reaction.14 The detailed mechanism involved in the regulation of autophagy by PE linked via SGPL1 to S1P metabolism is yet to be explored. We recently generated a new mouse model (SGPL1fl/fl/Nes) with developmental neural specific ablation of SGPL1 in the brain, which causes a considerable accumulation of S1P and its metabolic precursor sphingosine with no changes in ceramide and sphingomyelin in the brain.15 Here we report that neural-targeted depletion of SGPL1 causes cognitive deficits and a decrease of brain PE content along with impaired autophagy and a consequent accumulation of neurodegenerative biomarkers in the brains of SGPL1fl/fl/Nes mice. We further document that these effects are due to PE paucity leading to the blockage of autophagic flux at the early stages of phagophore formation.
Results
Reduced PE levels and autophagy alterations in the brain of SGPL1fl/fl/Nes mice
SGPL1 catalyzes the irreversible cleavage of S1P yielding hexadecenal and ethanolamine phosphate (EAP) in the final step of sphingolipid catabolism.16 The latter is used as a biosynthetic precursor for PE formation.13 It was therefore not surprising that the content of PE was reduced in brains lacking SGPL1 activity (Fig. 1). The reduction of PE levels in both hippocampus and cerebellum of SGPL1fl/fl/Nes mice was significant at all ages studied (3-, 9- and 12 mo-old) excluding the weaning period at which no changes between controls and SGPL1-deficient mice could be detected (Fig. 1). Accordingly, the amount of EAP was also slightly but significantly decreased in SGPL1-deficient brains (Fig. 1).
Figure 1.
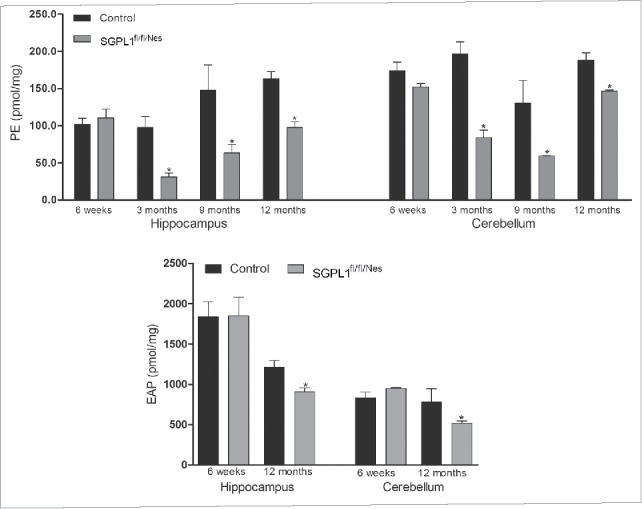
PE and EAP content is significantly decreased in SGPL1-deficient brains. Mean ± SEM of PE (n ≥ 3; unpaired Student t test, Ph3m = 0.041, Ph9m = 0.0458, Ph12m = 0.0326, Pc3m = 0.0284, Pc9m = 0.0474, Pc12m = 0.0471) and EAP (n ≥ 3; unpaired Student t test, Ph12m = 0.0277, Pc12m = 0.0828) were determined by LC/MS/MS in the hippocampus and cerebellum of control and SGPL1fl/fl/Nes mice at the indicated ages and calculated per mg of tissue.
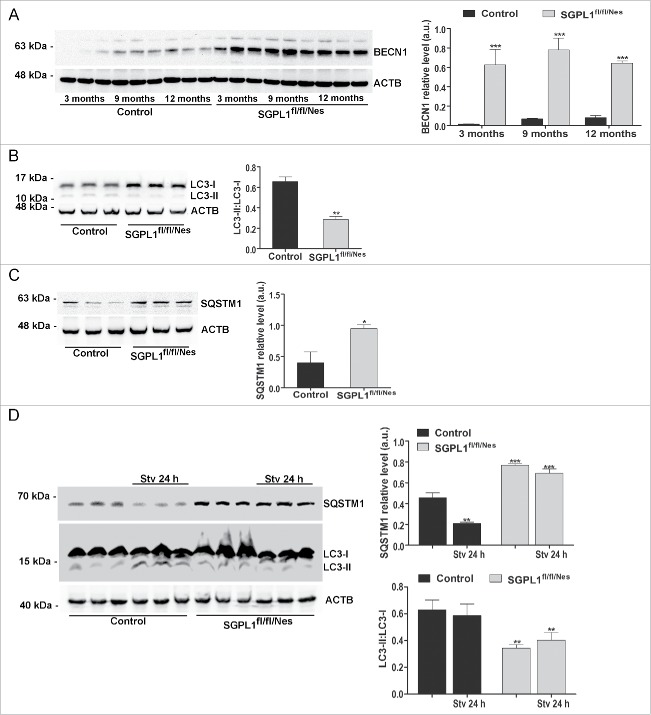
There is convincing experimental evidence for the essential role of PE in the regulation of autophagy.14 We, therefore, aimed to investigate whether and how autophagy is affected in brains with neural-targeted Sgpl1 deletion. First, levels of different autophagy markers were assessed in brains of control and SGPL1fl/fl/Nes mice at different ages. We found increased expression of BECN1, which is involved in the initiation of autophagosome formation, thus suggesting an elevation of autophagic activity (Fig. 2A). However, the conversion of LC3-I into LC3-II was considerably hampered in the absence of SGPL1 activity suggesting an impairment of the autophagic flux (Fig. 2B). Along these lines, the specific autophagic substrate SQSTM1 (sequestosome 1) was significantly increased in SGPL1fl/fl/Nes brains (Fig. 2C). To assess the effect of SGPL1 ablation on stimulated autophagy, mice were starved for 24 h.
Figure 2.
Autophagy is altered in SGPL1-deficient brains. (A to C) Western blots and graphs showing mean ± SEM in brain extracts from control and SGPL1fl/fl/Nes mice for: (A) BECN1 at the indicated ages (n ≥ 3; 2-way ANOVA, Pgenotype = 0.0004), (B) LC3-I and LC3-II at 12 mo of age (n ≥ 3; unpaired Student t test, PLC3 = 0.0025) and (C) SQSTM1 at 12 mo of age (n ≥ 3; unpaired Student t test, PSQSTM1 = 0.0412). (D) Immunoblots of SQSTM1 and LC3 from hippocampi of control and SGPL1fl/fl/Nes mice that were fed or starved (Stv) for 24 h (n ≥ 3; 2-way ANOVA, PSQSTM1, genotype < 0.0001, PSQSTM1, stv 24 h = 0.0011, PLC3, genotype = 0.0068). Western blots of ACTB are shown as loading control. a.u., arbitrary units.
Starvation indeed stimulated autophagy in control mice as revealed by a decline of SQSTM1 expression and an increase of LC3-I and LC3-II (Fig. 2D). Yet no improvement of autophagy was obtained in SGPL1-deficient mice after starvation. Expression of SQSTM1 remained elevated and the ratio of LC3-II:LC3-I persisted at low values (Fig. 2D), indicating that Sgpl1 deletion alters also stimulated autophagy.
Electron microscopy analysis in the hippocampus of control and SGPL1fl/fl/Nes mice of different ages indicated an early (already evident at 3 mo of age) and significant decrease of autolysosome-like structures in SGPL1-deficient neurons (Fig. 3A). These were characterized by electron-dense material inside vacuoles of heterogeneous size engulfed by a double membrane. In contrast, the number of phagophore-like structures consisting of curved but unclosed double membranes was increased upon SGPL1 deficiency (Fig. 3A). These data suggested a block in autophagosome formation. To further analyze this point we performed immunofluorescence analysis of LC3 in hippocampal tissue. LC3 staining in control mice showed a preferential punctate distribution consistent with the incorporation of the protein in phagophores, which mature into autophagosomes, as LC3-II (Fig. 3B). In contrast, LC3 staining in the hippocampus of SGPL1fl/fl/Nes mice showed a diffuse, less punctate, pattern (Fig. 3B). This observation supports the enhanced presence of LC3 in the cytosol as LC3-I and is consistent with the reduced LC3-II:LC3-I ratio evidenced by western blot (Fig. 2B).
Figure 3.
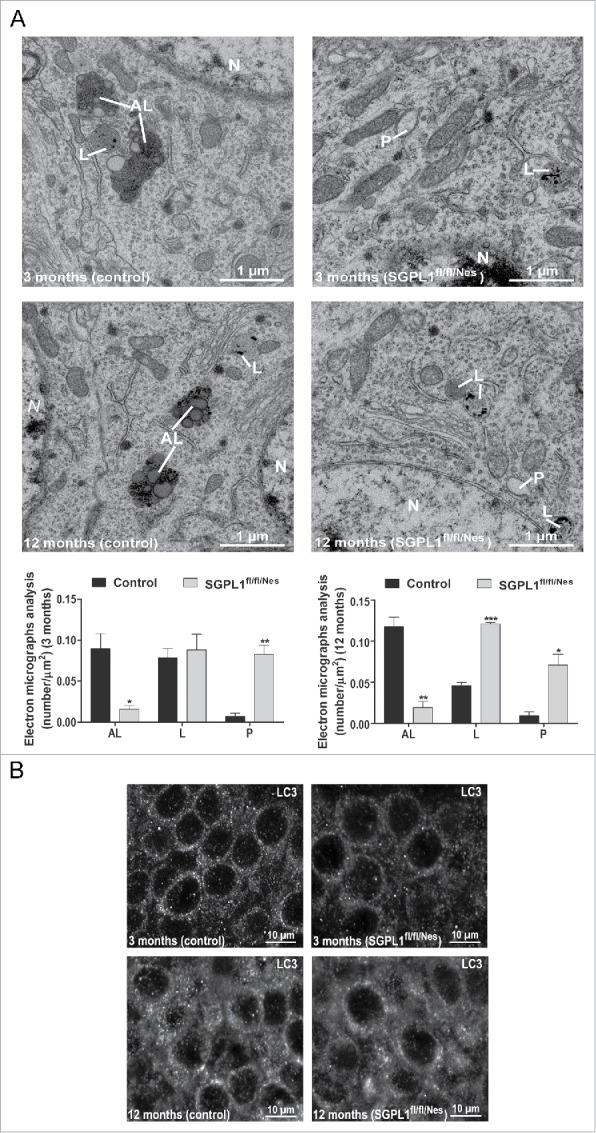
Autophagosome formation is compromised in SGPL1-deficient brains. (A) Electron micrographs from CA1 hippocampal neurons of control and SGPL1fl/fl/Nes mice showing autolysosome-like structures (AL), lysosomes (L), and phagophore-like structures (P) (unpaired Student t test, PAL, 3 m = 0.0177 PP, 3 m = 0.0031, PAL, 12 m = 0.0021, PL, 12 m < 0.0001, PP, 12 m = 0.0115). (B) Representative images of immunofluorescence analysis of the CA1 hippocampal brain region in control and SGPL1fl/fl/Nes mice of 3 or 12 mo of age using the anti-LC3 antibody.
Lysosomal upregulation in the brain of SGPL1fl/fl/Nes mice
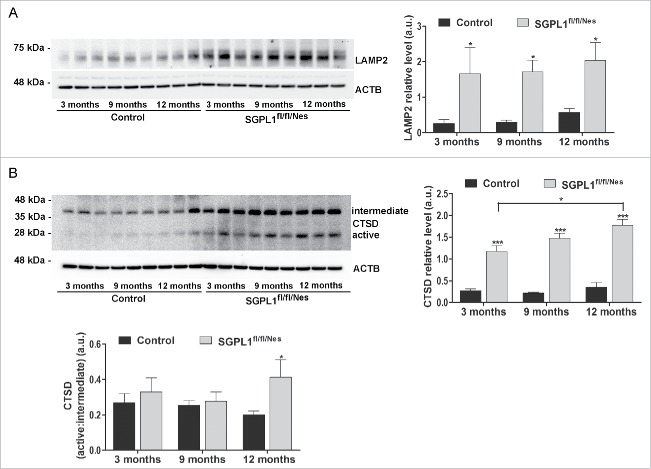
Autophagy is intimately connected with lysosomal degradation. Thus, fusion of autophagosomes and lysosomes constitutes the final step of cargo degradation in the autophagic pathway. To assess whether lysosomal alterations exist upon SGPL1 deficiency, we first analyzed these organelles by electron microscopy. This analysis revealed an increase in lysosome numbers in the hippocampi of SGPL1fl/fl/Nes mice compared with control mice that were especially significant at 12 mo of age (Fig. 3A). Biochemical analysis also showed a considerably elevated expression of LAMP2 (lysosomal-associated membrane protein 2) in brains of SGPL1fl/fl/Nes mice, which was evident already at 3 mo of age and was sustained throughout aging (Fig. 4A). We next analyzed the expression of the lysosomal protease CTSD (cathepsin D).17 Both, the intermediate and active forms of this protease were significantly increased in SGPL1fl/fl/Nes mice at all ages (Fig. 4B). However, the ratio active:intermediate form of CTSD reveals an absolute increase of active CTSD in SGPL1fl/fl/Nes mice brains only in the oldest mice (12 mo) analyzed.
Figure 4.
Upregulation of lysosomal markers in SGPL1-deficient brains. Representative western blot images and graphs showing mean ± SEM in brain extracts from control and SGPL1fl/fl/Nes mice for: (A) LAMP2 (n ≥ 3; 2-way ANOVA, P3 m = 0.0197, P9 m = 0.013, P12 m = 0.0481) and (B) CTSD (with indication of intermediate and active variants) (n ≥ 3; 2-way ANOVA, total CTSD, Ptime = 0.0497, Pgenotype < 0.0001, and CTSD active:intermediate, P12 m = 0.0455). Western blots of ACTB are shown in all panels as loading control. a.u., arbitrary units.
SGPL1 deficiency triggers accumulation of aggregate-prone proteins in the brain and cognitive deficits
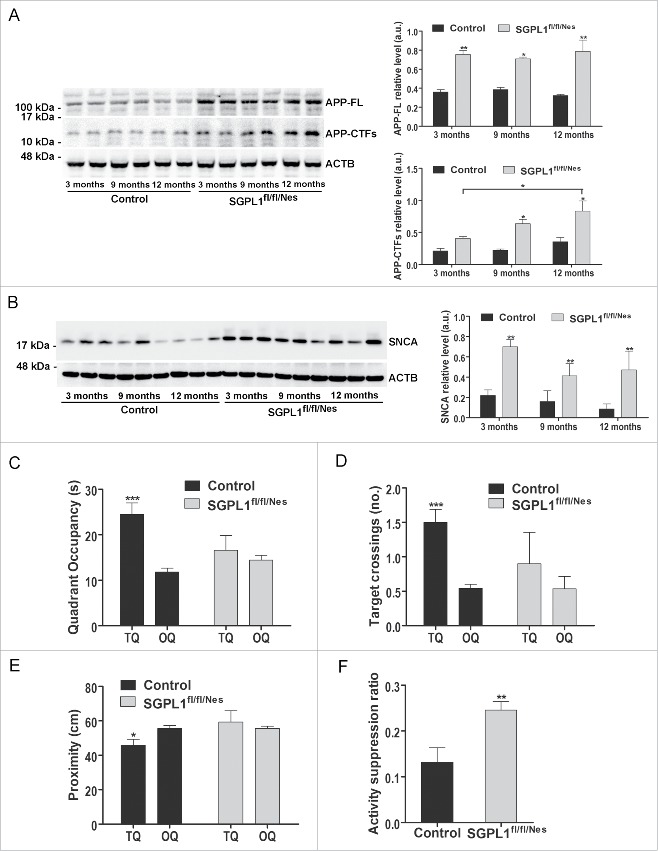
Impairment of autophagy has been implicated in the pathogenesis of neurodegenerative disorders by contributing to the accumulation of aggregate-prone proteins.2 This is the case of APP and its derived fragments and of SNCA/α-synuclein, which play critical roles in the pathogenesis of Alzheimer disease18 and Parkinson disease,19 respectively. Enhanced levels of both, full-length APP (APP-FL) and of APP-C-terminal fragments (CTFs) were detected in the brains of SGPL1fl/fl/Nes mice compared with controls (Fig. 5A). We also found accumulation of SNCA in SGPL1-deficient brains (Fig. 5B). The accumulation of APP-FL and of SNCA was already evident at early stages (3 mo of age) and was maintained at all ages analyzed. This accumulation is consistent with the timing observed for the autophagy alterations in the SGPL1fl/fl/Nes mice brains (Fig. 2 and Fig. 3). In an attempt to extend our study to an in vivo model of neurodegeneration, we assessed the cognitive skills of SGPL1fl/fl/Nes mice. Evaluation of spatial learning and memory via the Morris water maze (hidden version) test showed significant differences between the 2 groups regarding quadrant occupancy, target crossings and proximity in the probe trial at d 7 showing impairment of learning and memory in SGPL1fl/fl/Nes mice (Fig. 5C–E). Associative learning and memory in a contextual fear-conditioning paradigm also indicated reduced performance in SGPL1fl/fl/Nes mice as judged by higher activity suppression ratios compared with controls (Fig. 5F).
Figure 5.
Accumulation of aggregate-prone proteins and deficits in spatial learning and memory in SGPL1fl/fl/Nes mice. Representative western blot images and graphs showing mean ± SEM in brain extracts of control and SGPL1fl/fl/Nes mice of the indicated ages for: (A) APP-FL (full length) and APP-CTFs (C-terminal fragments) (n ≥ 3; 2-way ANOVA, Pgenotype, APP-FL = 0.0034, Ptime, APP-CTFs = 0.0453, Pgenotype, APP-CTFs = 0.0359). (B) SNCA (n ≥ 3; 2-way ANOVA, Pgenotype = 0.0050). Western blots of ACTB are shown in all panels as loading control. (C to E) Hidden version of the Morris water maze; TQ, target quadrant with hidden platform; OQ, other quadrants. (C) Time of quadrant occupancy (2-way ANOVA, P = 0.001); (D) number of target crossings after completion of training (2-way ANOVA, P = 0.001); (E) time spent in the target area expressed as distance from the target (2-way ANOVA, P = 0.043). (F) Fear conditioning test. Shown is the relative time of activity expressed as the activity suppression ratio. Baseline activity was determined 2 min before aversive stimulus whereas time of activity was determined 1 d after associative training in a context fear-conditioning paradigm (unpaired t test, P = 0.0053). a.u., arbitrary units.
Autophagic flux is blocked at initial stages upon SGPL1 deficiency
The biochemical analysis showing a diminished LC3-II:LC3-I ratio but increased levels of BECN1 and SQSTM1 in SGPL1-deficient mouse brains, together with reduced autolysosome-like but increased phagophore-like structures detected by electron microscopy (Fig. 3), suggested a blockage in the autophagic flux at the initial stages. To gain further insight into autophagy flux we moved to the in vitro analysis in neuronal cultures from control and SGPL1fl/fl/Nes mice in which we expressed the EGFP-mRFP-LC3 construct. This tandem fluorescent-tagged autophagosomal marker in which LC3 was engineered with both red-fluorescent protein (mRFP) and green-fluorescent protein (EGFP) allows the labeling of autophagosomes in yellow (merged green EGFP and red mRFP fluorescence), whereas autolysosomes appear only red as acidification after autophagosome-lysosome fusion quenches EGFP fluorescence.20 Quantification of autolysosomes (red-only structures) revealed a marked reduction in SGPL1-deficient neurons compared with controls (Fig. 6A).
Figure 6.
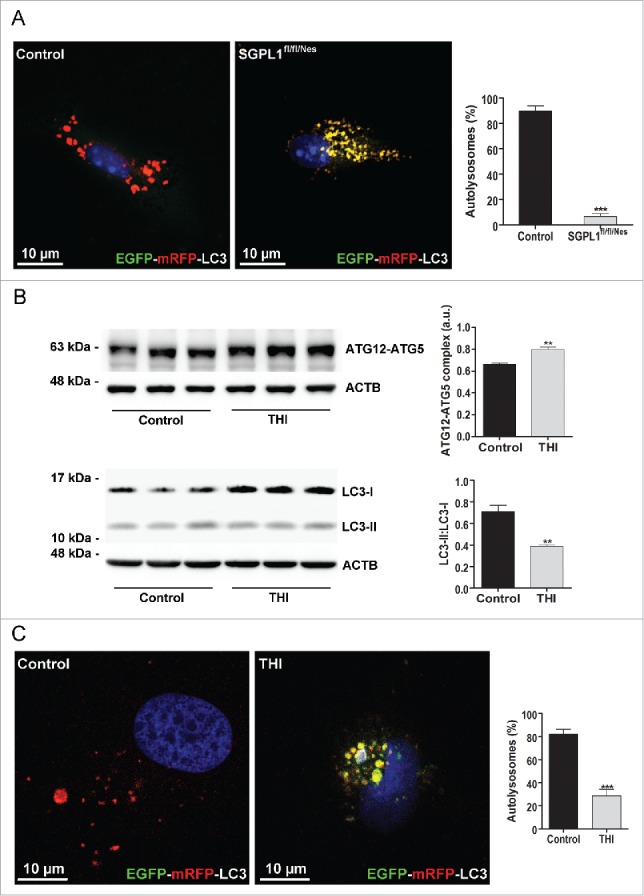
Autophagic flux is impaired in SGPL1-deficient neurons. (A and C) Images showing the fluorescence of the EGFP-mRFP-LC3 construct expressed in cultured neurons from SGPL1fl/fl/Nes and control mice (A) (unpaired Student t test, P < 0.0001) and in cultured WT hippocampal neurons treated with vehicle (control) or THI (C) (unpaired Student t test, P < 0.0001). DAPI staining indicates cell nuclei in blue. Graph shows mean ± SEM of the percentage of red structures corresponding to autolysosomes with respect to the total number of structures (red and yellow) per cell (n = 20 cells in each of 2 different cultures) (B) Representative western blot images and graphs showing mean ± SEM in extracts from cultured hippocampal neurons from WT rats treated or not with THI for the ATG12–ATG5 complex (unpaired Student t test, P = 0.0067) and for LC3 (unpaired Student t test, P = 0.0063). a.u., arbitrary units.
We also used a parallel approach in neurons in which SGPL1 had been pharmacologically inhibited. Consistent with the observations made in the brains of SGPL1fl/fl/Nes mice, the treatment of 14-d in vitro hippocampal neurons from wild-type (WT) rats with the SGPL1 inhibitor 2-acetyl-4-(tetrahydroxybutyl)imidazole (THI) resulted in higher expression levels of the autophagy initiation conjugated protein ATG12–ATG5 (autophagy-related 12–autophagy-related 5) and in a diminished LC3-II:LC3-I ratio (Fig. 6B). We next expressed the construct EGFP-mRFP-LC3 in WT cultured hippocampal neurons in which SGPL1 was pharmacologically inhibited with THI and observed a significant reduction of autolysosomes in THI-treated compared with nontreated cultured neurons (Fig. 6C). These results are consistent with SGPL1 inhibition blocking autophagic flux at early stages thus preventing the fusion of autophagosomes and lysosomes.
PE restores autophagic flux and controls levels of SQSTM1, APP and SNCA in cultured neurons with pharmacological or genetic inhibition of SGPL1
We have shown above that ablation of SGPL1 decreases the levels of PE in the brain. Because PE is essential for the conversion of LC3-I into LC3-II, and thus for autophagosome formation, we checked whether this lipid could rescue autophagic flux in SGPL1-deficient neurons. As depicted in Fig. 7A addition of PE to cultured neurons derived from SGPL1fl/fl/Nes mice indeed restored the conversion of LC3-I into LC3-II and the amount of SQSTM1 to control levels. In addition, PE supplementation re-established the autophagy flux in these neurons transfected with a plasmid encoding EGFP-mRFP-LC3 as evidenced by the enhanced number of red structures corresponding to autolysosomes (Fig. 7B). This was also the case in WT cultured neurons in which SGPL1 was pharmacologically inhibited with THI (Fig. 8A–B). Likewise, treatment of organotypic hippocampal slices of SGPL1fl/fl/Nes mice for 24 h with PE re-established SQSTM1 expression and the conversion of LC3-I into LC3-II to control levels (Fig. 9A). This lends further support to the effect of PE in restoring autophagy. Finally, PE addition prevented the accumulation of APP and of SNCA levels in cultured neurons from SGPL1fl/fl/Nes mice as determined by western blot (Fig. 9B).
Figure 7.
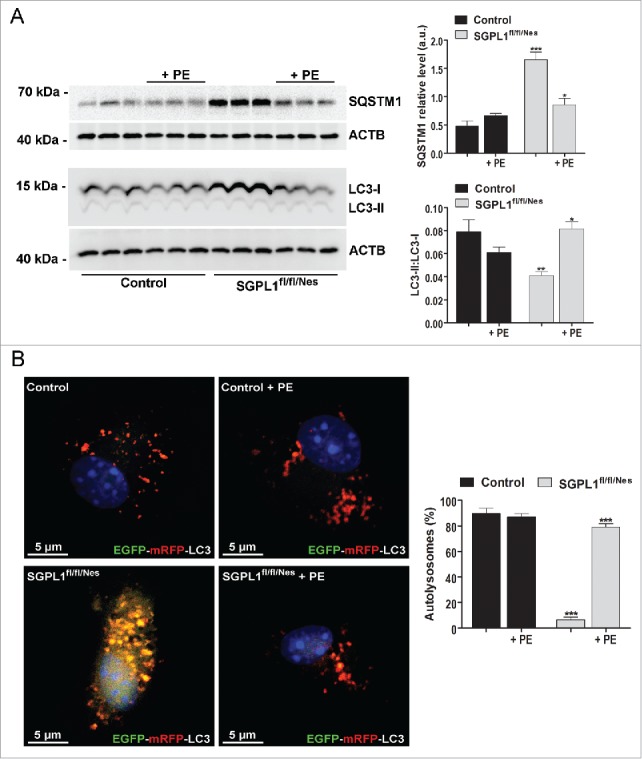
PE restores autophagic flux in SGPL1-deficient neurons. (A) Representative western blot images for SQSTM1 and LC3 and graphs showing mean ± SEM in extracts from cultured neurons generated from control and SGPL1fl/fl/Nes mice and treated or not with PE as indicated (n ≥ 3; 2-way ANOVA, PSQSTM1, genotype = 0.0001, PSQSTM1, treatment = 0.0158, PLC3, genotype = 0.0072, PLC3, treatment = 0.0293). (B) Images showing the fluorescence of the EGFP-mRFP-LC3 construct expressed in cultured neurons from control and SGPL1fl/fl/Nes mice (2-way ANOVA, P < 0.0001). DAPI staining indicates cell nuclei in blue. Graph shows mean ± SEM of the percentage of red structures corresponding to autolysosomes with respect to the total number of structures (red and yellow) per cell (n = 20 cells in each of 2 different cultures). a.u., arbitrary units.
Figure 8.
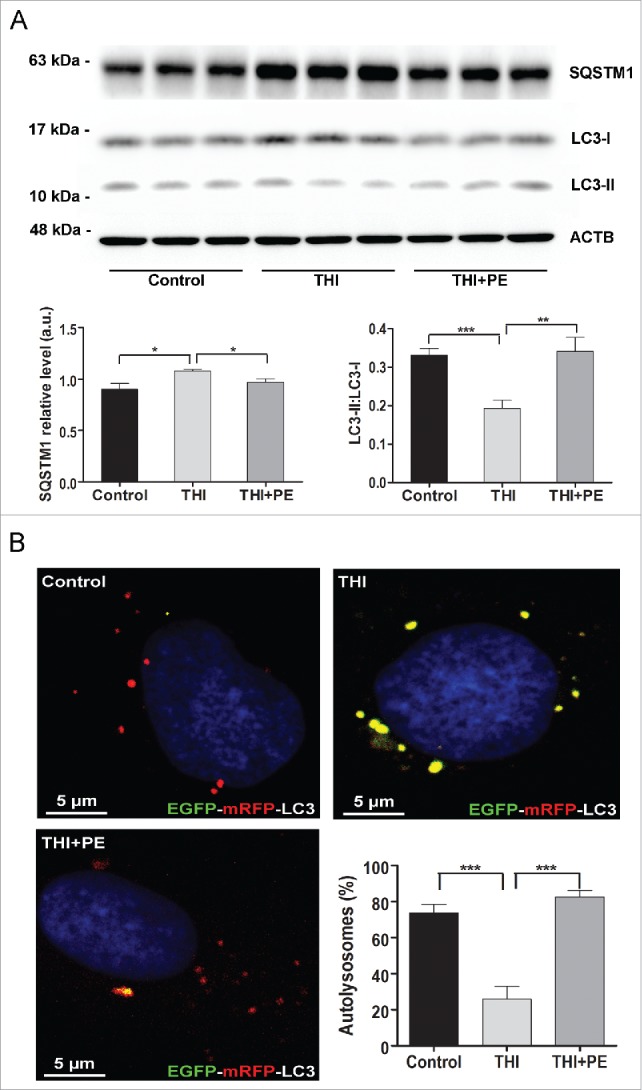
PE restores autophagic flux in neurons with pharmacologically inhibited SGPL1. Neuronal cultures derived from hippocampi of WT rats were treated with vehicle (control) or THI in the absence or presence of PE as indicated. (A) Representative western blot images for SQSTM1 and LC3 and graphs showing mean ± SEM (n ≥ 3; one-way ANOVA, PSQSTM1, THI = 0.0112, PSQSTM1, THI+PE = 0.0113, PLC3, THI = 0.0005, PLC3, THI+PE = 0.0056). (B) Images showing the fluorescence of the EGFP-mRFP-LC3 construct expressed in cultured WT neurons treated with vehicle (control) or THI in the absence or presence of PE as indicated (one-way ANOVA, PTHI < 0.0001, PTHI+PE < 0.0001). DAPI staining indicates cell nuclei in blue. Graph shows mean ± SEM of the percentage of red structures corresponding to autolysosomes with respect to the total number of structures (red and yellow) per cell (n = 20 cells in each of 2 different cultures). a.u., arbitrary units.
Figure 9.
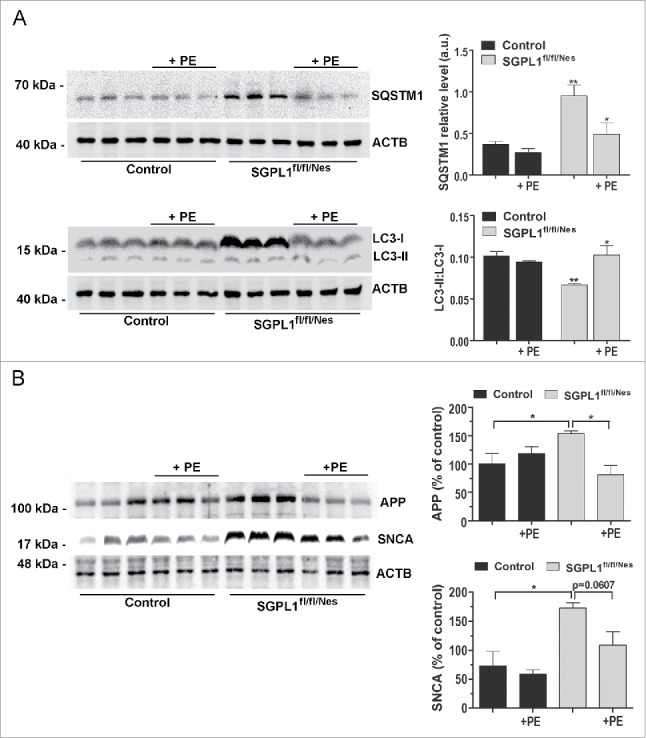
PE restores autophagy markers in SGPL1-deficient organotypic hippocampal slices and prevents accumulation of APP and SNCA in SGPL1-deficient neurons. (A) Representative western blot images for SQSTM1 and LC3 in hippocampal slices of 12-mo-old control and SGPL1fl/fl/Nes mice incubated with or without PE for 24 h (n ≥ 3; 2-way ANOVA, PSQSTM1, genotype = 0.0041, PSQSTM1, treatment = 0.0227, PLC3, genotype = 0.0031, PLC3, treatment = 0.0446). (B) Representative western blot images for APP and SNCA and graphs showing means ± SEM values in extracts from cultured neurons from control and SGPL1fl/fl/Nes mice treated or not with PE (n ≥ 3; one-way ANOVA, PAPP = 0.0304, PSNCA = 0.0204). a.u., arbitrary units.
To assess the possible involvement of SPHKs and/or S1P on the impaired autophagy in SGPL1-deficient neurons, we first studied the expression of SPHK1 and SPHK2 in control and SGPL1fl/fl/Nes mice. We did not observe any effect of SGPL1-depletion on the expression of both kinases (Fig. S1A). Moreover, addition of SPHKi, an inhibitor of both kinases,21 did not rescue either the conversion of LC3-I into LC3-II or the accumulation of APP in SGPL1-deficient neurons (Fig. S1B). These results argue against the involvement of S1P accumulation in the autophagy defects caused by SGPL1 deficiency.
Discussion
The generation of a mouse model with neural specific ablation of SGPL1 has allowed us to identify a formerly overlooked direct role of SGPL1 in neuronal autophagy. Using a combination of analyses including electron and fluorescence microscopy, biochemical and autophagic flux assays and rescue experiments in mouse brains and in neurons in which SGPL1 was genetically or pharmacologically inhibited our results show that SGPL1 deficiency blocks autophagy at its early stages because of reduced PE production.
Ethanolamine phosphate derived from the breakdown of S1P by SGPL1 can be used in the synthesis of PE, which is an abundant membrane lipid. However, in most cell types redirection of S1P degradation by SGPL1 toward ethanolamine phosphate formation does not constitute the major pathway for de novo PE synthesis. This is supposed to be the case due to the availability of S1P-independent pathways for the synthesis of ethanolamine phosphate and/or PE.14 Further, the precise control and regulation of sphingolipids is a complicated process and even slight changes in the concentration of these metabolites can inflict distinct and opposing effects on cellular functions.22 The necessity for such an intricate regulation is also argued to be a reason behind why S1P degradation is not a predominant source of ethanolamine phosphate.23 However, our findings in SGPL1fl/fl/Nes mice indeed point to an important role for PE generated from the S1P degradation products in autophagy and lysosomal function, at least in neurons. Note that, in an earlier study Zhang et al. have shown evidence for a striking remodelling of the sphingolipid pathway for bulk production of ethanolamine in Leishmania.24 Conversely, a recent report by Rockenfeller et al. has shown that the artificial increase of intracellular PE levels or overexpressing the PE-generating PISD (phosphatidylserine decarboxylase), significantly increased autophagic flux which in turn extended the life span of yeast.14 Taken together, these findings establish on the one hand the importance of PE in the autophagic pathway and on the other hand the significant contribution of S1P metabolism in regulating this pathway. Thus, SGPL1 apart from linking sphingolipid and glycerophospholipid metabolism25 might also modulate autophagic flux via its reaction product ethanolamine phosphate in tissues that abundantly express sphingolipids as demonstrated here for neurons.
On a closer look, it is obvious that there are more layers of complexity to our results than appear at first glance. A bidirectional effect of SGPL1 ablation leading to the reduction of its product ethanolamine phosphate and also the accumulation of its substrate S1P can be envisaged. S1P has its own specific routes through which it can influence autophagy. S1P treatment counteracts autophagy induction by amino acid starvation and this effect is mediated by S1PR3 (sphingosine-1-phosphate receptor 3) in an MTOR-dependent manner.6 It is to be noted that MTOR-independent effects of S1P on autophagy have also been documented,10 and these differences could be attributed to the extrinsic and intrinsic effects of S1P.6 Our results in SGPL1-deficient mice show that the capacity of starvation to induce autophagy was altered thus substantiating a role of Sgpl1 deletion in stimulated autophagy. Nevertheless we have shown in earlier reports that accumulation of SPHK2-derived S1P induces ER stress,26,27 which upregulates cellular autophagy.28,29 At the same time accumulating S1P reduces neuronal de novo sphingolipid biosynthesis,26 which was reported to be essential for induction of autophagy, albeit in non-neuronal cells.30 In line with these data, we detected both an accumulation of SQSTM1, a generally accepted indicator of impaired autophagy,31 as well as an elevated expression of BECN1 and the ATG12–ATG5 complex, which is rather indicative of increased autophagosome initiation.28 Intriguingly, in Niemann-Pick disease type C1 caused by an impaired cholesterol trafficking and hence lysosomal storage of sphingolipids, autophagy was also found to be both induced and defective.32,33
Yet, accumulation of SQSTM1 is prevented by supplying PE, implying that an effect of S1P on autophagy in SGPL1-deficient neural tissue, if present, is rather secondary. Further, by using other independent approaches like ex vivo treatment of hippocampal slices from SGPL1fl/fl/Nes mice with PE to restore the protein expression of SQSTM1, LC3-I to LC3-II conversion and rescuing autophagic flux in neurons with genetically ablated or pharmacologically inhibited SGPL1, we establish a strong case for a role of SGPL1-derived PE in neuronal autophagy. Notably, inhibition of SPHKs neither rescued LC3-I conversion into LC3-II nor reduced APP accumulation. Another possibility that cannot be fully excluded is the role of sphingosine in autophagy, which is also accumulating to a certain extent in SGPL1-deficient neurons.15,26 Sphingosine has recently been demonstrated to trigger calcium release from acidic stores,34 that in turn might activate autophagy. Intriguingly, our results regarding LAMP2 and CTSD point to an increased lysosomal function. We assume therefore that augmented lysosomal activity downstream of the autophagic block as well as an enhanced number of phagophores upstream of this block might represent an attempt of SGPL1-deficient neurons to overcome impaired autophagy caused by reduced PE levels.
Compromised autophagy is involved in the pathogenesis of neurodegenerative diseases by causing defective clearance of intracytoplasmic depositions of aggregate-prone proteins.1,4 Consistent with this hypothesis, we observed accumulation of neurodegenerative biomarkers of Alzheimer and Parkinson diseases in SGPL1-deficient mouse brains. We have previously shown a strong accumulation of APP and potentially amyloidogenic APP C-terminal fragments, as well as an increased generation of Aβ in SGPL1-deficient mouse embryonic fibroblasts.35 The autophagic pathway is crucial for clearance of protein aggregates, which are a common feature of neurodegenerative conditions, causing cognitive deficits. By monitoring the cognitive skills of SGPL1fl/fl/Nes mice, we here show that the autophagy impairment and brain protein aggregates in these mice are also accompanied by impaired spatial learning and memory. The finding that addition of PE reduced the accumulation of APP and SNCA in vitro (primary cultured neurons) and ex vivo (hippocampal slices) paves the way to test whether PE supplementation is a suitable strategy to rescue cognitive skills in SGPL1fl/fl/Nes mice.
In addition to our recent data that connect S1P and presynaptic architecture,15 and earlier data indicating its neurotoxicity,27 we herein provide an additional route that connects SGPL1 deficiency and neurodegeneration via a PE-mediated defective autophagy mechanism.
Materials and methods
Materials
The following antibodies were used: Monoclonals against BECN1, LC3, SQSTM1, SNCA, CTSD and ACTB (8H10D10) (Cell Signaling Technology, 3738, 12741, 5114, 4179, 2284, 3700), ATG12–ATG5 (MBL Life Science, M153–3), LAMP2 (University of Iowa, H4B4). Polyclonal anti-APP C-terminal (Eurogentec, AS-62065). Secondary antibodies were HRP-linked anti-rabbit and anti-mouse IgG (Cell Signaling Technology, 7074 and 7076). Anti-SPHK1 antibody was a kind gift from Susan and Nigel Pyne (University of Strathclyde, Glasgow, UK). SPHK2 was kindly provided by Richard Proia (NIDDK, Bethesda, MD. USA). SPHKi was from Merck-Millipore (Calbiochem®, 567741). PE and THI were purchased from Sigma-Aldrich (Sigma-Aldrich, P7693 and T6330, respectively).
Mice
All animal experiments were conducted in accordance with the guidelines of the Animal Care Committee of the University of Bonn and of the Centro Biología Molecular Severo Ochoa of the Autonomous University of Madrid.
The Sgpl1flox/flox lines were generated as recently described.36 Sgpl1flox/flox mice, harbouring “floxed” exons 10–12 on both Sgpl1 alleles were crossbred with mice expressing the Nes (nestin)-Cre transgene. Thus SGPL1fl/fl/Nes mice in which “floxed” exons are excised by Cre recombinase were obtained. For all the experiments, the floxed mice (SGPL1fl/fl) served as controls. Brain tissue was taken from mice housed in standard conditions at the University of Bonn and Centro Biología Molecular Severo Ochoa (Madrid).
Ethical statement
All animal experiments were conducted in accordance with the guidelines of the Animal Care Committee of the University of Bonn. The experimental protocols were approved by Landesamt für Natur, Umwelt und Verbraucherschutz Nordrhein-Westfalen (LANUV) (LANUV NRW, Az. 87–51.04.2011.A049).
Neuronal cultures
Granular cells were cultured from the cerebella of 6-d-old mice as described previously.37 Briefly, neurons were isolated by mild trypsinization (0.05%, w/v; Sigma-Aldrich, P6567) and dissociated by passing them repeatedly through a constricted Pasteur pipette in a DNase solution (0.1%, w/v; Roche, 04716728001). The cells (5 × 10⁵ cells/well) were then suspended in Dulbecco's modified Eagle's medium (Thermo Fisher Scientific, 10566032) containing 10% heat-inactivated horse serum (Thermo Fisher Scientific, 16050130) supplemented with 100 units/ml penicillin and 100 mg/ml streptomycin and plated onto 15-mm sterile glass coverslips placed in 6-well plates, 35 mm in diameter, and precoated overnight at 37°C with 0.01 mg/ml of poly-L-lysine (Sigma-Aldrich, P6282) dissolved in 1 x phosphate-buffered saline (PBS; Thermo Fisher Scientific, 10010023). Twenty-four h after plating, cytosine-ß-D-arabinofuranoside hydrochloride (Sigma-Aldrich, C6645) was added to the medium (4 × 10⁻⁵ M) to arrest the division of non-neuronal cells. After 10 d in culture, cells were used for experiments as indicated.
Primary cultures of hippocampal neurons were prepared from embryonic d 18 (E18) Wistar rats as described in Kaech and Banker.38 Hippocampi were dissected and placed into ice-cold Hanks solution (Thermo Fisher Scientific, 14060073) with 7 mM HEPES (Thermo Fisher Scientific, 15630080), pH 7.4 and 0.45% glucose. The tissue was then treated with 0.005% trypsin (trypsin 0.05% EDTA; Thermo Fisher Scientific, R001100) and incubated at 37°C for 16 min and then treated with DNase (72 μg ml−1; Roche, 04716728001) for 1 min at 37°C. Hippocampi were washed 3 times with Hanks solution. Cells were dissociated in 5 ml of plating medium (Minimum Essential Medium; Thermo Fisher Scientific, 11095080; supplemented with 10% horse serum and 20% glucose) and cells were counted in a Neubauer Chamber. Cells were plated into dishes pre-coated with poly-d-lysine (Sigma-Aldrich, P6407) (75,000 in a 3-cm dish for ICF and 150,000 in a 3-cm dish for WB) and placed into a humidified incubator containing 95% air and 5% CO2. The plating medium was replaced with equilibrated Neurobasal medium (Thermo Fisher Scientific, 21103–049) supplemented with B27 (Thermo Fisher Scientific, 17504044) and GlutaMAX (Thermo Fisher Scientific, 35050061). On day in vitro (DIV) 7 the culture medium was replaced with medium without GlutaMAX. Cultures were used at 14 DIV.
Organotypic adult brain slice cultures
For hippocampal slice cultures 12-mo-old adult mice were used. Coronal slices of 200-µm thickness were stored in artificial cerebrospinal fluid (Tocris Bioscience, 3525) gassed with carbogen until cultivated. The slices were carefully placed onto sterile inserts with 8-µm pore size membrane (Sarstedt, 83.3930.800) in 6-well plates. Slices were kept at 37°C and 5% CO2 with 4 ml/well of the following culture medium: 50% MEM/HEPES (Thermo Fisher Scientific, 12360038), 25% heat inactivated horse serum (Thermo Fisher Scientific, 16050130), 25% Hanks solution (Thermo Fisher Scientific, 14060073), 2 mM NaHCO3 (Merck Millipore, 106329), 6.5 mg/ml glucose (Merck Millipore, 108337), 2 mM glutamine (Merck Millipore, 100289), pH 7.2.39 Slices were incubated for 24 h with and without PE and processed further for western blotting.
PE extraction and quantification
Lipid measurements were performed according to an established protocol using liquid chromatography coupled to triple-quadrupole mass spectrometry (LC/MS/MS).40 Tissue samples were homogenized using the Stomacher Model 80 MicroBiomaster Blender (Seward, Worthing, UK) in 5 ml PBS after addition of C17-base sphingosine (Sph; Avanti Polar Lipids, 860641P) and C15-base ceramide (Cer; Matreya LLC, 2037) as internal standards (300 pmol/sample). Supernatants (1 ml) were transferred into glass centrifuge tubes (VWR International, 734–4240) and mixed with 200 μl hydrochloric acid (6 N; Carl Roth GmbH, 9277.1) and 1 ml methanol (VWR International, 20864.320), and vigorously vortexed for 5 min in the presence of 2 ml chloroform (Carl Roth GmbH, 9331.1). Aqueous and chloroform phases were separated by centrifugation for 3 min at 1900 x g, and the lower chloroform phase was transferred into a new glass centrifuge tube. After a second round of lipid extraction with an additional 2 ml chloroform, the 2 chloroform phases were combined and vacuum-dried at 50°C for 50 min using a vacuum concentrator (RVC 2–25 CD plus, Martin Christ Gefriertrocknungsanlagen GmbH, Osterode, Germany). The extracted lipids were dissolved in 100 μl methanol/chloroform (4:1, v/v) and stored at -20°C. Detection was performed with the QTrap triple-quadrupole mass spectrometer (Sciex, Ontario, Canada) interfaced with the 1100 series chromatograph (Agilent Technologies, Waldbronn, Germany), the Hitachi Elite LaChrom column oven (VWR International), and the Spectra System AS3500 autosampler (Thermo Fisher Scientific, Waltham, MA, USA). Negative electrospray ionization (ESI) LC/MS/MS analysis was used for detection of PE (Avanti Polar Lipids, 850725). Multiple reaction monitoring (MRM) transition was PE (36:2) m/z 742/281. Liquid chromatographic resolution of analyte was achieved using a 2 × 60 mm MultoHigh C18 reversed phase column with 3-μm particle size (CS-Chromatographie Service GmbH, 536201–1174). The column was equilibrated with 10% methanol and 90% of 1% formic acid (Carl Roth GmbH, 4742.1) in H2O for 5 min, followed by sample injection and 15 min elution with methanol (100%), flow rate 300 μl/min. Standard curves were generated by adding increasing concentrations of the analyte to 300 pmoles of the internal standard. Linearity of the standard curves and correlation coefficients were obtained by linear regression analyses. Data analyses were performed using Analyst 1.6 (Sciex).
For measurements of ethanolamine phosphate (EAP, Sigma-Aldrich, P0503–10MG) the following changes from the general protocol were applied: Samples were homogenized in H2O instead of PBS, and the aqueous phase was taken for LC/MS/MS measurements. Standards with increasing concentrations of EAP were equivalently processed for the generation of standard curves. Detection of EAP was achieved with negative ESI and the MRM transition of m/z 140/79.
Western immunoblotting
Total brains, hippocampi or cultured neurons were homogenized twice for 2 min using metallic beads at a frequency of 20 Hz in RIPA buffer (20 mM Tris-HCl, pH 7.5, 150 mM NaCl, 1 mM EDTA, 1 mM EGTA, 1% NP-40 [Thermo Fisher Scientific, FNN0021], 1% NaDC [Sigma-Aldrich, D6750], 2.5 mM Na4P2O7, 1 mM β-glycerophosphate, 1 mM Na3VO4, 1 µg/ml leupeptin [Thermo Fisher Scientific, 78435]). Samples were kept on ice for 1 h followed by centrifugation at 18,000 x g at 4°C for 1 h. The protein concentration of the supernatants was determined using the Pierce BCA protein assay kit (Thermo Fisher Scientific, 23225). Samples were stored at -20°C until use. Lysates from total brain and cell cultures were incubated with SDS sample buffer for 10 min at 95°C. Proteins were separated by SDS-PAGE in running buffer (25 mM Tris, pH 8.3, 192 mM glycine, 0.1% SDS) at 200 V. Transfer onto nitrocellulose membranes (Porablot NCL; Macherey-Nagel, 741290) was performed at 4°C and 300 mA for 2 h in blotting buffer (50 mM Tris, pH 9.2, 40 mM glycine, 0.03% SDS, 20% methanol). Membranes were blocked with 5% milk powder (Bio-Rad Laboratories, 1706404) in TBS-Tween 20 (20 mM Tris, pH 7.5, 150 mM NaCl, 0.1% Tween 20 [Sigma-Aldrich, P9416]) for 1 h, washed and incubated at 4°C overnight with the primary antibody. Then membranes were washed 3 times for 10 min and incubated for 1 h with an HRP-conjugated secondary antibody. Pierce™ ECL Western Blotting Substrate (Thermo Fisher Scientific, 32106) was used for detection, VersaDoc 5000 imaging system (Bio-Rad, Hercules, CA, USA) for visualizing the membranes, and ImageJ program for quantification.
Electron microscopy
Mice were intracardially perfused with PBS and fixative (4% paraformaldehyde [PFA] and 2% glutaraldehyde in PBS). Brains were fixed in 4% PFA overnight and sectioned in 200-µm-thick slices. Hippocampal sections were postfixed in 1% osmium tetroxide (in 0.1 M cacodylate buffer), dehydrated in ethanol and embedded in Epon (Sigma-Aldrich, 45359–1EA-F). Serial ultrathin sections of the CA1 region were collected on pioloform-coated, single-hole grids, and stained with uranyl acetate and lead citrate. The sections were examined with a transmission electron microscope (JEM1010, jeol, Akishima, Tokyo, Japan). CA1 neurons identified by position were sampled randomly and photographed at a magnification of x 8.000 with a CMOS 4 k TemCam-F416 camera (TVIPS, Gauting, Germany). The number of autophagic structures and lysosomes was quantified using ImageJ software (National Institutes of Health, Bethesda, MD, USA) in 10 randomly selected CA1 neurons from 3 mice per genotype and age. The area of each cell was also calculated and the values of autophagic structures and lysosomes/µm2 were statistically compared.
Immunohistofluorescence
Mice were intracardially perfused with PBS and 4% PFA, fixed with 4% PFA in PBS overnight at 4°C and then cryoprotected in 30% sucrose (Merck Millipore, 107687) in PBS for 48 h. Next, samples were frozen in Optimal Cutting Temperature (Tissue-Tek; Thermo Fisher Scientific, 23–730–571). Sagittal sections (30 µm) were obtained with a CM 1950 Ag Protect freezing microtome (Leica, Solms, Germany). Sections were incubated with the primary antibody 72 h at 4°C in a 0.1 N phosphate buffer containing 1% bovine serum albumin (Sigma-Aldrich, A9418) and 1% Triton X-100 (Sigma-Aldrich, X100). After washing with blocking solution, sections were incubated with donkey Alexa Fluor-conjugated secondary antibody overnight at 4°C (Thermo Fisher Scientific, A-21206 or AP180SA6MI). Finally, sections were washed and mounted with Prolong Gold Antifade (Thermo Fisher Scientific, P36930). Images were taken with a confocal LSM710 META microscope (Carl Zeiss AG, Oberkochen, Germany).
THI and PE treatment in cultured neurons
SGPL1 activity was modulated in 14-DIV cultured hippocampal neurons from WT rats by addition for 3 h of 100 µM THI (SGPL1 inhibitor; Sigma-Aldrich, T6330), which was added from a stock prepared in DMSO (Sigma-Aldrich, D2438). For rescue experiments with PE, WT neurons were incubated for 3 h with 100 µM THI and 10 µM PE (Sigma-Aldrich, P7693). PE was added from a stock prepared in ethanol that ensured a final ethanol concentration of less than 1% in the neuronal medium to avoid toxicity. The same amounts of DMSO or/and ethanol were added to control neuronal cultures.
EGFP-mRFP tandem fluorescent-tagged LC3 expression
Primary hippocampal and cerebellar neurons were transfected with EGFP-mRFP tandem fluorescent-tagged LC320 using Lipofectamine 3000 reagent (Thermo Fisher Scientific, L3000015) on DIV 11. After 72 h, hippocampal neurons were treated with 100 µM THI or with 100 µM THI and 10 µM PE for 3 h. Finally neurons were fixed with 4% PFA for 10 min, stained with DAPI (1/5000; Sigma-Aldrich, 10236276001) and analyzed in a confocal LSM710 META microscope (Carl Zeiss AG, Oberkochen, Germany). The number of mRFP-positive structures was quantified with respect to the total number of structures that were EGFP- and mRFP-positive per cell.
Behavioral analysis
Mice (15–18-mo old; n = 9 controls and n = 10 SGPL1fl/fl/Nes) were tested for spatial and associative learning, and memory. All experiments were conducted blind with respect to the genotype of the tested animals.
Hidden version of the Morris water maze
The water maze was performed essentially as described previously.41 Each animal received 6 daily training trials in the hidden version of the Morris water maze (in blocks of 2 consecutive trials) for 7 consecutive d. Training trials were completed when mice climbed on the escape platform or when 1 min had elapsed, whichever came first. To evaluate the accuracy with which the animals had learned the position of the escape platform, we performed a probe trial after completion of training on d 3, 5, and 7. We determined the time that mice spent searching in the target quadrant (which previously contained the escape platform) or the other quadrants during the probe trial. Additionally, we analyzed the number of crossings of the exact target location (i.e., where the platform was during training) and compared it with crossings of analogous positions in the other quadrants.
Context fear conditioning
A near-infrared video fear conditioning system (Med Associates, St. Albans, VT, USA) was used to test context fear conditioning. The training session was 306 sec total duration; 2-sec, 0.75-mA shocks were delivered via the metal grid floor of the chambers after 120, 182 and 244 sec. A single test session was given on the next day, during which animals were placed in the chamber for 300 seconds to record behavior. Time freezing and average motion were calculated with the Video Freeze® software (Med Associates). To evaluate conditioned fear, we calculated the freezing time on the test day and activity suppression ratios for each animal as activity during test/(activity during test + activity during baseline).
Statistical analysis
All values are presented as means ± SEM. Student t test and 2-way ANOVA were used for statistical analysis of the data. P values lower than 0.05 were considered significant. In the figures asterisks indicate P values as follows: * < 0.05; ** < 0.01; *** < 0.001. The GraphPad Prism 5 software was used for statistical analysis.
Supplementary Material
Abbreviations
- ACTB
actin, β
- APP
amyloid β [A4] precursor protein
- ATG12–ATG5
autophagy-related 12–autophagy-related 5
- BECN1
Beclin 1, autophagy related
- CTSD
cathepsin D
- DAPI
2-(4-amidinophenyl)-1H-indole-6-carboxamidine
- EAP
ethanolamine phosphate
- EGFP
enhanced green fluorescent protein
- LAMP2
lysosomal-associated membrane protein 2
- MAP1LC3/LC3
microtubule-associated protein 1 light chain 3
- mRFP
monomeric red fluorescence protein
- MTOR
mechanistic target of rapamycin (serine/threonine kinase)
- PE
phosphatidylethanolamine
- S1P
sphingosine-1-phosphate
- SGPL1/SPL
sphingosine phosphate lyase 1
- SNCA
synuclein, α
- SPHK1
sphingosine kinase 1
- SPHK2
sphingosine kinase 2
- SQSTM1/p62
sequestosome 1
- THI
2-acetyl-4-(tetrahydroxybutyl)imidazole
- WT
wild type
Disclosure of potential conflicts of interest
No potential conflicts of interest were disclosed.
Acknowledgments
We thank Susan and Nigel Pyne and Richard Proia for providing the antibodies against SPHK1 and SPHK2, respectively. We thank the electron and light microscopy facilities of the CBMSO, especially M Guerra and G Andrés, for excellent technical support and advice and P. Boya (CIB, Madrid) for the gift of the EGFP-mRFP tandem fluorescent-tagged LC3 construct, Jochen Walter, Uniklinikum Bonn for lending his Western blot facility for a couple of blots.
Funding
DNM was supported by the German Academic Exchange Service (Deutscher Akademischer Austauschdienst), IK obtained a Fritz Thyssen Stiftung fellowship, JS received funding by the National Institutes of Health (NIH) grant CA129438. We also acknowledge the support of grant SAF2014–57539-R from Ministerio Español de Economía y Competitividad to MDL.
References
- [1].Nixon RA. The role of autophagy in neurodegenerative disease. Nat Med 2013; 19:983-97; PMID:23921753; http://dx.doi.org/ 10.1038/nm.3232 [DOI] [PubMed] [Google Scholar]
- [2].Komatsu M, Waguri S, Chiba T, Murata S, Iwata J, Tanida I, Ueno T, Koike M, Uchiyama Y, Kominami E, et al.. Loss of autophagy in the central nervous system causes neurodegeneration in mice. Nature 2006; 441:880-4; PMID:16625205; http://dx.doi.org/ 10.1038/nature04723 [DOI] [PubMed] [Google Scholar]
- [3].Hara T, Nakamura K, Matsui M, Yamamoto A, Nakahara Y, Suzuki-Migishima R, Yokoyama M, Mishima K, Saito I, Okano H, et al.. Suppression of basal autophagy in neural cells causes neurodegenerative disease in mice. Nature 2006; 441:885-9; PMID:16625204; http://dx.doi.org/ 10.1038/nature04724 [DOI] [PubMed] [Google Scholar]
- [4].Menzies FM, Fleming A, Rubinsztein DC. Compromised autophagy and neurodegenerative diseases. Nat Rev Neurosci 2015; 16:345-57; PMID:25991442; http://dx.doi.org/ 10.1038/nrn3961 [DOI] [PubMed] [Google Scholar]
- [5].Hannun YA, Obeid LM. Principles of bioactive lipid signalling: lessons from sphingolipids. Nat Rev Mol Cell Biol 2008; 9:139-50; PMID:18216770; http://dx.doi.org/ 10.1038/nrm2329 [DOI] [PubMed] [Google Scholar]
- [6].Taniguchi M, Kitatani K, Kondo T, Hashimoto-Nishimura M, Asano S, Hayashi A, Mitsutake S, Igarashi Y, Umehara H, Takeya H, et al.. Regulation of autophagy and its associated cell death by “sphingolipid rheostat:” reciprocal role of ceramide and sphingosine 1-phosphate in the mammalian target of rapamycin pathway. J Biol Chem 2012; 287:39898-910; PMID:23035115; http://dx.doi.org/ 10.1074/jbc.M112.416552 [DOI] [PMC free article] [PubMed] [Google Scholar]
- [7].Harvald EB, Olsen AS, Faergeman NJ. Autophagy in the light of sphingolipid metabolism. Apoptosis 2015; 20:658-70; PMID:25682163; http://dx.doi.org/ 10.1007/s10495-015-1108-2 [DOI] [PMC free article] [PubMed] [Google Scholar]
- [8].Moruno Manchon JF, Uzor NE, Dabaghian Y, Furr-Stimming EE, Finkbeiner S, Tsvetkov AS. Cytoplasmic sphingosine-1-phosphate pathway modulates neuronal autophagy. Scientific Rep 2015; 5:15213; http://dx.doi.org/ 10.1038/srep15213 [DOI] [PMC free article] [PubMed] [Google Scholar]
- [9].Spiegel S, Milstien S. Sphingosine-1-phosphate: an enigmatic signalling lipid. Nat Rev Mol Cell Biol 2003; 4:397-407; PMID:12728273; http://dx.doi.org/ 10.1038/nrm1103 [DOI] [PubMed] [Google Scholar]
- [10].Lepine S, Allegood JC, Park M, Dent P, Milstien S, Spiegel S. Sphingosine-1-phosphate phosphohydrolase-1 regulates ER stress-induced autophagy. Cell Death Differ 2011; 18:350-61; PMID:20798685; http://dx.doi.org/ 10.1038/cdd.2010.104 [DOI] [PMC free article] [PubMed] [Google Scholar]
- [11].Lavieu G, Scarlatti F, Sala G, Carpentier S, Levade T, Ghidoni R, Botti J, Codogno P. Regulation of autophagy by sphingosine kinase 1 and its role in cell survival during nutrient starvation. J Biol Chem 2006; 281:8518-27;PMID:16415355;http://dx.doi.org/ 10.1074/jbc.M506182200 [DOI] [PubMed] [Google Scholar]
- [12].Maeurer C, Holland S, Pierre S, Potstada W, Scholich K. Sphingosine-1-phosphate induced mTOR-activation is mediated by the E3-ubiquitin ligase PAM. Cell Signal 2009; 21:293-300; PMID:19000755; http://dx.doi.org/ 10.1016/j.cellsig.2008.10.016 [DOI] [PubMed] [Google Scholar]
- [13].Fyrst H, Saba JD. Sphingosine-1-phosphate lyase in development and disease: sphingolipid metabolism takes flight. Biochim Biophys Acta 2008; 1781:448-58; PMID:18558101; http://dx.doi.org/ 10.1016/j.bbalip.2008.05.005 [DOI] [PMC free article] [PubMed] [Google Scholar]
- [14].Rockenfeller P, Koska M, Pietrocola F, Minois N, Knittelfelder O, Sica V, Franz J, Carmona-Gutierrez D, Kroemer G, Madeo F. Phosphatidylethanolamine positively regulates autophagy and longevity. Cell Death Differ 2015; 22:499-508; PMID:25571976; http://dx.doi.org/ 10.1038/cdd.2014.219 [DOI] [PMC free article] [PubMed] [Google Scholar]
- [15].Mitroi DN, Deutschmann AU, Raucamp M, Karunakaran I, Glebov K, Hans M, Walter J, Saba J, Gräler M, Ehninger D, et al.. Sphingosine 1-phosphate lyase ablation disrupts presynaptic architecture and function via an ubiquitin- proteasome mediated mechanism. Sci Rep 2016; 6:37064; PMID:27883090; http://dx.doi.org/ 10.1038/srep37064 [DOI] [PMC free article] [PubMed] [Google Scholar]
- [16].Serra M, Saba JD. Sphingosine 1-phosphate lyase, a key regulator of sphingosine 1-phosphate signaling and function. Adv Enzyme Regul 2010; 50:349-62; PMID:19914275; http://dx.doi.org/ 10.1016/j.advenzreg.2009.10.024 [DOI] [PMC free article] [PubMed] [Google Scholar]
- [17].Bankowska A, Gacko M, Chyczewska E, Worowska A. Biological and diagnostic role of cathepsin D. Rocz Akad Med Bialymst 1997; 42 Suppl 1:79-85; PMID:9337526 [PubMed] [Google Scholar]
- [18].Selkoe DJ. Alzheimer's disease is a synaptic failure. Science 2002; 298:789-91; PMID:12399581; http://dx.doi.org/ 10.1126/science.1074069 [DOI] [PubMed] [Google Scholar]
- [19].Recchia A, Debetto P, Negro A, Guidolin D, Skaper SD, Giusti P. Alpha-synuclein and Parkinson's disease. FASEB J 2004; 18:617-26; PMID:15054084; http://dx.doi.org/ 10.1096/fj.03-0338rev [DOI] [PubMed] [Google Scholar]
- [20].Kimura S, Noda T, Yoshimori T. Dissection of the autophagosome maturation process by a novel reporter protein, tandem fluorescent-tagged LC3. Autophagy 2007; 3:452-60; PMID:17534139; http://dx.doi.org/ 10.4161/auto.4451 [DOI] [PubMed] [Google Scholar]
- [21].Evangelisti C, Evangelisti C, Teti G, Chiarini F, Falconi M, Melchionda F, Pession A, Bertaina A, Locatelli F, McCubrey JA, et al.. Assessment of the effect of sphingosine kinase inhibitors on apoptosis, unfolded protein response and autophagy of T-cell acute lymphoblastic leukemia cells; indications for novel therapeutics. Oncotarget 2014; 5:7886-901; PMID:25226616; http://dx.doi.org/ 10.18632/oncotarget.2318 [DOI] [PMC free article] [PubMed] [Google Scholar]
- [22].Merrill AH., Jr. De novo sphingolipid biosynthesis: a necessary, but dangerous, pathway. J Biol Chem 2002; 277:25843-6; PMID:12011104; http://dx.doi.org/ 10.1074/jbc.R200009200 [DOI] [PubMed] [Google Scholar]
- [23].Hannun YA, Luberto C, Argraves KM. Enzymes of sphingolipid metabolism: from modular to integrative signaling. Biochemistry 2001; 40:4893-903; PMID:11305904; http://dx.doi.org/ 10.1021/bi002836k [DOI] [PubMed] [Google Scholar]
- [24].Zhang K, Pompey JM, Hsu FF, Key P, Bandhuvula P, Saba JD, Turk J, Beverley SM. Redirection of sphingolipid metabolism toward de novo synthesis of ethanolamine in Leishmania. EMBO J 2007; 26:1094-104; PMID:17290222; http://dx.doi.org/ 10.1038/sj.emboj.7601565 [DOI] [PMC free article] [PubMed] [Google Scholar]
- [25].Kihara A. Sphingosine 1-phosphate is a key metabolite linking sphingolipids to glycerophospholipids. Biochim Biophys Acta 2014; 1841:766-72; PMID:23994042; http://dx.doi.org/ 10.1016/j.bbalip.2013.08.014 [DOI] [PubMed] [Google Scholar]
- [26].Hagen-Euteneuer N, Lutjohann D, Park H, Merrill AH Jr., van Echten-Deckert G. Sphingosine 1-phosphate (S1P) lyase deficiency increases sphingolipid formation via recycling at the expense of de novo biosynthesis in neurons. J Biol Chem 2012; 287:9128-36; PMID:22291021; http://dx.doi.org/ 10.1074/jbc.M111.302380 [DOI] [PMC free article] [PubMed] [Google Scholar]
- [27].Hagen N, Hans M, Hartmann D, Swandulla D, van Echten-Deckert G. Sphingosine-1-phosphate links glycosphingolipid metabolism to neurodegeneration via a calpain-mediated mechanism. Cell Death Differ 2011; 18:1356-65; PMID:21331079; http://dx.doi.org/ 10.1038/cdd.2011.7 [DOI] [PMC free article] [PubMed] [Google Scholar]
- [28].Yang Z, Klionsky DJ. Mammalian autophagy: core molecular machinery and signaling regulation. Curr Opin Cell Biol 2010; 22:124-31; PMID:20034776; http://dx.doi.org/ 10.1016/j.ceb.2009.11.014 [DOI] [PMC free article] [PubMed] [Google Scholar]
- [29].Wang H, Sun RQ, Camera D, Zeng XY, Jo E, Chan SM, Herbert TP, Molero JC, Ye JM. Endoplasmic reticulum stress up-regulates Nedd4-2 to induce autophagy. FASEB J 2016; 30:2549-56; PMID:27022162; http://dx.doi.org/ 10.1096/fj.201500119 [DOI] [PubMed] [Google Scholar]
- [30].Sims K, Haynes CA, Kelly S, Allegood JC, Wang E, Momin A, Leipelt M, Reichart D, Glass CK, Sullards MC, et al.. Kdo2-lipid A, a TLR4-specific agonist, induces de novo sphingolipid biosynthesis in RAW264.7 macrophages, which is essential for induction of autophagy. J Biol Chem 2010; 285:38568-79; PMID:20876532; http://dx.doi.org/ 10.1074/jbc.M110.170621 [DOI] [PMC free article] [PubMed] [Google Scholar]
- [31].Rusten TE, Stenmark H. p62, an autophagy hero or culprit? Nat Cell Biol 2010; 12:207-9; PMID:20190829; http://dx.doi.org/ 10.1038/ncb0310-207 [DOI] [PubMed] [Google Scholar]
- [32].Elrick MJ, Yu T, Chung C, Lieberman AP. Impaired proteolysis underlies autophagic dysfunction in Niemann-Pick type C disease. Hum Mol Genet 2012; 21:4876-87; PMID:22872701; http://dx.doi.org/ 10.1093/hmg/dds324 [DOI] [PMC free article] [PubMed] [Google Scholar]
- [33].Ordonez MP, Roberts EA, Kidwell CU, Yuan SH, Plaisted WC, Goldstein LS. Disruption and therapeutic rescue of autophagy in a human neuronal model of Niemann Pick type C1. Hum Mol Genet 2012; 21:2651-62; PMID:22437840; http://dx.doi.org/ 10.1093/hmg/dds090 [DOI] [PMC free article] [PubMed] [Google Scholar]
- [34].Hoglinger D, Haberkant P, Aguilera-Romero A, Riezman H, Porter FD, Platt FM, Galione A, Schultz C. Intracellular sphingosine releases calcium from lysosomes. eLife 2015; 4:e10616; PMID:26613410; http://dx.doi.org/ 10.7554/eLife.10616 [DOI] [PMC free article] [PubMed] [Google Scholar]
- [35].Karaca I, Tamboli IY, Glebov K, Richter J, Fell LH, Grimm MO, Haupenthal VJ, Hartmann T, Gräler MH, van Echten-Deckert G, et al.. Deficiency of sphingosine-1-phosphate lyase impairs lysosomal metabolism of the amyloid precursor protein. J Biol Chem 2014; 289(24):16761-72; PMID:24808180 [DOI] [PMC free article] [PubMed] [Google Scholar]
- [36].Degagne E, Pandurangan A, Bandhuvula P, Kumar A, Eltanawy A, Zhang M, Sphingosine-1-phospYoshinaga Y, Nefedov M, de Jong PJ, Fong LG, et al.. Sphingosine-1-phosphate lyase downregulation promotes colon carcinogenesis through STAT3-activated microRNAs. J Clin Invest 2014; 124:5368-84; PMID:25347472; http://dx.doi.org/ 10.1172/JCI74188 [DOI] [PMC free article] [PubMed] [Google Scholar]
- [37].van Echten-Deckert G, Zschoche A, Bar T, Schmidt RR, Raths A, Heinemann T, Sandhoff K. cis-4-Methylsphingosine decreases sphingolipid biosynthesis by specifically interfering with serine palmitoyltransferase activity in primary cultured neurons. J Biol Chem 1997; 272:15825-33; PMID:9188480; http://dx.doi.org/ 10.1074/jbc.272.25.15825 [DOI] [PubMed] [Google Scholar]
- [38].Kaech S, Banker G. Culturing hippocampal neurons. Nat Protoc 2006; 1:2406-15; PMID:17406484; http://dx.doi.org/ 10.1038/nprot.2006.356 [DOI] [PubMed] [Google Scholar]
- [39].Ullrich C, Daschil N, Humpel C. Organotypic vibrosections: novel whole sagittal brain cultures. J Neurosci Methods 2011; 201:131-41; PMID:21835204; http://dx.doi.org/ 10.1016/j.jneumeth.2011.07.021 [DOI] [PMC free article] [PubMed] [Google Scholar]
- [40].Bode C, Graler MH. Quantification of sphingosine-1-phosphate and related sphingolipids by liquid chromatography coupled to tandem mass spectrometry. Methods Mol Biol 2012; 874:33-44; PMID:22528437 [DOI] [PubMed] [Google Scholar]
- [41].Heinen M, Hettich MM, Ryan DP, Schnell S, Paesler K, Ehninger D. Adult-onset fluoxetine treatment does not improve behavioral impairments and may have adverse effects on the Ts65Dn mouse model of Down syndrome. Neural Plast 2012; 2012:467251; PMID:22848851; http://dx.doi.org/ 10.1155/2012/467251 [DOI] [PMC free article] [PubMed] [Google Scholar]
Associated Data
This section collects any data citations, data availability statements, or supplementary materials included in this article.


