

Abstract
There are 18 lysine deacetylases, also known as histone deacetylases (HDACs), that remove acetyl groups from histone and non-histone proteins, thereby playing critical roles in numerous biological processes. In many human cancers, HDACs are dysregulated through mutation, altered expression, or inappropriate recruitment to certain loci. However, knowledge of the genomic and transcriptomic alterations and the clinical significance of most HDACs in breast cancer remain incomplete. We used TCGA and METABRIC datasets to perform comprehensive, integrated genomic and transcriptomic analyses of 18 HDAC genes in approximately 3000 primary breast cancers and identified associations among recurrent copy number alteration, gene expression, clinicopathological features, and patient survival. We found distinct patterns of copy number alteration and expression for each HDAC in breast cancer subtypes. We demonstrated that HDAC2 and SIRT7 were the most commonly amplified/overexpressed, and SIRT3 was most deleted/underexpressed, particularly in aggressive basal-like breast cancer. Overexpression of HDAC2 was significantly correlated with high tumor grade, positive lymph node status, and poor prognosis. The HDAC inhibitor mocetinostat showed anti-tumor effects in HDAC2-overexpressing basal-like breast cancer lines in vitro. Furthermore, HDAC2 expression was positively correlated with a set of DNA-damage response genes, notably RAD51. We revealed a potential mechanism by which HDAC2 regulates RAD51 expression-by indirect mediation through microRNAs, e.g., miR-182. HDAC inhibitors have emerged as a promising new class of multifunctional anticancer agents. Identifying which breast cancers or patients show HDAC deregulation that contributes to tumor development/progression might enable us to improve target cancer therapy.
Keywords: Breast cancer, histone deacetylase, RAD51, mocetinostat, microRNA
Introduction
Lysine acetylation is an important epigenetic modification in the cell that is controlled by two groups of enzymes-lysine acetyltransferases and lysine deacetylases [1]. Lysine deacetylases, more commonly called histone deacetylases (HDACs), which were first identified in 1995, remove acetyl groups from both histone and non-histone proteins [2]. Based on sequence homology to yeast, domain originations, and cellular localization, 18 human HDACs have been grouped into four classes [3]. Class I (HDACs 1, 2, 3 and 8), which is homologous to Rpd3 in yeast, has robust deacetylase activity and primarily localizes to the nucleus of all cells. Class IIa (HDACs 4, 5, 7, and 9) and IIb (HDACs 6 and 10) are homologous to yeast Hda1 and can shuttle between the nucleus and cytoplasm, indicating that this class of HDACs is also involved in the acetylation of non-histone proteins. The recently discovered HDAC11 is the only member of class IV, which shares sequence similarity with both class I and II HDAC proteins. Class I, II, and IV HDACs are Zn2+-dependent histone deacetylases. Class III HDACs, which are usually called sirtuins (SIRT 1-7), are nicotinamide adenine dinucleotide -dependent protein deacetylases, and they are localized to the nucleus (SIRT1, SIRT6, and SIRT7), mitochondria (SIRT3, SIRT4, and SIRT5), or cytoplasm (SIRT2).
HDACs play critical roles in regulating a wide array of biological processes, including gene transcription, DNA repair, protein stability, immune function, and signaling pathways [1,3]. Mounting evidence has shown that HDACs are dysregulated in a significant subset of cancers, including breast cancer [4]. Overexpression of class I HDACs (HDACs 1, 2, 3, and 8) has been observed in many cancer types, including gastric, colorectal, esophageal, pancreatic, prostate, and breast; in some cases they are significantly related to tumor cell growth and poor prognosis [4]. Recent immunohistochemical analysis revealed that HDAC2 overexpression is an indicator of poor prognosis of breast cancer patients who have elevated expression of a multidrug resistance-associated protein [5]. In contrast, class III HDACs (SIRT 1-7) have complex roles in promoting and/or suppressing tumorigenesis [6]. For example, nuclear sirtuin, SIRT7, which targets acetylated lysine in the N-terminal tail of histone H3 (H3K18Ac), has been implicated in maintaining the transformed phenotype of cancer cells [7]. Conversely, mitochondrial sirtuins SIRT3 and SIRT4 function as tumor suppressors, and sirt3-knockout mice develop hormone receptor-positive mammary tumors [8,9].
Previous studies revealed the importance of several HDACs in breast cancer. However, our knowledge of the genomic and transcriptomic alterations and the clinical significance of most HDACs in breast cancer remain incomplete. In the present study, we performed a comprehensive, integrated genomic and transcriptomic analysis of 18 HDAC genes in approximately 3000 primary breast cancers and identified associations with recurrent copy number alteration (CNA), gene expression, clinicopathologic features, and patient survival. Furthermore, we investigated how HDACs, particularly HDAC2, correlate with and modulate DNA-damage response (DDR) pathway genes, notably RAD51. We also evaluated the therapeutic potential of the HDAC inhibitor mocetinostat in basal breast cancer. HDAC inhibitors have emerged as a promising new class of multifunctional anticancer agents. Thus, to develop rational, targeted cancer therapy it is important to identify which breast cancers or which patients have HDAC deregulation resulting in tumor development/progression.
Materials and methods
Cell culture
The Colo824 cell line was obtained from DSMZ (Braunschweig, Germany), SUM cell lines were obtained from Dr. Stephen P. Ethier, and all other cell lines in this study were obtained from American Type Culture Collection (Manassas, VA, USA). Our cultures for the SUM series of breast cancer cell lines and an immortalized, nontransformed human mammary epithelial MCF10A cell line have been described in detail [10,11]. All cell lines were tested routinely and authenticated using cell morphology, proliferation rate, a panel of genetic markers, and contamination checks.
Genomic and clinical data on TCGA and METABRIC breast cancer samples
The overall survival data associated with 960 breast cancer samples from The Cancer Genome Atlas (TCGA) were obtained from the cBio Cancer Genomics Portal (http://www.cbioportal.org) [12,13]. In the Cbioportal, the copy number for each HDAC gene was generated by the GISTIC (Genomic Identification of Significant Targets in Cancer) algorithm and categorized as copy number level per gene: “-2” is a deep loss (possibly a homozygous deletion), “-1” is a heterozygous deletion, “0” is diploid, “1” indicates a low-level gain, and “2” is a high-level amplification. For mRNA expression data, the relative expression of an individual gene and the gene’s expression distribution in a reference population were analyzed. The reference population consisted of either tumors that are diploid for the gene in question, or, when available, normal adjacent tissue. The returned value indicates the number of standard deviations from the mean of expression in the reference population (Z-score). Somatic mutation data were obtained by exome sequencing [12,13]. Breast cancer subtype and clinicopathologic information were obtained from a previous publication and extracted via the UCSC Cancer Genomics Browser (genome-cancer.ucsc.edu) and the cBio Cancer Genomics Portal [12,14]. Among the 960 breast cancer samples, 808 had subtype data available, including 22 normal-like, 405 Luminal A, 185 Luminal B, 66 HER2+, and 130 basal-like breast cancers [12,15]. The METABRIC dataset contains approximately 2000 primary breast cancers with long-term clinical follow-up data. A detailed description of the dataset is presented in the original publication [16]. The CNAs and normalized expression data from the METABRIC database were downloaded with access permissions from the European Genome-phenome Archive (https://www.ebi.ac.uk/ega) under accession number EGAC00000000005 as well as from the cBio Cancer Genomics Portal [12]. In the METABRIC dataset, 1974 samples had subtype data available, including 199 normal-like, 718 Luminal A, 488 Luminal B, 240 HER2+, and 329 basal-like breast cancers [16].
Semiquantitative PCR reactions
To assess gene expression at the mRNA level, RNA was prepared from human breast cancer cell lines and the MCF10A cell line by using an RNeasy Plus Mini Kit (QIAGEN). RNA was mixed with qScript cDNA SuperMix (Quanta Biosciences, Gaithersburg, MD, USA) then converted to cDNA through a reverse-transcription (RT) reaction for real-time PCR reactions. Primer sets were obtained from Life Technologies (Carlsbad, CA, USA). A PUM1 primer set was used as a control. Semiquantitative RT-PCR was performed using the FastStart Universal SYBR Green Master (Roche Diagnostics, Indianapolis, IN, USA). To assess expression of miRNA-182 (miR-182) in SUM149 and HCC1937 cells, a microRNA LNA™ PCR primer set (Exiqon) was used. RNA was isolated by using a miRNeasy Mini Kit (QIAGEN) and reverse-transcribed in 20-μl reactions using a Universal cDNA Synthesis kit (Exiqon). cDNA was diluted 50× and assayed in 10-μl PCR reactions according to the manufacturer’s protocol for miRCURY LNA™ Universal RT microRNA PCR. To normalize the miR-182 expression level, a reference SNORD48 (hsa) PCR primer set was used.
Immunoblotting and antibodies
Whole-cell lysates were prepared by scraping cells from the dishes into cold RIPA lysis buffer. After centrifugation at high speed, protein content was estimated by the Bradford method. A total of 20-50 μg of total cell lysate was resolved by sodium dodecyl sulfate-polyacrylamide gel electrophoresis and transferred onto a polyvinylidene difluoride membrane. Antibodies used in the study included anti-HDAC2 (1:1000, Bethyl Laboratories A300-705A-T, Montgomery, TX, USA), anti-RAD51 (1:1000, Cell Signaling 8875, Danvers, MA, USA), anti-ERα (1:1000, Cell Signaling 8644), anti-β-actin (1:5000, Sigma-Aldrich A5441, St. Louis, MO), and anti-acetyl-histone H3K9, anti-acetyl-histone H3K27, anti-histone H3 (1:1000, Cell Signaling Acetyl-Histone H3 Antibody Sampler Kit 9927), and anti-cleaved-caspase 3 (1:1000, Cell Signaling 9664P).
Short-term cell viability and long-term growth assays
For a short-term cell viability assay, a total of 5000-10000 cells were plated in each well of a 96-well plate, allowed to grow for 24 hours, and then treated with various concentrations of mocetinostat in quadruplicate. The medium and drug were replenished on day 3. After incubation for 5 days, cell viability was assessed using a CellTiter-Blue® Cell Viability Assay kit (Promega), and surviving fractions were calculated by normalizing the fluorescence signal to that of untreated controls. For the long-term growth and survival assay, a total of 500-1000 cells were plated in each well of a 6-well plate. After 6-24 hours, the cells were treated with mocetinostat for 10-14 days. Then the cells were stained with 0.05% Crystal violet solution. Cells were photographed and counted with an automated mammalian cell colony counter (Oxford Optronix GELCOUNT, Oxford, United Kingdom).
Flow cytometric analysis
Cell cycle analysis was performed by flow cytometry after DAPI (4’,6-diamidino-2-phenylindole, dihydrochloride) staining. Cells were seeded on 60-mm dishes, incubated for 24 hours, and then treated with mocetinostat for 48 hours. Cells were digested by trypsin, washed twice with ice-cold PBS, then fixed in ice-cold ethanol for 2 hours. For cell cycle analysis, fixed cells were pelleted by centrifugation and washed once with PBS. Pellets were suspended in staining solution containing 1 μg/ml DAPI/Triton X-100 and kept in the dark for 30 min. Cell cycle distribution was monitored using a BDLSRII (BD Biosciences), and about 10000 events were counted. For apoptosis experiments, cells were trypsinized and incubated with propidium iodide (1 μg/ml) and Annexin V-FITC (1 μg/ml; Invitrogen, Carlsbad, CA, USA) for 15 min at 37°C. Samples were then analyzed for apoptosis by BDLSRII (BD Biosciences).
Statistical analysis
Statistical analyses were performed using R software (http://www.r-project.org) and Graphpad Prism (version 6.03). Spearman, Kendall, and Pearson correlation tests were used to correlate copy numbers and mRNA levels of each HDAC from TCGA breast cancer specimens. The Spearman and Kendall tests are rank correlations-the Spearman coefficient relates the two variables while conserving the order of data points, and the Kendall coefficient measures the number of ranks that match in the data set. We used the “cor” function in R for computation, specifying which type of test we wanted (Spearman, Kendall, or Pearson). The significance of difference in mRNA expression level for each HDAC among different subtypes, stages and grades of breast cancer samples was calculated using ANOVA and Welch’s t-test. To analyze the relationships between HDAC mRNA expression and overall patient survival in breast cancer, samples were divided into high and low expression groups of each HDAC, based on mRNA expression Z-scores in TCGA and METABRIC breast cancer datasets.
Results
Genetic alterations in HDAC genes in breast cancer
To determine the genomic landscape and clinical significance of HDACs in breast cancer, we first analyzed genetic alterations, including CNA and somatic mutation, in 18 human HDAC genes (Supplementary Table 1) from 960 breast cancer specimens in TCGA [12,13]. The copy number for each HDAC was generated by the copy number analysis algorithm GISTIC, and categorized as copy number level per gene into high-level amplification, low-level gain, diploid, heterozygous deletion, and homozygous deletion [12,13]. As shown in Table 1, the most frequently amplified HDAC gene was SIRT7, which is localized to chromosome 17q25.3; the most frequently deleted homozygous gene was SIRT3 (11p15.5); and the most mutated gene was HDAC6. We next examined the relative mRNA expression levels of each HDAC in TCGA breast cancer samples. Six HDACs (HDAC1, HDAC2, HDAC6, SIRT2, SIRT5, and SIRT7) were overexpressed at the mRNA level (Z-score ≥ 1) in more than 15% of breast cancers (Table 1). In contrast, the most deleted gene, SIRT3, had the highest frequency (27.29%) of mRNA underexpression (Z-score ≤ -1). Next, the correlation between copy number and mRNA level of each HDAC was analyzed by three different correlation tests-Spearman, Kendall, and Pearson. The highest weight was given to the Spearman correlation coefficient, as it measures the relationship between rank-ordered variables and relates the two variables while conserving the order of data points. Two genes, HDAC2 and SIRT3, had a Spearman correlation coefficient (r) greater than 0.5 (Supplementary Table 2).
Table 1.
Frequency (%) of HDAC genetic alterations and expression levels in TCGA breast cancers
| Gene | Location | DNA Alterations | mRNA Expression Levels | |||||||
|---|---|---|---|---|---|---|---|---|---|---|
|
|
|
|||||||||
| Amp | Gain | Diploid | Hetloss | Homdel | Mut | Z Score ≥ 1 | 1 > Z Score > -1 | Z Score ≤ -1 | ||
| HDAC1 | 1p35 | 0.63 | 9.38 | 56.46 | 33.33 | 0.21 | 0.52 | 15.52 | 65.52 | 18.96 |
| HDAC2 | 6q21 | 1.67 | 14.48 | 52.19 | 31.25 | 0.42 | 0.21 | 16.77 | 69.38 | 13.85 |
| HDAC3 | 5q31.3 | 0.21 | 20.42 | 57.71 | 21.67 | 0.00 | 0.10 | 14.69 | 67.81 | 17.50 |
| HDAC4 | 2q37.3 | 0.10 | 6.25 | 64.58 | 28.23 | 0.83 | 0.42 | 11.35 | 71.04 | 17.60 |
| HDAC5 | 17q21.31 | 1.04 | 19.17 | 45.31 | 33.96 | 0.52 | 0.63 | 11.98 | 63.54 | 24.48 |
| HDAC6 | Xp11.23 | 0.83 | 15.52 | 66.98 | 16.46 | 0.21 | 1.67 | 15.73 | 70.31 | 13.96 |
| HDAC7 | 12q13.11 | 0.42 | 20.00 | 65.31 | 14.27 | 0.00 | 0.10 | 10.94 | 70.21 | 18.85 |
| HDAC8 | Xq13.1 | 0.21 | 13.65 | 67.92 | 18.02 | 0.21 | 0.31 | 13.54 | 73.75 | 12.71 |
| HDAC9 | 7p21.1 | 1.56 | 30.63 | 56.46 | 11.25 | 0.10 | 0.42 | 8.23 | 91.77 | 0.00 |
| HDAC10 | 22q13.33 | 0.73 | 11.46 | 42.50 | 44.48 | 0.83 | 0.10 | 7.92 | 74.58 | 17.50 |
| HDAC11 | 3p25.1 | 1.46 | 17.60 | 64.17 | 16.67 | 0.10 | 0.31 | 13.33 | 70.94 | 15.73 |
| SIRT1 | 10q21.3 | 0.73 | 12.60 | 65.00 | 21.46 | 0.21 | 0.21 | 13.85 | 69.27 | 16.88 |
| SIRT2 | 19q13.2 | 2.19 | 21.88 | 60.21 | 15.52 | 0.21 | 0.10 | 18.75 | 66.15 | 15.10 |
| SIRT3 | 11p15.5 | 0.10 | 13.13 | 57.71 | 27.71 | 1.35 | 0.21 | 8.23 | 64.48 | 27.29 |
| SIRT4 | 12q24.31 | 0.63 | 16.98 | 62.81 | 19.38 | 0.21 | 0.00 | 12.19 | 72.92 | 14.90 |
| SIRT5 | 6p23 | 2.60 | 24.58 | 59.58 | 12.92 | 0.31 | 0.10 | 23.02 | 61.88 | 15.10 |
| SIRT6 | 19p13.3 | 0.83 | 13.65 | 58.02 | 27.19 | 0.31 | 0.10 | 10.63 | 80.10 | 9.27 |
| SIRT7 | 17q25.3 | 5.31 | 30.83 | 46.15 | 17.29 | 0.42 | 0.31 | 18.85 | 67.19 | 13.96 |
Using gene expression profiling, breast cancer has been classified into five intrinsic subtypes with distinct risks and underlying biology; these five subtypes are Luminal A, Luminal B, epidermal growth factor receptor 2-enriched (HER2+), basal-like, and normal-like breast cancers [14,17]. Basal-like (closely related to triple-negative) breast cancer tends to occur in young women and presents with an aggressive course, recurrence, distant metastasis, and shorter survival [18]. To determine whether the genetic alteration or mRNA expression of each HDAC is specific to a breast cancer subtype, we analyzed CNA and mRNA expression across the five breast cancer subtypes in TCGA dataset. The frequencies of copy number, somatic mutation, and expression level of HDAC genes in the five breast cancer subtypes are shown in Supplementary Table 3. Four HDACs (HDAC2, SIRT2, SIRT5, and SIRT7) had higher frequencies of amplification (> 5%) and/or overexpression (> 30%) in basal-like breast cancers compared with other subtypes (Figure 1 and Supplementary Table 3). Notably, HDAC2 was overexpressed (Z score ≥ 1) in more than 60% of TCGA basal-like breast cancers (Figure 1 and Supplementary Table 3). Conversely, SIRT3 exhibited deletion and underexpression in more than 50% of TCGA basal-like breast cancers (Figure 1 and Supplementary Table 3).
Figure 1.
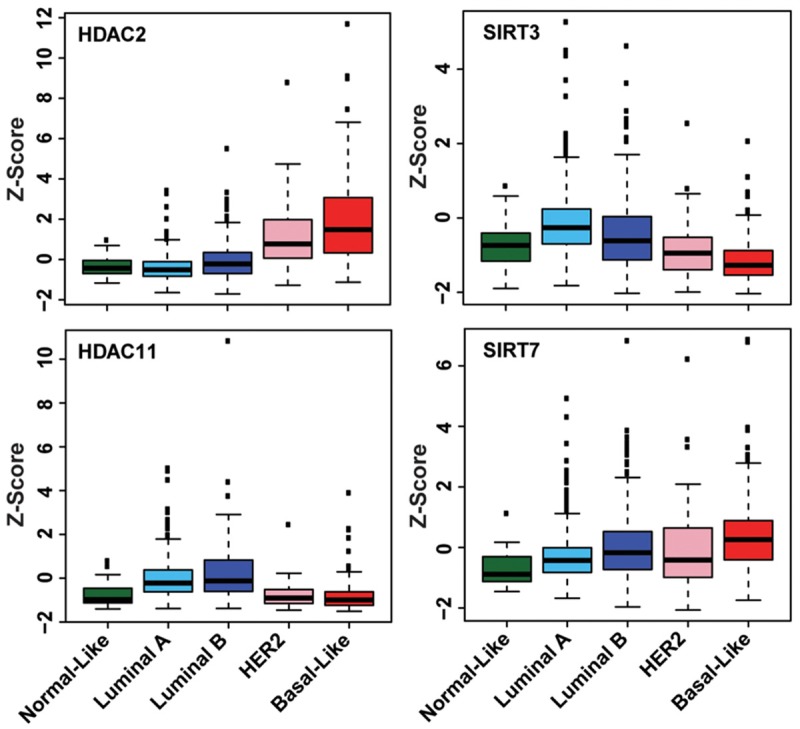
Distinct expression levels of four HDACs in breast cancer subtypes. The differences in HDAC2, HDAC11, SIRT3, and SIRT7 mRNA levels among TCGA breast cancer subtypes are statistically significant (P < 0.05).
To validate our findings from the TCGA breast cancer dataset regarding genetic alterations in HDACs, we conducted an independent analysis using the METABRIC breast cancer dataset. We found that SIRT7 was the most commonly amplified/gained HDAC gene in METABRIC breast cancer samples, although the frequency of gain/amplification identified in the METABRIC dataset is lower than that of the TCGA dataset, possibly due to the different CNA analysis platforms (Supplementary Table 4). As in TCGA, mRNA expression levels of HDAC2, SIRT5, and SIRT7 were significantly higher in basal-like breast cancers compared with that in other subtypes in the METABRIC dataset (Supplementary Figure 1 and Supplementary Table 5).
Association of HDAC gene expression with clinical features and survival of breast cancer patients
To investigate the clinicopathological relevance of HDACs in breast cancer, we examined expression levels of each HDAC gene in METABRIC breast cancers of different grades. Notably, HDAC2 and SIRT7 were significantly more highly expressed in higher-grade breast cancers (Figure 2A and Supplementary Table 6). Furthermore, we found that expression of HDAC2, but not SIRT7, was significantly higher in lymph node-positive breast cancer (Supplementary Table 7). The Nottingham prognostic index (NPI), a clinicopathological classification system based on tumor size, histologic grade, and lymph-node status that is widely used in Europe for breast cancer prognostication, was also available in the METABRIC cohort [19]. Thus, we compared expression level of 17 HDACs (excluding HDAC10 as its mRNA expression data was not available) in patients with high-risk NPI (> 3.4) and those with low-risk NPI (≤ 3.4). As shown in Figure 2B and Supplementary Table 8, we found that three HDACs (HDAC2, SIRT5, and SIRT7) were significantly more highly expressed, whereas five (HDAC4, HDAC5, HDAC11, SIRT1, and SIRT4) were underexpressed in samples with a high-risk NPI. Next, we analyzed the relationship between HDAC mRNA expression and overall survival of breast cancer patients. In TCGA dataset, we found that high mRNA level of HDAC2 was significantly associated with short overall survival (P = 0.0018) of breast cancer patients (Figure 2C). In the METABRIC dataset, disease-free survival clinical information was available. We confirmed that higher expression of HDAC2 was significantly associated with shorter disease-free survival (P = 0.0035) in METABRIC breast cancers (Figure 2D).
Figure 2.
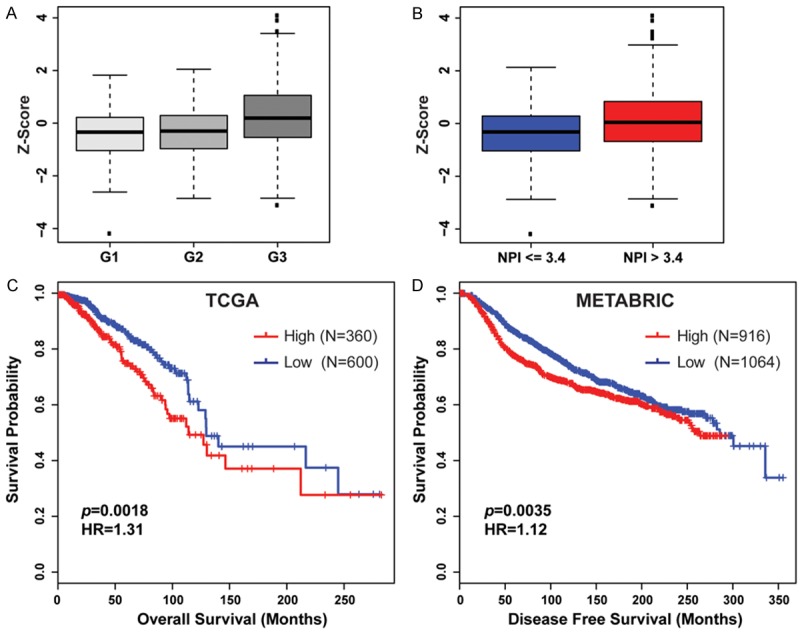
Expression of HDACs significantly correlates with high tumor grade and poor prognosis in breast cancer. A. HDAC2 was significantly more highly expressed in Grade 3 (G3) compared with that in Grade 1 (G1) and Grade 2 (G2) METABRIC breast cancers (P < 0.001). B. Patients with a poor prognosis (NPI > 3.4) have significantly increased levels of HDAC2 expressed in their tumors compared with that with a good prognosis (P < 0.001). C. Kaplan-Meier plots of overall survival associated with mRNA expression levels of HDAC2 in TCGA breast cancers. D. Kaplan-Meier plots of disease free survival associated with mRNA expression levels of HDAC2 in METABRIC breast cancers. High: Z-Score ≥ 0; Low: Z-Score < 0.
Profiling the expression of HDACs in cell models of breast cancer
Breast cancer cell lines and related animal models are essential tools with which to study cancer biology and to test novel therapeutic strategies. Thus, we next examined HDAC expression in a panel of breast cancer cells. Supplementary Figures 2 and 3 show expression levels of HDAC1-11 and SIRT1-7 based on RNA sequencing data from 51 breast cancer cell lines compared with five normal mammary epithelial cell lines. Consistent with the data from primary breast cancer specimens, we also found that HDAC2 was highly expressed in basal-like breast cancer cell lines, whereas HDAC11 was highly expressed in Luminal subtype breast cancer cell lines (Supplementary Figure 2). We next performed qRT-PCR and/or western blot assays to measure HDAC2 and HDAC11 in our 21 breast cancer cell lines. Compared with MCF10A, an immortalized but nontumorigenic breast epithelial cell line, mRNA levels of HDAC2 were more than two-fold higher in 7 of 21 breast cancer cell lines, most of which are basal-like breast cancers (Figure 3). HDAC11 was highly expressed in 9 of 21 breast cancer cell lines, 6 of which are Luminal subtypes (Supplementary Figure 4).
Figure 3.
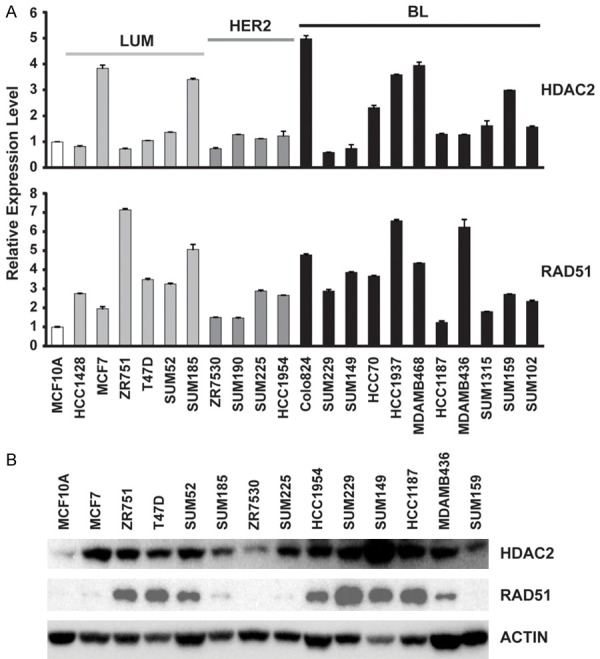
Expression levels of HDAC2 and RAD51 in a panel of breast cancer cell lines. A. mRNA expression levels of HDAC2 and RAD51, measured by qRT-PCR, in a panel of 21 breast cancer cell lines. mRNA expression levels in MCF10A cells were arbitrarily set as 1. Relative expression levels are shown as fold changes compared with those of MCF10A cells. LUM = Luminal subtypes, BL = Basal-like subtype. B. Immunoblot analysis of HDAC2 and RAD51 expression in a panel of 13 breast cancer cell lines as well as MCF10A line.
Therapeutic potential of the HDAC inhibitor mocetinostat in basal breast cancer
Based on expression profiling of HDACs in different subtypes of breast cancers, we determined that Class I HDACs, notably HDAC2, were commonly upregulated in the aggressive basal-like subtype (Figure 1 and Supplementary Table 3). Thus we chose to test the therapeutic potential of mocetinostat, a Class I HDAC inhibitor that is significantly more potent than vorinostat, in two basal breast cancer cell lines that express higher levels of HDAC2-HCC1937 and SUM49 (Figure 3). Treatment of SUM149 and HCC1937 cells with mocetinostat increased the acetylation of H3 lysine 9 (H3K9) and H3K27 in a dose-dependent manner (Figure 4A). We found that mocetinostat suppressed the proliferation of SUM149 and HCC1937 in MTT assays, with an IC50 value of 0.6 and 2.6 µM, respectively. We next assessed clonogenic growth of SUM149 and HCC1937 cells after mocetinostat treatment. In the presence of 0.5 µM mocetinostat, the colony formation was reduced by approximately 80% (P < 0.001) compared with the control cells (Figure 4B). To examine the effect of mocetinostat on cell cycle progression and apoptosis, we performed flow cytometry of DNA content in SUM149 and HCC1937 cells. As shown in Figure 4C and 4D, mocetinostat treatment led to a substantial increase in G2/M phase and decreases in G1 and S phase cells, suggesting that it hinders cell-cycle progression, particularly in SUM149 cells. Mocetinostat also potently induced apoptosis in SUM149 and HCC1937 cells, as shown by Annexin V assay and western blot analysis of cleaved caspase-3 (Figure 4A and Supplementary Figure 5).
Figure 4.
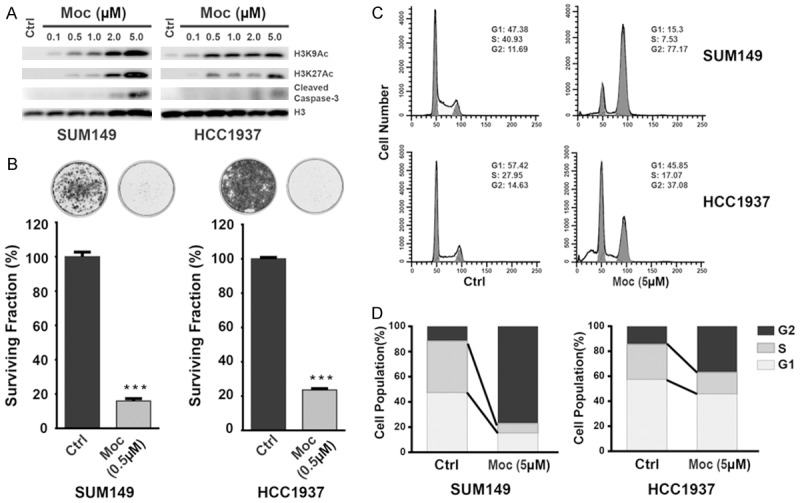
The effect of mocetinostat on growth and survival of HCC1937 and SUM149 basal-like breast cancer cells. A. Western blot analyses of acetylated histones H3K9 and H4K27 were performed on the cell lysates from SUM149 and HCC1937 cells after treatment with mocetinostat (Moc). Protein levels of cleaved caspase-3 were also measured by western blot after mocetinostat treatment. Protein levels of histone H3 in the same samples were used to monitor loading. B. Top: representative images of surviving cells stained with Crystal violet, with or without mocetinostat treatment. Bottom: relative growth shown as the mean ± SD of triplicate determinations (***P < 0.001). C, D. Cell-cycle analysis revealed an increase in the G2 phase population in both SUM149 and HCC1937 breast cancer cells after treatment with mocetinostat for 48 hours.
HDACs linked to DNA-damage response pathway, and inhibition of HDAC decreased RAD51 levels
Previous studies demonstrated that HDACs play important roles in the DDR pathway. In addition to being directly involved with DNA repair processes via deacetylating histones, the inhibition of HDACs also induces tumor cell-selective downregulation of DDR genes [20]. To determine which DDR genes had higher positive or negative correlation with HDAC expression in breast cancer, we queried the Spearman and Pearson correlations between each of the 11 HDACs (except SIRT1-7) and 129 DDR genes in TCGA breast cancer specimens from the cBioPortal database. Higher weight was assigned to the Spearman correlation coefficient. We found that expression of four HDACs (HDAC2, HDAC7, HDAC10, and HDAC11) was highly significantly correlated with expression of more than 10 DDR genes. HDAC2 and HDAC11 were predominantly positively correlated and HDAC7 and HDAC10 were negatively correlated with expression levels of a set of DDR genes (Supplementary Table 9). Notably, HDAC2 expression was positively correlated (Spearman r > 0.3) with 21 DDR genes, including RAD51 and FANCD2 (Figure 5A; Supplementary Table 9).
Figure 5.
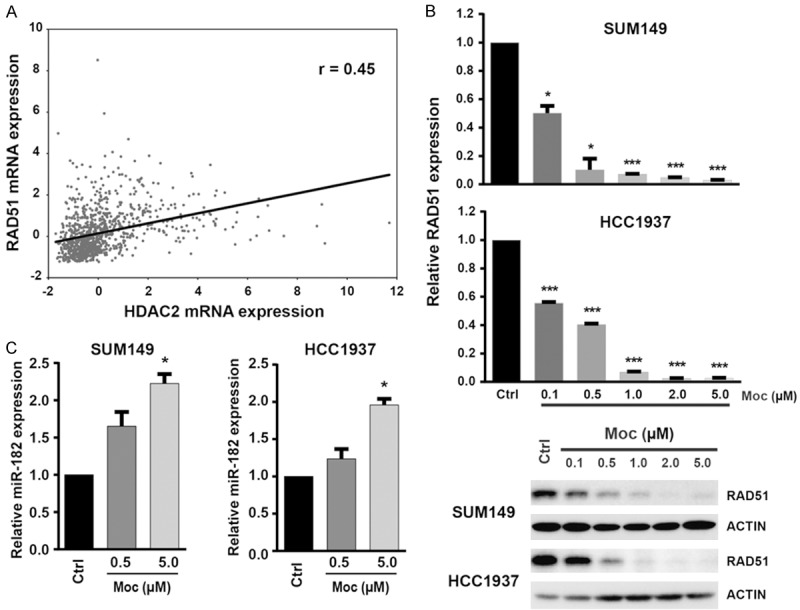
HDAC2 links to DDR gene RAD51 in breast cancer. A. TCGA data show significant positive correlations between HDAC2 and RAD51 mRNA expression in 960 TCGA breast cancers. B. qRT-PCR (Top) and western blot (Bottom) analysis of RAD51 expression after treatment with mocetinostat (Moc) in SUM149 and HCC1937 cells. Mocetinostat downregulated the expression of RAD51 at both mRNA and protein levels in SUM149 and HCC1937 cell lines. C. Loss of RAD51 was accompanied by increased expression of miR-182, measured by qRT-PCR after mocetinostat treatment in HCC1937 and SUM149 cell lines.
RAD51 is an evolutionarily conserved recombinase that is central to the DDR pathway [21]. RAD51 is highly expressed in basal-subtype TCGA breast cancers and SUM149 and HCC1937 lines (Figure 3 and Supplementary Figure 6). In addition, we found that after SUM149 and HCC1937 cells were treated with mocetinostat for 72 hours, expression of RAD51 at both mRNA and protein levels dramatically decreased in a dose-dependent manner (Figure 5B). A recent study in acute myelogenous leukemia revealed that HDAC inhibition induces microRNA-182 (miR-182), which subsequently targets and suppresses RAD51 expression [22]. We measured miR-182 levels in SUM149 and HCC1937 cells after mocetinostat treatment and found that the expression level of miR-182 increased in mocetinostat-treated SUM149 and HCC1937 cells compared to the controls (Figure 5C). Thus, the HDAC inhibitor mocetinostat likely induces miR-182 to target RAD51 in breast cancer.
Discussion
In this study, we provide a genotranscriptomic meta-analysis of 18 HDACs in human breast cancer. Integrated genomic, transcriptomic, and clinicopathological data revealed that different subtypes of breast cancer had distinctive copy number and expression patterns for each HDAC. HDAC2 and SIRT7 were the most commonly amplified/overexpressed, whereas SIRT3 was the most deleted/underexpressed HDAC in breast cancer, particularly in aggressive basal-like breast cancer. HDAC2 had the highest correlation between copy number and mRNA expression among the 18 HDAC genes studied, and higher expression of HDAC2 was significantly correlated with high tumor grade, positive lymph node status, and poor prognosis in breast cancer. Furthermore, HDAC2 expression was positively correlated with a set of DNA-damage response pathway genes, notably RAD51. We revealed a potential mechanism by which HDAC2 regulates RAD51 expression in breast cancer via indirect mediation through miRNAs, e.g., miR-182.
HDACs are divided into two superfamilies: the classic Zn2+-dependent histone deacetylases (HDAC1-11) and the nicotinamide adenine dinucleotide-requiring sirtuins (SIRT1-7) [3]. Although all Zn2+-dependent HDACs can function as lysine deacetylases, they do not catalyze deacetylation with equal efficiency. Biochemical experiments with recombinant HDAC1-11 provided a ranking of intrinsic deacetylase activity in which HDAC2 > 1 > 6 > 3 > 4, 5, 7, 8, 10 > 11 > 9 [23]. SIRT1-7 also have different levels of intrinsic deacetylase activity, with SIRT1-3 being more catalytically active than SIRT6 and 7 [24]. Furthermore, the deacetylase activity of each HDAC in vivo might be highly cell type specific and context dependent, e.g., if it is part of a multiprotein complex.
HDAC1 and 2, which primarily localize to the nucleus of all cells, are arguably the most important deacetylases involved in epigenetic regulation. The genes for HDAC1 and HDAC2 originate from gene duplication, and the two proteins are highly homologous. These two HDACs often function together in multisubunit repressor complexes, including the Sin3 complex, the nucleosome remodeling and deacetylating (NuRD) complex, and the co-repressor for element 1-silencing transcription factor (CoREST) complex [1,4]. However, studies have also shown that HDAC1 and HDAC2 have both distinct and redundant functions in tumorigenesis, neurological diseases, and others [25,26]. A recent study using knock-in mouse models to determine the impact of the catalytic activity of HDAC1 and HDAC2 on murine development demonstrated an essential non-redundant function of HDAC2 on murine development [27]. In prostate cancer, HDAC1 and HDAC2 were highly expressed in tumors with a high Gleason score, but only HDAC2 expression was associated with a shorter relapse-free survival time after radical prostatectomy [28]. Overexpression of HDAC2 enhanced the proliferation of gastric cancer cells by deregulating expression of G1/S cell cycle proteins [29]. Jung et al revealed that HDAC2 conferred oncogenic potential to human lung cancer cells by deregulating expression of apoptosis and cell cycle proteins [30]. HDAC2 also plays a fundamental role in Myc-mediated oncogenesis [31]. In the current study, we found that both HDAC1 and HDAC2 were highly expressed in breast cancer samples, based on their expression in 144 normal breast samples compared with 1980 cancer samples in the METABRIC cohort (Supplementary Figure 7). Consistent with findings in prostate cancer, we found that increased expression of HDAC2, but not HDAC1, was significantly associated with a high-risk NPI score and short overall and disease-free survival of breast cancer patients. Thus, our meta-analysis indicated that both HDAC1 and HDAC2 are highly expressed in breast cancer and that HDAC2 might play a more important role in promoting cancer progression.
HDAC11 is the most recently identified HDAC family member and has little homology to HDAC1 and HDAC2. Early studies found that HDAC11 regulates interleukin-10 expression and immune tolerance and is implicit in autoimmunity, transplantation, and cancer immunotherapy [32]. A recent study revealed that depletion of HDAC11 induced apoptosis and inhibited the metabolic activity of colon, breast, prostate, and ovarian cancer cell lines [33]. In this study, we also found that HDAC11 was highly expressed in luminal subtype breast cancers, which are characterized by expression of estrogen receptor-α (ERα). To test whether HDAC11 is a potential target of the ER pathway, we used a nonsteroidal, selective ER modulator (tamoxifen) to treat the Luminal breast cancer cell line ZR75-1. We found that expression of HDAC11 at the mRNA level was reduced in ZR75-1 line after tamoxifen treatment (Supplementary Figure 8). By analyzing published data on ERα chromatin immunoprecipitation sequencing (ChIP-Seq) in ER-positive breast cancer cell lines, we also found that ERα directly binds to the genomic regions of the HDAC11 gene (data not shown) [34,35]. It is necessary to further investigate whether and how HDAC11 functions as an oncogene driving Luminal breast cancers.
Among 18 HDAC genes, SIRT7 was most frequently amplified/overexpressed, and SIRT3 was most deleted/underexpressed in breast cancer (Table 1). Seven different sirtuins (SIRT1-7) are localized in various cell compartments. SIRT3, SIRT4, and SIRT5 are mitochondrial sirtuins that regulate enzymes and other mitochondrial proteins, subsequently affecting metabolic processes [36]. SIRT3 deacetylates key mitochondrial proteins, including acetyl-coenzyme A synthetase 2, isocitrate dehydrogenase 2, and manganese superoxide dismutase [36]. Previous studies also revealed that SIRT3 depletion increases levels of cellular reactive oxygen species, thereby contributing to genomic and mitochondrial DNA instability, and that sirt3-knockout mice develop ER-positive mammary tumors [12,13]. Conversely, overexpression of the nuclear sirtuin SIRT7 seems to be crucial for maintenance of tumor phenotype, and xenografts of human cancer cells that are depleted of SIRT7 exhibit reduced tumorigenicity [7,37]. Our data agree with and consolidate prior reports on the tumor suppressive role of SIRT3, as well as a tumor-promoting role for SIRT7 in various tumors, including breast cancer [6,36].
Numerous studies have shown that HDACs have important roles in the DDR pathway in mammalian cells [38]. The DDR response is a complex cellular network that detects the damaged lesion in DNA, signals the presence of the lesion to the cell to activate the appropriate response, and ultimately repairs the lesion to maintain the correct DNA sequence [39]. One particularly dangerous type of lesion is the DNA double-strand break. In mammalian cells, double-strand breaks are repaired mainly by either homologous recombination (HR) or non-homologous end-joining (NHEJ) [40]. HDAC1 and HDAC2 are recruited to DNA-damaged sites to deacetylate histones H3K56 and H4K16 and facilitate NHEJ, indicating that these two enzymes play a direct role in DDR pathways [41]. Furthermore, recent studies demonstrated that HDACs directly or indirectly regulate expression of a subset of DDR genes [20]. For example, HDAC inhibitors downregulate mRNA and protein expression of RAD51, a key component of the HR pathway [22,42,43]. Both BRCA1 and BRCA2, the two best-known genes linked to breast cancer risk, colocalize with RAD51 at sites of DNA damage and activate HR repair. Paradoxically, RAD51 is overexpressed in multiple tumor types, including breast cancer [44]. Overexpression of RAD51 has been shown to stimulate HR efficiency and promote chemotherapy resistance in cancer cells [45]. Furthermore, RAD51 supports metastasis in triple-negative breast cancer [46]. By siRNA knockdown of HDAC1, HDAC2, and HDAC3 individually in melanoma cells, Krumm et al recently demonstrated that, of those three HDACs, HDAC2 is responsible for regulating RAD51 [42]. We also found that among class I HDACs, HDAC2 expression was dramatically correlated with expression of a set of DDR genes, including RAD51, in breast cancer. Treatment with the HDAC inhibitor mocetinostat in two basal-like breast cancer cell lines, SUM149 and HCC1937, decreased expression of RAD51 at both mRNA and protein levels. In human cancer, HDACs contribute to dysregulation of a specific set of miRNAs (e.g., miR-31, miR-125a, miR-125b, miR-200b, and miR-205) [47-50]. Recently, studies showed that the breast cancer-associated miRNA, miR-182, targets RAD51 and that HDAC2 binds the miR-182 promoter and regulates its expression in leukemia cells [22]. We found that mocetinostat treatment also induced miR-182 expression in SUM149 and HCC1937 cells, indicating a possible mechanism by which HDAC2 regulates RAD51 expression in breast cancer, namely, by indirect mediation through miRNAs, notably miR-182.
Although current HDAC inhibitors have been shown to treat specific hematologic malignancies efficaciously, their therapeutic utility in epithelium-based cancers, including breast cancer, warrants further evaluation. Furthermore, HDAC inhibitors are continuously explored for use in combination with other antitumor agents, e.g., HDAC inhibitors combined with primary chemotherapeutic agents, hormone antagonists, or immunotherapy have shown promising results. Given the distinct genotranscriptomic patterns for each HDAC in breast cancer subtypes, development of more selective agents (inhibitors) that target individual HDACs is likely required, such that they are more efficacious with less toxicity. In parallel, to develop additional rational cancer therapies, it will be necessary to identify the breast cancer subtypes or patients in which HDAC deregulation contributes to tumor development/progression.
Acknowledgements
This work was partially supported by grants from the NIH/NCI R21CA175244-01A1 and the Office of Research on Women’s Health (OWRH) of NIH, the Department of Defense (DoD) Prostate Cancer Program PC130259 to Dr. Zengquan Yang, by funding from the China International Postdoctoral Exchange Fellowship Program to Huimei Yu. We thank Hui Liu and Xiaofang Chu for technical contributions. We thank Dr. Stephen P. Ethier for providing the SUM breast cancer cell lines.
Disclosure of conflict of interest
None.
Supporting Information
References
- 1.Drazic A, Myklebust LM, Ree R, Arnesen T. The world of protein acetylation. Biochim Biophys Acta. 2016;1864:1372–1401. doi: 10.1016/j.bbapap.2016.06.007. [DOI] [PubMed] [Google Scholar]
- 2.Kleff S, Andrulis ED, Anderson CW, Sternglanz R. Identification of a gene encoding a yeast histone H4 acetyltransferase. J Biol Chem. 1995;270:24674–24677. doi: 10.1074/jbc.270.42.24674. [DOI] [PubMed] [Google Scholar]
- 3.Van Dyke MW. Lysine deacetylase (KDAC) regulatory pathways: an alternative approach to selective modulation. ChemMedChem. 2014;9:511–522. doi: 10.1002/cmdc.201300444. [DOI] [PMC free article] [PubMed] [Google Scholar]
- 4.Li Y, Seto E. HDACs and HDAC inhibitors in cancer development and therapy. Cold Spring Harb Perspect Med. 2016:6. doi: 10.1101/cshperspect.a026831. [DOI] [PMC free article] [PubMed] [Google Scholar]
- 5.Muller BM, Jana L, Kasajima A, Lehmann A, Prinzler J, Budczies J, Winzer KJ, Dietel M, Weichert W, Denkert C. Differential expression of histone deacetylases HDAC1, 2 and 3 in human breast cancer--overexpression of HDAC2 and HDAC3 is associated with clinicopathological indicators of disease progression. BMC Cancer. 2013;13:215. doi: 10.1186/1471-2407-13-215. [DOI] [PMC free article] [PubMed] [Google Scholar]
- 6.Chalkiadaki A, Guarente L. The multifaceted functions of sirtuins in cancer. Nat Rev Cancer. 2015;15:608–624. doi: 10.1038/nrc3985. [DOI] [PubMed] [Google Scholar]
- 7.Barber MF, Michishita-Kioi E, Xi Y, Tasselli L, Kioi M, Moqtaderi Z, Tennen RI, Paredes S, Young NL, Chen K, Struhl K, Garcia BA, Gozani O, Li W, Chua KF. SIRT7 links H3K18 deacetylation to maintenance of oncogenic transformation. Nature. 2012;487:114–118. doi: 10.1038/nature11043. [DOI] [PMC free article] [PubMed] [Google Scholar]
- 8.Finley LW, Carracedo A, Lee J, Souza A, Egia A, Zhang J, Teruya-Feldstein J, Moreira PI, Cardoso SM, Clish CB, Pandolfi PP, Haigis MC. SIRT3 opposes reprogramming of cancer cell metabolism through HIF1alpha destabilization. Cancer Cell. 2011;19:416–428. doi: 10.1016/j.ccr.2011.02.014. [DOI] [PMC free article] [PubMed] [Google Scholar]
- 9.Kim HS, Patel K, Muldoon-Jacobs K, Bisht KS, Aykin-Burns N, Pennington JD, van der Meer R, Nguyen P, Savage J, Owens KM, Vassilopoulos A, Ozden O, Park SH, Singh KK, Abdulkadir SA, Spitz DR, Deng CX, Gius D. SIRT3 is a mitochondria-localized tumor suppressor required for maintenance of mitochondrial integrity and metabolism during stress. Cancer Cell. 2010;17:41–52. doi: 10.1016/j.ccr.2009.11.023. [DOI] [PMC free article] [PubMed] [Google Scholar]
- 10.Yang ZQ, Streicher KL, Ray ME, Abrams J, Ethier SP. Multiple interacting oncogenes on the 8p11-p12 amplicon in human breast cancer. Cancer Res. 2006;66:11632–11643. doi: 10.1158/0008-5472.CAN-06-2946. [DOI] [PubMed] [Google Scholar]
- 11.Liu G, Bollig-Fischer A, Kreike B, van de Vijver MJ, Abrams J, Ethier SP, Yang ZQ. Genomic amplification and oncogenic properties of the GASC1 histone demethylase gene in breast cancer. Oncogene. 2009;28:4491–4500. doi: 10.1038/onc.2009.297. [DOI] [PMC free article] [PubMed] [Google Scholar]
- 12.Cerami E, Gao J, Dogrusoz U, Gross BE, Sumer SO, Aksoy BA, Jacobsen A, Byrne CJ, Heuer ML, Larsson E, Antipin Y, Reva B, Goldberg AP, Sander C, Schultz N. The cBio cancer genomics portal: an open platform for exploring multidimensional cancer genomics data. Cancer Discov. 2012;2:401–404. doi: 10.1158/2159-8290.CD-12-0095. [DOI] [PMC free article] [PubMed] [Google Scholar]
- 13.Gao JJ, Aksoy BA, Dogrusoz U, Dresdner G, Gross B, Sumer SO, Sun YC, Jacobsen A, Sinha R, Larsson E, Cerami E, Sander C, Schultz N. Integrative analysis of complex cancer genomics and clinical profiles using the cBioPortal. Sci Signal. 2013;6:pl1. doi: 10.1126/scisignal.2004088. [DOI] [PMC free article] [PubMed] [Google Scholar]
- 14.Cancer Genome Atlas Network. Comprehensive molecular portraits of human breast tumours. Nature. 2012;490:61–70. doi: 10.1038/nature11412. [DOI] [PMC free article] [PubMed] [Google Scholar]
- 15.Liu H, Liu L, Holowatyj A, Jiang Y, Yang ZQ. Integrated genomic and functional analyses of histone demethylases identify oncogenic KDM2A isoform in breast cancer. Mol Carcinog. 2016;55:977–990. doi: 10.1002/mc.22341. [DOI] [PMC free article] [PubMed] [Google Scholar]
- 16.Curtis C, Shah SP, Chin SF, Turashvili G, Rueda OM, Dunning MJ, Speed D, Lynch AG, Samarajiwa S, Yuan Y, Graf S, Ha G, Haffari G, Bashashati A, Russell R, McKinney S, Group M, Langerod A, Green A, Provenzano E, Wishart G, Pinder S, Watson P, Markowetz F, Murphy L, Ellis I, Purushotham A, Borresen-Dale AL, Brenton JD, Tavare S, Caldas C, Aparicio S. The genomic and transcriptomic architecture of 2,000 breast tumours reveals novel subgroups. Nature. 2012;486:346–352. doi: 10.1038/nature10983. [DOI] [PMC free article] [PubMed] [Google Scholar]
- 17.Perou CM, Sorlie T, Eisen MB, van de Rijn M, Jeffrey SS, Rees CA, Pollack JR, Ross DT, Johnsen H, Akslen LA, Fluge O, Pergamenschikov A, Williams C, Zhu SX, Lonning PE, Borresen-Dale AL, Brown PO, Botstein D. Molecular portraits of human breast tumours. Nature. 2000;406:747–752. doi: 10.1038/35021093. [DOI] [PubMed] [Google Scholar]
- 18.Bertucci F, Finetti P, Birnbaum D. Basal breast cancer: a complex and deadly molecular subtype. Curr Mol Med. 2012;12:96–110. doi: 10.2174/156652412798376134. [DOI] [PMC free article] [PubMed] [Google Scholar]
- 19.Galea MH, Blamey RW, Elston CE, Ellis IO. The Nottingham Prognostic Index in primary breast cancer. Breast Cancer Res Treat. 1992;22:207–219. doi: 10.1007/BF01840834. [DOI] [PubMed] [Google Scholar]
- 20.Newbold A, Falkenberg KJ, Prince HM, Johnstone RW. How do tumor cells respond to HDAC inhibition? FEBS J. 2016;283:4032–4046. doi: 10.1111/febs.13746. [DOI] [PubMed] [Google Scholar]
- 21.Roos WP, Thomas AD, Kaina B. DNA damage and the balance between survival and death in cancer biology. Nat Rev Cancer. 2016;16:20–33. doi: 10.1038/nrc.2015.2. [DOI] [PubMed] [Google Scholar]
- 22.Lai TH, Ewald B, Zecevic A, Liu C, Sulda M, Papaioannou D, Garzon R, Blachly JS, Plunkett W, Sampath D. HDAC inhibition induces MicroRNA-182, which targets RAD51 and impairs HR repair to sensitize cells to sapacitabine in acute myelogenous leukemia. Clin Cancer Res. 2016;22:3537–3549. doi: 10.1158/1078-0432.CCR-15-1063. [DOI] [PMC free article] [PubMed] [Google Scholar]
- 23.Halley F, Reinshagen J, Ellinger B, Wolf M, Niles AL, Evans NJ, Kirkland TA, Wagner JM, Jung M, Gribbon P, Gul S. A bioluminogenic HDAC activity assay: validation and screening. J Biomol Screen. 2011;16:1227–1235. doi: 10.1177/1087057111416004. [DOI] [PubMed] [Google Scholar]
- 24.Michishita E, Park JY, Burneskis JM, Barrett JC, Horikawa I. Evolutionarily conserved and nonconserved cellular localizations and functions of human SIRT proteins. Mol Biol Cell. 2005;16:4623–4635. doi: 10.1091/mbc.E05-01-0033. [DOI] [PMC free article] [PubMed] [Google Scholar]
- 25.Jurkin J, Zupkovitz G, Lagger S, Grausenburger R, Hagelkruys A, Kenner L, Seiser C. Distinct and redundant functions of histone deacetylases HDAC1 and HDAC2 in proliferation and tumorigenesis. Cell Cycle. 2011;10:406–412. doi: 10.4161/cc.10.3.14712. [DOI] [PMC free article] [PubMed] [Google Scholar]
- 26.Wilting RH, Yanover E, Heideman MR, Jacobs H, Horner J, van der Torre J, DePinho RA, Dannenberg JH. Overlapping functions of Hdac1 and Hdac2 in cell cycle regulation and haematopoiesis. EMBO J. 2010;29:2586–2597. doi: 10.1038/emboj.2010.136. [DOI] [PMC free article] [PubMed] [Google Scholar]
- 27.Hagelkruys A, Mattes K, Moos V, Rennmayr M, Ringbauer M, Sawicka A, Seiser C. Essential nonredundant function of the catalytic activity of histone deacetylase 2 in mouse development. Mol Cell Biol. 2015;36:462–474. doi: 10.1128/MCB.00639-15. [DOI] [PMC free article] [PubMed] [Google Scholar]
- 28.Weichert W, Roske A, Gekeler V, Beckers T, Stephan C, Jung K, Fritzsche FR, Niesporek S, Denkert C, Dietel M, Kristiansen G. Histone deacetylases 1, 2 and 3 are highly expressed in prostate cancer and HDAC2 expression is associated with shorter PSA relapse time after radical prostatectomy. Br J Cancer. 2008;98:604–610. doi: 10.1038/sj.bjc.6604199. [DOI] [PMC free article] [PubMed] [Google Scholar]
- 29.Kim JK, Noh JH, Eun JW, Jung KH, Bae HJ, Shen Q, Kim MG, Chang YG, Kim SJ, Park WS, Lee JY, Borlak J, Nam SW. Targeted inactivation of HDAC2 restores p16INK4a activity and exerts antitumor effects on human gastric cancer. Mol Cancer Res. 2013;11:62–73. doi: 10.1158/1541-7786.MCR-12-0332. [DOI] [PubMed] [Google Scholar]
- 30.Jung KH, Noh JH, Kim JK, Eun JW, Bae HJ, Xie HJ, Chang YG, Kim MG, Park H, Lee JY, Nam SW. HDAC2 overexpression confers oncogenic potential to human lung cancer cells by deregulating expression of apoptosis and cell cycle proteins. J Cell Biochem. 2012;113:2167–2177. doi: 10.1002/jcb.24090. [DOI] [PubMed] [Google Scholar]
- 31.Ecker J, Oehme I, Mazitschek R, Korshunov A, Kool M, Hielscher T, Kiss J, Selt F, Konrad C, Lodrini M, Deubzer HE, von Deimling A, Kulozik AE, Pfister SM, Witt O, Milde T. Targeting class I histone deacetylase 2 in MYC amplified group 3 medulloblastoma. Acta Neuropathol Commun. 2015;3:22. doi: 10.1186/s40478-015-0201-7. [DOI] [PMC free article] [PubMed] [Google Scholar]
- 32.Villagra A, Cheng F, Wang HW, Suarez I, Glozak M, Maurin M, Nguyen D, Wright KL, Atadja PW, Bhalla K, Pinilla-Ibarz J, Seto E, Sotomayor EM. The histone deacetylase HDAC11 regulates the expression of interleukin 10 and immune tolerance. Nat Immunol. 2009;10:92–100. doi: 10.1038/ni.1673. [DOI] [PMC free article] [PubMed] [Google Scholar]
- 33.Deubzer HE, Schier MC, Oehme I, Lodrini M, Haendler B, Sommer A, Witt O. HDAC11 is a novel drug target in carcinomas. Int J Cancer. 2013;132:2200–2208. doi: 10.1002/ijc.27876. [DOI] [PubMed] [Google Scholar]
- 34.Mohammed H, Russell IA, Stark R, Rueda OM, Hickey TE, Tarulli GA, Serandour AA, Birrell SN, Bruna A, Saadi A, Menon S, Hadfield J, Pugh M, Raj GV, Brown GD, D’Santos C, Robinson JL, Silva G, Launchbury R, Perou CM, Stingl J, Caldas C, Tilley WD, Carroll JS. Progesterone receptor modulates ERalpha action in breast cancer. Nature. 2015;523:313–317. doi: 10.1038/nature14583. [DOI] [PMC free article] [PubMed] [Google Scholar]
- 35.Ross-Innes CS, Stark R, Teschendorff AE, Holmes KA, Ali HR, Dunning MJ, Brown GD, Gojis O, Ellis IO, Green AR, Ali S, Chin SF, Palmieri C, Caldas C, Carroll JS. Differential oestrogen receptor binding is associated with clinical outcome in breast cancer. Nature. 2012;481:389–393. doi: 10.1038/nature10730. [DOI] [PMC free article] [PubMed] [Google Scholar]
- 36.George J, Ahmad N. Mitochondrial sirtuins in cancer: emerging roles and therapeutic potential. Cancer Res. 2016;76:2500–2506. doi: 10.1158/0008-5472.CAN-15-2733. [DOI] [PMC free article] [PubMed] [Google Scholar]
- 37.Malik S, Villanova L, Tanaka S, Aonuma M, Roy N, Berber E, Pollack JR, Michishita-Kioi E, Chua KF. SIRT7 inactivation reverses metastatic phenotypes in epithelial and mesenchymal tumors. Sci Rep. 2015;5:9841. doi: 10.1038/srep09841. [DOI] [PMC free article] [PubMed] [Google Scholar]
- 38.Gong F, Miller KM. Mammalian DNA repair: HATs and HDACs make their mark through histone acetylation. Mutat Res. 2013;750:23–30. doi: 10.1016/j.mrfmmm.2013.07.002. [DOI] [PubMed] [Google Scholar]
- 39.Jackson SP, Bartek J. The DNA-damage response in human biology and disease. Nature. 2009;461:1071–1078. doi: 10.1038/nature08467. [DOI] [PMC free article] [PubMed] [Google Scholar]
- 40.Huertas P. DNA resection in eukaryotes: deciding how to fix the break. Nat Struct Mol Biol. 2010;17:11–16. doi: 10.1038/nsmb.1710. [DOI] [PMC free article] [PubMed] [Google Scholar]
- 41.Miller KM, Tjeertes JV, Coates J, Legube G, Polo SE, Britton S, Jackson SP. Human HDAC1 and HDAC2 function in the DNA-damage response to promote DNA nonhomologous end-joining. Nat Struct Mol Biol. 2010;17:1144–1151. doi: 10.1038/nsmb.1899. [DOI] [PMC free article] [PubMed] [Google Scholar]
- 42.Krumm A, Barckhausen C, Kucuk P, Tomaszowski KH, Loquai C, Fahrer J, Kramer OH, Kaina B, Roos WP. Enhanced histone deacetylase activity in malignant melanoma provokes RAD51 and FANCD2-triggered drug resistance. Cancer Res. 2016;76:3067–3077. doi: 10.1158/0008-5472.CAN-15-2680. [DOI] [PubMed] [Google Scholar]
- 43.Adimoolam S, Sirisawad M, Chen J, Thiemann P, Ford JM, Buggy JJ. HDAC inhibitor PCI-24781 decreases RAD51 expression and inhibits homologous recombination. Proc Natl Acad Sci U S A. 2007;104:19482–19487. doi: 10.1073/pnas.0707828104. [DOI] [PMC free article] [PubMed] [Google Scholar]
- 44.Schild D, Wiese C. Overexpression of RAD51 suppresses recombination defects: a possible mechanism to reverse genomic instability. Nucleic Acids Res. 2010;38:1061–1070. doi: 10.1093/nar/gkp1063. [DOI] [PMC free article] [PubMed] [Google Scholar]
- 45.Ward A, Khanna KK, Wiegmans AP. Targeting homologous recombination, new pre-clinical and clinical therapeutic combinations inhibiting RAD51. Cancer Treat Rev. 2015;41:35–45. doi: 10.1016/j.ctrv.2014.10.006. [DOI] [PubMed] [Google Scholar]
- 46.Wiegmans AP, Al-Ejeh F, Chee N, Yap PY, Gorski JJ, Da Silva L, Bolderson E, Chenevix-Trench G, Anderson R, Simpson PT, Lakhani SR, Khanna KK. Rad51 supports triple negative breast cancer metastasis. Oncotarget. 2014;5:3261–3272. doi: 10.18632/oncotarget.1923. [DOI] [PMC free article] [PubMed] [Google Scholar]
- 47.Meidhof S, Brabletz S, Lehmann W, Preca BT, Mock K, Ruh M, Schuler J, Berthold M, Weber A, Burk U, Lubbert M, Puhr M, Culig Z, Wellner U, Keck T, Bronsert P, Kusters S, Hopt UT, Stemmler MP, Brabletz T. ZEB1-associated drug resistance in cancer cells is reversed by the class I HDAC inhibitor mocetinostat. EMBO Mol Med. 2015;7:831–847. doi: 10.15252/emmm.201404396. [DOI] [PMC free article] [PubMed] [Google Scholar]
- 48.Cho JH, Dimri M, Dimri GP. MicroRNA-31 is a transcriptional target of histone deacetylase inhibitors and a regulator of cellular senescence. J Biol Chem. 2015;290:10555–10567. doi: 10.1074/jbc.M114.624361. [DOI] [PMC free article] [PubMed] [Google Scholar]
- 49.Wang S, Huang J, Lyu H, Lee CK, Tan J, Wang J, Liu B. Functional cooperation of miR-125a, miR-125b, and miR-205 in entinostat-induced downregulation of erbB2/erbB3 and apoptosis in breast cancer cells. Cell Death Dis. 2013;4:e556. doi: 10.1038/cddis.2013.79. [DOI] [PMC free article] [PubMed] [Google Scholar]
- 50.Roy SS, Gonugunta VK, Bandyopadhyay A, Rao MK, Goodall GJ, Sun LZ, Tekmal RR, Vadlamudi RK. Significance of PELP1/HDAC2/miR-200 regulatory network in EMT and metastasis of breast cancer. Oncogene. 2014;33:3707–3716. doi: 10.1038/onc.2013.332. [DOI] [PMC free article] [PubMed] [Google Scholar]
Associated Data
This section collects any data citations, data availability statements, or supplementary materials included in this article.