Abstract
Acute lower extremity ischemia is a limb-and life-threatening problem. The timing of clinical intervention is critical to achieving optimal outcomes. However, there has been a lack of effective techniques capable of evaluating muscle and limb damage. Microcirculatory injury is the initial pathological change during ischemic muscle injury. Here, we performed photoacoustic imaging (PAI) in real time to quantitatively detect the degree of microcirculatory injury of ischemic muscles in a rat model in which Evans blue (EB), which strongly binds to albumin in blood, was used as a nontoxic molecular PA probe. The right lower hind limbs of Sprague-Dawley (SD) rats were subjected to 2 or 3 hours of tourniquet-induced ischemia. Then, PA imaging of the tibialis anterior (TA) muscles in the anterior compartment was performed for 0-24 h after the release of compression. Twenty-four hours after reperfusion, rats were euthanized and examined for pathology, edema and muscle viability. Imaging at 680 nm on rats revealed that there was significant signal enhancement in the TA muscles of the two injury groups compared to the control group, and the 3-h injury group had significantly higher PA signal intensity than the 2-h injury group at each time point. Histopathology results obtained from both the normal and the damaged muscles correlated well with the PAI findings. In conclusion, PA imaging is a promising modality for quantitatively detecting limb and muscle ischemic injury and may pave the road for further clinical application.
Keywords: Muscle, ischemic injury, extremity, photoacoustic imaging, microcirculatory injury
Introduction
Acute lower extremity ischemia, such as compartment syndrome and muscle necrosis, is a limb-and life-threatening problem in orthopedics [1,2], accounting for 10% of all lower limb amputations [3,4]. More importantly, following ischemic episodes, additional injury may occur during the reperfusion period, ischemia/reperfusion (I/R) injury, which can result in severe metabolic abnormalities and even death [5]. Therefore, the ability to promptly and non-invasively estimate the extent and reversibility of limb and ischemic muscle injury would be important for facilitating therapeutic decisions and reducing the risk of amputation and mortality.
Skeletal muscle is the tissue that is most vulnerable to ischemia [6]. Additionally, the disorder of microcirculatory function has been widely accepted as a critical initial event during ischemic muscle injury [7]. The changes in the microcirculation increase the vascular permeability to plasma proteins and progressive interstitial edema [8,9]. In cases of severe limb injury, extended edema often increases the intra-compartmental pressure and leads to further decreases in the tissue perfusion, which can result in a self-perpetuating cycle [10]. Consequently non-invasive and real-time imaging techniques that can reflect the degree of microcirculatory injury are of significant interest and highly desired for the early detection of limb and muscle ischemic injury.
Currently, the diagnosis of this injury is made based on physical examinations, but clinical findings, such as swelling, disproportionate pain, and pain with passive motion, are highly subjective, subtle, or completely absent, especially for unconscious patients and pediatric injuries. Imaging modalities, such as magnetic resonance imaging (MRI), near-infrared spectroscopy (NIRS) and ultrasound, have focused on evaluating the changes in the muscle texture and microcirculation abnormality in muscle injury. MRI has good sensitivity and soft tissue resolution, and previous studies have reported that T2 mapping could evaluate the distribution and extension of edema in the affected muscles. However, this technique has major limitations such that it cannot reflect the changes in the muscle microcirculation. Furthermore, MRI is limited by high costs and long acquisition times to achieve high resolution [11,12]. Optical imaging and ultrasound techniques have several advantages including high sensitivity, lack of radioactivity, and lower costs, compared to other non-invasive imaging modalities, such as MRI, PET and CT. However, due to intense light scattering in tissues as well as the complicated morphology of muscle, pure optical imaging and ultrasound methods cannot accurately assess muscle-specific changes or the distribution from the microcirculation injury to the depth of the damaged muscle [13-16].
Photoacoustic imaging (PAI) is an emerging hybrid imaging modality that combines rich optical contrast with high ultrasonic resolution in tissue in real time [17,18]. It is based on absorbed pulsed light energy converting to acoustic energy by thermoelastic expansion at the tissue where light absorption occurs [19,20]. The excited photoacoustic waves are much less scattered than light in biological tissues. Therefore, PAI can provide a high-resolution image at unprecedented depth compared with pure optical imaging methods, making it especially useful for mapping the tissue microstructure in vitro and in vivo [21]. Additionally, the non-ionizing laser used in PA imaging is much safer than the ionizing radiation, such as CT and MRI, which are used for radiographic muscle examinations in clinics. Except endogenous signal, such as hemoglobin and deoxyhemoglobin, PA imaging can also use an exogenous imaging agent for molecular imaging in experiments. Therefore, it can effectively reflect the microstructural characteristics [22], biochemical information [23], biomechanical properties [24] and so on. However, the application of PA imaging in the assessment of ischemic muscle injury has rarely been reported. Evans blue (EB) dye is nontoxic and has been used to measure [25], blood volume [26], microvascular permeability [27,28], and blood-retinal barrier breakdown [29]. It has strong absorption in visible and near-infrared light, with a weak peak at 680 nm, and it distributes uniformly in the blood stream by chemically binding to albumin [30]. Under normal conditions, the EB-albumin (EBA) complex is confined to blood vessels, while the free dye more readily diffuses into extravascular tissue. However, at low concentrations, as in most biological applications, it is mainly the EBA that diffuses into the interstitial space, therefore, it is usually used to detect the degree of microcirculation damage [31,32]. For these reasons, EB has been used as a molecular probe in PA imaging to successfully visualize the depth distribution of albumin in a rat deep burn model [33].
In this study, we hypothesized that PAI could non-invasively image the changes in the muscle texture and injury of local microcirculation. Serum albumin leakage is an important sign of increased capillary permeability, but there is no obvious absorption of albumin in the near-infrared spectral region. Therefore, to quantitatively detect the extent of increased microvascular permeability, we used Evans blue (EB) which strongly binds to albumin in blood as a molecular probe for PA imaging of leaked albumin, to estimate the extent of local microcirculation injury. By comparing the photoacoustic imaging results with the pathological evaluations of muscle injury, our study shows that PAI is a reliable detection tool that, if adapted to clinical practice, could undoubtedly help determine the severity of limb and muscle ischemia injury, facilitating therapeutic decisions.
Materials and methods
Animal model
All experiments were approved by the Institutional Animal Care and Use Committee of Wuhan University (Wuhan, China), and the animal procedures were performed in strict accordance with institutional and national guidelines [34]. Twenty male Sprague-Dawley rats from the Experimental Animal Center of Wuhan Medical University were used for the experiment. The average weight of the rats was 270±18 g at the time of the experiment. Rats were randomly divided into the following 3 groups depending on the injury time: 2 h and 3 h, while the contra-lateral hind limbs served as the control group (n=10). Three to four rats were raised in a conventional standard cage under 55-65% humidity and at a controlled temperature of 24±2°C, they had free access to feed and water.
The animals were anesthetized with 2-3% isoflurane and adjusted to maintain a surgical plane of anesthesia. The right lower hind limb was shaved and wrapped with a cotton pad; a pneumatic digital tourniquet had dimensions of 12.5 cm × 2 cm and was attached to a tourniquet regulation system placed directly over the anterior compartment of the lower hind limb; the system was inflated to the pressure of 250 mmHg for 2 or 3 h, which is consistent with a previous study [35]. PA imaging of TA muscles in the anterior compartment of the lower hind limb was performed for 0-24 h after tourniquet release, and the rats were sacrificed 24 h after injury for histopathology examination, including the wet/dry weight ratio, hematoxylin and eosin (H&E) histology, myeloperoxidase activity, and TUNEL. Rats were administered intraperitoneal injections of normal saline over the course of the experiment and the body temperature was maintained at physiologic conditions using a warm water bed.
Photoacoustic imaging
For photoacoustic (PA) imaging of the damaged muscle in these studies, an Endra Nexus 128 PA scanner (Ann Arbor, MI) system with a wavelength from 680-950 nm, pulse width of 7 ns was used (Figure 1). The pulse reputation rate of 20 Hz and laser output energy from the source are approximately 9 mJ/pulse on the animal surface less than 20 mJ/cm2 (the ANSI safety limit). Meanwhile, the laser pulse energy can provide an effective penetration depth of 20 mm. This depth is sufficiently deep to detect deep tissues such as muscle, which is where the early lesions develop. The imaged target (damaged muscle) was well mounted in the convex point of a hemispherical bowl, and the position of rats in the bowl was kept consistent to perform the comparisons, and it was necessary that the convex point of the bowl was immersed in water. One hundred and twenty-eight identical ultrasonic transducers with a 5.8-MHz center frequency were spirally distributed on the surface of the bowl to receive PA signals. OsiriX imaging software (OsiriX Foundation, Genève, Switzerland) was used to analyze the reconstructed raw data. Additionally, the quantitative PA signal intensity of the ROI was measured using OsiriX Lite.
Figure 1.
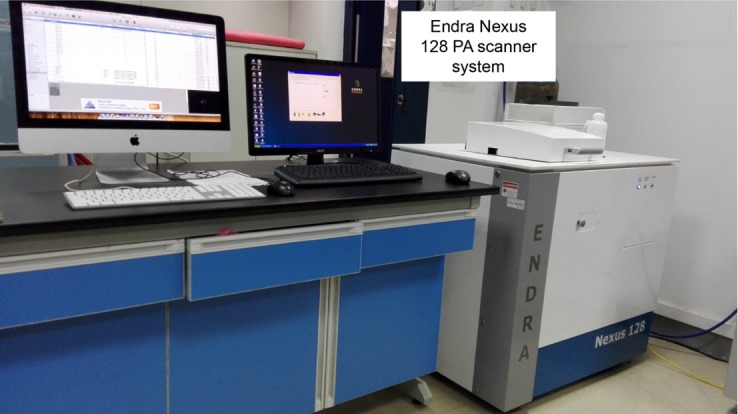
Photograph of the Endra Nexus 128 PA scanner (Ann Arbor, MI) system used for in vivo photoacoustic imaging of rat muscle.
In order to achieve the detection of increased vascular permeability, we choose low EB concentrations (0.5 wt%), which is mainly the EBA that diffuses out of the blood vessels, and thus it is usually used as an indicator of the vessel leakage level [28,29]. To detect increased vascular permeability, we chose low EB concentrations (0.5 wt%) at which EBA mainly diffuses out of the blood vessels; therefore, EB is usually used as an indicator of the vessel leakage level [28,29]. In our study, an irradiation wavelength 680 nm was chosen for deoxy-hemoglobin and EB imaging. Prior to imaging the experimental animals, commercial hair-removal lotion was applied to the hind leg to allow for good acoustic coupling. Before the EB injection, control images were acquired. A phosphate-buffered saline (PBS, pH=7.5) solution of EB (Sigma) at a concentration of 0.5 wt% was intravenously injected into the dorsal veins of the tail at the dose of 5 mg/kg rat weight. PA molecular imaging of the damaged muscle was performed for each group 0-24 h after crush injury. Finally, PA imaging of the damaged muscle was acquired according to different reperfusion times when it was irradiated by the laser. The contra-lateral hind limb imaging was set as the control.
Edema of injured muscle
To verify the results of PA measurements for correlation with the behavior of leaked albumin, we measured the water content in the damaged muscle from the PA intensity increase region. The wet and dry weights were determined on the TA muscles in the sham and experimental groups 24 h after reperfusion; 5-mm-diameter biopsy specimens were taken from the ROI. The fresh samples were weighed and then desiccated for 5 days in a drying oven set at 50°C before dry weight determination, and the wet to dry weight ratio served as an index of edema (W/D).
Histopathology
Rats were euthanized, and the tibialis anterior (TA) muscles (sample area of 1 cm × 0.5 cm) were surgically removed. In each group (24 h after reperfusion in the sham and experimental groups), tissue samples from the TA muscles were subjected to histology analysis. For histopathology, tissues were fixed in 4% neutral buffered formaldehyde and paraffin wax. Sections were cut 4-mm thick and stained with hematoxylin and eosin (HE) for histologic assessment of fiber damage, and the cell infiltration was reviewed by pathologists without prior knowledge of the animal experiments. Additionally, anti-myeloperoxidase (MPO) staining (Goat Anti-Rabbit IgG*HRP; Wuhan GoodBiosciences, Wuhan, China) was used as a further index of neutrophil infiltration into tissue. The tissues in the images were characterized as normal, edema, necrosis, and inflammation. Normal areas lacked centro-nucleated fibers and had normal levels of interstitial space. Inflammatory areas were characterized as being filled densely with nucleated cells within the interstitial space.
Terminal deoxynucleotidyltransferase-mediated dUTP nick-end labeling (TUNEL) of muscles
TUNEL was used to measure apoptosis of the tibialis anterior (TA) muscles [36]. At 24 h after reperfusion, the TA muscles were surgically removed, frozen and cut into 10-mm thick sections in a freezing cryostat at 220 uC. A fluorometric TUNEL detection kit (Roche, Basel, Switzerland) was used to detect apoptotic DNA strand breaks. Muscle sections were fixed with 4% neutral buffered formaldehyde in PBS (pH 7.4) at 25°C for 20 minutes, permeated with proteinase K at 25°C for 20 minutes, and incubated with the labeling reaction mixture in a humidified chamber at 37°C for 2 h. Pre-digestion of muscle section with nuclease served as a positive control. The sections were then processed with a standard immunocytochemical staining procedure to incubate with antibody against DAPI (a cell nucleus marker; Invitrogen, Carlsbad, CA). Finally, a Nikon fluorescence microscope was used to capture the images, and the ratio of TUNEL positive nuclei in total (DAPI positive nuclei) was computed to express the muscle apoptosis.
Statistical analysis
The data of the PA intensities in regions of interest were analyzed by the OsiriX imaging system software package. All data are presented as the mean ± standard deviation (S.D.) The statistical calculations were performed by GraphPad Prism v.5 (GraphPad Software, Inc., La Jolla, CA) and analyzed using the Student’s t-test or one-way ANOVA. A p value less than 0.05 was considered significant.
Results
PA signal intensities in injury muscles were increased more than normal muscles, and showed highest in 3-h injury group
Inspection of the high-resolution PA images with the applied 680 nm wavelength reveals anatomical structure of tibialis anterior (TA) muscles (Figure 2). The endogenous tissue contrast, which is largely derived from light absorption by hemoglobin, is lower in the 3 h ischemic injury TA muscle 24 h after reperfusion (Figure 2C) than in the control groups (Figure 2B), which is attributed to a reduced local hemoglobin concentration. However, in the absence of PA contrast agent injection, it is difficult to accurately locate the damage area.
Figure 2.
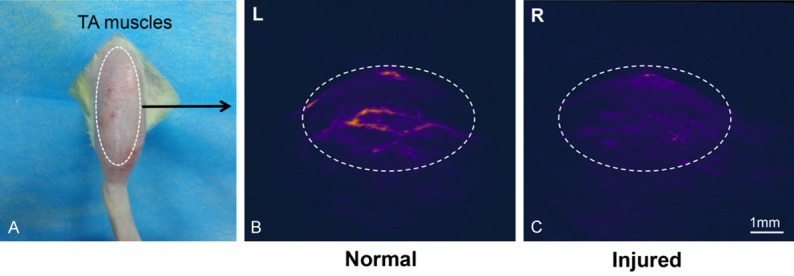
PA image at 680 nm of a rat tibialis anterior (TA) muscles (24 h after ischemia injury, with no contrast agent injection). A. Optical photograph of TA muscles. B. 3D PA image of normal TA muscles (L: left hind limb), the white dotted line indicated the vascularity and muscle texture. C. 3D PA image of injured muscles (R: right hind limb); the PA signal significantly decreased and the vascularity in the muscle cannot be identified.
In Figure 3, after EB injection, no obvious enhancement of PA signals was observed in the normal muscle at any of the time points, indicating insufficient accumulation of EB albumin in the left hinder limb at a low concentration. On the other hand, in the two injury groups, the spatiotemporal behavior of leaked albumin after ischemic injury can be clearly seen in 3D images of PA signals originating from EBA (Figure 3A). Additionally, the peak intensity of probe was seen at approximately 6 h. In the first 4 hours, the fastest accumulation led to the fastest enhancement of the PA signal. The PA imaging indirectly explained that the volume of blood circulating near the injury muscles was much higher than that in the control legs, as expected with acute inflammation. The images showed that EBA started to leak and accumulate in the damaged muscle tissue after release, but a certain concentration was required to enhance the PA signal. Moreover, in Figure 3A, the distributions of muscle injury expanded in both the horizontal and vertical directions with time, indicating time-dependent diffusion and accumulation of albumin in the tissue. Additionally, the damage was aggravated with prolonged reperfusion time.
Figure 3.
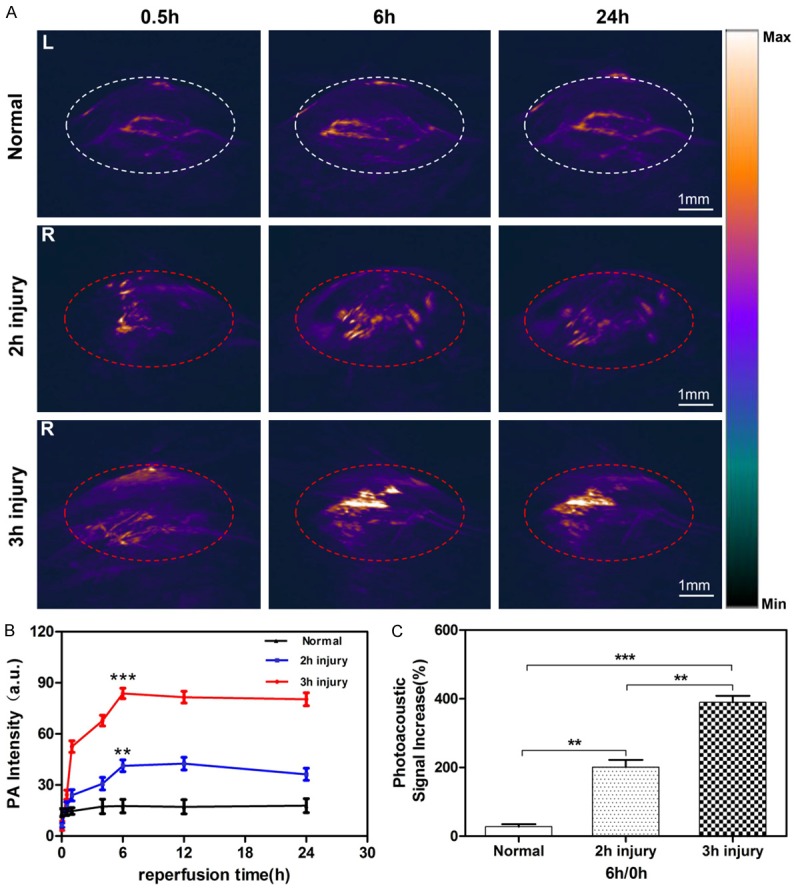
Accumulation of EB-albumin in the tibialis anterior (TA) muscles. A. Representative 3D PA images of the TA muscle injury region obtained at 0.5 h, 6 h and 24 h after intravenous injection of EB. The PA images showed the accumulation and distribution of the EB probe within the damaged muscle region (red dotted line) in two injury groups (R: right hind limb). B. Quantification of PA intensities analysis at 680 nm in the region of TA muscles at different time points after intravenous injection of EB. C. Quantitative analysis of PA signal increases after intravenous injection with EB at 6 h compared with 0 h. All results represent mean ± S.D (**P<0.01; ***P<0.001, n=5).
To quantify the photoacoustic signal enhancement from the microcirculation injury and EBA leakage, the signal intensity in the PA image was averaged in the area surrounding the signal enhancement regions (Figure 3B). The signals obtained from the TA muscles in the three groups were visually comparable. In healthy animals, the absolute value of the difference between the signal intensity of before and 6 h after EB injection was <10% in each animal with a mean ± SD signal intensity of approximately 17±4 AU compared to >41±3 AU in the 2-h injury group and 80±4 AU in the 3-h injury group. For the 3-h injury group, the time-intensity curve showed a trend of rapid lift and gradual drop with rapid accumulation and slow washout in the crushed muscles. Additionally, the PA intensities of the 3-h injury group were significantly higher than that of the 2-h injury group (Figure 3B). Figure 3C showed that the quantitative analysis of PA signal increases after tail-vein injection with EB at 6 h, and the 3 h group was significantly higher than the other two groups (all P<0.01).
Three-hour injury group showed peak muscle wet: dry weight ratio
To verify the results of PA measurements for correlation with the behavior of leaked albumin, we measured the water content in the damaged muscle from the PA intensity increase region. As shown in Figure 4, compression and ischemia resulted in substantial edema in all muscles of the tourniquet lower hind limbs when the wet: dry weight ratios were compared with the normal group. Additionally, the wet: dry weight ratios of the injured TA muscles in the 2-h injury group were significantly lower than the 3-h injury group (P<0.05).
Figure 4.
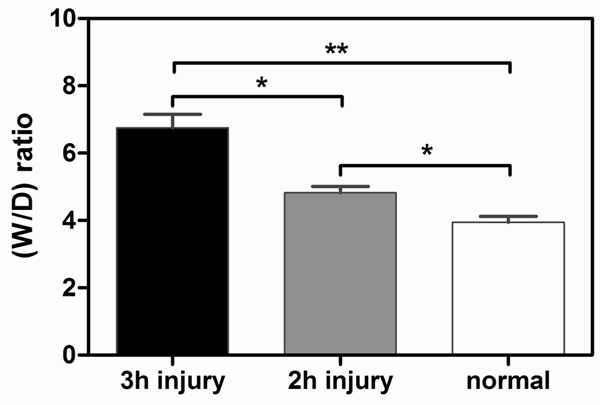
Wet: dry weight ratios. Overall compression resulted in a dramatic increase in the muscle wet:dry weight ratios. Additionally, the 3-h ischemia injury group demonstrated a significant increase in the wet:dry weight ratio compared with the control and 2-h groups, All results represent mean ± S.D (*P<0.05; **P<0.01, n=5).
Histopathologic changes of TA muscles
In both the 2-h and 3-h injury groups, swelling of the right lower hind limb was noted. Muscle fibers were regularly arranged and the size of the cells and extracellular space was uniformly coherent without any notable inflammatory cell infiltration in the control group (Figure 5). While histological results from TA muscle samples (n=5) 24 h after release in the 2-h and 3-h injury groups, muscle cell expansion and rupture of muscle fibers were recognized. Additionally, expanded collapse, edema, and infiltration of neutrophils were observed in the interstitial space of muscles, especially in the 3-h injury group. Furthermore, myeloperoxidase (MPO) staining was strongly positive in the interstitial space of muscle tissue in the 3-h injury group.
Figure 5.
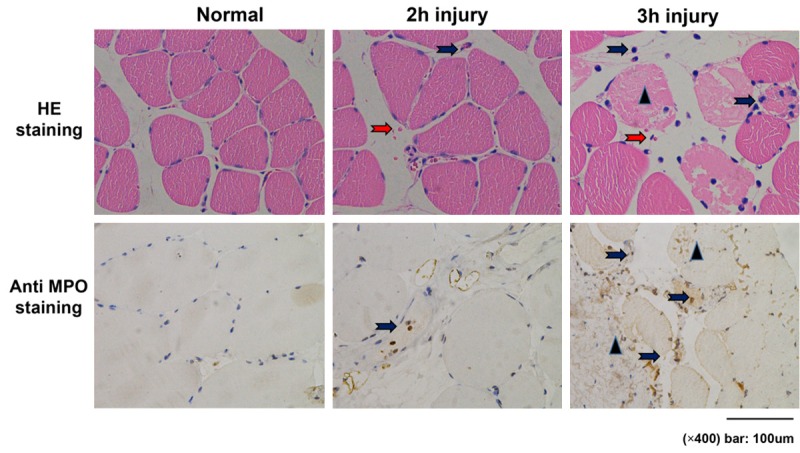
Histologic findings in muscle tissues in the rat model. Compared to the 2 h group, 3 h ischemia caused greater muscle damage, interstitial edema and hemorrhage. Red arrows show the red cells that infiltrated. Triangles show the collapsed muscle fibers. Blue arrows show the infiltration of neutrophils (HE staining) and myeloperoxidase (anti-MPO staining). Magnification × 400.
The number of TUNEL-positive nuclei was increased significantly in ischemic TA muscles
Tibialis anterior (TA) muscle TUNEL staining was implemented to recognize apoptotic nuclei induced by extremity ischemia and following reperfusion (Figure 6A). No TUNEL-positive nuclei were found in control TA muscles, while tourniquet-induced ischemia injury significantly increased the number of TUNEL-positive nuclei in TA muscles. Additionally, the 3-h injury group had significantly more TUNEL-positive nuclei than the 2-h injury group (Figure 6B, P<0.001).
Figure 6.
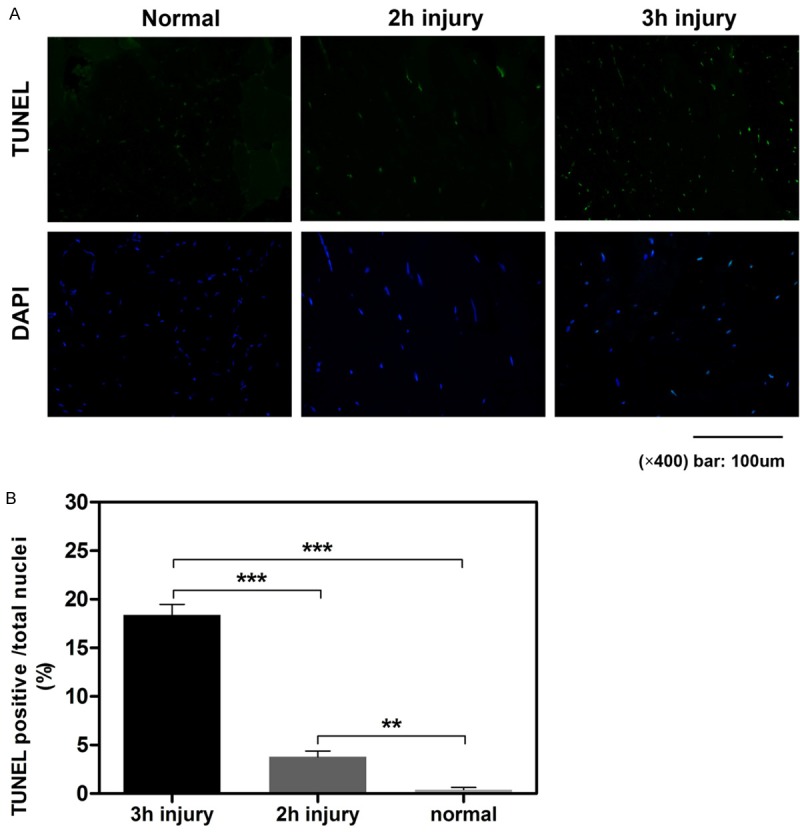
Apoptosis measured by TUNEL staining in the TA muscles from each experimental group. TUNEL: TdT-mediated dUTP Nick-End Labeling, a marker for apoptosis and DAPI: 4’,6-diamidino-2-phenylindole. All results are given as the mean ± S.D, n=5 rats (5 slices in each rat) in each group (**P<0.01; ***P<0.001).
Discussion
Severe limb crush and ischemia injuries are associated with serious clinical situations. Additionally, they often result in irreversible damage, which may lead to amputation or even death. Therefore, the timing of the clinical intervention is critical to achieving optimal outcomes [2]. Currently, there is no effective and objective method for accurately assessing limb and muscle damage, and the defects of current modalities of detecting limb injury may miss the best time window for deciding to perform fasciotomy [37]. In this investigation, we demonstrated that PA imaging using the EB contrast agent can accurately assess the degree and reversibility of limb and muscle ischemia injury in real-time.
Compared with other imaging modalities, PAI offers sufficient resolution at greater depth to overcome traditional imaging limitations, and it shows remarkably improved imaging depth because of the excellent soft tissue penetration ability of sound [17]. As shown in the 3D PA images in this study (Figure 3A), accumulation throughout the damaged TA muscles could be seen despite the deep location of the injury site, allowing for precise determination of the signal origin and intensity. Compared to the continuous wave near-infrared spectroscopy (CWNIRS) used in a previous study [13], PAI was also more sensitive in ischemia muscle injury detection. PAI can not only show the decrease in the local hemoglobin concentration (Figure 2C) compared to CWNIRS, it can also accurately detect the injury site region when we used EB as a nontoxic molecular probe.
The microcirculation abnormality has been widely accepted as an initial pathologic characteristic of muscle damage in extremity ischemia injury. In our study, damaged endothelial cells and increased vascular permeability made the EBA exude into the interstitial space. Previous studies have found that in the injured muscles, the venules were damaged and occluded by the accumulated blood cells and microthrombi, while the arteries were less affected. The result is obstruction of venous reflux, while the arterial blood perfusion is less affected, leading to congested microcirculation in the injured muscles [7]. Our result showed that immediately after the release (0.5 h), albumin-originating PA signals in the damaged muscle rapidly increased (Figure 3B), which is consistent with a previous study and indicated efficient leakage of albumin and thus formation of edema. In the normal group, on the other hand, the PA signal was almost constant (Figure 3B), This indicated that albumin (EBA) behaves differently in the tissue, and the mobility of EBA in injured muscle was much larger than that of normal muscle, which was partly due to the increased vascular permeability. However, as we observed in Figure 3B, the EBA accumulation peaked at 6 hours in the two injury groups; then, it reached a plateau, indicating that albumin-originating PA signals in the injury regions ceased or even decreased at the 6-h time point. One reason for this observation is that the increased water content contributed to the dilution of local EBA concentration in the injury region. Interestingly, the time of 6 h of ischemia is a crucial time point in clinical evaluation [7], when the ischemia time exceeds 6 hours, the tissues in the extremity will develop irreversible damage; PAI can indicate the muscle states at this crucial time point.
Furthermore, the processed PA images revealed a clear difference between the two injury groups (2 h and 3 h). Depending on the extent of ischemic injury advancement, a significant increase in the PAI signal could be seen in the damaged muscle of all rats in which edema was evident in pathologic results. In the representative animal shown in Figure 3C, the PA intensity in 3-h injury group was 1.82-fold higher than the PA intensity in 2-h injury group. Additionally, the severity of the clinical symptoms was associated with the degree of pathologic changes visible through PAI, enabling staging of the ischemia injury.
To verify that the acquired PAI results can reflect limb and muscle injury, histological, edema and TUNEL evaluations were performed. Serious morphological changes were present after longer periods of crush and ischemic injury, which was consistent with previous data [38]. The TUNEL results showed a moderate degree of muscle injury after 2 hours of crush and ischemia, while the degree of muscle damage increased more seriously in TA muscles in the 3-h injury group (Figure 6). Interestingly, in the 3D PA images of 3-h injury group, the signal in the center of TA muscles increased more obviously than in the superficial tissue, including the skin, which was concluded by the pathologic results and TUNEL in which muscle necrosis was greater in the central portion of the TA muscles. These results suggested that external evaluation of the degree of ischemic damage was clinically unreliable, which was consistent with previous data [39]. Therefore, the results obtained by our method correlate well with the pathological findings for ischemic injury because increasing muscle damage resulted in a continuous increase in edema, which was caused and aggravated by the leakage of EB albumin.
The anterior compartment of the lower leg is the most susceptible to ischemic injury, leading to compartmental syndrome. Therefore, in our study, we chose to evaluate the TA muscles, and we successfully assessed the degree of ischemic muscle injury by PA imaging. Additionally, the superiority of PA imaging is the depth of penetration, which is one of the weaknesses of NIRS devices [40]. Moreover, in the lower leg, the four compartments always suffer from simultaneous destruction [37], and PA imaging can easily monitor all four compartments at the same time. In this study, we investigated the model of simple crush and ischemia injury in extremities, but it does not entirely reproduce the clinical case of limb injury. The muscle injury in this experiment does not include a model of the severe limb trauma as seen in the clinical setting, which disrupts both soft tissue and bone. Further clinical patient studies would be needed before applying the results of using this model in clinical practice.
In conclusion, in the current study, we present a real-time, effective diagnostic method, which might be suitable for the rapid determination of the degree of limb and muscle ischemic injury. The results obtained by quantitative analysis showed a continuous increase in the muscle injury, which strongly correlated with the time of ischemia. Furthermore, the PA values adequately represented the microvascular injury as seen on the pathologic analysis; namely, high grade muscle and local microcirculation damage displayed high PA values that were correlated to similar pathologic results. Therefore, this technique might have the potential to be used in clinical practice to enable accurate therapeutic decisions regarding ischemic muscle injury to the extremities.
Acknowledgements
This work was supported by Zhongnan Hospital of Wuhan University Science Seed Fund, project (H1818); Hubei Province’s Outstanding Medical Academic Leader Program, Wuhan’s Huanghe Talents Program and the National Natural Science Foundation-Outstanding Youth Foundation of China (No. 81501535).
Disclosure of conflict of interest
None.
References
- 1.Malinoski DJ, Slater MS, Mullins RJ. Crush injury and rhabdomyolysis. Crit Care Clin. 2004;20:171–192. doi: 10.1016/s0749-0704(03)00091-5. [DOI] [PubMed] [Google Scholar]
- 2.Walker TG. Acute limb ischemia. Tech Vasc Interv Radiol. 2009;12:117–129. doi: 10.1053/j.tvir.2009.08.005. [DOI] [PubMed] [Google Scholar]
- 3.Henke PK. Contemporary management of acute limb ischemia: factors associated with amputation and in-hospital mortality. Semin Vasc Surg. 2009;22:34–40. doi: 10.1053/j.semvascsurg.2009.01.002. [DOI] [PubMed] [Google Scholar]
- 4.Aftabuddin M, Islam N, Jafar MA, Haque I. The status of lower-limb amputation in Bangladesh: a 6-year review. Surg Today. 1997;27:130–134. doi: 10.1007/BF02385901. [DOI] [PubMed] [Google Scholar]
- 5.Nakayama T, Fujita M, Ishihara M, Ishihara M, Ogata S, Yamamoto Y, Shimizu M, Maehara T, Kanatani Y, Tachibana S. Improved survival rate by temperature control at compression sites in rat model of crush syndrome. J Surg Res. 2014;188:250–259. doi: 10.1016/j.jss.2013.12.012. [DOI] [PubMed] [Google Scholar]
- 6.Blaisdell FW. The pathophysiology of skeletal muscle ischemia and the reperfusion syndrome: a review. Cardiovasc Surg. 2002;10:620–630. doi: 10.1016/s0967-2109(02)00070-4. [DOI] [PubMed] [Google Scholar]
- 7.Strock PE, Majno G. Microvascular changes in acutely ischemic rat muscle. Surg Gynecol Obstet. 1969;129:1213–1224. [PubMed] [Google Scholar]
- 8.Harman JW. The significance of local vascular phenomena in the production of ischemic necrosis in skeletal muscle. Am J Pathol. 1948;24:625–641. [PMC free article] [PubMed] [Google Scholar]
- 9.Gyurkovics E, Aranyi P, Stangl R, Onody P, Ferreira G, Lotz G, Kupcsulik P, Szijarto A. Postconditioning of the lower limb-protection against the reperfusion syndrome. J Surg Res. 2011;169:139–147. doi: 10.1016/j.jss.2009.10.014. [DOI] [PubMed] [Google Scholar]
- 10.Kalns J, Cox J, Baskin J, Santos A, Odland R, Fecura S Jr. Extremity compartment syndrome in pigs during hypobaric simulation of aeromedical evacuation. Aviat Space Environ Med. 2011;82:87–91. doi: 10.3357/asem.2853.2011. [DOI] [PubMed] [Google Scholar]
- 11.Zhang L, Fang ZJ, Liu F, Fu P, Tao Y, Li ZY, Song B. Magnetic resonance imaging and magnetic resonance angiography in severe crush syndrome with consideration of fasciotomy or amputation: a novel diagnostic tool. Chin Med J (Engl) 2011;124:2068–2070. [PubMed] [Google Scholar]
- 12.Zhang LY, Ding JT, Wang Y, Zhang WG, Deng XJ, Chen JH. MRI quantitative study and pathologic analysis of crush injury in rabbit hind limb muscles. J Surg Res. 2011;167:e357–363. doi: 10.1016/j.jss.2010.09.014. [DOI] [PubMed] [Google Scholar]
- 13.Kim JG, Lee J, Roe J, Tromberg BJ, Brenner M, Walters TJ. Hemodynamic changes in rat leg muscles during tourniquet-induced ischemia-reperfusion injury observed by near-infrared spectroscopy. Physiol Meas. 2009;30:529–540. doi: 10.1088/0967-3334/30/7/001. [DOI] [PMC free article] [PubMed] [Google Scholar]
- 14.Lv F, Tang J, Luo Y, Ban Y, Wu R, Tian J, Yu T, Xie X, Li T. Contrast-enhanced ultrasound assessment of muscle blood perfusion of extremities that underwent crush injury: an animal experiment. J Trauma Acute Care Surg. 2013;74:214–219. doi: 10.1097/ta.0b013e3182683498. [DOI] [PubMed] [Google Scholar]
- 15.Zhang CD, Lv FQ, Li QY, Zhang Y, Shi XQ, Li XY, Tang J. Application of contrast-enhanced ultrasonography in the diagnosis of skeletal muscle crush injury in rabbits. Br J Radiol. 2014;87:20140421. doi: 10.1259/bjr.20140421. [DOI] [PMC free article] [PubMed] [Google Scholar]
- 16.Krix M, Weber MA, Kauczor HU, Delorme S, Krakowski-Roosen H. Changes in the micro-circulation of skeletal muscle due to varied isometric exercise assessed by contrast-enhanced ultrasound. Eur J Radiol. 2010;76:110–116. doi: 10.1016/j.ejrad.2009.05.007. [DOI] [PubMed] [Google Scholar]
- 17.Li C, Wang LV. Photoacoustic tomography and sensing in biomedicine. Phys Med Biol. 2009;54:R59–97. doi: 10.1088/0031-9155/54/19/R01. [DOI] [PMC free article] [PubMed] [Google Scholar]
- 18.Wang LV, Hu S. Photoacoustic tomography: in vivo imaging from organelles to organs. Science. 2012;335:1458–1462. doi: 10.1126/science.1216210. [DOI] [PMC free article] [PubMed] [Google Scholar]
- 19.Melendez-Alafort L, Muzzio PC, Rosato A. Optical and multimodal peptide-based probes for in vivo molecular imaging. Anticancer Agents Med Chem. 2012;12:476–499. doi: 10.2174/187152012800617858. [DOI] [PubMed] [Google Scholar]
- 20.Yao J, Maslov KI, Shi Y, Taber LA, Wang LV. In vivo photoacoustic imaging of transverse blood flow by using Doppler broadening of bandwidth. Opt Lett. 2010;35:1419–1421. doi: 10.1364/OL.35.001419. [DOI] [PMC free article] [PubMed] [Google Scholar]
- 21.Yao J, Wang L, Yang JM, Maslov KI, Wong TT, Li L, Huang CH, Zou J, Wang LV. High-speed label-free functional photoacoustic microscopy of mouse brain in action. Nat Methods. 2015;12:407–410. doi: 10.1038/nmeth.3336. [DOI] [PMC free article] [PubMed] [Google Scholar]
- 22.Saha RK. A simulation study on the quantitative assessment of tissue microstructure with photoacoustics. IEEE Trans Ultrason Ferroelectr Freq Control. 2015;62:881–895. doi: 10.1109/TUFFC.2015.006993. [DOI] [PubMed] [Google Scholar]
- 23.Song W, Wei Q, Liu W, Liu T, Yi J, Sheibani N, Fawzi AA, Linsenmeier RA, Jiao S, Zhang HF. A combined method to quantify the retinal metabolic rate of oxygen using photoacoustic ophthalmoscopy and optical coherence tomography. Sci Rep. 2014;4:6525. doi: 10.1038/srep06525. [DOI] [PMC free article] [PubMed] [Google Scholar]
- 24.Gao G, Yang S, Xing D. Viscoelasticity imaging of biological tissues with phase-resolved photoacoustic measurement. Opt Lett. 2011;36:3341–3343. doi: 10.1364/OL.36.003341. [DOI] [PubMed] [Google Scholar]
- 25.Villringer A, Them A, Lindauer U, Einhaupl K, Dirnagl U. Capillary perfusion of the rat brain cortex. An in vivo confocal microscopy study. Circ Res. 1994;75:55–62. doi: 10.1161/01.res.75.1.55. [DOI] [PubMed] [Google Scholar]
- 26.Poulsen TD, Klausen T, Richalet JP, Kanstrup IL, Fogh-Andersen N, Olsen NV. Plasma volume in acute hypoxia: comparison of a carbon monoxide rebreathing method and dye dilution with Evans’ blue. Eur J Appl Physiol Occup Physiol. 1998;77:457–461. doi: 10.1007/s004210050360. [DOI] [PubMed] [Google Scholar]
- 27.Roberts WG, Palade GE. Increased microvascular permeability and endothelial fenestration induced by vascular endothelial growth factor. J Cell Sci. 1995;108:2369–2379. doi: 10.1242/jcs.108.6.2369. [DOI] [PubMed] [Google Scholar]
- 28.Patterson CE, Rhoades RA, Garcia JG. Evans blue dye as a marker of albumin clearance in cultured endothelial monolayer and isolated lung. J Appl Physiol (1985) 1992;72:865–873. doi: 10.1152/jappl.1992.72.3.865. [DOI] [PubMed] [Google Scholar]
- 29.Xu Q, Qaum T, Adamis AP. Sensitive blood-retinal barrier breakdown quantitation using Evans blue. Invest Ophthalmol Vis Sci. 2001;42:789–794. [PubMed] [Google Scholar]
- 30.Hed J, Dahlgren C, Rundquist I. A simple fluorescence technique to stain the plasma membrane of human neutrophils. Histochemistry. 1983;79:105–110. doi: 10.1007/BF00494347. [DOI] [PubMed] [Google Scholar]
- 31.Le VH, Fishman WH. Combination of Evans blue with plasma protein; its significance in capillary permeability studies, blood dye disappearance curves, and its use as a protein tag. Am J Physiol. 1947;151:26–33. doi: 10.1152/ajplegacy.1947.151.1.26. [DOI] [PubMed] [Google Scholar]
- 32.Hamer PW, McGeachie JM, Davies MJ, Grounds MD. Evans blue dye as an in vivo marker of myofibre damage: optimising parameters for detecting initial myofibre membrane permeability. J Anat. 2002;200:69–79. doi: 10.1046/j.0021-8782.2001.00008.x. [DOI] [PMC free article] [PubMed] [Google Scholar]
- 33.Tsunoi Y, Sato S, Kawauchi S, Ashida H, Saitoh D, Terakawa M. In vivo photoacoustic molecular imaging of the distribution of serum albumin in rat burned skin. Burns. 2013;39:1403–1408. doi: 10.1016/j.burns.2013.03.007. [DOI] [PubMed] [Google Scholar]
- 34.Giles AR. Guidelines for the use of animals in biomedical research. Thromb Haemost. 1987;58:1078–1084. [PubMed] [Google Scholar]
- 35.Walters TJ, Kragh JF, Kauvar DS, Baer DG. The combined influence of hemorrhage and tourniquet application on the recovery of muscle function in rats. J Orthop Trauma. 2008;22:47–51. doi: 10.1097/BOT.0b013e31815b3591. [DOI] [PubMed] [Google Scholar]
- 36.Libera LD, Zennaro R, Sandri M, Ambrosio GB, Vescovo G. Apoptosis and atrophy in rat slow skeletal muscles in chronic heart failure. Am J Physiol. 1999;277:C982–986. doi: 10.1152/ajpcell.1999.277.5.C982. [DOI] [PubMed] [Google Scholar]
- 37.Mauser N, Gissel H, Henderson C, Hao J, Hak D, Mauffrey C. Acute lower-leg compartment syndrome. Orthopedics. 2013;36:619–624. doi: 10.3928/01477447-20130724-07. [DOI] [PubMed] [Google Scholar]
- 38.Nanobashvili J, Neumayer C, Fugl A, Punz A, Blumer R, Prager M, Mittlbock M, Gruber H, Polterauer P, Roth E, Malinski T, Huk I. Ischemia/reperfusion injury of skeletal muscle: plasma taurine as a measure of tissue damage. Surgery. 2003;133:91–100. doi: 10.1067/msy.2003.65. [DOI] [PubMed] [Google Scholar]
- 39.Labbe R, Lindsay T, Walker PM. The extent and distribution of skeletal muscle necrosis after graded periods of complete ischemia. J Vasc Surg. 1987;6:152–157. doi: 10.1067/mva.1987.avs0060152. [DOI] [PubMed] [Google Scholar]
- 40.Gentilello LM, Sanzone A, Wang L, Liu PY, Robinson L. Near-infrared spectroscopy versus compartment pressure for the diagnosis of lower extremity compartmental syndrome using electromyography-determined measurements of neuromuscular function. J Trauma. 2001;51:1–8. doi: 10.1097/00005373-200107000-00001. discussion 8-9. [DOI] [PubMed] [Google Scholar]


