

Abstract
Background and Purpose
Chromosomal instability is not only a hallmark of cancer but also an attractive therapeutic target. A diverse set of mitotic kinases maintains chromosomal stability. One of these is monopolar spindle 1 (Mps1, also known as TTK), which is essential for chromosome alignment and for the spindle assembly checkpoint (SAC). Pharmacological inhibition of Mps1 has been suggested as a cancer therapeutic; however, despite the existence of a novel Mps1 inhibitor, TC Mps1 12, no such studies have been performed.
Experimental Approach
The effects of TC Mps1 12 on cell viability, chromosome alignment, centrosome number, mitotic duration, apoptosis and SAC were determined in hepatocellular carcinoma (HCC) cells. In addition, the association of Mps1 expression with the overall survival of HCC patients was analysed.
Key Results
Treatment of human HCC cells with TC Mps1 12 led to chromosome misalignment and missegregation, and disorganization of centrosomes. Even in the presence of these errors, TC Mps1 12‐treated cells overrode the SAC, resulting in a shortened mitotic duration and mitotic slippage. This mitotic catastrophe triggered apoptosis and, finally, inhibited the growth of HCC cells. In addition, the expression of the Mps1‐encoding TTK gene was associated with poor overall survival of HCC patients.
Conclusion and Implications
TC Mps1 12 results in the accumulation of chromosomal instabilities and mitotic catastrophe in HCC cells. Overall, these data demonstrate that the inhibition of Mps1 kinase using TC Mps1 12 is a promising therapeutic approach for liver cancer.
Abbreviations
- HCC
hepatocellular carcinoma
- MCC
mitotic checkpoint complex
- Mps1 (TTK)
monopolar spindle 1
- SAC
spindle assembly checkpoint
Introduction
The cell cycle is critical for maintaining genomic and chromosomal stability. An aberrant cell cycle results in the proliferation of cancer cells; indeed, it is a hallmark of human cancers. Therefore, targeting the cell cycle is a promising approach to inhibit cancer cell proliferation. Mitosis is one process that can be targeted, and several microtubule‐targeting drugs such as taxol and vinca alkaloids are used for cancer treatment. However, because these drugs have side effects, other classes of anti‐mitotic agent have been developed (Dominguez‐Brauer et al., 2015). Cellular mitosis involves the segregation of chromosomes into two daughter cells. This requires the bipolar attachment of spindles to sister chromatid kinetochores. The absence of attachment between the chromosomes and mitotic spindles results in the inactivation of anaphase‐promoting complex/cyclosome (APC/C), and cells stop entering the anaphase until correct attachment to kinetochores is achieved. This delay in anaphase onset is called the spindle assembly checkpoint (SAC) or the mitotic checkpoint. SAC activation requires the assembly of the mitotic checkpoint complex (MCC), and a diverse set of proteins, including kinases and phosphatases (Musacchio, 2015). Therefore, mitotic kinase inhibitors that target the SAC are potential anti‐cancer drugs.
One of the critical mitotic kinases is monopolar spindle kinase 1 Mps1. Mps1 was identified in a budding yeast mutant that harbours a defect in the spindle pole body (yeast centrosome) duplication process, resulting in a monopolar spindle (Winey et al., 1991). Mps1 phosphorylates serine, threonine and tyrosine in vitro; thus, it is a dual specificity protein kinase TTK (Lauze et al., 1995). Intermolecular autophosphorylation of Mps1 within its activation loop increases its kinase activity (Mattison et al., 2007; Sun et al., 2010). Mps1 is localized within centrosomes and kinetochores and associates with microtubules (Dou et al., 2003; Liu et al., 2003; Stucke et al., 2004). Orthologues of Mps1 are found in most eukaryotes. Human Mps1 controls various steps during mitosis including centrosome duplication, spindle assembly, bipolar spindle attachment, the mitotic checkpoint, mitotic exit and cytokinesis (Liu and Winey, 2012). Substrate phosphorylation by Mps1 plays a role in mitotic functions. Mps1 phosphorylates borealin to control aurora kinase B activity (Jelluma et al., 2008), Knl1 to recruit MCC components (Yamagishi et al., 2012), Mad2 to maintain SAC‐induced arrest (Zich et al., 2012), Mad3/BubR1 to correct kinetochore attachment (Huang et al., 2008), Dam1 to couple kinetochores to microtubules (Shimogawa et al., 2006) and Hec1/Ndc80 to activate the SAC (Kemmler et al., 2009). Chemical or RNAi‐based inhibition of Mps1 have confirmed its role in mitosis (Dou et al., 2015; Jemaa et al., 2016). Therefore, suppression of Mps1 could be an anti‐mitotic target.
Mps1 is overexpressed in several human cancer tissues or cells including breast, glioma, liver, lung, pancreas and thyroid (Yuan et al., 2006; Salvatore et al., 2007; Landi et al., 2008; Daniel et al., 2011; Maire et al., 2013; Tannous et al., 2013; Liang et al., 2014; Slee et al., 2014). A high expression of Mps1 is associated with poor survival of patients with glioma and pancreatic cancer (Tannous et al., 2013; Slee et al., 2014; Maachani et al., 2015), although it is associated with better survival in those with triple‐negative breast cancer (Maire et al., 2013). In addition, the Mps1‐encoding TTK gene is highly mutated in colorectal cancer with microsatellite instability (Niittymaki et al., 2011). Therefore, the overexpression or mutation of Mps1 is associated with tumourigenesis.
Several Mps1 inhibitors including AZ3146 (Hewitt et al., 2010), BAY1161909 (Wengner et al., 2016), BAY1217389 (Wengner et al., 2016), CFI‐402257 (Liu et al., 2016), MPI‐0479605 (Tardif et al., 2011), Mps BAY1 (Jemaa et al., 2013), Mps BAY2a (Jemaa et al., 2013), Mps1‐IN‐1 (Kwiatkowski et al., 2010), Mps1‐IN‐2 (Kwiatkowski et al., 2010), Mps1‐IN‐3 (Tannous et al., 2013), NMS‐P715 (Colombo et al., 2010), NTRC 0060‐0 (Maia et al., 2015), reversine (Santaguida et al., 2010) and SP600125 (Schmidt et al., 2005) have been developed, and some are undergoing clinical trials. Recently, a novel Mps1 inhibitor, TC Mps1 12, which has a diaminopyridine‐based structure, was designed and shown to inhibit tumour growth in an A549 xenograft model (Kusakabe et al., 2012). However, its mechanism of action has not been examined.
Human hepatocellular carcinoma (HCC) is the most common and aggressive type of liver cancer. However, conventional chemotherapy is limited to sorafenib, which is a multiple kinase inhibitor and the only clinically approved drug for the treatment of HCC. Unfortunately, the development of sorafenib resistance causes many difficulties. Therefore, a new chemotherapeutic agent is needed to treat HCC. Here, we show that TC Mps1 12 inhibits the proliferation of HCC cells by causing mitotic catastrophe. The data suggest that TC Mps1 12 could be an effective anti‐cancer treatment for HCC.
Methods
Cell culture and drug treatment
HepG2 and Hep3B human HCC cells, A549 lung carcinoma cells, HeLa cervical carcinoma cells and MDA‐MB‐231 breast carcinoma cells were maintained in DMEM (Welgene Inc., Gyeongsangbuk‐do, Republic of Korea) supplemented with 10% FBS, 100 U·mL−1 penicillin G sodium, 100 μg·mL−1 streptomycin sulfate and 0.25 μg·mL−1 amphotericin B. Cells were incubated at 37°C in a 5% CO2 incubator and treated with TC Mps1 12 (Tocris, Bristol, UK; 4750), Mps BAY2a (Tocris; 5562), SP600125 (Santa Cruz Biotechnology, Dallas, TX, USA; sc‐200635), nocodazole (Sigma‐Aldrich, St. Louis, MO, USA; M1404) or MG132 (Cayman Chemical, Ann Arbor, MI, USA; 10012628) for the indicated times.
Cell viability assay
Cells (7.5 × 10³ cells per well) were placed in a 96‐well plate and then treated with various concentrations of Mps1 inhibitors for indicated times. Cell viability was assessed by colorimetric MTT assay. MTT (3‐(4,5‐dimethylthiazol‐2‐yl)‐2,5‐diphenyltetrazolium bromide) was added to each well, and the plate was incubated at 37°C for 4 h to allow formation of MTT formazan crystals. After the culture medium was removed, the formazan crystals were dissolved using DMSO. The absorbance was measured with a test wavelength of 570 nm and a reference wavelength of 650 nm (Choi et al., 2015). Cell viability was also assessed by using the trypan blue exclusion test. Cells (1 × 10⁵ cells per 35 mm dish) were seeded and treated with Mps1 inhibitor. After incubation for the indicated times, cells were detached and mixed with 0.4% trypan blue solution. The number of live cells that did not take up trypan blue was counted.
Immunofluorescence staining
Cells were grown on coverslips and treated with the drugs indicated. The cells were fixed with 3% paraformaldehyde solution at room temperature for 10 min and then permeabilized with 0.5% Triton X‐100 at room temperature for 5 min (Choi et al., 2015). The cells were incubated with an antibody against aurora B (Santa Cruz Biotechnology; sc‐25426), BubR1 (BD Biosciences, Franklin Lakes, NJ, USA; 612503), Mad2 (Thermo Fisher Scientific, Rockford, IL, USA; PA5‐21594), CENP‐E (Abcam, Cambridge, UK; ab5093) or CREST (ImmunoVision, Springdale, AR, USA; HCT‐0100) at 37°C for 20 min and then incubated with corresponding secondary antibody at 37°C for 20 min. For the staining with α‐tubulin (Abcam; 18251), γ‐tubulin (Abcam; 11316) and pericentrin (Abcam; 28144) antibodies, the cells were fixed with cold methanol at −20°C for 20 min and then rehydrated in PBS three times. The cells were post‐fixed with paraformaldehyde and permeabilized as described above. The nuclei were counterstained with Hoechst 33342. After a final wash with PBS, coverslips were mounted with antifade solution containing para‐phenylenediamine and glycerol in PBS. The staining was determined using a laser scanning confocal microscope (Carl Zeiss, Oberkochen, Germany; LSM700). The number of abnormal chromosome‐, micronuclei‐ or apoptotic body‐containing cells and centrosomes was counted in a blinded manner without knowledge of the treatments. Twenty cells undergoing mitosis were randomly selected for counting abnormal chromosome‐containing cells. A total of 500 cells were randomly selected for counting micronuclei‐ and apoptotic body‐containing cells. A total of 50 cells were randomly selected for counting centrosome number.
Western blotting
Cells were lysed using NETN buffer (100 mM NaCl, 1 mM EDTA, 20 mM Tris–HCl pH 8.0, 0.5% Nonidet P‐40, 50 mM β‐glycerophosphate, 10 mM sodium fluoride and 1 mM sodium orthovanadate) containing a protease inhibitor cocktail (Millipore, Darmstadt, Germany; 535140) on ice for 10 min. After centrifugation at 12 000× g for 5 min, the supernatant was saved as a crude cell extract. The crude cell extracts were boiled in the Laemmli buffer and then loaded onto a SDS‐polyacrylamide gel. The antibodies used for western blotting are as follows: α‐tubulin (Abcam; ab18251), Aurora A‐pT288/Aurora B‐pT232/Aurora C‐pT198 (Cell Signaling Technology, Danvers, MA, USA; 2914), Aurora B (Cell Signaling Technology; 3094), BubR1 (BD Biosciences; 612503), cyclin B1 (Santa Cruz Technology; sc‐752), GAPDH (Santa Cruz Biotechnology; sc‐25778), Mps1 (Abcam; ab11108), Mps1‐pT676 (Signalway Antibody, College Park, MD, USA; 12537), p53 (Santa Cruz Biotechnology; sc‐126), PARP‐1 (Santa Cruz Biotechnology; sc‐7150), PLK1 (Cell Signalling Technology, 4513) and PLK1‐pT210 (Santa Cruz Biotechnology; sc‐135706). The BubR1‐pS670 antibody was obtained by immunizing a rabbit with a specific peptide (C.W. Lee, Sungkyunkwan University). The expression levels of each protein were quantified by densitometry using ImageJ software.
Time‐lapse microscopy
The TSiN‐H2B‐RFP lentiviral construct was the kindly gift of Dr P.J. Galardy (Mayo Clinic). Lentivirus was prepared by transfection of HEK293T cells with TSiN‐H2B‐RFP lentiviral plasmid, psPAX2 packaging plasmid and pMD2.G envelope plasmid. HepG2 cells were infected with lentivirus encoding H2B‐RFP in the presence of 8 μg·mL−1 polybrene. Time‐lapse imaging was acquired using a Cell Observer (Carl Zeiss; Cell Observerâ Living Cells) equipped with a camera. Frames were recorded every 5 min. Cell morphology was visualized on a phase contrast microscope, and RFP was detected by fluorescence (Choi et al., 2015).
Analysis of association of Mps1 expression with patient survival
The Mps1‐coding TTK gene expressions of all 360 human liver hepatocellular carcinoma patients (up to 8 August 2016) were downloaded from The Cancer Genome Atlas (TCGA) (https://tcga‐data.nci.nih.gov). The data with more than 2000 days of survival day were excluded (21 cases). Overall, a total of 339 patients were analysed for overall survival (Zhang et al., 2015). TTK transcript level was determined by Illumina HiSeq2000 RNA Sequencing Version 2 analysis and processed using the SUBIO platform (trial version). For each sample, TTK expression was defined as high (above median) or low (below median). The survival time of the patients was the date of death for deceased patients or the last contact date in alive patients for censoring. The association of transcript level with patient survival was visualized using Kaplan–Meier curves, and the significance of differences was assessed by a log‐rank test using SPSS (version 23).
Nomenclature of targets and ligands
Key protein targets and ligands in this article are hyperlinked to corresponding entries in http://www.guidetopharmacology.org, the common portal for data from the IUPHAR/BPS Guide to PHARMACOLOGY (Southan et al., 2016), and are permanently archived in the Concise Guide to PHARMACOLOGY 2015/16 (Alexander et al., 2015a,b).
Data and statistical analysis
The data and statistical analysis comply with the recommendations on experimental design and analysis in pharmacology (Curtis et al., 2015). All experiments were repeated five times (n = 5); n refers to independent values, and not replicates. Each value is expressed as mean ± SEM. To control for unwanted sources of variation, we performed normalization to better compare the differences after the treatment and to reveal meaningful relevant trends. The viability of DMSO‐treated control cells was considered to be 100%. The viability of the drug‐treated cells was expressed as a % of the control. Protein expression levels were normalized to that of α‐tubulin or GAPDH, and the expression levels of the drug‐treated cells were expressed as fold changes over that of the DMSO‐treated control cells, whose expression was set to 1. The SEM was normalized appropriately. The level of protein expression was expressed by a normalization procedure that generates control values with no variance (SEM = 0) to reduce the effect of any variations from different exposure of blotting, and these data were not subjected to parametric statistical analysis. Statistical analysis was performed using SPSS (version 23). Differences between two groups were evaluated by the Student's unpaired t‐test for parametric analysis or Mann–Whitney test for non‐parametric analysis. Differences between three or more groups were evaluated by one‐way ANOVA (ANOVA) followed by a Tukey's honest significant difference (HSD) comparison for parametric analysis or Kruskal–Wallis test followed by Dunn's multiple comparison for non‐parametric analysis. Post hoc tests were run only if F achieved P < 0.05, and there was no significant inhomogeneity. Statistical differences were considered significant from the control when P < 0.05 and are indicated by *, # or +.
Results
Mps1 is a potential therapeutic target for liver cancer
Mps1 is overexpressed in many cancers, suggesting that inhibiting Mps1 is a potential treatment for cancer. We downloaded the TTK mRNA levels from the TCGA dataset and performed Kaplan–Meier analysis. The information for the hepatocellular carcinoma patients is listed in Table 1. Kaplan–Meier curves demonstrated that HCC patients with high TTK expression had significantly poorer overall survival (Figure 1). Thus, Mps1 expression may be a strong predictive factor for survival of liver cancer patients.
Table 1.
Characteristics of HCC patients from TCGA
| Low expression of Mps1 | High expression of Mps1 | |
|---|---|---|
| Total number of patients | 170 | 169 |
| Gender | ||
| Male | 125 | 108 |
| Female | 45 | 61 |
| Mean age, years (range) | 62.1 (17–90) | 57.7 (18–85) |
| Tumour grade | ||
| G1 | 33 | 13 |
| G2 | 92 | 68 |
| G3 | 38 | 78 |
| G4 | 3 | 9 |
| Unknown | 4 | 1 |
| AJCC pathologic stage | ||
| I | 93 | 64 |
| II | 33 | 47 |
| III | 28 | 48 |
| IV | 3 | 2 |
| Unknown | 13 | 8 |
| Venous invasion | ||
| Macro | 6 | 10 |
| Micro | 40 | 47 |
| No | 104 | 79 |
| Unknown | 20 | 33 |
Figure 1.
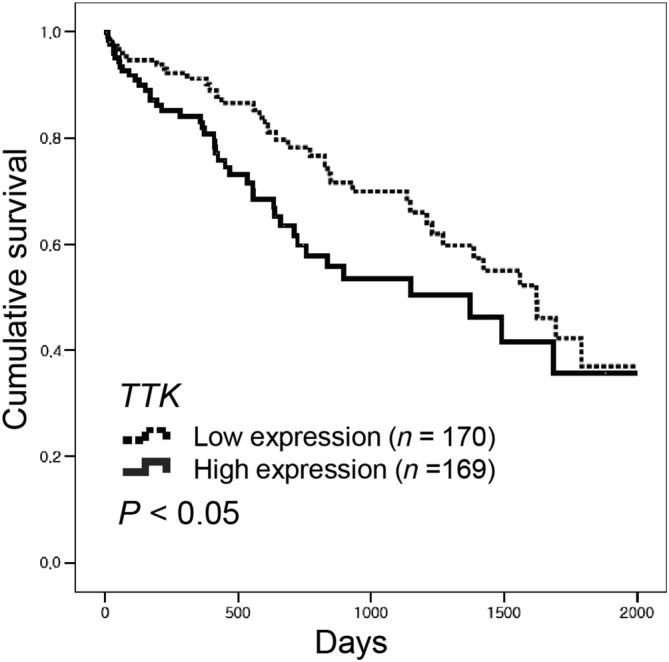
Mps1‐coding TTK expression is associated with low survival of HCC patients. An mRNA expression dataset was obtained from TCGA. Kaplan–Meier survival analysis was performed using data from 339 HCC patients. TTK expression was defined as high (above median) or low (below median). P‐values were calculated using the log‐rank test.
TC Mps1 12 reduces the proliferation of HCC cells
Because a high expression of Mps1 is associated with low survival in liver cancer patients, the inhibition of Mps1 could represent one strategy for the treatment of cancer. We examined the effect of TC Mps1 12, a specific Mps1 inhibitor, on HCC cells. Exposure of both HepG2 and Hep3B cells to TC Mps1 12 at concentrations greater than 50 μM for 24 h caused a reduction in cell viability (Figure 2A). Although cell viability was not affected at concentrations below 10 μM TC Mps1 12 for 24 h, low concentrations (e.g. 0.1, 1 or 10 μM) inhibited Mps1 enzymatic activity as assessed by measuring the phosphorylation of Mps1 substrates. The levels of phosphorylated Mps1‐T676 and BubR1‐S670, both of which are phosphorylated by Mps1 in the presence of nocodazole, a microtubule depolymerizer, were reduced by TC Mps1 12 in a concentration‐dependent manner (Figure 2B). To compare the effects of Mps1 inhibitors on cell viability, we treated cells for up to 72 h with Mps BAY2a, a specific Mps1 inhibitor, and SP600125, a broad‐spectrum inhibitor of serine/threonine kinases, including Mps1. The results show that the inhibitory effect was both dose and time dependent (Figure 2C). Treatment with Mps BAY2a resulted in the most significant reduction in cell viability. The inhibitory effects of TC Mps1 12 and SP600125 on cell viability were similar (Figure 2C). The inhibitory effect of SP600125 might be because it inhibits multiple kinases, resulting in the interruption of cell proliferation. Next, we examined the cytotoxic effects of TC Mps1 12 on three different cell types, namely, A549 lung cancer, HeLa cervical cancer and MDA‐MB‐231 breast cancer cells. Whereas TC Mps1 12 was most effective against MDA‐MB‐231 cells, it inhibited HCC cells and A549 and HeLa cells to a similar extent (Figure 2D). Assuming that HCC is relatively resistant to chemotherapy, TC Mps1 12 would be effective as an anti‐HCC drug. The inhibitory effect of TC Mps1 12 on HCC cell proliferation was also confirmed by the dye exclusion test (Figure 2E). Interestingly, Hep3B cells were more sensitive than HepG2 cells to both high and low doses of TC Mps1 12 (Figure 2A, C‐E). Taken together, these data show that TC Mps1 12 retards the growth of HCC cells.
Figure 2.
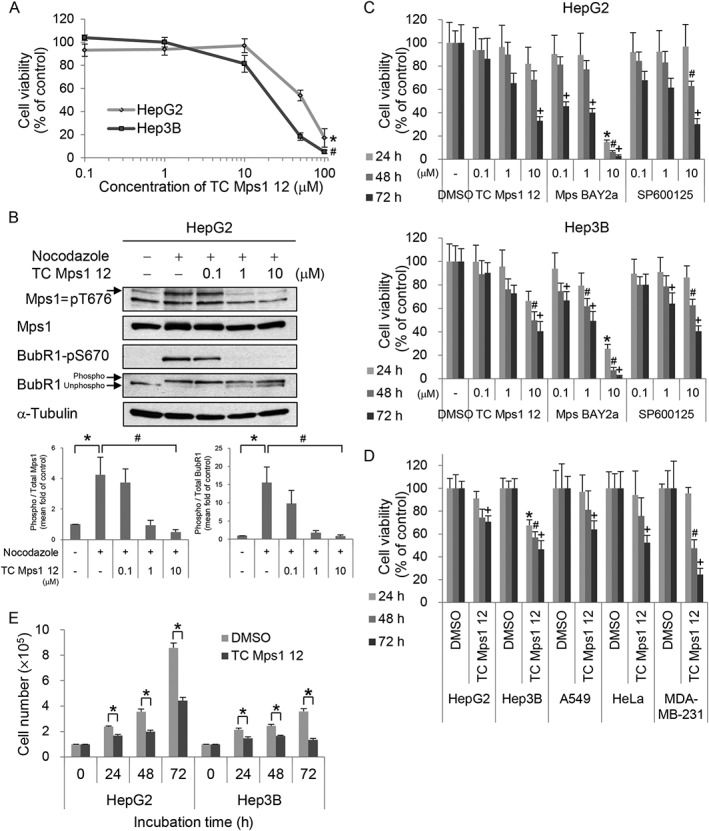
TC Mps1 12‐treated HCC cells show a defect in cell proliferation. (A) HepG2 and Hep3B cells were treated with various concentrations of TC Mps1 12 for 24 h. Viability was determined by the MTT assay. *P < 0.05 and # P < 0.05 by Kruskal–Wallis test followed by Dunn's test, significantly different from corresponding HepG2 and Hep3B control cells respectively. (B) HepG2 cells were treated with 0.2 μg·mL−1 nocodazole for 24 h and then treated with the indicated concentrations of TC Mps1 12 for 60 min. The levels of phospho‐proteins were quantified using ImageJ software. *P < 0.05 by Mann–Whitney test, significantly different from control cells, and # P < 0.05 by Kruskal–Wallis test followed by Dunn's test, significantly different from nocodazole‐treated cells. (C) HepG2 and Hep3B cells were treated with the indicated concentrations of several Mps1 inhibitors for the indicated times. Viability was determined using the MTT assay. *P < 0.05, # P < 0.05 and + P < 0.05 by one‐way ANOVA followed by Tukey's HSD test, significantly different from corresponding DMSO‐treated cells at 24, 48 and 72 h respectively. (D) HepG2, Hep3B, A549, HeLa and MDA‐MB‐231 cells were treated with 10 μM TC Mps1 12 for the indicated times. Viability was determined by the MTT assay. *P < 0.05, # P < 0.05 and + P < 0.05 by Student's unpaired t‐test, significantly different from corresponding DMSO‐treated cells at 24, 48 and 72 h respectively. (E) HepG2 and Hep3B cells were treated with 10 μM TC Mps1 12 for the indicated times. Viability was determined by the trypan blue exclusion test. *P < 0.05 by Student's unpaired t‐test, significantly different from corresponding DMSO‐treated cells. Each value is expressed as mean ± SEM (n = 5).
TC Mps1 12 causes the accumulation of chromosomal instabilities
Next, we examined the mechanism by which TC Mps1 12 retards cell proliferation. Mps1 regulates chromosome alignment and biorientation, and other Mps1 inhibitors disrupt chromosomal stability (Jelluma et al., 2008; Santaguida et al., 2010; Dou et al., 2015). Therefore, we first examined the shape of the nuclei in TC Mps1 12‐treated HepG2 and Hep3B cells by immunofluorescence staining (Figure 3A). We found that TC Mps1 12 treatment resulted in misaligned chromosomes, lagging chromosomes and micronuclei. The number of mitotic cells harbouring misaligned and lagging chromosomes was higher in TC Mps1 12‐treated cells than in untreated cells (Figure 3B). In addition, TC Mps1 12 increased the number of micronuclei‐containing cells in a time‐dependent manner (Figure 3C). The effect of TC Mps1 12 on chromosomal stability was compared with those of other inhibitors including Mps BAY2a and SP600125. Mps BAY2a induced misaligned chromosomes, lagging chromosomes (Figure 3B) and micronuclei (Figure 3C). However, even though Mps BAY2a showed the most significant cytotoxicity (Figure 2C), Mps BAY2a had a weaker effect on micronuclei formation in Hep3B cells (Figure 3C) because the majority of Mps BAY2a‐treated Hep3B cells underwent apoptosis, as determined by the formation of apoptotic bodies (Figure 5E). SP600125 treatment resulted in misaligned chromosomes and micronuclei (Figure 3B, C), but not lagging chromosomes. TC Mps1 12 had a stronger effect on chromosomal instability than SP600125. This demonstrates that TC Mps1 12 induces chromosome missegregation, resulting in chromosomal instability.
Figure 3.
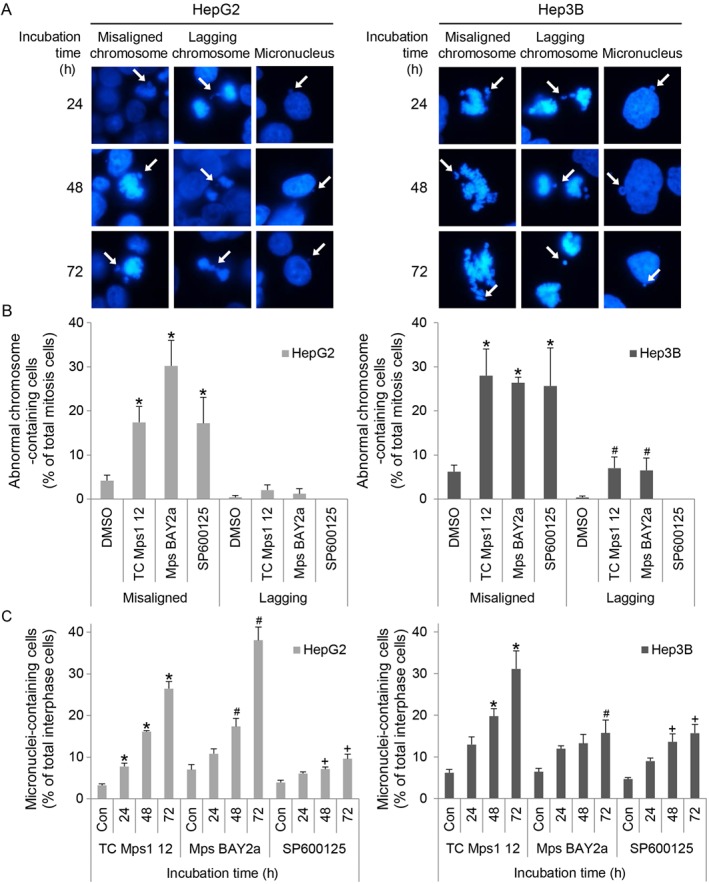
TC Mps1 12‐treated HCC cells harbour chromosomal abnormalities. (A) HepG2 and Hep3B cells were treated with 1 μM TC Mps1 12 for the indicated times. Cell nuclei and chromosomes were visualized by Hoechst staining. Arrows indicate misaligned chromosome, lagging chromosome and micronucleus as labelled in each column. (B) The number of mitotic cells harbouring abnormal chromosomes was counted after treatment with 1 μM of TC Mps1 12, Mps BAY2a or SP600125 for 24 h. *P < 0.05 by one‐way ANOVA followed by Tukey's HSD test, significantly different from corresponding DMSO‐treated cells. (C) The number of interphase cells containing micronuclei after treatment with 1 μM of TC Mps1 12, Mps BAY2a or SP600125 for the indicated times was counted. Con (control) cells were treated with vehicle (DMSO) for 72 h. *P < 0.05, # P < 0.05 and + P < 0.05 by one‐way ANOVA followed by Tukey's HSD test, significantly different from corresponding control cells. Each value is expressed as mean ± SEM (n = 5).
Figure 5.
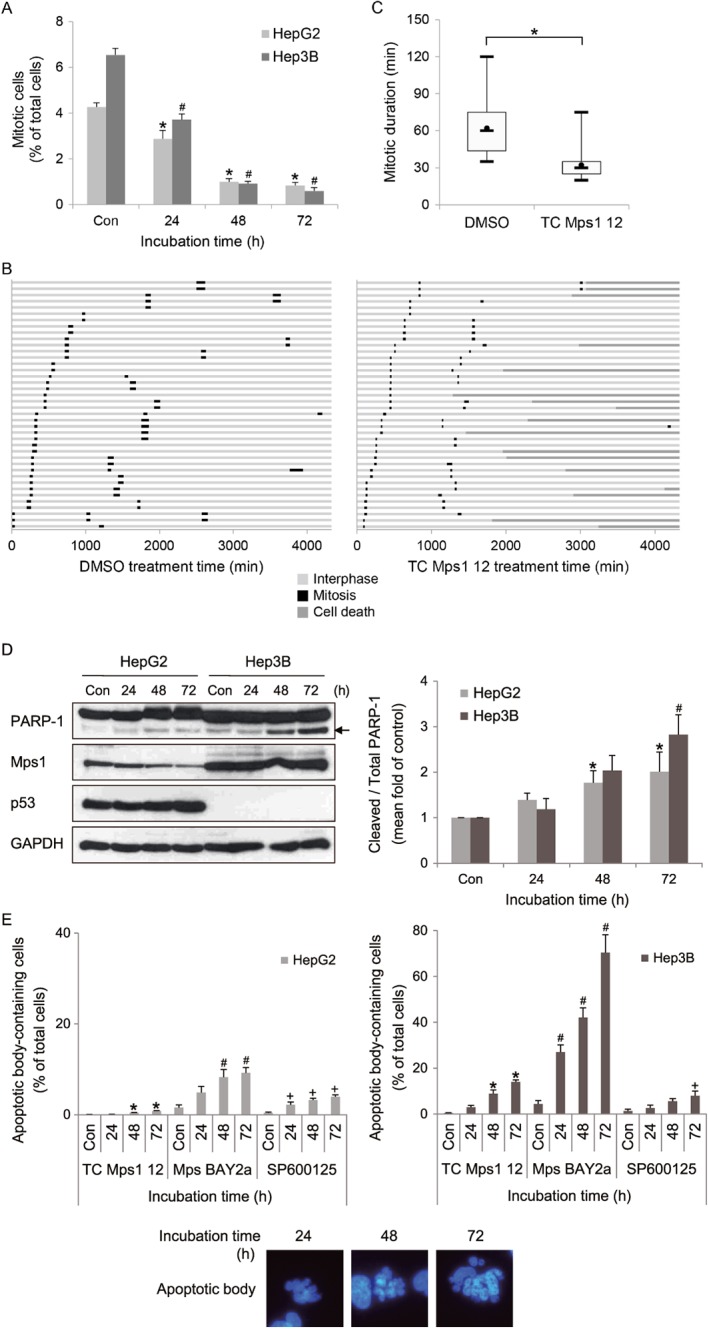
TC Mps1 12‐treated HCC cells undergo premature mitotic exit and cell death. (A) HepG2 and Hep3B cells were treated with 1 μM TC Mps1 12 for the indicated times. Con (control) cells were treated with vehicle (DMSO) for 72 h. The number of cells undergoing mitosis and cytokinesis was counted. *P < 0.05 and # P < 0.05 by one‐way ANOVA followed by Tukey's HSD test, significantly different from corresponding HepG2 and Hep3B control cells respectively. Each value is expressed as mean ± SEM (n = 5). (B) H2B‐RFP‐transduced HepG2 cells were treated with DMSO or 1 μM TC Mps1 12. Cells were then subjected to time‐lapse fluorescence microscopy to track individual cells for 72 h (= 4320 min). The duration of interphase and mitosis and the fate of cell death were recorded in each condition. The colour of the bar denotes the status of the cells: interphase, mitosis and cell death. The length of the bar denotes the duration of each status. Each horizontal bar represents one cell (n = 40). (C) The duration of mitosis is represented in a box‐and‐whisker plot. Box, interquartile range; whisker, minimum and maximum value; black circle, average value; bar, median value. *P < 0.05 by unpaired Student's t‐test, significantly different from DMSO‐treated cells. (D) The expression of each protein was evaluated by western blotting. The arrow indicates a cleaved form of PARP‐1. The level of cleaved PARP‐1 was quantified using ImageJ software and normalized to GAPDH. Each value is expressed as mean ± SEM (n = 5). *P < 0.05 and # P < 0.05 by Kruskal–Wallis test followed by Dunn's test, significantly different from corresponding HepG2 and Hep3B control cells respectively. (E) HepG2 and Hep3B cells were treated with 1 μM of TC Mps1 12, Mps BAY2a or SP600125 for the indicated times. Con (control) cells were treated with vehicle (DMSO) for 72 h. The number of apoptotic body‐containing cells stained with Hoechst 33342 was counted. *P < 0.05, # P < 0.05 and + P < 0.05 by one‐way ANOVA followed by Tukey's HSD test, significantly different from corresponding control cells.
TC Mps1 12 causes disorganization of centrosomes
The accumulation of chromosomal instabilities might be due to a defect in mitotic spindle and centrosome formation. To check whether Mps1 inhibition induces abnormalities in mitotic spindles and centrosomes, we visualized its effects by staining cells with antibodies specific for both α‐tubulin and γ‐tubulin. As shown in Figure 3A, TC Mps1 12‐treated HepG2 and Hep3B cells contained misaligned chromosomes and multipolar spindles (Figure 4A). We also counted the number of centrosomes in interphase cells. While cells with one or two centrosome(s) are normal, cells with more than two centrosomes are abnormal. The number of multicentrosome‐containing cells was increased significantly by TC Mps1 12 treatment in a time‐dependent manner (Figure 4B). Mps BAY2a and SP600125 also increased the number of centrosomes (Figure 4C, D). This may cause a failure in chromosome segregation and, ultimately, aneuploidy.
Figure 4.
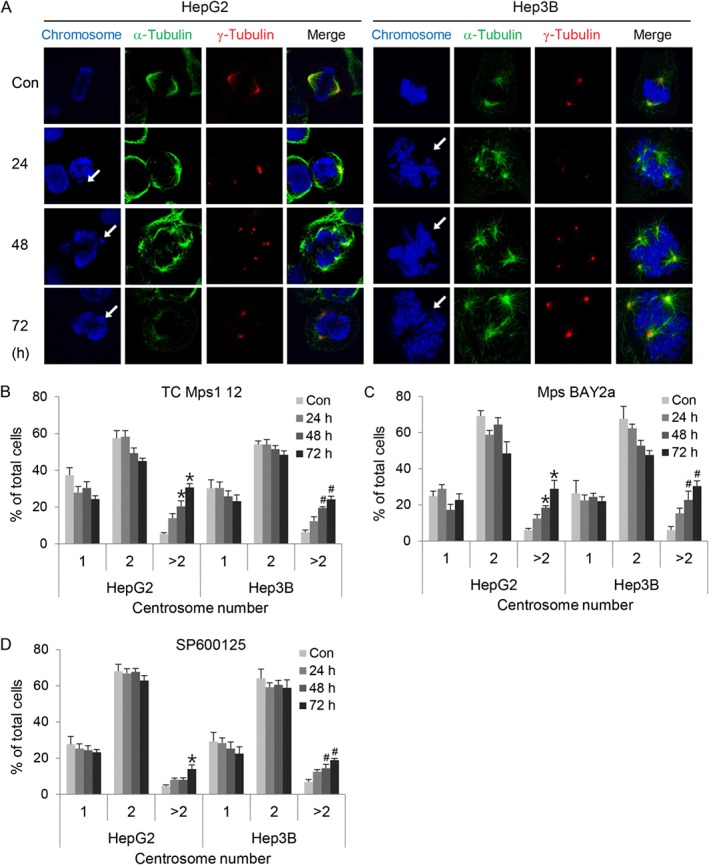
TC Mps1 12‐treated HCC cells contain abnormal spindle poles and centrosome number. (A) HepG2 and Hep3B cells were treated with 1 μM TC Mps1 12 for the indicated times. Con (control) cells were treated with vehicle (DMSO) for 72 h. The cells were then subjected to immunofluorescence staining with antibodies specific for α‐tubulin and γ‐tubulin. Arrows indicate misaligned chromosomes. (B–D) HepG2 and Hep3B cells were treated with 1 μM TC Mps1 12, Mps BAY2a or SP600125 for the indicated times. Con (control) cells were treated with vehicle (DMSO) for 72 h. The number of centrosomes stained with pericentrin was counted in interphase cells. *P < 0.05 and # P < 0.05 by one‐way ANOVA followed by Tukey's HSD test, significantly different from corresponding HepG2 and Hep3B control cells respectively. Each value is expressed as mean ± SEM (n = 5).
TC Mps1 12 shortens the duration of mitosis and induces apoptosis
The disorganization of mitotic chromosomes may disrupt mitotic progression. Therefore, we first determined the proportion of mitotic cells undergoing prophase, prometaphase, metaphase, anaphase, telophase and cytokinesis (Figure 5A). TC Mps1 12‐treated cells had a smaller proportion of mitotic cells than control cells, suggesting that cell proliferation was slow. Next, the effect of TC Mps1 12 on mitotic duration was examined by live cell imaging. The average time of mitotic progression in control HepG2 cells was 65 min; however, the time in TC Mps1 12‐treated HepG2 cells was 25 min (Figure 5B, C). This indicates that TC Mps1 12 treatment induces premature mitotic exit. In addition, whereas DMSO‐treated cells divided normally into two daughter cells, some of TC Mps1 12‐treated cells died (Figure 5B). Next, to identify the dead cells, we measured cleavage of PARP‐1 as an indicator of apoptosis. TC Mps1 12‐treated HepG2 and Hep3B cells showed significant cleavage of PARP‐1 (Figure 5D). In addition, apoptosis was verified by measuring the apoptotic bodies after treatment with TC Mps1 12, Mps BAY2a or SP600125 (Figure 5E). Although SP600125 had a smaller effect on chromosome abnormality and micronuclei formation (Figure 3B, C), SP600125 had a similar effect to TC Mps1 12 on apoptosis, probably because of inhibition of multiple kinases (Figure 5E). This suggests that the cytotoxic effect of SP600125 is not specifically related to Mps1 inhibition. As shown in Figure 2C, Mps BAY2a had the highest apoptotic effect in HCC cells (Figure 5E). In particular, the marked death of Mps BAY2a‐treated Hep3B cells results in a smaller number of micronuclei‐containing cells than expected (Figure 3C). Overall, this indicates that chromosomal instability and centrosome abnormality might lead to mitotic catastrophe.
TC Mps1 12 inactivates the SAC
We next investigated the mechanism by which TC Mps1 12 induces premature mitotic exit, even in the presence of misaligned chromosome and multipolar spindles. To activate SAC, we treated cells with nocodazole, a microtubule depolymerizer, which causes unattached microtubule–kinetochores. We then examined the effect of TC Mps1 12 on the SAC (Figure 6A). Nocodazole treatment increased total levels of aurora B, PLK1, BubR1 and cyclin B1, demonstrating that the cell population was enriched with cells in mitosis. After treatment with TC Mps1 12, all levels were reduced, indicating that the inhibitor caused cells to exit nocodazole‐induced mitosis. Nocodazole also induced phosphorylation of aurora B‐T232, PLK1‐T210 and BubR1‐S670, which suggests activation of aurora B, aurora A and Mps1, respectively, and activates the SAC. The amount of phosphorylation significantly decreased in the presence of TC Mps1 12, indicating the inactivation of aurora B, aurora A and Mps1. Because phosphorylation of BubR1‐S670 is sensitive to loss of microtubule attachment (Huang et al., 2008), reduced phosphorylation in the presence of TC Mps1 12 implies that inhibiting Mps1 renders cells insensitive to unattached microtubules–kinetochores and they therefore fail to correct the errors. In addition, cyclin B1, one of the substrates for APC/C, was degraded in the presence of TC Mps1 12, indicating that SAC inactivation induces onset of the anaphase. Next, we examined the recruitment of SAC‐related proteins to the kinetochore by immunofluorescence staining (Figure 6B, C). We found that aurora B, BubR1, Mad2 and CENP‐E were recruited to the kinetochore of prometaphase chromosomes in control cells and nocodazole‐treated cells. By contrast, BubR1, Mad2 and CENP‐E, all of which are substrates for Mps1, were not recruited (or the recruitment was much lower) to the kinetochore of prometaphase chromosomes in TC Mps1 12‐treated cells or cells treated with nocodazole plus TC Mps1 12; however, localization of aurora B was unaffected. Although Mps1 activates aurora B (Jelluma et al., 2008; van der Waal et al., 2012), it also acts downstream of aurora B (Santaguida et al., 2010; Saurin et al., 2011). In addition, live cell imaging revealed that nocodazole‐treated cells were held at mitosis, while few cells underwent mitotic exit and cell death (Figure 6D). By contrast, the majority of TC Mps1 12‐treated cells exited nocodazole‐induced arrest (Figure 6D). Overall, these data demonstrate that TC Mps1 12 reverses nocodazole‐induced SAC, resulting in mitotic slippage and a failure to correct microtubule–kinetochore unattachment.
Figure 6.
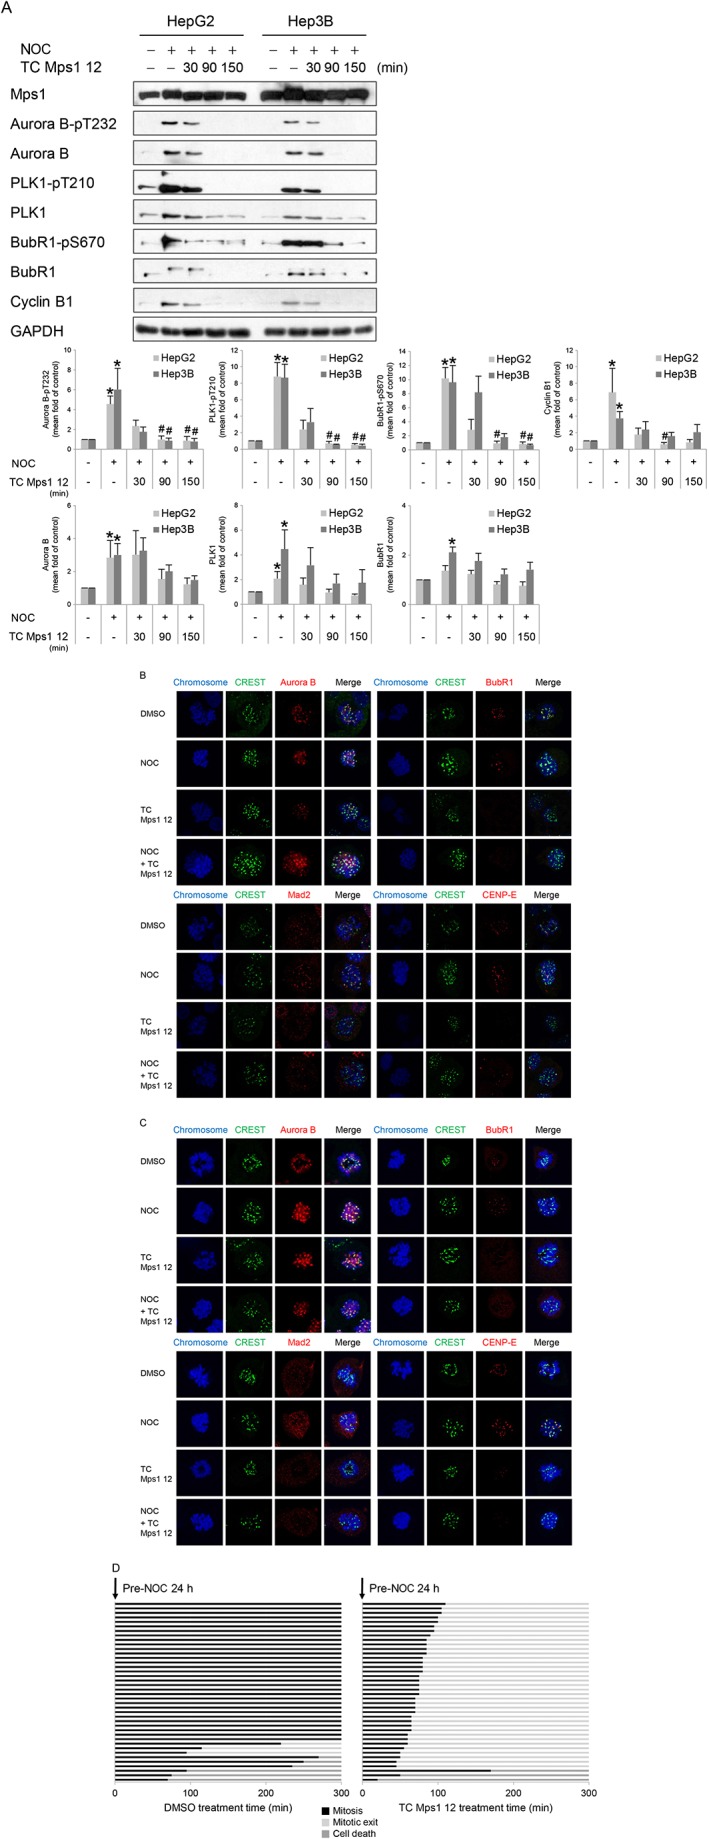
TC Mps1 12‐treated HCC cells override the SAC. (A) HepG2 and Hep3B cells were treated with 0.2 μg·mL−1 nocodazole for 24 h, followed by 10 μM TC Mps1 12 for the indicated times. The expression of each protein was determined by western blotting. The level of each protein was quantified using ImageJ software and normalized to GAPDH. *P < 0.05 by Mann–Whitney test, significantly different from each control cell, and # P < 0.05 by Kruskal–Wallis test followed by Dunn's test, significantly different from each nocodazole‐treated cell. Each value is expressed as mean ± SEM (n = 5). HepG2 (B) and Hep3B (C) cells were treated with 0.2 μg·mL−1 nocodazole (NOC) for 24 h, followed by 10 μM TC Mps1 12 and 20 μM MG132 for 10 min. The location of each protein was examined by staining with the indicated antibodies. (D) H2B‐RFP‐transduced HepG2 cells were treated with 0.2 μg·mL−1 nocodazole for 24 h. Starting immediately after addition of DMSO or 10 μM TC Mps1 12, cells were then subjected to time‐lapse fluorescence microscopy to track individual cells for 5 h (= 300 min). The duration of mitosis and the cell fate were recorded in each condition. The colour of the bar denotes the status of the cells: mitosis, mitotic exit and cell death. The length of the bar denotes the duration of each status. Each horizontal bar represents one cell (n = 40).
Discussion
Mps1, which plays an essential role in mitotic progression, is emerging as a potential target for cancer treatment. Here, we showed that the Mps1 inhibitor TC Mps1 12 induced the formation of multicentrosomes as well as misaligned and lagging chromosomes. Mitotic slippage via inactivation of the SAC results in chromosomal instability and finally apoptosis in HCC cells. These data demonstrate that TC Mps1 12 may be an effective treatment for liver cancer.
Several studies show that depletion of Mps1 affects mitosis. A lack of Mps1 perturbs centrosome duplication (Fisk et al., 2003), induces chromosome misalignment and missegregation (Fisk et al., 2003; Janssen et al., 2009; Santaguida et al., 2010; Dou et al., 2015), a failure to correct erroneous microtubule attachment (Jelluma et al., 2008), cytokinesis failure (Fisk et al., 2003) and apoptosis (Jemaa et al., 2016), shortens mitosis (Dou et al., 2015; Jemaa et al., 2016), and prevents the recruitment of SAC‐related proteins, including Mad1, Mad2, Bub1, BubR1 and Rod‐Zw10‐Zwilch (Martin‐Lluesma et al., 2002; Santaguida et al., 2010; Jemaa et al., 2016). In addition, depletion of Mps1 inhibits proliferation of HCC cells (Liang et al., 2014; Liu et al., 2015; Miao et al., 2016). Overall, because the dysregulation of Mps1 leads to an accumulation of chromosomal instabilities and, finally, cell death, it may be a target for cancer therapeutics. Therefore, some Mps1 inhibitors have been developed and characterized. The enzymatic inhibition of Mps1 kinase by pharmacological inhibitors leads to similar phenotypes in Mps1‐depleted cells, as summarized in Table 2. TC Mps1 12 also induces chromosome misalignment and missegregation and the formation of multicentrosomes, prevents the recruitment of SAC‐related proteins and SAC activation, shortens mitotic duration and induces apoptosis.
Table 2.
The comparisons between Mps1 inhibitors
| IC50 in vitro | In vitro abnormalities | Tumour xenograft model | Clinical trial | |
|---|---|---|---|---|
| TC Mps1 12 | 6.4 nM (Kusakabe et al., 2012) | Our study | Lung cancer (Kusakabe et al., 2012) | |
| AZ3146 | 35 nM (Hewitt et al., 2010) | Chromosome misalignment (Dou et al., 2015) | ||
| Failure in recruitment of Mad1, Mad2, Bub1 and CENP‐E (Hewitt et al., 2010) | ||||
| Short mitotic duration (Hewitt et al., 2010; Gurden et al., 2015) | ||||
| Apoptosis (Jemaa et al., 2016) | ||||
| BAY 1161909 | 0.34 nM (Wengner et al., 2016) | Breast, lung and ovarian cancer (Wengner et al., 2016) |
Phase I ClinicalTrials.gov ID: NCT02138812 |
|
| BAY 1217389 | 0.63 nM (Wengner et al., 2016) |
Phase I ClinicalTrials.gov ID: NCT02366949 |
||
| CFI‐402257 | 1.7 nM (Liu et al., 2016) | |||
| MPI‐0479605 | 1.8 nM (Tardif et al., 2011) | Chromosome missegregation | Colon cancer (Tardif et al., 2011) | |
| Hyperploidy | ||||
| Apoptosis | ||||
| Up‐regulation of p53, p21 and γ‐H2AX (Tardif et al., 2011) | ||||
| Mps BAY1 | 0.99 nM (Jemaa et al., 2013) | Chromosome misalignment and missegregation | Cervical cancer (Jemaa et al., 2013) | |
| Failure in recruitment of Bub1 and BubR1 | ||||
| Mps BAY2a | 1 nM (Jemaa et al., 2013) | Increased centrosome number | ||
| Aberrant cytokinesis | ||||
| Hyperploidy | ||||
| Apoptosis (Jemaa et al., 2013) | ||||
| Mps1‐IN‐1 | 367 nM (Kwiatkowski et al., 2010) | Failure in recruitment of Mad1 and Mad2 | ||
| SAC bypass | ||||
| Short mitotic duration | ||||
| Mps1‐IN‐2 | 145 nM (Kwiatkowski et al., 2010) | Apoptosis (Kwiatkowski et al., 2010). | ||
| Mps1‐IN‐3 | 50 nM (Tannous et al., 2013) | SAC bypass (Tannous et al., 2013) | Glioma (Tannous et al., 2013) | |
| NMS‐P715 | 8 nM (Colombo et al., 2010) | Failure in recruitment of Mad1, Mad2, Bub1 and Bub3 (Colombo et al., 2010) | Melanoma (Colombo et al., 2010) | |
| SAC bypass (Slee et al., 2014) | ||||
| Short mitotic duration (Colombo et al., 2010; Gurden et al., 2015) | ||||
| Apoptosis (Colombo et al., 2010; Slee et al., 2014; Maachani et al., 2015). | ||||
| NTRC 0066‐0 | 0.6 nM (Maia et al., 2015) | Chromosome missegregation | Breast cancer (Maia et al., 2015) | |
| Short mitotic duration (Maia et al., 2015) | ||||
| Reversine | 3 nM (Santaguida et al., 2010) | Chromosome misalignment (Santaguida et al., 2010; Dou et al., 2015) | ||
| Failure in recruitment of Mad1, Bub1, BubR1 and Rod‐Zw10‐Zwilch (Santaguida et al., 2010) | ||||
| Defect in MCC assembly (Tipton et al., 2013) | ||||
| Short mitotic duration (Santaguida et al., 2010) | ||||
| Hyperploidy (Jemaa et al., 2012a) | ||||
| Apoptosis (Jemaa et al., 2012a; Jemaa et al., 2016) | ||||
| SP600125 | 692 nM (Schmidt et al., 2005) | Failure in BubR1 recruitment (Schmidt et al., 2005) | ||
| SAC bypass (Schmidt et al., 2005) | ||||
| Apoptosis (Jemaa et al., 2012b) |
The difference between the other Mps1 inhibitors and TC Mps1 12 are their respective effects on polyploidy and centrosome number. For example, reversine (Jemaa et al., 2012a), Mps BAY1, Mps BAY2a (Jemaa et al., 2013) and MPI‐0479605 (Tardif et al., 2011) cause consecutive series of aborted mitosis and subsequently increase hyperploidy, including the formation of 8 N and 16 N DNA. However, we did not observe significant polyploidy in TC Mps1 12‐treated cells using flow cytometry (data not shown). This may be due to the slow doubling time of HepG2 and Hep3B cells: 48 and 25 h respectively (Sagmeister et al., 2008). If we had exposed the cells to TC Mps1 12 for more than 72 h, we may have detected hyperploidy. Also, the effect on centrosome number is dependent on the type of Mps1 inhibitor. TC Mps1 12 induces the formation of multipolar spindles and increases centrosome number (Figure 4B), and Mps BAY1 and Mps BAY2a also enhance centrosome number (Jemaa et al., 2013). In contrast, although Mps1‐IN‐1 itself does not affect centrosome duplication, it does induce multipolar centrosomes, but only in cells with an overexpression of PLK4 (Kwiatkowski et al., 2010). Overall, these differences might be dependent on the specificity of the Mps1 inhibitors.
We demonstrated that TC Mps1 12 has an inhibitory effect on the growth of HepG2 and Hep3B cells in vitro. Growth inhibition was more pronounced in Hep3B (p53‐null) cells than in HepG2 (p53‐wild type) cells. The dependency of Mps1 inhibitors on p53 is supported by previous findings using colon cancer cells. For example, SP600125 induces hyperploidy and apoptosis in p53‐deficient HCT116 colon cancer cells (Jemaa et al., 2012b) and inhibits the growth of p53‐deficient HCT116 xenografts, but not that of p53‐proficient xenografts (Jemaa et al., 2012b). Reversine aggravates hyperpolyploidy and apoptosis more in p53‐deficient HCT116 cells than in p53‐proficient HCT116 cells (Jemaa et al., 2012a). MPI‐0479605 had a more marked effect on apoptosis in p53‐deficient Colo‐205 colon cancer cells than in p53‐proficient HCT116 cells (Tardif et al., 2011). In fact, Mps1‐mediated phosphorylation of p53 at Thr 18 stabilizes p53 and mediates the post‐mitotic checkpoint. The failure of p53 phosphorylation in Mps1‐siRNA‐transfected cells induces polyploidy (Huang et al., 2009). However, the apoptotic effects of Mps BAY1 and Mps BAY2a are greater in p53‐proficient HCT116 cells than in p53‐null HCT116 cells (Jemaa et al., 2013). The relevance of p53 to Mps1 inhibitor‐induced cell death needs to be examined in the context of each drug and cell type.
The anti‐cancer effects of Mps1 inhibitor are improved by combining it with a microtubule poison (anti‐mitotic drug). A reduction in Mps1 protein levels sensitizes cancer cells to vincristine or taxol (Janssen et al., 2009; Tannous et al., 2013). In addition, chemical inhibition of Mps1 activity using SP600125 (Gyorffy et al., 2014), BAY 1217389, BAY 1161909 (Wengner et al., 2016), Mps1‐IN‐3 (Tannous et al., 2013), Mps BAY1 or Mps BAY2a (Jemaa et al., 2013) showed synergistic effects in terms of cell death and growth inhibition when tested in tumour xenografts in combination with vincristine or paclitaxel. Overall, the data presented herein suggest that the use of pharmacological inhibitors to prevent the mitotic function of Mps1 may be an effective anti‐cancer approach.
Author contributions
M.C. and Y.H.M. performed the experiments and analysed the data. J.H.P. analysed gene expression array. C.W.L. and C.Y.J. wrote the manuscript. M.C. and J.E.K. designed the study and wrote the manuscript.
Conflict of interest
The authors declare no conflicts of interest.
Declaration of transparency and scientific rigour
This Declaration acknowledges that this paper adheres to the principles for transparent reporting and scientific rigour of preclinical research recommended by funding agencies, publishers and other organisations engaged with supporting research.
Acknowledgements
This research was supported by Basic Science Research Program through the National Research Foundation of Korea (NRF) funded by the Ministry of Science, ICT and Future Planning (2015R1A2A2A01007438).
Choi, M. , Min, Y. H. , Pyo, J. , Lee, C.‐W. , Jang, C.‐Y. , and Kim, J.‐E. (2017) TC Mps1 12, a novel Mps1 inhibitor, suppresses the growth of hepatocellular carcinoma cells via the accumulation of chromosomal instability. British Journal of Pharmacology, 174: 1810–1825. doi: 10.1111/bph.13782.
References
- Alexander SP, Fabbro D, Kelly E, Marrion N, Peters JA, Benson HE et al. (2015a). The Concise Guide to PHARMACOLOGY 2015/16: enzymes. Br J Pharmacol 172: 6024–6109. [DOI] [PMC free article] [PubMed] [Google Scholar]
- Alexander SP, Kelly E, Marrion N, Peters JA, Benson HE, Faccenda E et al. (2015b). The Concise Guide to PHARMACOLOGY 2015/16: overview. Br J Pharmacol 172: 5729–5743. [DOI] [PMC free article] [PubMed] [Google Scholar]
- Choi M, Kim W, Cheon MG, Lee CW, Kim JE (2015). Polo‐like kinase 1 inhibitor BI2536 causes mitotic catastrophe following activation of the spindle assembly checkpoint in non‐small cell lung cancer cells. Cancer Lett 357: 591–601. [DOI] [PubMed] [Google Scholar]
- Colombo R, Caldarelli M, Mennecozzi M, Giorgini ML, Sola F, Cappella P et al. (2010). Targeting the mitotic checkpoint for cancer therapy with NMS‐P715, an inhibitor of MPS1 kinase. Cancer Res 70: 10255–10264. [DOI] [PubMed] [Google Scholar]
- Curtis MJ, Bond RA, Spina D, Ahluwalia A, Alexander SP, Giembycz MA et al. (2015). Experimental design and analysis and their reporting: new guidance for publication in BJP. Br J Pharmacol 172: 3461–3471. [DOI] [PMC free article] [PubMed] [Google Scholar]
- Daniel J, Coulter J, Woo JH, Wilsbach K, Gabrielson E (2011). High levels of the Mps1 checkpoint protein are protective of aneuploidy in breast cancer cells. Proc Natl Acad Sci U S A 108: 5384–5389. [DOI] [PMC free article] [PubMed] [Google Scholar]
- Dominguez‐Brauer C, Thu KL, Mason JM, Blaser H, Bray MR, Mak TW (2015). Targeting mitosis in cancer: emerging strategies. Mol Cell 60: 524–536. [DOI] [PubMed] [Google Scholar]
- Dou Z, Liu X, Wang W, Zhu T, Wang X, Xu L et al. (2015). Dynamic localization of Mps1 kinase to kinetochores is essential for accurate spindle microtubule attachment. Proc Natl Acad Sci U S A 112: E4546–E4555. [DOI] [PMC free article] [PubMed] [Google Scholar]
- Dou Z, Sawagechi A, Zhang J, Luo H, Brako L, Yao XB (2003). Dynamic distribution of TTK in HeLa cells: insights from an ultrastructural study. Cell Res 13: 443–449. [DOI] [PubMed] [Google Scholar]
- Fisk HA, Mattison CP, Winey M (2003). Human Mps1 protein kinase is required for centrosome duplication and normal mitotic progression. Proc Natl Acad Sci U S A 100: 14875–14880. [DOI] [PMC free article] [PubMed] [Google Scholar]
- Gurden MD, Westwood IM, Faisal A, Naud S, Cheung KM, McAndrew C et al. (2015). Naturally occurring mutations in the MPS1 gene predispose cells to kinase inhibitor drug resistance. Cancer Res 75: 3340–3354. [DOI] [PubMed] [Google Scholar]
- Gyorffy B, Bottai G, Lehmann‐Che J, Keri G, Orfi L, Iwamoto T et al. (2014). TP53 mutation‐correlated genes predict the risk of tumor relapse and identify MPS1 as a potential therapeutic kinase in TP53‐mutated breast cancers. Mol Oncol 8: 508–519. [DOI] [PMC free article] [PubMed] [Google Scholar]
- Hewitt L, Tighe A, Santaguida S, White AM, Jones CD, Musacchio A et al. (2010). Sustained Mps1 activity is required in mitosis to recruit O‐Mad2 to the Mad1‐C‐Mad2 core complex. J Cell Biol 190: 25–34. [DOI] [PMC free article] [PubMed] [Google Scholar]
- Huang H, Hittle J, Zappacosta F, Annan RS, Hershko A, Yen TJ (2008). Phosphorylation sites in BubR1 that regulate kinetochore attachment, tension, and mitotic exit. J Cell Biol 183: 667–680. [DOI] [PMC free article] [PubMed] [Google Scholar]
- Huang YF, Chang MD, Shieh SY (2009). TTK/hMps1 mediates the p53‐dependent postmitotic checkpoint by phosphorylating p53 at THR18. Mol Cell Biol 29: 2935–2944. [DOI] [PMC free article] [PubMed] [Google Scholar]
- Janssen A, Kops GJ, Medema RH (2009). Elevating the frequency of chromosome mis‐segregation as a strategy to kill tumor cells. Proc Natl Acad Sci U S A 106: 19108–19113. [DOI] [PMC free article] [PubMed] [Google Scholar]
- Jelluma N, Brenkman AB, van den Broek NJ, Cruijsen CW, van Osch MH, Lens SM et al. (2008). Mps1 phosphorylates Borealin to control Aurora B activity and chromosome alignment. Cell 132: 233–246. [DOI] [PubMed] [Google Scholar]
- Jemaa M, Galluzzi L, Kepp O, Boileve A, Lissa D, Senovilla L et al. (2012a). Preferential killing of p53‐deficient cancer cells by reversine. Cell Cycle 11: 2149–2158. [DOI] [PubMed] [Google Scholar]
- Jemaa M, Galluzzi L, Kepp O, Senovilla L, Brands M, Boemer U et al. (2013). Characterization of novel MPS1 inhibitors with preclinical anticancer activity. Cell Death Differ 20: 1532–1545. [DOI] [PMC free article] [PubMed] [Google Scholar]
- Jemaa M, Manic G, Lledo G, Lissa D, Reynes C, Morin N et al. (2016). Whole‐genome duplication increases tumor cell sensitivity to MPS1 inhibition. Oncotarget 7: 885–901. [DOI] [PMC free article] [PubMed] [Google Scholar]
- Jemaa M, Vitale I, Kepp O, Berardinelli F, Galluzzi L, Senovilla L et al. (2012b). Selective killing of p53‐deficient cancer cells by SP600125. EMBO Mol Med 4: 500–514. [DOI] [PMC free article] [PubMed] [Google Scholar]
- Kemmler S, Stach M, Knapp M, Ortiz J, Pfannstiel J, Ruppert T et al. (2009). Mimicking Ndc80 phosphorylation triggers spindle assembly checkpoint signalling. EMBO J 28: 1099–1110. [DOI] [PMC free article] [PubMed] [Google Scholar]
- Kusakabe K, Ide N, Daigo Y, Itoh T, Higashino K, Okano Y et al. (2012). Diaminopyridine‐based potent and selective mps1 kinase inhibitors binding to an unusual flipped‐peptide conformation. ACS Med Chem Lett 3: 560–564. [DOI] [PMC free article] [PubMed] [Google Scholar]
- Kwiatkowski N, Jelluma N, Filippakopoulos P, Soundararajan M, Manak MS, Kwon M et al. (2010). Small‐molecule kinase inhibitors provide insight into Mps1 cell cycle function. Nat Chem Biol 6: 359–368. [DOI] [PMC free article] [PubMed] [Google Scholar]
- Landi MT, Dracheva T, Rotunno M, Figueroa JD, Liu H, Dasgupta A et al. (2008). Gene expression signature of cigarette smoking and its role in lung adenocarcinoma development and survival. PLoS One 3: e1651. [DOI] [PMC free article] [PubMed] [Google Scholar]
- Lauze E, Stoelcker B, Luca FC, Weiss E, Schutz AR, Winey M (1995). Yeast spindle pole body duplication gene MPS1 encodes an essential dual specificity protein kinase. EMBO J 14: 1655–1663. [DOI] [PMC free article] [PubMed] [Google Scholar]
- Liang XD, Dai YC, Li ZY, Gan MF, Zhang SR, Yin P et al. (2014). Expression and function analysis of mitotic checkpoint genes identifies TTK as a potential therapeutic target for human hepatocellular carcinoma. PLoS One 9: e97739. [DOI] [PMC free article] [PubMed] [Google Scholar]
- Liu ST, Chan GK, Hittle JC, Fujii G, Lees E, Yen TJ (2003). Human MPS1 kinase is required for mitotic arrest induced by the loss of CENP‐E from kinetochores. Mol Biol Cell 14: 1638–1651. [DOI] [PMC free article] [PubMed] [Google Scholar]
- Liu X, Liao W, Yuan Q, Ou Y, Huang J (2015). TTK activates Akt and promotes proliferation and migration of hepatocellular carcinoma cells. Oncotarget 6: 34309–34320. [DOI] [PMC free article] [PubMed] [Google Scholar]
- Liu X, Winey M (2012). The MPS1 family of protein kinases. Annu Rev Biochem 81: 561–585. [DOI] [PMC free article] [PubMed] [Google Scholar]
- Liu Y, Laufer R, Patel NK, Ng G, Sampson PB, Li SW et al. (2016). Discovery of pyrazolo[1,5‐a]pyrimidine TTK Inhibitors: CFI‐402257 is a potent, selective, bioavailable anticancer agent. ACS Med Chem Lett 7: 671–675. [DOI] [PMC free article] [PubMed] [Google Scholar]
- Maachani UB, Kramp T, Hanson R, Zhao S, Celiku O, Shankavaram U et al. (2015). Targeting MPS1 enhances radiosensitization of human glioblastoma by modulating DNA repair proteins. Mol Cancer Res 13: 852–862. [DOI] [PMC free article] [PubMed] [Google Scholar]
- Maia AR, de Man J, Boon U, Janssen A, Song JY, Omerzu M et al. (2015). Inhibition of the spindle assembly checkpoint kinase TTK enhances the efficacy of docetaxel in a triple‐negative breast cancer model. Ann Oncol 26: 2180–2192. [DOI] [PubMed] [Google Scholar]
- Maire V, Baldeyron C, Richardson M, Tesson B, Vincent‐Salomon A, Gravier E et al. (2013). TTK/hMPS1 is an attractive therapeutic target for triple‐negative breast cancer. PLoS One 8: e63712. [DOI] [PMC free article] [PubMed] [Google Scholar]
- Martin‐Lluesma S, Stucke VM, Nigg EA (2002). Role of Hec1 in spindle checkpoint signaling and kinetochore recruitment of Mad1/Mad2. Science 297: 2267–2270. [DOI] [PubMed] [Google Scholar]
- Mattison CP, Old WM, Steiner E, Huneycutt BJ, Resing KA, Ahn NG et al. (2007). Mps1 activation loop autophosphorylation enhances kinase activity. J Biol Chem 282: 30553–30561. [DOI] [PubMed] [Google Scholar]
- Miao R, Wu Y, Zhang H, Zhou H, Sun X, Csizmadia E et al. (2016). Utility of the dual‐specificity protein kinase TTK as a therapeutic target for intrahepatic spread of liver cancer. Sci Rep 6: 33121. [DOI] [PMC free article] [PubMed] [Google Scholar]
- Musacchio A (2015). The molecular biology of spindle assembly checkpoint signaling dynamics. Curr Biol 25: R1002–R1018. [DOI] [PubMed] [Google Scholar]
- Niittymaki I, Gylfe A, Laine L, Laakso M, Lehtonen HJ, Kondelin J et al. (2011). High frequency of TTK mutations in microsatellite‐unstable colorectal cancer and evaluation of their effect on spindle assembly checkpoint. Carcinogenesis 32: 305–311. [DOI] [PubMed] [Google Scholar]
- Sagmeister S, Eisenbauer M, Pirker C, Mohr T, Holzmann K, Zwickl H et al. (2008). New cellular tools reveal complex epithelial–mesenchymal interactions in hepatocarcinogenesis. Br J Cancer 99: 151–159. [DOI] [PMC free article] [PubMed] [Google Scholar]
- Salvatore G, Nappi TC, Salerno P, Jiang Y, Garbi C, Ugolini C et al. (2007). A cell proliferation and chromosomal instability signature in anaplastic thyroid carcinoma. Cancer Res 67: 10148–10158. [DOI] [PubMed] [Google Scholar]
- Santaguida S, Tighe A, D'Alise AM, Taylor SS, Musacchio A (2010). Dissecting the role of MPS1 in chromosome biorientation and the spindle checkpoint through the small molecule inhibitor reversine. J Cell Biol 190: 73–87. [DOI] [PMC free article] [PubMed] [Google Scholar]
- Saurin AT, van der Waal MS, Medema RH, Lens SM, Kops GJ (2011). Aurora B potentiates Mps1 activation to ensure rapid checkpoint establishment at the onset of mitosis. Nat Commun 2: 316. [DOI] [PMC free article] [PubMed] [Google Scholar]
- Schmidt M, Budirahardja Y, Klompmaker R, Medema RH (2005). Ablation of the spindle assembly checkpoint by a compound targeting Mps1. EMBO Rep 6: 866–872. [DOI] [PMC free article] [PubMed] [Google Scholar]
- Shimogawa MM, Graczyk B, Gardner MK, Francis SE, White EA, Ess M et al. (2006). Mps1 phosphorylation of Dam1 couples kinetochores to microtubule plus ends at metaphase. Curr Biol 16: 1489–1501. [DOI] [PMC free article] [PubMed] [Google Scholar]
- Slee RB, Grimes BR, Bansal R, Gore J, Blackburn C, Brown L et al. (2014). Selective inhibition of pancreatic ductal adenocarcinoma cell growth by the mitotic MPS1 kinase inhibitor NMS‐P715. Mol Cancer Ther 13: 307–315. [DOI] [PMC free article] [PubMed] [Google Scholar]
- Southan C, Sharman JL, Benson HE, Faccenda E, Pawson AJ, Alexander SP et al. (2016). The IUPHAR/BPS Guide to PHARMACOLOGY in 2016: towards curated quantitative interactions between 1300 protein targets and 6000 ligands. Nucleic Acids Res 44: D1054–D1068. [DOI] [PMC free article] [PubMed] [Google Scholar]
- Stucke VM, Baumann C, Nigg EA (2004). Kinetochore localization and microtubule interaction of the human spindle checkpoint kinase Mps1. Chromosoma 113: 1–15. [DOI] [PubMed] [Google Scholar]
- Sun T, Yang X, Wang W, Zhang X, Xu Q, Zhu S et al. (2010). Cellular abundance of Mps1 and the role of its carboxyl terminal tail in substrate recruitment. J Biol Chem 285: 38730–38739. [DOI] [PMC free article] [PubMed] [Google Scholar]
- Tannous BA, Kerami M, Van der Stoop PM, Kwiatkowski N, Wang J, Zhou W et al. (2013). Effects of the selective MPS1 inhibitor MPS1‐IN‐3 on glioblastoma sensitivity to antimitotic drugs. J Natl Cancer Inst 105: 1322–1331. [DOI] [PMC free article] [PubMed] [Google Scholar]
- Tardif KD, Rogers A, Cassiano J, Roth BL, Cimbora DM, McKinnon R et al. (2011). Characterization of the cellular and antitumor effects of MPI‐0479605, a small‐molecule inhibitor of the mitotic kinase Mps1. Mol Cancer Ther 10: 2267–2275. [DOI] [PubMed] [Google Scholar]
- Tipton AR, Ji W, Sturt‐Gillespie B, Bekier ME 2nd, Wang K, Taylor WR et al. (2013). Monopolar spindle 1 (MPS1) kinase promotes production of closed MAD2 (C‐MAD2) conformer and assembly of the mitotic checkpoint complex. J Biol Chem 288: 35149–35158. [DOI] [PMC free article] [PubMed] [Google Scholar]
- van der Waal MS, Saurin AT, Vromans MJ, Vleugel M, Wurzenberger C, Gerlich DW et al. (2012). Mps1 promotes rapid centromere accumulation of Aurora B. EMBO Rep 13: 847–854. [DOI] [PMC free article] [PubMed] [Google Scholar]
- Wengner AM, Siemeister G, Koppitz M, Schulze V, Kosemund D, Klar U et al. (2016). Novel Mps1 kinase inhibitors with potent antitumor activity. Mol Cancer Ther 15: 583–592. [DOI] [PubMed] [Google Scholar]
- Winey M, Goetsch L, Baum P, Byers B (1991). MPS1 and MPS2: novel yeast genes defining distinct steps of spindle pole body duplication. J Cell Biol 114: 745–754. [DOI] [PMC free article] [PubMed] [Google Scholar]
- Yamagishi Y, Yang CH, Tanno Y, Watanabe Y (2012). MPS1/Mph1 phosphorylates the kinetochore protein KNL1/Spc7 to recruit SAC components. Nat Cell Biol 14: 746–752. [DOI] [PubMed] [Google Scholar]
- Yuan B, Xu Y, Woo JH, Wang Y, Bae YK, Yoon DS et al. (2006). Increased expression of mitotic checkpoint genes in breast cancer cells with chromosomal instability. Clin Cancer Res 12: 405–410. [DOI] [PubMed] [Google Scholar]
- Zhang J, Chong CC, Chen GG, Lai PB (2015). A seven‐nnnRNA expression signature predicts survival in hepatocellular carcinoma. PLoS One 10: e0128628. [DOI] [PMC free article] [PubMed] [Google Scholar]
- Zich J, Sochaj AM, Syred HM, Milne L, Cook AG, Ohkura H et al. (2012). Kinase activity of fission yeast Mph1 is required for Mad2 and Mad3 to stably bind the anaphase promoting complex. Curr Biol 22: 296–301. [DOI] [PMC free article] [PubMed] [Google Scholar]