

ABSTRACT
A defining characteristic of alphaherpesviruses is the establishment of lifelong latency in host sensory ganglia with occasional reactivation causing recurrent lytic infections. As an alternative to rodent models, we explored the use of an immortalized cell line derived from human dorsal root ganglia. HD10.6 cells proliferate by virtue of a transduced tetracycline-regulated v-myc oncogene. In the presence of doxycycline, HD10.6 cells mature to exhibit neuronal morphology and express sensory neuron-associated markers such as neurotrophin receptors TrkA, TrkB, TrkC, and RET and the sensory neurofilament peripherin. Infection of mature HD10.6 neurons by herpes simplex virus 1 (HSV-1) results in a delayed but productive infection. However, infection at a low multiplicity of infection (MOI) in the presence of acyclovir results in a quiescent infection resembling latency in which viral genomes are retained in a low number of neurons, viral gene expression is minimal, and infectious virus is not released. At least some of the quiescent viral genomes retain the capacity to reactivate, resulting in viral DNA replication and release of infectious virus. Reactivation can be induced by depletion of nerve growth factor; other commonly used reactivation stimuli have no significant effect.
IMPORTANCE Infections by herpes simplex viruses (HSV) cause painful cold sores or genital lesions in many people; less often, they affect the eye or even the brain. After the initial infection, the virus remains inactive or latent in nerve cells that sense the region where that infection occurred. To learn how virus maintains and reactivates from latency, studies are done in neurons taken from rodents or in whole animals to preserve the full context of infection. However, some cellular mechanisms involved in HSV infection in rodents are different from those in humans. We describe the use of a human cell line that has the properties of a sensory neuron. HSV infection in these cultured cells shows the properties expected for a latent infection, including reactivation to produce newly infectious virus. Thus, we now have a cell culture model for latency that is derived from the normal host for this virus.
KEYWORDS: HSV-1, quiescent infection, sensory neurons
INTRODUCTION
Herpesviruses are unusual among viruses in that they employ two infection strategies, lytic (replicative or productive) infection and latency (quiescent) infection. Alphaherpesviruses typically replicate in epithelial cells and establish latency in the peripheral nervous system within the sensory neurons of the ganglia that innervate mucosa of the primary infection site (1), such as the trigeminal ganglia (TG) and dorsal root ganglia (DRG). Operationally, latency is defined as “the persistence of a viral genome within tissue where, at any given time, there is a population of cells that lack detectable infectious virus, viral proteins, or viral lytic transcripts that are dormant but have the capability of being reactivated” (2). During latency of herpes simplex viruses (HSV), the viral genome persists as a transcriptionally repressed episome (in contrast to the actively transcribed state seen during lytic replication), with the notable exception of the latency-associated transcript (LAT), which is processed into regulatory RNAs important in maintaining HSV latency (3–7).
In vivo animal models for HSV can recapitulate the general infection cycle of the virus while maintaining the complex anatomical and immunological context for lytic and latent infection strategies. Mouse models, with their amendable genetics, have proven valuable in studying acute infection and latency of herpes simplex virus 1 (HSV-1) (8–11). Rabbit and guinea pig models have been used to better understand recurrent lesions and to assess efficacy of antiviral therapies (2).
As a complement to in vivo models, cell culture models offer several general advantages, including consistency, reproducibility, and cost-effectiveness. Genetic or chemical manipulation of gene expression or protein activities in tissue and cell culture can yield insights into the molecular mechanisms underlying latency establishment, maintenance, and reactivation (12–14). Notably, rodent ganglion culture models have been employed to study HSV latency and reactivation (13, 15–18). But because rodents are not the natural host in which HSV coevolved (19), molecular mechanisms in those animals or cells may be subtly different from those in humans. For example, molecular differences in rodent protein Oct-1 diminish its affinity for viral protein 16 (VP16) relative to human Oct-1 (20); this interaction is critical for immediate-early (IE) gene expression and may contribute to latency establishment (21–23).
Several approaches have been advanced for studying HSV infection in human neuron-like cells in culture, including the use of human neuroblastoma cell lines (24–26) and of a differentiated human embryonal carcinoma cell line (27, 28). In addition, human neurons derived from induced pluripotent stem cells (iPSCs) (29), neuronal stem cells (30), and embryonic stem cells (ESCs) (31, 32) have been explored as infection models for human alphaherpesvirus. While these human cells support HSV productive infection (24, 27–29, 31), reliable models to study the establishment of latency and/or reactivation have not been achieved using these human cells.
Neuronal diversity may play a role in HSV tropism for establishing latency; therefore, characterization of neuronal culture models is warranted. Sensory neurons are broadly classified on the basis of function and neurotrophin receptor expression characteristics (33, 34) as proprioceptive (TrkC-expressing [TrkC+]), mechanoreceptive (TrkB+ and/or TrkC+), and nociceptive (TrkA+) neurons (35). Even among the small-diameter nociceptive neurons, in which HSV latency predominantly occurs (36), functionally distinct subpopulations exist, including TrkA+ peptidergic neurons and Ret+ nonpeptidergic neurons that have lost TrkA signaling (35, 37, 38). Furthermore, the composition of sensory neuronal subtypes can vary depending on the anatomical location of the ganglia (35), the developmental age (39), and the species (36, 39–41).
In rodent TG models, HSV-1 has shown a preference for establishing latency in A5-immunoreactive nociceptive neurons (which express the receptor TrkA and/or calcitonin gene-related peptide [CGRP]), whereas herpes simplex virus 2 (HSV-2) has shown a preference for KH10-immunoreactive nociceptive neurons (which express the Ret receptor and respond to glial-cell-derived neurotrophic factor [GDNF]) (17, 42–44). Neuronal diversity may also play a role in reactivation from latency. Disruption of TrkA signaling, by blocking or withdrawing the receptor's neurotrophin nerve growth factor (NGF) or by inhibiting downstream phosphatidylinositol 3-kinase (PI3K)/AKT/mTOR signaling, induces reactivation in nonhuman models (13, 16, 45). It is unclear, however, whether these patterns of HSV latency establishment or reactivation hold true for human sensory neurons. In one human autopsy study of TG, HSV-1 LAT colocalized with Ret+ or CGRP+ neurons by in situ hybridization (ISH) at a frequency that mirrored the population makeup of these nociceptive neurons, but no positive correlation was found for TrkA+ neurons (36).
The goal of this project is to establish a human neuronal cell culture model of HSV infection in which the molecular mechanisms involved in latency maintenance and reactivation (such as stress response, transcription factors, chromatin modifying enzymes, etc.) can be examined. For this purpose, we evaluated the use of an immortalized human DRG cell line designated HD10.6, first described in 1999 by Raymon and colleagues (46). To our knowledge, this is the only established human sensory neuron cell line that is currently available, but the cell line has not been utilized since it was initially isolated and described.
HD10.6 cells proliferate in a committed sensory neuronal progenitor state by means of a tetracycline (off)-regulated v-myc oncogene (46). In the presence of doxycycline, HD10.6 cells mature to exhibit a sensory neuron-associated phenotype on the basis of positive staining for neuronal cytoskeletal markers, expression of neuron-associated transcription factors, firing of action potentials, and capsaicin sensitivity (46). By infecting matured HD10.6 cells in the presence of acyclovir, we are able to describe a human cell culture model that exhibits experimental hallmarks of HSV-1 latency (15, 17, 18, 32, 47), including the presence of nonproductive viral genomes that retain the potential to reactivate and produce infectious virus. This model will enable the genetic and biochemical analysis of the molecular mechanisms of alphaherpesvirus latency and reactivation in human sensory neurons.
RESULTS
HD10.6 cells mature into sensory neurons.
Since the HD10.6 cell line was initially derived about 20 years ago, conditions and media for neuronal cell culture have improved significantly. Therefore, we modified the growth conditions for the expansion and the maturation of HD10.6 cells using commercially available products (see Materials and Methods for details). We first used ATCC's cell line authentication service to perform short tandem repeat (STR) profiling of HD10.6 cells (data not shown). The profile was confirmed as human male, with no match to any existing profile in the ATCC or DSMZ STR databases. We then confirmed that HD10.6 cells consistently mature to adopt a sensory neuron-associated phenotype as originally reported (46). HD10.6 cells were seeded in proliferation media on cell culture plates or glass coverslips coated with 2% Matrigel and 10 μg/ml poly-d-lysine (PDL). Tetracycline-regulated v-myc transgene expression was suppressed by switching to complete maturation medium containing 1 μg/ml doxycycline 24 h after plating. The suppression of proliferation and addition of neurotrophins support maturation of the cell line. Proliferating HD10.6 cells appear relatively flat with two to three short projections, but after treatment with doxycycline, HD10.6 cells take on a neuronal morphology that includes oval cell bodies and multiple long axon-like projections (Fig. 1).
FIG 1.

Doxycycline drives morphology change in HD10.6 cells. Bright-field microscopy images of HD10.6 cells maturing on Matrigel and poly-d-lysine are shown. Proliferation medium was changed to maturation medium containing 1 μg/ml doxycycline 1 day after plating. Images were taken 1, 3, or 7 days after plating. Bar, 50 μm.
To characterize the neuronal phenotype of matured HD10.6 cells, we tested the expression of several neuron-specific proteins. Using indirect immunofluorescence, we detected a strong signal for a neuron-specific filament, β-III tubulin, as early as day 1 and throughout maturation (day 7 and day 14), whereas only faint nuclear expression of the glial cell intermediate filament protein, glial fibrillary acidic protein (GFAP), was detected (Fig. 2a). Using immunoblots, we confirmed that maturing HD10.6 cells induce protein expression of β-III tubulin at levels comparable to those seen in differentiating human neuroblastoma cells (SH-SY5Y) but that maturing HD10.6 cells do not express GFAP to levels seen in primary mouse astrocytes (Fig. 2c). We concluded that HD10.6 cells express filament proteins characteristic of neurons rather than of neuron-support cells. We then asked whether HD10.6 cells possess neuronal progenitor qualities or are committed to a neuron-specific lineage. We detected low levels of the neuronal progenitor marker nestin in maturing HD10.6 cells, similar to the results seen with differentiated SH-SY5Y cells (Fig. 2b), suggesting that HD10.6 cells are fate restricted to a neuronal lineage. We confirmed peripheral sensory neuron specificity by detecting a robust induction of peripherin (PRHN), a sensory neuron-specific filament, by both immunofluorescence and immunoblot analysis (Fig. 2b and c). The conclusions based on protein expression levels were reinforced by measurements of mRNA levels, where we observed by quantitative reverse transcription-PCR (RT-qPCR) that β-III tubulin and peripherin mRNA expression was robustly induced throughout HD10.6 maturation compared to the results seen with differentiated SH-SY5Y cells which are already neuronal but are not sensory neuron specific (Fig. 2d).
FIG 2.

HD10.6 cells are committed to a sensory neuron-associated phenotype (SNAP). (a and b) Human SH-SY5Y neuroblastoma cells were differentiated with retinoic acid (dSH-SY5Y) as a positive control for neuronal protein expression. Maturing HD10.6 cells (day 1, 7, or 14) were stained for neuronal lineage markers using immunofluorescent methods. (a) The top panel shows merged microscopy images for neuronal filament β-III tubulin (βIIItub; green), glial fibrillary protein (GFAP; red), and DAPI (blue). Below each merged image are images of separate green and red channels (for β-III tubulin and GFAP, respectively) which have been enlarged from the area denoted by the white box. (b) The top panel shows merged microscopy images for neuronal progenitor marker nestin (green), peripherin (PRHN; red), and DAPI (blue). Below each merged image are separate green and red channels (for nestin and PRHN, respectively) which have been enlarged from the area denoted by the white box. (c) Expression of neuronal lineage markers β-III tubulin and PRHN, GFAP, and actin (as a loading control) was assessed by immunoblot analysis. Samples include immortalized human foreskin fibroblasts (HFF), mouse primary astrocytes (mA), human SH-SY5Y neuroblastoma cells (SH), retinoic acid-differentiated neuroblastoma cells (dSH), and maturing HD10.6 cells collected on day 1 (D1), day 7 (D7), or day 14 (D14). (d) mRNA expression for β-III tubulin and peripherin was assayed by RT-qPCR for SH-SY5Y, dSH-SY5Y, and maturing HD10.6 cells on D1, D7, or D14; the graph reports the fold change in mRNA expression relative to HD10.6 D1 (mean and standard deviation from 3 experiments).
These data demonstrate that HD10.6 cells are committed to a neuron-specific pathway even before doxycycline treatment inhibits v-myc expression and proliferation ceases. For this reason, we use the term “maturing” rather than “differentiating,” because the latter suggests a process in which different lineages can be derived from a pluripotent cell. We conclude that under the growth conditions used here, HD10.6 cells are committed to a sensory neuron-associated phenotype (SNAP).
SNAP cells express multiple neurotrophin receptors.
Ganglia are not homogenous populations of neurons. Most neurons within sensory ganglia have a small-diameter nociceptive phenotype, with a smaller proportion having a larger-diameter mechanoreceptive or proprioceptive phenotype (35). In adults, nociceptive neurons are thought to be polymodal, and distinct subpopulations exist (37). These distinct subtypes may play a role in neuronal permissiveness with respect to HSV latency (17, 44). We therefore asked whether maturation of HD10.6 cells in culture resulted in subpopulations of sensory neurons. Using immunofluorescence to examine cells at day 1, 7, or 14 of maturation, we observed expression of each of the neurotrophin receptors TrkA, TrkB, TrkC, and Ret in nearly all of the cells (Fig. 3a). Immunoblot analysis revealed that TrkA receptor expression was induced during maturation following doxycycline treatment (Fig. 3b). Gene expression of the four neurotrophin receptors was also assayed by qRT-PCR throughout maturation. TrkA, TrkB, and Ret were robustly induced in SNAP cells, whereas TrkC receptor transcription was induced only transiently at day 7 (Fig. 3c). We conclude that under the conditions of our neuronal culture protocol, HD10.6 and SNAP cells express receptors for multiple neurotrophins and do not represent a distinct subpopulation of sensory neurons.
FIG 3.

SNAP cells express neurotrophin receptors TrkA, TrkB, TrkC, and RET. (a) Maturing HD10.6 cells were stained for neurotrophin receptors using immunofluorescence. Differentiated neuroblastoma cells (dSH-SY5Y) were included as controls. Each row shows expression of a single neurotrophin receptor (red) merged with DAPI (blue). (b) Expression of TrkA receptor and actin (as a loading control) was assessed by immunoblot analysis. Samples include immortalized human foreskin fibroblasts (HFF), mouse primary astrocytes (mA), human SH-SY5Y neuroblastoma cells (SH), retinoic acid-differentiated neuroblastoma cells (dSH), and maturing HD10.6 cells collected on day 1 (D1), day 7 (D7), or day 14 (D14). (c) mRNA expression of TrkA, TrkB, TrkC, and RET was assayed by RT-qPCR for SH-SY5Y, dSH-SY5Y, and maturing HD10.6 cells on day 1 (D1), D7, or D14; the graph reports the fold change in mRNA expression relative to HD10.6 D1 (mean and standard deviation from 3 experiments).
Establishing HSV-1 latency in SNAP cells.
We next asked whether we could latently infect SNAP cells with HSV-1. HD10.6 cells were seeded and then matured according to the protocol described above. On day 7 of maturation, SNAP cells were infected with one of several HSV-1 strains at a relatively low multiplicity of infection (MOI) (0.1 or 1.0 PFU per cell). HD10.6 and SNAP cells are permissive with respect to lytic infection as seen in the lytic control experiments described throughout the next sections. In order to inhibit viral genome replication, a single treatment of the antiviral drug acyclovir (100 μM) was added to the culture medium 1 h postinfection (hpi) when the inoculum was removed. After 3 to 4 days postinfection (dpi), the media containing the initial acyclovir treatment were changed and no additional acyclovir treatments were used. We refer to the time period during which acyclovir is present in the culture as establishment, whereas the time period after withdrawing acyclovir (5 dpi and beyond) is referred to as maintenance. We used four experimental hallmarks of latency to determine whether SNAP cells support latent HSV-1 infection where (i) viral genomes are present in neurons but (ii) in a nonproductive infection, (iii) the viral genomes are transcriptionally repressed, with the exception of LAT, and (iv) the viral genome maintains the potential to reactivate and produce infectious virus.
A low number of SNAP cells harbor a low number of HSV-1 genomes.
We first asked whether we could detect viral genomes present in SNAP cells after discontinuing acyclovir (during maintenance). We hypothesized that, as seen in natural infection and other HSV latency assays, the distribution of viral genomes per neuron would vary (48, 49). SNAP cells were infected in the presence of acyclovir as described above. To confirm that cultures were nonproductive, media were first screened for infectious virus release by performing plaque assays. We used fluorescent in situ hybridization (FISH) to quantify the number of cells harboring viral genomes at 5 dpi. Representative FISH images are shown in Fig. 4. A total of 200 cells were counted for each infection condition and binned according to the number of HSV-1 FISH signals per cell (Table 1). At a low multiplicity of infection (MOI of 0.1), using either laboratory-attenuated strain KOS or neurotrophic strain 17 syn+, about 3% of SNAP cells harbored viral genomes. At a higher multiplicity of infection (MOI of 1.0) with strain 17 syn+, 18% of SNAP cells contained viral genomes, with 14.5% displaying a single viral FISH signal per cell and 3.5% displaying two FISH signals per cell. We conclude that, following (acyclovir-treated) HSV-1 infection of SNAP cells, viral genomes are present in a small percentage (3% to 18%) of SNAP cells and at a relatively low copy number of genomes compared to the results seen with lytic (no acyclovir) infection.
FIG 4.

SNAP cells contain HSV-1 genomes in low copy numbers in few cells. Viral genomes residing in SNAP cells were detected by fluorescent in situ hybridization (FISH) 5 dpi with HSV-1 strain 17 syn+. (a) SNAP cells were infected at an MOI of 0.1 in the absence of acyclovir (Lytic). (b) Mock-infected SNAP cells are shown. (c and d) SNAP cells were infected at an MOI of 0.1 (c) or 1.0 (d) in the presence of a single acyclovir treatment administered 1 h postinfection (Latent). The HSV-1 DNA signals are colorized green and are highlighted by white arrowheads. The human cellular gene, MET, is colorized red and was used as a positive control for hybridization conditions.
TABLE 1.
Distribution of HSV-1 genomes in SNAP cells
| No. of signals per cella | HSV-1 FISH result (%) for indicated infection condition |
|||||
|---|---|---|---|---|---|---|
| Mock | KOS |
17 syn+ |
||||
| Latent (MOI 0.1) | Latent MOI (1.0) | Latent (MOI 0.1) | Latent (MOI 1.0) | Lytic | ||
| 0 | 100 | 97 | 94 | 96.5 | 82 | 29.5 |
| 1 | 3 | 6 | 3 | 14.5 | 17 | |
| 2 | 3.5 | 13.5 | ||||
| 3 | 0.5 | 9 | ||||
| 4 | 5.5 | |||||
| 5 | 2 | |||||
| 6+ | 23.5 | |||||
A total of 200 cells were counted per infection condition.
HSV-1 is nonproductive in SNAP cells infected in the presence of acyclovir.
To test whether viral genomes replicate or remain stably present following infection in the presence of acyclovir, we used quantitative PCR (qPCR) to quantify viral genomes at several time points. SNAP cells were infected with viral reporter strains derived from either KOS (strain DG1, expressing a VP16-green fluorescent protein [VP16-GFP] fusion protein) or 17 syn+ (VP26-GFP) at relatively low multiplicities of infection (MOI of 0.1 and MOI of 1.0). Acyclovir-treated infected cells were harvested for DNA extraction at 1 dpi (early), at 4 dpi (establishment), or at 8 dpi (maintenance). Samples from lytic infections (no acyclovir treatment) were collected at 4 dpi. Viral genomes were detected at all time points, but replication was evident only in the samples from lytic infections (Fig. 5a). We conclude that, following a single treatment of acyclovir, viral genomes persist in a nonreplicative state. To further validate that infection was nonproductive, we quantified the release of infectious virus in samples of culture media collected at the same time points used for viral DNA quantification. Using plaque assays on Vero cells, no infectious virus was detected in culture media from latently infected cells at 8 dpi (Fig. 5b), with the exception of a few outliers. We conclude that these culture conditions resulted in a quiescent, nonproductive infection by maintenance. It should be noted that at a multiplicity of infection above 2, we saw breakthrough lytic infection (or a failure to go latent) more frequently, right after acyclovir withdrawal (data not shown).
FIG 5.
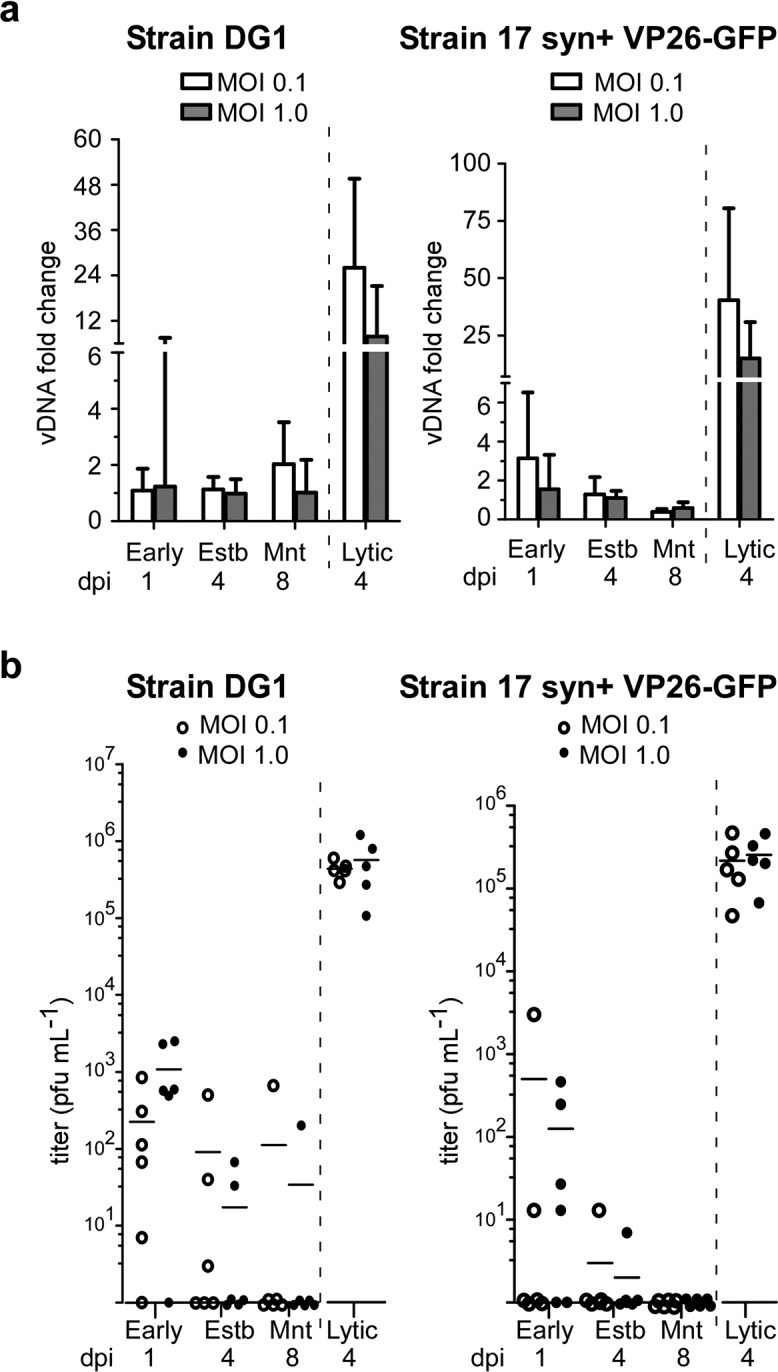
HSV-1 is nonproductive in SNAP cells under conditions of acyclovir treatment. Day 7 SNAP cells were infected in the presence of acyclovir for 4 days with HSV-1 reporter strain DG1 or 17 syn+ VP26-GFP at an MOI of 0.1 (white bars/circles) or 1.0 (dark bars/dots). Cells were harvested for DNA extraction, and media were collected as inoculum for plaque assays at 1 dpi (Early), 4 dpi (establishment [Estb]), and 8 dpi (maintenance [Mnt]). Lytic control infections were not treated with acyclovir, and DNA or media were harvested 4 dpi (Lytic). (a) Viral DNA (vDNA) extracted from infected cells was quantified by qPCR, and data are represented as fold change in the viral DNA level relative to establishment (Estb) for each infection condition. The mean and upper 95% confidence interval are plotted. (b) Viral titers in the cell culture media were determined by counting plaques on Vero cells. Biological duplicates from three separate experiments are shown for each viral latent infection (n = 6), with the mean value represented by a horizontal line (n = 5 for lytic infections). The dashed vertical line separates lytic infection conditions from the latent time course.
Viral genomes are transcriptionally repressed in SNAP cells.
Many studies have shown that HSV genomes are transcriptionally repressed during latency, with the exception of the production of the latency-associated transcript (LAT), a regulatory RNA important in the establishment and maintenance of latency in several experimental models (7, 50–52). We asked whether viral genomes in SNAP cells infected under conditions of acyclovir treatment were transcriptionally repressed and predicted that we would detect lytic gene repression accompanied by low-level LAT expression. SNAP cells were latently infected with HSV strain 17 syn+ VP26-GFP (MOI of 0.1) and harvested for both RNA and DNA extraction at 4 dpi (establishment) and at two maintenance time points, 8 dpi and 13 dpi. Samples from lytic infections (no acyclovir) were collected at 4 dpi. We quantified viral and cellular transcripts and genomes using RT-qPCR and qPCR, respectively. At 8 and 13 dpi, relative transcript numbers (per viral genome) for lytic genes ICP0 and TK, as well as for LAT, were 1/100 the level seen under lytic conditions (Fig. 6). We conclude that the viral genome is transcriptionally repressed both for lytic mRNA and for the LAT transcript under these conditions.
FIG 6.
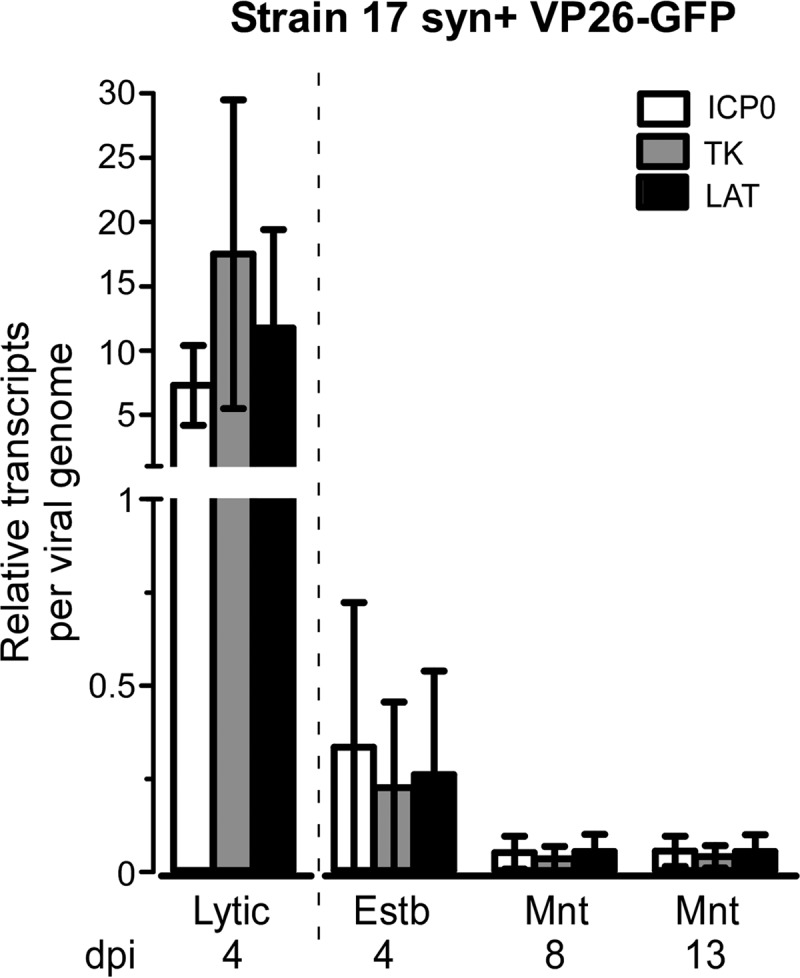
Viral mRNA expression is repressed in latently infected SNAP cells. Day 7 SNAP cells were infected in the presence of acyclovir for 4 days with HSV-1 strain 17 syn+ VP26-GFP at a low MOI (0.1 PFU/cell). Cells were harvested for DNA and RNA extraction at establishment (Estb) (4 dpi) or at two maintenance (Mnt) time points (8 dpi and 13 dpi). Lytic infections were not treated with acyclovir, and cells were harvested for DNA and RNA extraction at 4 dpi (Lytic). Quantities of viral DNA and viral transcripts ICP0, TK, and LAT were normalized to 18S ribosomal DNA or RNA. The mean relative value for transcripts per viral genome is shown, with error bars indicating standard deviations of results from three separate experiments. The dashed vertical line separates lytic infection conditions from the latent time course.
Viral genomes maintain the capacity to reactivate.
A final hallmark of latency is that virus retains the potential to exit from latency, replicate, and produce infectious virus, a process termed reactivation. We saw occasional spontaneous reactivation (i.e., reactivation of virus without intentional induction stimulus) in our control groups which confirmed that the viral genomes maintained the capacity to reactivate. However, this spontaneous reactivation confounded the selection of an optimal induction stimulus. We explored a number of reactivation techniques used by others in established in vitro and in vivo HSV-1 latency models, many of which did not show an obvious increase in reactivation frequency over spontaneous levels (data not shown). We used various physiological factors, including hyperthermia (39.5°C for 24 h), heat shock (43°C for 1 to 4 h) (53), or axonal disruption by axotomy (54) to mimic explantation. We validated hyperthermia and heat shock stress by using immunoblots to monitor induced expression of HSP70 (data not shown). We probed inflammatory pathway factors by treatment with dexamethasone (55), by treatment with media from lipopolysaccharide (LPS)-activated microglial cells, or by direct UV irradiation of latent SNAP cells. We also used pharmacological agents such as trichostatin A (TSA) and forskolin, which have been used by others to induce reactivation in rodent cell culture models (14, 56). We disrupted TrkA signaling by treatment with a PI3-kinase inhibitor (LY294002 or PX866) or by removal of NGF from the media (NGF withdrawal only) (13). We validated both PI3-kinase inhibitors using immunoblots for total AKT and for phosphorylated AKT (data not shown). In our hands, none of these treatments resulted in reactivation frequencies notably above the spontaneous rate.
It was only when we combined NGF withdrawal and addition of anti-NGF sera (NGF depletion), superinfected with UV-inactivated (UVi) HSV-1, or used a combination of NGF depletion and superinfection with UVi virus that we saw evidence of induced reactivation. In these experiments, NGF was restored after 48 h of withdrawal to sustain neuronal cell viability. Reactivation typically was observed 7 to 14 days after induction stimulus, as indicated by GFP-positive SNAP cell results (Fig. 7b). Release of infectious virus was confirmed by inoculating confluent Vero cells with medium from SNAP cell cultures (10 days postinduction) and detecting GFP expression or cytopathic effect (CPE) in Vero cells 3 to 5 days postinoculation (Fig. 7b, inset). An example of noninduced latent SNAP cells and Vero inoculation in which no GFP or CPE was detected in either cell type is represented in Fig. 7a.
FIG 7.
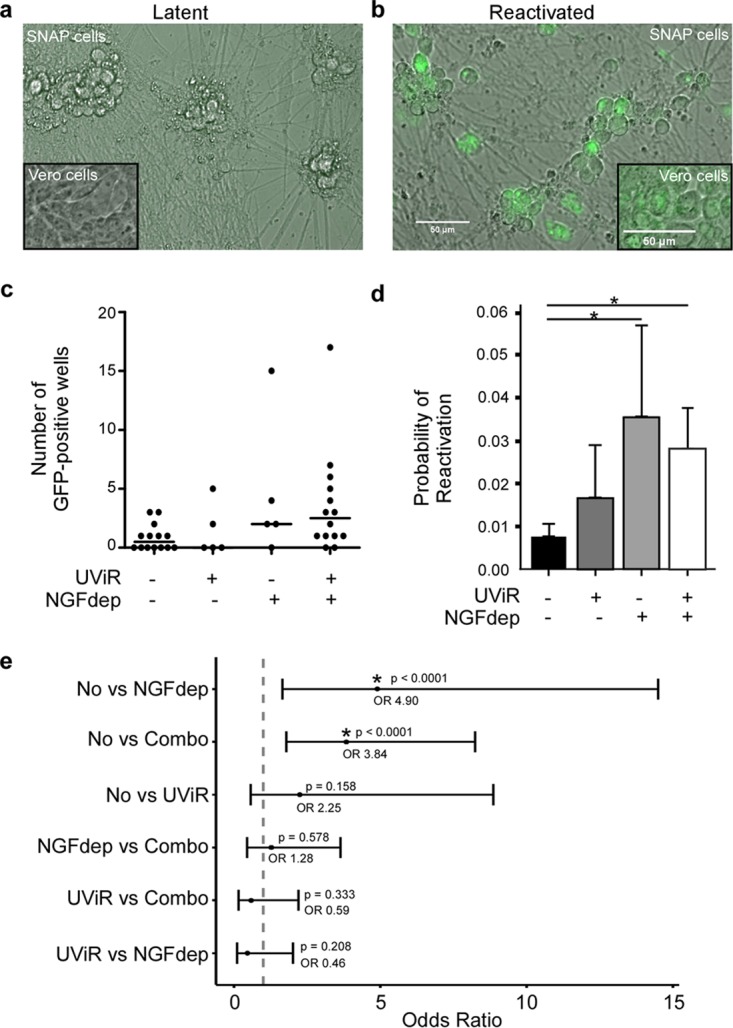
Latently infected SNAP cells maintain the capacity to reactivate. Day 7 SNAP cells were infected in the presence of a single dose of acyclovir with HSV-1 strain 17 syn+ VP26-GFP at a low MOI (1.0 PFU/cell) and were induced to reactivate 7 dpi with UV-irradiated HSV-1 superinfection (UViR), nerve growth factor depletion (NGFdep), or a combination of UViR and NGF depletion. (a) SNAP cells latently infected but not induced to reactivate are shown in a merged green fluorescence and bright-field image; the inset shows a merged image of Vero cells inoculated with media from the noninduced latent SNAP cells. (b) Latently infected and reactivated SNAP cells are shown in a merged image; the inset shows a merged image of Vero cells inoculated with media from the reactivated SNAP cells. Bars, 50 μm. At 10 days after the induction stimulus, media from latently infected SNAP cells were used to inoculate Vero cells (for 3 to 5 days). Vero cell infections were scored from 14 separate experiments using a fluorescent plate reader for GFP expression. (c) The number of GFP-positive wells per experiment is plotted for each of the conditions, and medians are depicted with solid horizontal lines. (d) Estimated probabilities of reactivation and standard errors are plotted from a logistic mixed-effects model that was used to determine whether the probabilities of a well reactivating differed between induction conditions. (e) The false-coverage intervals for the odds ratio of each reactivation rate comparison are plotted. By plotting the estimated odds ratio with lower and upper 95% false-coverage intervals for each comparison (noninduced [No], NGFdep, UViR, or the combination of NGFdep and UViR [Combo]), the groups that had a significantly different value for the odds of reactivating (*) are indicated by the failure to cross the “no effects” line (dashed vertical line), where the odds ratio is equal to 1. An asterisk (*) denotes comparison significance where the P value is <0.0001.
Although NGF depletion, superinfection with UVi virus (UViR), or a combination of the two techniques appeared to be most consistent at inducing reactivation, the overall reactivation frequency remained low (Fig. 7c). In order to determine whether the probabilities of a reactivation event differed under the various induction conditions, a logistic mixed-effects model was applied. To fit the model, we used data from 14 separate experiments; an experimental replicate is defined by separate HD10.6 cell platings, infections from separate virus aliquots (same stock), and different induction conditions randomized across sectors of 96-well plates of latently infected SNAP cells. Using Vero cell inoculation as described above to amplify the GFP signal from reactivation, we scored GFP-positive wells as “yes” for reactivation and GFP-negative wells as “no” for reactivation.
The probability of reactivation following NGF depletion was significantly higher than the probability of spontaneous reactivation (Fig. 7d). The use of UViR modestly increased the probability of reactivation above that seen spontaneously, but the difference was not statistically significant. Moreover, the combined induction (NGF depletion and UViR) did not increase the probability of reactivation above that observed with NGF depletion alone. False-coverage intervals for each comparison depict significantly different odds of reactivation between noninduced induction and NGF depletion induction and between noninduced induction and combination induction (Fig. 7e) but not for any other pairwise combination. We conclude from this that viral genomes maintain the capacity to reactivate from latently infected SNAP cells but that they do so at a low frequency. Furthermore, these data suggest that NGF signaling is one component important for maintaining HSV-1 latency in this model.
DISCUSSION
The results presented in this report confirm that HD10.6 cells are fate restricted to a neuronal phenotype, consistent with the conclusion of the original publication describing this cell line (46). The morphology of matured HD10.6 cells resembles that of neurons, and the induced expression of β-III tubulin and of peripherin supported the identification of a sensory neuron-associated phenotype. We found that, under culture conditions with NGF, neurotrophin-3 (NT-3), GDNF, and ciliary neurotrophic factor (CNTF) supplementation, SNAP cells express multiple neurotrophin receptors, including TrkA, TrkB, TrkC, and RET, and therefore that HD10.6 cells do not mature into a specific subpopulation of sensory neuron. This outcome might have arisen from the inclusion of multiple neurotrophins in the maturation medium (57), which was selected during early optimization studies based on overall cell viability counts (data not shown). Given that the HD10.6 cells were isolated from a first-trimester fetus and expressed multiple receptors, it seems that SNAP cells resemble a prenatal/neonatal neuronal phenotype. Dissociation and in vitro culture of adult ganglia also result in elevated expression of multiple neurtrophin receptors in primary sensory neurons relative to in vivo expression (58). We have not yet explored whether these cells could be systematically differentiated into a specific subpopulation based on alternative neurotrophic supplementation.
Studies of HSV latency will benefit significantly from a human neuronal culture model in which viral and host cell factors can be experimentally manipulated. Here we demonstrated that a quiescent state resembling latency can be established in human DRG-derived neurons following HSV-1 infection in the presence of acyclovir. Traditionally, the latent state is defined as the absence of infectious virus production despite the presence of viral genomes in neuronal nuclei (3, 13), and this model fulfills that definition. The latent genomes show little or no DNA replication and low levels of viral gene expression (59), including that by both lytic genes and LAT genes. In addition, these quiescent viral genomes maintain the capacity to reactivate.
The function of LAT, first detected in latently infected murine ganglia (60) and later in latently infected human (61, 62) and rabbit (63) ganglia, continues to be an area of some uncertainty (64). Some studies using murine models showed that recombinant viruses lacking various LAT domains can establish latency at normal levels (65–67), whereas others showed significant decreases in establishment or reactivation in the absence of LAT (53, 68). In a recent report looking at LAT expression in human TG in relation to local T-cell infiltration, HSV viral genome occupancy was often accompanied by LAT expression but also by low levels of lytic gene expression (51). Evidence for heterogeneity of LAT expression in neurons during latency has been shown in rodent models (8), and not all detection techniques for LAT expression are sufficiently sensitive (69). Given that RT-qPCR detects gene expression from a pool of infected cells and does not depict the heterogeneity of viral gene expression on a cell-by-cell basis, single-cell PCR or RNA in situ hybridization may be useful to address this issue. Alternatively, if LAT does not efficiently accumulate in SNAP cells, this may contribute to the low reactivation frequency seen; this mechanism would warrant further investigation.
We looked at transcript levels relative to genome copy number over a course of latent infection as an indication of the genome activity. An alternative approach to demonstrate the repressed nature of the latent viral genome would be to characterize the chromatin state at lytic and LAT genes. However, one limitation of this model is that latency is established in a small population of cells and at low genome copy numbers. This may contribute to the lack of detection of LAT accumulation but also makes characterization of latent viral genome technically challenging. Nonetheless, HSV-1 LAT-deficient strains could be used to explore the dependency of latency establishment on LAT expression in this model.
Considering that the number of cells in which the virus is latent (48, 49) and the copy number of viral genomes in individual latently infected cells (70) are factors that impact reactivation frequency, the low level of latency established in our model may contribute to the low reactivation frequency. The efficiency of establishment and reactivation may be viral strain specific based on in vivo models whereby KOS and 17 syn+ latently infect comparable numbers of neurons but KOS does so with significantly fewer viral genomes per cell and has a lower reactivation frequency (71). We did not directly compare these strains in our model, but a comparison of establishment efficiency and reactivation frequency levels for different HSV-1 strains, such as KOS, 17 syn+, and McKrae, might provide insight on this strain-specific phenomenon seen in vivo.
Autopsy analysis of human TG, which consist of approximately 27,000 neurons (72), shows that about 3% of neurons harbor latent viral genomes (73), which is similar to the frequency revealed by FISH in our in vitro infection model. In human autopsy samples, the average HSV genome copy number ranged from 2 to 50 per neuron (73), whereas the viral genome copy number per neuron in latently infected mouse TG can exceed 1,000 (70). In our system, the number of signals from viral genomes (as indicated by FISH) rarely exceeded two. That is not to imply that the mechanisms establishing latency are necessarily the same in our model as in vivo but only that the resulting frequencies and abundances of viral genomes in our model are more closely comparable to natural human infection than to rodent models. We surmise that by increasing the number of viral genomes establishing latency per neuron, the system would have a higher propensity for inducible reactivation as seen in rodent models.
Spontaneous reactivation occurred occasionally in our experiments, but most often the virus remained quiescent, suggesting that reactivation is likely a low-frequency stochastic event. Ideally, inducing reactivation to boost the frequency would better enable a robust analysis of potential reactivation mechanisms (18). Even though NGF depletion increased the probability of reactivation over the background (spontaneous) likelihood of reactivation, the frequency after induction remained relatively low compared to that seen with in vitro rodent models, in which (in one report) NGF signaling disruption operating through the PI3-kinase pathway resulted in over 50% of wells reactivating (13). We may be failing to observe reactivation in some experiments where low levels of infectious virus are released. We established a threshold of sensitivity for the Vero cells in a 96-well format in which infections using 10 PFU/ml were detected 44% of the time whereas infections using 100 PFU/ml were detected 100% of the time (data not shown). Given that the wells contain approximately 0.1 ml of medium, release of 10 infectious particles or fewer may not always be detected. In order to interrogate the reactivation mechanism, a more sensitive method for detecting reactivation frequency would be useful.
Alternatively, the low frequency of induced reactivation may be inherently unique to the properties of this cell line. We have not ruled out contributions from unknown genetic changes that may have been acquired during immortalization and acquisition of indefinite proliferation capability. Perhaps the presence of multiple neurotrophin receptor expression means that classical induction techniques which target one signaling branch are not sufficient due to the presence of compensating pathways otherwise not present in fully differentiated neuronal subtypes. Although the majority of cells expressed all three Trk receptors and RET as evident by immunofluorescence results, we do not know the neurotrophic receptor status of the few (3% to 18%) SNAP cells that harbor latent viral genomes as detected by FISH. Colocalization studies of viral genome and receptor status are certainly warranted. Lastly, the fact that PI3-kinase inhibition did not appear to induce reactivation above spontaneous levels that but NGF depletion did (albeit modestly) suggests that the low-affinity neurotrophin receptor (p75), which also can bind NGF (74), may be playing a role in maintaining latency in these cells. At this time, we have not probed SNAP cells for p75 expression.
Nonetheless, this model presents opportunities to examine cellular factors necessary for establishing latency and the pathways involved during reactivation in a human neuronal system. Determining which factors are necessary for HSV reactivation (4, 13, 75, 76), specifically in human neurons, will help tailor the development of novel therapeutics. Of specific interest to our laboratory is whether the recruitment of chromatin-modifying enzymes by VP16 during latency is necessary for reactivation. VP16 recruits histone acetyltransferases and ATPase-remodeling enzymes to IE gene promoters during lytic infection in epithelial cell lines, but viral gene expression is not affected by targeted knockdown of these enzymes (77, 78). We hypothesize that IE gene activation depends on recruitment of these chromatin-modifying enzymes by VP16 during reactivation. This model also presents opportunities to study other alphaherpesvirus, including HSV-2 and varicella-zoster virus (VZV) (79), and potentially other neurovirulent viruses for which experimental models are even more limited (80). HD10.6 cells can also be matured and infected in compartmented chambers (data not shown), which opens the possibility of studying viral transport and trafficking specifically in human sensory neurons (81).
MATERIALS AND METHODS
Cell culture.
Immortalized human dorsal root sensory ganglion cells (HD10.6 cells) were a gift from Celgene (46). HD10.6 cells were passaged in proliferation media on Nunc flasks coated with fibronectin (Millipore FC010). Proliferation media comprised advanced Dulbecco's modified Eagle medium/Ham's F-12 (DMEM/F12; Life Technology catalog no. 12634010) supplemented with glutaMAX (Gibco; catalog no. 35050061), B-27 supplement (Life Technology; catalog no. 17504044), 10 ng/ml prostaglandin E1 (Sigma; catalog no. P5515), and fresh 0.5 ng/ml fibroblast growth factor-basic (bFGF) (Stemgent; catalog no. 03-0002). For maturation in a dish or plate, cells were seeded on day 0 (D0) at a density of 5 × 10⁴ cells/cm2 in proliferation media on plates coated with 2% Matrigel (Corning; catalog no. 356234) and 10 μg/ml poly-d-lysine (coating done at room temperature for 1 h). Media were changed to complete maturation media 24 h after plating on D1, with half-volume medium changes performed every 3 days thereafter. Complete maturation media comprise NeuralQ basal medium (MTI-GlobalStem; catalog no. GSM-9420) supplemented with glutaMAX (Gibco; catalog no. 35050061), GS21 neuronal supplement (MTI-GlobalStem; catalog no. GSM-3100), 1 μg/ml doxycycline (Sigma; catalog no. T-7660), 50 ng/ml 2.5S nerve growth factor (NGF) (Harlan; catalog no. B.5017), and 25 ng/ml each of ciliary neurotrophic factor (CNTF) (PeproTech; catalog no. 450-13), glial cell-derived neurotrophic factor (GDNF) (Gibco), and neurotrophin-3 (NT-3) (PeproTech; catalog no. 450-03). Telomerase-transformed human foreskin fibroblasts (HFFs) provided by Wade Bresnahan (82) and Vero cells acquired from ATCC were grown in DMEM supplemented with 10% fetal bovine serum (FBS). Human neuroblastoma cells (SH-SY5Y) were grown in a 1:1 ratio of modified Eagle's medium and F12 supplemented with 10% FBS. SH-SY5Y cells were differentiated by adding fresh retinoic acid (10 μM) every other day for 5 days (dSH-SY5Y). All cells were incubated at 37°C and 5% CO2.
Cell line authentication.
We submitted HD10.6 cells to ATCC for short tandem repeat (STR) profiling. Seventeen STR loci plus the gender-determining locus (amelogenin) were amplified using a commercially available PowerPlex 18D kit from Promega. The cell line sample was processed using an ABI Prism 3500xl genetic analyzer. Data were analyzed using GeneMapper ID-X v1.2 software (Applied Biosystems). Appropriate positive and negative controls were run and confirmed for each sample submitted. Cell lines were authenticated using short tandem repeat (STR) analysis as described in 2012 in ANSI standard ASN-0002 by the ATCC Standards Development Organization (SDO) and in Capes-Davis et al. (87).
Viral strains and infection techniques.
All viruses were propagated on Vero cells. Viral titers were determined by plaque assays on Vero cells grown to confluent monolayers, infected with inoculum for 1 h at 37°C, and overlaid with 0.9% SeaPlaque agarose and DMEM supplemented with 5% FBS. At 3 to 4 days postinfection, cells were stained with neutral red for 2 h at 37°C to visualize and count plaques. HSV-1 strain 17 syn+ was a gift from Nancy Sawtell. HSV-1 reporter strains 17 syn+ VP26-GFP and 17 syn+ VP26-RFP were gifts from Andrea Bertke. HSV-1 strain KOS was acquired from ATCC. HSV-1 strain DG1 (KOS background) expresses wild-type VP16 fused at its carboxyl terminus to the enhanced green fluorescent protein (EGFP) (83, 84). For neuronal infections in a dish or plate, media were removed from day 7 SNAP cells and virus (diluted in NeuralQ basal medium) was added for 1 h at 37°C and 5% CO2 with gentle rocking every 15 min. Multiplicity of infection (MOI) values were estimated using a dilution factor quantified from the following equation: [(cell number × desired MOI) ÷ (virus stock titer × inoculum volume)] (where the cell number is the number of plated cells multiplied by 1.2 to account for initial proliferation and cell loss during maturation). At 1 h postinfection (hpi), the inoculum was removed and complete maturation media with 100 μM acyclovir (Cayman Chemicals; catalog no. 14160) were added for latent infection or without acyclovir for lytic infection. At 3 to 4 days postinfection (dpi), fresh media were added without acyclovir for both latent and lytic infections.
Antibodies and immunofluorescence.
For immunofluorescent staining, SNAP cells were grown on glass coverslips coated with 2% Matrigel and 10 μg/ml poly-d-lysine. Cells were fixed with 4% paraformaldehyde (PFA) (16% formaldehyde methanol-free solution [Thermo Scientific; catalog no. 28908] diluted with phosphate-buffered saline [PBS]) for 15 min at room temperature without rocking. To minimize peeling, 4% PFA (400 μl) was added directly to cell media (roughly 2 ml) for 2 min prior to aspiration and proper fixation. Fixed cells were carefully washed in PBS three times and either stored at 4°C or permeablized and blocked in a single step (2% bovine serum albumin [BSA]–PBS–0.5% Triton X-100–0.05% Tween 20) for 45 min at room temperature. Antibodies against TrkA (sc-118), TrkB (sc-20542), TrkC (sc-14025), RET (sc-1290), and peripherin (sc-28539) were purchased from Santa Cruz. Antibodies against β-III tubulin (MAB1195) and nestin (MAB2736) were purchased from R & D Systems. Antibody against GFAP (catalog no. 04-1062) was purchased from Millipore. All primary antibodies were diluted in TBST (100 mM Tris [pH 7.5], 150 mM NaCl, 0.1% Tween 20) containing 1% BSA and incubated either 1 h at room temperature or overnight at 4°C. Coverslips were gently washed three times in PBS. Secondary antibodies conjugated to Alexa Fluor 594 or 488 (Jackson) (protected from light) were used at 1:250 in PBS–1% BSA for 1 h at room temperature. Coverslips were gently washed three times in PBS. Coverslips were counterstained with 4′-6-diamidino-2-phenylindole (DAPI) for 10 min followed by washing in distilled water. Coverslips were mounted on slides using FluorSave reagent (Calbiochem) and allowed to air dry for 24 h before imaging. Images were acquired using a Nikon A1plus-RSi scanning confocal microscope with a 60× oil objective and NIS-Elements software. Images were analyzed and colorized using FIJI software.
Immunoblot analysis.
Cell lysates were collected and analyzed by gel electrophoresis and immunoblotting as follows. Cell culture medium was aspirated, and cells were collected by using trypsin (TrypLE; Gibco catalog no. 12604013) for 5 min at 37°C. Cells were washed by centrifugation (1,000 rpm, 5 min), resuspension in PBS, and recentrifugation (1,000 rpm, 5 min). The cell pellet was directly lysed in 2× Laemmli buffer (Bio-Rad catalog no. 161-0737)–5% β-mercaptoethanol (Bio-Rad catalog no. 161-0710). Lysates were heated to 95°F for 10 min and separated on 4% to 20% Tris-glycine gels (Novex). Proteins were transferred to polyvinylidene fluoride membranes and blocked in TBST containing 5% BSA. The blocked membrane was incubated with primary antibody overnight at 4°C or for 1 h at room temperature at the dilution suggested by the supplier. The membrane was washed with TBST and incubated with the appropriate secondary antibody conjugated with horseradish peroxidase (HRP) at a 2,500-fold dilution for 1 h at room temperature (Cell Signaling; anti-mouse antibody [catalog no. 7076] or anti-rabbit antibody [catalog no. 7074]). The membrane was again washed, and the HRP was detected by chemiluminescence. Actin antibodies for immunoblot loading controls were obtained from Millipore (MAB1501).
Gene expression and quantitative PCR.
For neuronal gene expression studies, HD10.6 cells were matured in 6-well plates, with 3 wells representing biological triplicates for each experimental condition. RNA was collected using an Qiagen RNeasy kit. For viral genome quantification studies, HD10.6 cells were matured and infected in 12-well plates, with 3 wells representing biological triplicates. DNA was collected using a Qiagen DNeasy blood and tissue kit. For viral gene expression studies, HD10.6 cells were matured and infected in 24-well plates and a total of 12 wells were combined for each time point (in biological duplicates) by trypsinizing (TrypLE) and resuspending cells in 500 μl of PBS. The cell suspension was split in half for separate extraction of RNA or DNA using a Qiagen RNeasy kit or a Qiagen DNeasy blood and tissue kit, respectively. Purified RNA (500 ng) was reverse transcribed with a High-Capacity cDNA reverse transcription kit (Applied Biosystems) and RNAseOut (Invitrogen) according to the manufacturer's protocol. Gene expression was quantified by quantitative reverse transcription-PCR (RT-qPCR) using primers specific for the selected viral or human genes (Table 2). Purified DNA was quantified by quantitative PCR (qPCR) with primers specific for the viral ICP4 or ICP0 viral genes or the human 18S rRNA gene. The qPCR was performed on an ABI 7500 RT-PCR system (Applied Biosystems) using FastStart Universal SYBR green master mix (Roche). For neuronal gene expression studies, relative RNA levels were analyzed by the threshold cycle (2−ΔΔCT) method normalized to HD10.6 cell expression at day 1. For viral genome quantification studies, DNA levels were analyzed by the 2−ΔΔCT method normalized to the establishment time point for a given MOI. For viral gene expression studies, both transcripts and DNA were normalized to 18S (ΔCT) and analyzed by the 2−(ΔCT[transcript]-ΔCT[DNA]) method.
TABLE 2.
Quantitative PCR primer sequences
| Target [gene]a | Primer bank IDb | Sequencec |
|---|---|---|
| TrkA [NTRK1] (h) | 56118209c1 | AACCTCACCATCGTGAAGAGT (f) |
| TGAAGGAGAGATTCAGGCGAC (r) | ||
| TrkB [NTRK2] (h) | 65506645c2 | ACCCGAAACAAACTGACGAGT (f) |
| AGCATGTAAATGGATTGCCCA (r) | ||
| Trk C [NTRK3] (h) | 340745350c3 | ACGAGAGGGTGACAATGCTG (f) |
| CCAGTGACTATCCAGTCCACA (r) | ||
| [RET] (h) | 126273513c1 | AAAGTGGCATTGGGCCTCTAC (f) |
| GCAGGGCATGGACGTACAG (r) | ||
| β-III Tubulin [TUBB3] (h) | 308235961c1 | GGCCAAGGGTCACTACACG (f) |
| GCAGTCGCAGTTTTCACACTC (r) | ||
| Peripherin [PRPH] (h) | 66932907c1 | GCCTGGAACTAGAGCGCAAG (f) |
| CCTCGCACGTTAGACTCTGG (r) | ||
| [GFAP] (h) | 334688843c2 | AGGTCCATGTGGAGCTTGAC (f) |
| GCCATTGCCTCATACTGCGT (r) | ||
| 18S [RNA18S5] (h) | CGGTCCAAGAATTTCACCTC (f) | |
| CCGCAGCTAGGAATAATGGA (r) | ||
| HSV-1 ICP0 (v) | CTGTCGCCTTACGTGAACAA (f) | |
| CCATGTTTCCCGTCTGGTC (r) | ||
| HSV-1 ICP4 (v) | GAAGTTGTGGACTGGGAAGG (f) | |
| GTTGCCGTTTATTGCGTCTT (r) | ||
| HSV-1 TK (v) | TACCCGAGCCGATGACTTAC (f) | |
| AAGGCATGCCCATTGTTATC (r) | ||
| HSV-1 LAT (v) | CAGACAGCAAAAATCCCCTGAGT (f) | |
| GGGACGAGGGAAAACAATAAGG (r) |
h, human target gene; v, viral target gene.
ID, identifier.
Forward (f) and reverse (r) primer pairs are indicated.
Fluorescent in situ hybridization (FISH).
The human control FISH probe for the MET proto-oncogene was prepared from purified bacterial artificial chromosome (BAC) clones RP11-163C9, RP11-564A14, and RP11-39K12 (locus 7q31) (BACPAC Resource Center [BPRC]; bacpac.chori.org). HSV-1 DNA probes spanning most of the viral genome were synthesized from cosmid templates Cos 14, Cos 28, and Cos 56 (gifts from Patrick Lomonte) (85). Briefly, the individual cosmids were purified from NEB10 bacterial cells using a PrepEase kit (USB) and mixed in equimolar amounts. The BAC DNA and cosmid DNA were labeled with Orange-dUTP and Green-dUTP (Abbott Molecular Inc., Des Plaines, IL), respectively, by nick translation. HD10.6 cells were matured in 100-mm-diameter dishes and infected at day 7 as described for the virus techniques. At 3 dpi, media containing acyclovir were replaced with fresh media lacking acyclovir. At 5 dpi, supernatant (stored at −80°C) was collected and cells were collected by trypsinization with TrypLE and then resuspension in neuronal media. Sample slides were prepared from cultured SNAP cells that were incubated in 0.075 M KCl at 37°C for 15 min and fixed with methanol/acetic acid (3:1) using standard cytogenetic methods. Glass slides were pretreated with 2× SSC (1× SSC is 0.15 M NaCl plus 0.015 M sodium citrate) at 37°C for 10 min, 0.005% pepsin–0.01 M HCl at 37°C for 3 min, and PBS for 5 min. The slides were then placed in 1% formaldehyde for 10 min at room temperature, washed with PBS for 5 min, and dehydrated in an ethanol series (70%, 85%, and 95%) for 2 min each time. Samples on slides were denatured in 70% formamide–2× SSC at 74°C for 3 min, washed in a cold ethanol series (70%, 85%, and 95%) for 2 min each time, and air dried. FISH probes were denatured at 73°C for 5 min and kept at 37°C for 10 to 30 min. Eight microliters of probe was applied onto each slide and mounted with a glass coverslip. The slides were hybridized overnight at 37°C, washed with 2× SSC at 73°C for 2 min, and rinsed briefly in distilled water. Slides were air-dried and counterstained with Vectashield mounting medium with DAPI (Vector Laboratories Inc., Burlingame, CA), and coverslips were applied. Images were acquired at ×1,000 system magnification with a Cool-1300 SpectraCube camera (Applied Spectral Imaging [ASI], Vista, CA) mounted on an Olympus BX43 microscope. Images were analyzed using FISHView v7.2 software (ASI). A total of 200 interphase nuclei were scored for each sample and binned according to the number of discrete HSV-1 signals per cell.
Statistical analysis.
Logistic linear mixed-effects models were fit using R v 3.3.1 (https://cran.r-project.org/) to test for differences in reactivation probabilities. A random intercept was included for each plate to account for within-plate correlation. Linear contrasts with a false-discovery-rate correction were used to test specific hypotheses (86). Assumptions were assessed visually using quantile-quantile and residual plots. The significance level was set at alpha = 0.05.
ACKNOWLEDGMENTS
This research was supported by both the Van Andel Research Institute Graduate School and the Van Andel Research Institute.
We thank Celgene for the generous gift of HD10.6 cells, without which this work would not have been possible. We also thank Andrea Bertke (Virginia Tech) for the gift of reporter virus strains 17 syn+ VP26-GFP and 17 syn+ VP26-RFP and Rick Thompson (University of Cincinnati College of Medicine) and Nancy Sawtell (Cincinnati Children's Hospital) for the gift of the wild-type 17 syn+ viral strain. We thank the laboratory of Orkide Koyuncu and Lynn Enquist (Princeton University) for protocols on UV-inactivated herpesvirus reactivation and neuron growth in compartmented chambers. We thank the P. Lomonte laboratory (CNRS University of Lyon) for the gift of the HSV-1 cosmids which were used to develop the FISH HSV-1 probe. We thank laboratory member Glen Alberts for his thoughtful input and technical support and Julie Koeman of the VARI cytogenetics core for performing FISH.
REFERENCES
- 1.Kramer T, Enquist LW. 2013. Directional spread of alphaherpesviruses in the nervous system. Viruses 5:678–707. doi: 10.3390/v5020678. [DOI] [PMC free article] [PubMed] [Google Scholar]
- 2.Bloom DC. 2016. Alphaherpesvirus latency: a dynamic state of transcription and reactivation. Adv Virus Res 94:53–80. doi: 10.1016/bs.aivir.2015.10.001. [DOI] [PubMed] [Google Scholar]
- 3.Wagner EK, Bloom DC. 1997. Experimental investigation of herpes simplex virus latency. Clin Microbiol Rev 10:419–443. [DOI] [PMC free article] [PubMed] [Google Scholar]
- 4.Bloom DC, Giordani NV, Kwiatkowski DL. 2010. Epigenetic regulation of latent HSV-1 gene expression. Biochim Biophys Acta 1799:246–256. doi: 10.1016/j.bbagrm.2009.12.001. [DOI] [PMC free article] [PubMed] [Google Scholar]
- 5.Kim JY, Mandarino A, Chao MV, Mohr I, Wilson AC. 2012. Transient reversal of episome silencing precedes VP16-dependent transcription during reactivation of latent HSV-1 in neurons. PLoS Pathog 8:e1002540. doi: 10.1371/journal.ppat.1002540. [DOI] [PMC free article] [PubMed] [Google Scholar]
- 6.Deshmane SL, Fraser NW. 1989. During latency, herpes simplex virus type 1 DNA is associated with nucleosomes in a chromatin structure. J Virol 63:943–947. [DOI] [PMC free article] [PubMed] [Google Scholar]
- 7.Nicoll MP, Hann W, Shivkumar M, Harman LE, Connor V, Coleman HM, Proenca JT, Efstathiou S. 2016. The HSV-1 latency-associated transcript functions to repress latent phase lytic gene expression and suppress virus reactivation from latently infected neurons. PLoS Pathog 12:e1005539. doi: 10.1371/journal.ppat.1005539. [DOI] [PMC free article] [PubMed] [Google Scholar]
- 8.Proença JT, Coleman HM, Connor V, Winton DJ, Efstathiou S. 2008. A historical analysis of herpes simplex virus promoter activation in vivo reveals distinct populations of latently infected neurones. J Gen Virol 89:2965–2974. doi: 10.1099/vir.0.2008/005066-0. [DOI] [PMC free article] [PubMed] [Google Scholar]
- 9.Nicoll MP, Proença JT, Connor V, Efstathiou S. 2012. Influence of herpes simplex virus 1 latency-associated transcripts on the establishment and maintenance of latency in the ROSA26R reporter mouse model. J Virol 86:8848–8858. doi: 10.1128/JVI.00652-12. [DOI] [PMC free article] [PubMed] [Google Scholar]
- 10.Shivkumar M, Milho R, May JS, Nicoll MP, Efstathiou S, Stevenson PG. 2013. Herpes simplex virus 1 targets the murine olfactory neuroepithelium for host entry. J Virol 87:10477–10488. doi: 10.1128/JVI.01748-13. [DOI] [PMC free article] [PubMed] [Google Scholar]
- 11.Nicoll MP, Efstathiou S. 2013. Expression of the herpes simplex virus type 1 latency-associated transcripts does not influence latency establishment of virus mutants deficient for neuronal replication. J Gen Virol 94:2489–2494. doi: 10.1099/vir.0.056176-0. [DOI] [PMC free article] [PubMed] [Google Scholar]
- 12.Efstathiou S, Preston CM. 2005. Towards an understanding of the molecular basis of herpes simplex virus latency. Virus Res 111:108–119. doi: 10.1016/j.virusres.2005.04.017. [DOI] [PubMed] [Google Scholar]
- 13.Camarena V, Kobayashi M, Kim JY, Roehm P, Perez R, Gardner J, Wilson AC, Mohr I, Chao MV. 2010. Nature and duration of growth factor signaling through receptor tyrosine kinases regulates HSV-1 latency in neurons. Cell Host Microbe 8:320–330. doi: 10.1016/j.chom.2010.09.007. [DOI] [PMC free article] [PubMed] [Google Scholar]
- 14.Danaher RJ, Jacob RJ, Miller CS. 1999. Establishment of a quiescent herpes simplex virus type 1 infection in neurally-differentiated PC12 cells. J Neurovirol 5:258–267. doi: 10.3109/13550289909015812. [DOI] [PubMed] [Google Scholar]
- 15.Wilcox CL, Johnson EM Jr. 1987. Nerve growth factor deprivation results in the reactivation of latent herpes simplex virus in vitro. J Virol 61:2311–2315. [DOI] [PMC free article] [PubMed] [Google Scholar]
- 16.Wilcox CL, Johnson EM Jr. 1988. Characterization of nerve growth factor-dependent herpes simplex virus latency in neurons in vitro. J Virol 62:393–399. [DOI] [PMC free article] [PubMed] [Google Scholar]
- 17.Bertke AS, Swanson SM, Chen J, Imai Y, Kinchington PR, Margolis TP. 2011. A5-positive primary sensory neurons are nonpermissive for productive infection with herpes simplex virus 1 in vitro. J Virol 85:6669–6677. doi: 10.1128/JVI.00204-11. [DOI] [PMC free article] [PubMed] [Google Scholar]
- 18.Kobayashi M, Kim JY, Camarena V, Roehm PC, Chao MV, Wilson AC, Mohr I. 2 April 2012. A primary neuron culture system for the study of herpes simplex virus latency and reactivation. J Vis Exp doi: 10.3791/3823. [DOI] [PMC free article] [PubMed] [Google Scholar]
- 19.Davison AJ. 2011. Evolution of sexually transmitted and sexually transmissible human herpesviruses. Ann N Y Acad Sci 1230:E37–E49. doi: 10.1111/j.1749-6632.2011.06358.x. [DOI] [PubMed] [Google Scholar]
- 20.Cleary MA, Stern S, Tanaka M, Herr W. 1993. Differential positive control by Oct-1 and Oct-2: activation of a transcriptionally silent motif through Oct-1 and VP16 corecruitment. Genes Dev 7:72–83. doi: 10.1101/gad.7.1.72. [DOI] [PubMed] [Google Scholar]
- 21.Gerster T, Roeder RG. 1988. A herpesvirus trans-activating protein interacts with transcription factor OTF-1 and other cellular proteins. Proc Natl Acad Sci U S A 85:6347–6351. doi: 10.1073/pnas.85.17.6347. [DOI] [PMC free article] [PubMed] [Google Scholar]
- 22.Kristie TM, Sharp PA. 1990. Interactions of the Oct-1 POU subdomains with specific DNA sequences and with the HSV alpha-trans-activator protein. Genes Dev 4:2383–2396. doi: 10.1101/gad.4.12b.2383. [DOI] [PubMed] [Google Scholar]
- 23.Hagmann M, Georgiev O, Schaffner W, Douville P. 1995. Transcription factors interacting with herpes simplex virus alpha gene promoters in sensory neurons. Nucleic Acids Res 23:4978–4985. doi: 10.1093/nar/23.24.4978. [DOI] [PMC free article] [PubMed] [Google Scholar]
- 24.Christensen J, Steain M, Slobedman B, Abendroth A. 2011. Differentiated neuroblastoma cells provide a highly efficient model for studies of productive varicella-zoster virus infection of neuronal cells. J Virol 85:8436–8442. doi: 10.1128/JVI.00515-11. [DOI] [PMC free article] [PubMed] [Google Scholar]
- 25.De Chiara G, Marcocci ME, Civitelli L, Argnani R, Piacentini R, Ripoli C, Manservigi R, Grassi C, Garaci E, Palamara AT. 2010. APP processing induced by herpes simplex virus type 1 (HSV-1) yields several APP fragments in human and rat neuronal cells. PLoS One 5:e13989. doi: 10.1371/journal.pone.0013989. [DOI] [PMC free article] [PubMed] [Google Scholar]
- 26.Shipley MM, Mangold CA, Szpara ML. 17 February 2016. Differentiation of the SH-SY5Y human neuroblastoma cell line. J Vis Exp doi: 10.3791/53193. [DOI] [PMC free article] [PubMed] [Google Scholar]
- 27.Weir JP. 2001. Infection of human NT2 cells and differentiated NT-neurons with herpes simplex virus and replication-incompetent herpes simplex virus vectors. J Neurovirol 7:43–51. doi: 10.1080/135502801300069656. [DOI] [PubMed] [Google Scholar]
- 28.Hsu WL, Everett RD. 2001. Human neuron-committed teratocarcinoma NT2 cell line has abnormal ND10 structures and is poorly infected by herpes simplex virus type 1. J Virol 75:3819–3831. doi: 10.1128/JVI.75.8.3819-3831.2001. [DOI] [PMC free article] [PubMed] [Google Scholar]
- 29.Lee KS, Zhou W, Scott-McKean JJ, Emmerling KL, Cai GY, Krah DL, Costa AC, Freed CR, Levin MJ. 2012. Human sensory neurons derived from induced pluripotent stem cells support varicella-zoster virus infection. PLoS One 7:e53010. doi: 10.1371/journal.pone.0053010. [DOI] [PMC free article] [PubMed] [Google Scholar]
- 30.Pugazhenthi S, Nair S, Velmurugan K, Liang Q, Mahalingam R, Cohrs RJ, Nagel MA, Gilden D. 2011. Varicella-zoster virus infection of differentiated human neural stem cells. J Virol 85:6678–6686. doi: 10.1128/JVI.00445-11. [DOI] [PMC free article] [PubMed] [Google Scholar]
- 31.Dukhovny A, Sloutskin A, Markus A, Yee MB, Kinchington PR, Goldstein RS. 2012. Varicella-zoster virus infects human embryonic stem cell-derived neurons and neurospheres but not pluripotent embryonic stem cells or early progenitors. J Virol 86:3211–3218. doi: 10.1128/JVI.06810-11. [DOI] [PMC free article] [PubMed] [Google Scholar]
- 32.Markus A, Lebenthal-Loinger I, Yang IH, Kinchington PR, Goldstein RS. 2015. An in vitro model of latency and reactivation of varicella zoster virus in human stem cell-derived neurons. PLoS Pathog 11:e1004885. doi: 10.1371/journal.ppat.1004885. [DOI] [PMC free article] [PubMed] [Google Scholar]
- 33.Muragaki Y, Timothy N, Leight S, Hempstead BL, Chao MV, Trojanowski JQ, Lee VM. 1995. Expression of trk receptors in the developing and adult human central and peripheral nervous system. J Comp Neurol 356:387–397. doi: 10.1002/cne.903560306. [DOI] [PubMed] [Google Scholar]
- 34.Phillips HS, Armanini MP. 1996. Expression of the trk family of neurotrophin receptors in developing and adult dorsal root ganglion neurons. Philos Trans R Soc Lond B Biol Sci 351:413–416. doi: 10.1098/rstb.1996.0036. [DOI] [PubMed] [Google Scholar]
- 35.Marmigère F, Ernfors P. 2007. Specification and connectivity of neuronal subtypes in the sensory lineage. Nat Rev Neurosci 8:114–127. doi: 10.1038/nrn2057. [DOI] [PubMed] [Google Scholar]
- 36.Flowerdew SE, Wick D, Himmelein S, Horn AK, Sinicina I, Strupp M, Brandt T, Theil D, Hufner K. 2013. Characterization of neuronal populations in the human trigeminal ganglion and their association with latent herpes simplex virus-1 infection. PLoS One 8:e83603. doi: 10.1371/journal.pone.0083603. [DOI] [PMC free article] [PubMed] [Google Scholar]
- 37.Liu Y, Ma Q. 2011. Generation of somatic sensory neuron diversity and implications on sensory coding. Curr Opin Neurobiol 21:52–60. doi: 10.1016/j.conb.2010.09.003. [DOI] [PMC free article] [PubMed] [Google Scholar]
- 38.Molliver DC, Wright DE, Leitner ML, Parsadanian AS, Doster K, Wen D, Yan Q, Snider WD. 1997. IB4-binding DRG neurons switch from NGF to GDNF dependence in early postnatal life. Neuron 19:849–861. doi: 10.1016/S0896-6273(00)80966-6. [DOI] [PubMed] [Google Scholar]
- 39.Josephson A, Widenfalk J, Trifunovski A, Widmer HR, Olson L, Spenger C. 2001. GDNF and NGF family members and receptors in human fetal and adult spinal cord and dorsal root ganglia. J Comp Neurol 440:204–217. doi: 10.1002/cne.1380. [DOI] [PubMed] [Google Scholar]
- 40.Fang X, Djouhri L, McMullan S, Berry C, Okuse K, Waxman SG, Lawson SN. 2005. trkA is expressed in nociceptive neurons and influences electrophysiological properties via Nav1.8 expression in rapidly conducting nociceptors. J Neurosci 25:4868–4878. doi: 10.1523/JNEUROSCI.0249-05.2005. [DOI] [PMC free article] [PubMed] [Google Scholar]
- 41.Lawson SN. 1992. Morphological and biochemical cell types of sensory neurons. Oxford University Press, Oxford, United Kingdom. [Google Scholar]
- 42.Margolis TP, Imai Y, Yang L, Vallas V, Krause PR. 2007. Herpes simplex virus type 2 (HSV-2) establishes latent infection in a different population of ganglionic neurons than HSV-1: role of latency-associated transcripts. J Virol 81:1872–1878. doi: 10.1128/JVI.02110-06. [DOI] [PMC free article] [PubMed] [Google Scholar]
- 43.Yang L, Voytek CC, Margolis TP. 2000. Immunohistochemical analysis of primary sensory neurons latently infected with herpes simplex virus type 1. J Virol 74:209–217. doi: 10.1128/JVI.74.1.209-217.2000. [DOI] [PMC free article] [PubMed] [Google Scholar]
- 44.Bertke AS, Ma A, Margolis MS, Margolis TP. 2013. Different mechanisms regulate productive herpes simplex virus 1 (HSV-1) and HSV-2 infections in adult trigeminal neurons. J Virol 87:6512–6516. doi: 10.1128/JVI.00383-13. [DOI] [PMC free article] [PubMed] [Google Scholar]
- 45.Hill JM, Garza HH Jr, Helmy MF, Cook SD, Osborne PA, Johnson EM Jr, Thompson HW, Green LC, O'Callaghan RJ, Gebhardt BM. 1997. Nerve growth factor antibody stimulates reactivation of ocular herpes simplex virus type 1 in latently infected rabbits. J Neurovirol 3:206–211. doi: 10.3109/13550289709018295. [DOI] [PubMed] [Google Scholar]
- 46.Raymon HK, Thode S, Zhou J, Friedman GC, Pardinas JR, Barrere C, Johnson RM, Sah DW. 1999. Immortalized human dorsal root ganglion cells differentiate into neurons with nociceptive properties. J Neurosci 19:5420–5428. [DOI] [PMC free article] [PubMed] [Google Scholar]
- 47.Wilson AC, Mohr I. 2012. A cultured affair: HSV latency and reactivation in neurons. Trends Microbiol 20:604–611. doi: 10.1016/j.tim.2012.08.005. [DOI] [PMC free article] [PubMed] [Google Scholar]
- 48.Maggioncalda J, Mehta A, Su YH, Fraser NW, Block TM. 1996. Correlation between herpes simplex virus type 1 rate of reactivation from latent infection and the number of infected neurons in trigeminal ganglia. Virology 225:72–81. doi: 10.1006/viro.1996.0576. [DOI] [PubMed] [Google Scholar]
- 49.Sawtell NM. 1998. The probability of in vivo reactivation of herpes simplex virus type 1 increases with the number of latently infected neurons in the ganglia. J Virol 72:6888–6892. [DOI] [PMC free article] [PubMed] [Google Scholar]
- 50.Mehta A, Maggioncalda J, Bagasra O, Thikkavarapu S, Saikumari P, Valyi-Nagy T, Fraser NW, Block TM. 1995. In situ DNA PCR and RNA hybridization detection of herpes simplex virus sequences in trigeminal ganglia of latently infected mice. Virology 206:633–640. doi: 10.1016/S0042-6822(95)80080-8. [DOI] [PubMed] [Google Scholar]
- 51.Held K, Junker A, Dornmair K, Meinl E, Sinicina I, Brandt T, Theil D, Derfuss T. 2011. Expression of herpes simplex virus 1-encoded microRNAs in human trigeminal ganglia and their relation to local T-cell infiltrates. J Virol 85:9680–9685. doi: 10.1128/JVI.00874-11. [DOI] [PMC free article] [PubMed] [Google Scholar]
- 52.Deleage C, Wietgrefe SW, Del Prete G, Morcock DR, Hao XP, Piatak M Jr, Bess J, Anderson JL, Perkey KE, Reilly C, McCune JM, Haase AT, Lifson JD, Schacker TW, Estes JD. 2016. Defining HIV and SIV reservoirs in lymphoid tissues. Pathog Immun 1:68–106. doi: 10.20411/pai.v1i1.100. [DOI] [PMC free article] [PubMed] [Google Scholar]
- 53.Sawtell NM, Thompson RL. 1992. Rapid in vivo reactivation of herpes simplex virus in latently infected murine ganglionic neurons after transient hyperthermia. J Virol 66:2150–2156. [DOI] [PMC free article] [PubMed] [Google Scholar]
- 54.Birmanns B, Reibstein I, Steiner I. 1993. Characterization of an in vivo reactivation model of herpes simplex virus from mice trigeminal ganglia. J Gen Virol 74(Pt 11):2487–2491. doi: 10.1099/0022-1317-74-11-2487. [DOI] [PubMed] [Google Scholar]
- 55.Kook I, Henley C, Meyer F, Hoffmann FG, Jones C. 2015. Bovine herpesvirus 1 productive infection and immediate early transcription unit 1 promoter are stimulated by the synthetic corticosteroid dexamethasone. Virology 484:377–385. doi: 10.1016/j.virol.2015.06.010. [DOI] [PubMed] [Google Scholar]
- 56.Arthur JL, Scarpini CG, Connor V, Lachmann RH, Tolkovsky AM, Efstathiou S. 2001. Herpes simplex virus type 1 promoter activity during latency establishment, maintenance, and reactivation in primary dorsal root neurons in vitro. J Virol 75:3885–3895. doi: 10.1128/JVI.75.8.3885-3895.2001. [DOI] [PMC free article] [PubMed] [Google Scholar]
- 57.Reichardt LF. 2006. Neurotrophin-regulated signalling pathways. Philos Trans R Soc Lond B Biol Sci 361:1545–1564. doi: 10.1098/rstb.2006.1894. [DOI] [PMC free article] [PubMed] [Google Scholar]
- 58.Genç B, Ulupinar E, Erzurumlu RS. 2005. Differential Trk expression in explant and dissociated trigeminal ganglion cell cultures. J Neurobiol 64:145–156. doi: 10.1002/neu.20134. [DOI] [PMC free article] [PubMed] [Google Scholar]
- 59.Sedarati F, Margolis TP, Stevens JG. 1993. Latent infection can be established with drastically restricted transcription and replication of the HSV-1 genome. Virology 192:687–691. doi: 10.1006/viro.1993.1089. [DOI] [PubMed] [Google Scholar]
- 60.Stevens JG, Wagner EK, Devi-Rao GB, Cook ML, Feldman LT. 1987. RNA complementary to a herpesvirus alpha gene mRNA is prominent in latently infected neurons. Science 235:1056–1059. doi: 10.1126/science.2434993. [DOI] [PubMed] [Google Scholar]
- 61.Stevens JG, Haarr L, Porter DD, Cook ML, Wagner EK. 1988. Prominence of the herpes simplex virus latency-associated transcript in trigeminal ganglia from seropositive humans. J Infect Dis 158:117–123. doi: 10.1093/infdis/158.1.117. [DOI] [PubMed] [Google Scholar]
- 62.Krause PR, Croen KD, Straus SE, Ostrove JM. 1988. Detection and preliminary characterization of herpes simplex virus type 1 transcripts in latently infected human trigeminal ganglia. J Virol 62:4819–4823. [DOI] [PMC free article] [PubMed] [Google Scholar]
- 63.Rock DL, Nesburn AB, Ghiasi H, Ong J, Lewis TL, Lokensgard JR, Wechsler SL. 1987. Detection of latency-related viral RNAs in trigeminal ganglia of rabbits latently infected with herpes simplex virus type 1. J Virol 61:3820–3826. [DOI] [PMC free article] [PubMed] [Google Scholar]
- 64.Knipe DM, Cliffe A. 2008. Chromatin control of herpes simplex virus lytic and latent infection. Nat Rev Microbiol 6:211–221. doi: 10.1038/nrmicro1794. [DOI] [PubMed] [Google Scholar]
- 65.Javier RT, Stevens JG, Dissette VB, Wagner EK. 1988. A herpes simplex virus transcript abundant in latently infected neurons is dispensable for establishment of the latent state. Virology 166:254–257. doi: 10.1016/0042-6822(88)90169-9. [DOI] [PubMed] [Google Scholar]
- 66.Leib DA, Bogard CL, Kosz-Vnenchak M, Hicks KA, Coen DM, Knipe DM, Schaffer PA. 1989. A deletion mutant of the latency-associated transcript of herpes simplex virus type 1 reactivates from the latent state with reduced frequency. J Virol 63:2893–2900. [DOI] [PMC free article] [PubMed] [Google Scholar]
- 67.Steiner I, Spivack JG, Lirette RP, Brown SM, MacLean AR, Subak-Sharpe JH, Fraser NW. 1989. Herpes simplex virus type 1 latency-associated transcripts are evidently not essential for latent infection. EMBO J 8:505–511. [DOI] [PMC free article] [PubMed] [Google Scholar]
- 68.Thompson RL, Sawtell NM. 1997. The herpes simplex virus type 1 latency-associated transcript gene regulates the establishment of latency. J Virol 71:5432–5440. [DOI] [PMC free article] [PubMed] [Google Scholar]
- 69.Ramakrishnan R, Poliani PL, Levine M, Glorioso JC, Fink DJ. 1996. Detection of herpes simplex virus type 1 latency-associated transcript expression in trigeminal ganglia by in situ reverse transcriptase PCR. J Virol 70:6519–6523. [DOI] [PMC free article] [PubMed] [Google Scholar]
- 70.Sawtell NM. 1997. Comprehensive quantification of herpes simplex virus latency at the single-cell level. J Virol 71:5423–5431. [DOI] [PMC free article] [PubMed] [Google Scholar]
- 71.Sawtell NM, Poon DK, Tansky CS, Thompson RL. 1998. The latent herpes simplex virus type 1 genome copy number in individual neurons is virus strain specific and correlates with reactivation. J Virol 72:5343–5350. [DOI] [PMC free article] [PubMed] [Google Scholar]
- 72.LaGuardia JJ, Cohrs RJ, Gilden DH. 2000. Numbers of neurons and non-neuronal cells in human trigeminal ganglia. Neurol Res 22:565–566. [DOI] [PubMed] [Google Scholar]
- 73.Cai GY, Pizer LI, Levin MJ. 2002. Fractionation of neurons and satellite cells from human sensory ganglia in order to study herpesvirus latency. J Virol Methods 104:21–32. doi: 10.1016/S0166-0934(02)00032-0. [DOI] [PubMed] [Google Scholar]
- 74.Zhou XF, Rush RA, McLachlan EM. 1996. Differential expression of the p75 nerve growth factor receptor in glia and neurons of the rat dorsal root ganglia after peripheral nerve transection. J Neurosci 16:2901–2911. [DOI] [PMC free article] [PubMed] [Google Scholar]
- 75.Cliffe AR, Arbuckle JH, Vogel JL, Geden MJ, Rothbart SB, Cusack CL, Strahl BD, Kristie TM, Deshmukh M. 2015. Neuronal stress pathway mediating a histone methyl/phospho switch is required for herpes simplex virus reactivation. Cell Host Microbe 18:649–658. doi: 10.1016/j.chom.2015.11.007. [DOI] [PMC free article] [PubMed] [Google Scholar]
- 76.Kristie TM. 2015. Dynamic modulation of HSV chromatin drives initiation of infection and provides targets for epigenetic therapies. Virology 479–480:555–561. [DOI] [PMC free article] [PubMed] [Google Scholar]
- 77.Kutluay SB, DeVos SL, Klomp JE, Triezenberg SJ. 2009. Transcriptional coactivators are not required for herpes simplex virus type 1 immediate-early gene expression in vitro. J Virol 83:3436–3449. doi: 10.1128/JVI.02349-08. [DOI] [PMC free article] [PubMed] [Google Scholar]
- 78.Herrera FJ, Triezenberg SJ. 2004. VP16-dependent association of chromatin-modifying coactivators and underrepresentation of histones at immediate-early gene promoters during herpes simplex virus infection. J Virol 78:9689–9696. doi: 10.1128/JVI.78.18.9689-9696.2004. [DOI] [PMC free article] [PubMed] [Google Scholar]
- 79.Sloutskin A, Yee MB, Kinchington PR, Goldstein RS. 2014. Varicella-zoster virus and herpes simplex virus 1 can infect and replicate in the same neurons whether co- or superinfected. J Virol 88:5079–5086. doi: 10.1128/JVI.00252-14. [DOI] [PMC free article] [PubMed] [Google Scholar]
- 80.Koyuncu OO, Hogue IB, Enquist LW. 2013. Virus infections in the nervous system. Cell Host Microbe 13:379–393. doi: 10.1016/j.chom.2013.03.010. [DOI] [PMC free article] [PubMed] [Google Scholar]
- 81.Hafezi W, Lorentzen EU, Eing BR, Muller M, King NJ, Klupp B, Mettenleiter TC, Kuhn JE. 2012. Entry of herpes simplex virus type 1 (HSV-1) into the distal axons of trigeminal neurons favors the onset of nonproductive, silent infection. PLoS Pathog 8:e1002679. doi: 10.1371/journal.ppat.1002679. [DOI] [PMC free article] [PubMed] [Google Scholar]
- 82.Bresnahan WA, Hultman GE, Shenk T. 2000. Replication of wild-type and mutant human cytomegalovirus in life-extended human diploid fibroblasts. J Virol 74:10816–10818. doi: 10.1128/JVI.74.22.10816-10818.2000. [DOI] [PMC free article] [PubMed] [Google Scholar]
- 83.Ottosen S, Herrera FJ, Doroghazi JR, Hull A, Mittal S, Lane WS, Triezenberg SJ. 2006. Phosphorylation of the VP16 transcriptional activator protein during herpes simplex virus infection and mutational analysis of putative phosphorylation sites. Virology 345:468–481. doi: 10.1016/j.virol.2005.10.011. [DOI] [PMC free article] [PubMed] [Google Scholar]
- 84.Greenside DR. 2000. VP16 localization during herpes simplex-1 infection. MSc thesis Michigan State University, East Lansing, MI. [Google Scholar]
- 85.Catez F, Picard C, Held K, Gross S, Rousseau A, Theil D, Sawtell N, Labetoulle M, Lomonte P. 2012. HSV-1 genome subnuclear positioning and associations with host-cell PML-NBs and centromeres regulate LAT locus transcription during latency in neurons. PLoS Pathog 8:e1002852. doi: 10.1371/journal.ppat.1002852. [DOI] [PMC free article] [PubMed] [Google Scholar]
- 86.Benjamini Y, Yekutieli D. 2005. False discovery rate-adjusted multiple confidence intervals for selected parameters. J Am Stat Assoc 100:71–81. doi: 10.1198/016214504000001907. [DOI] [Google Scholar]
- 87.Capes-Davis A, Theodosopoulos G, Atkin I, Drexler HG, Kohara A, MacLeod RA, Masters JR, Nakamura Y, Reid YA, Reddel RR, Freshney RI. 2010. Check your cultures! A list of cross-contaminated or misidentified cell lines. Int J Cancer 127:1–8. doi: 10.1002/ijc.25242. [DOI] [PubMed] [Google Scholar]