

ABSTRACT
Severe acute respiratory syndrome coronavirus (SARS-CoV) is a highly pathogenic respiratory virus that causes morbidity and mortality in humans. After infection with SARS-CoV, the acute lung injury caused by the virus must be repaired to regain lung function. A dysregulation in this wound healing process leads to fibrosis. Many survivors of SARS-CoV infection develop pulmonary fibrosis (PF), with higher prevalence in older patients. Using mouse models of SARS-CoV pathogenesis, we have identified that the wound repair pathway, controlled by the epidermal growth factor receptor (EGFR), is critical to recovery from SARS-CoV-induced tissue damage. In mice with constitutively active EGFR [EGFR(DSK5) mice], we find that SARS-CoV infection causes enhanced lung disease. Importantly, we show that during infection, the EGFR ligands amphiregulin and heparin-binding EGF-like growth factor (HB-EGF) are upregulated, and exogenous addition of these ligands during infection leads to enhanced lung disease and altered wound healing dynamics. Our data demonstrate a key role of EGFR in the host response to SARS-CoV and how it may be implicated in lung disease induced by other highly pathogenic respiratory viruses.
IMPORTANCE PF has many causative triggers, including severe respiratory viruses such as SARS-CoV. Currently there are no treatments to prevent the onset or limit the progression of PF, and the molecular pathways underlying the development of PF are not well understood. In this study, we identified a role for the balanced control of EGFR signaling as a key factor in progression to PF. These data demonstrate that therapeutic treatment modulating EGFR activation could protect against PF development caused by severe respiratory virus infection.
KEYWORDS: Coronavirus, EGFR, fibrosis, SARS-CoV, viral pathogenesis
INTRODUCTION
Severe acute respiratory syndrome coronavirus (SARS-CoV) is a highly pathogenic respiratory virus that infected over 8,000 people, with a ∼10% case fatality rate, from 2003 to 2004. In the early stages, SARS-CoV infection in the human lung causes acute lung injury (ALI) leading to diffuse alveolar damage (DAD), hyaline membrane formation, and interstitial thickening. In the intermediate and later stages of the disease (2 to 8 weeks after infection), signs of fibrosis begin to emerge in the lungs (1). Survivors of SARS-CoV infection have no detectable SARS-CoV virus in nasopharyngeal fluid by ∼20 days postinfection (2). In follow-up studies of survivors, radiographic abnormalities in lungs are commonly found, the most notable being a “ground glass” appearance, a hallmark of pulmonary fibrosis (PF) (3). In a 1-year follow-up study, pulmonary fibrosis was observed in the lungs of 27.5% of SARS survivors (n = 97) (4). Importantly, a major comorbidity associated with an increased risk of developing pulmonary fibrosis after SARS-CoV infection was advanced age (5). It is currently not understood why advanced age is associated with an increased progression from lung infection to pulmonary fibrosis.
The repair of lung tissue after infection or mechanical trauma normally occurs in a controlled series of events beginning with damage signals sent from infected cells, which recruit inflammatory cells, which then induce secretion of growth factors, which activates basement membrane repair and finally leads to the replacement of injured tissue (6, 7). Under normal circumstances, the wound healing response is downregulated once the injury is repaired. However, when either the infectious burden overwhelms the system (e.g., with SARS-CoV) or there is persistent damage (e.g., with hepatitis C virus infection), the wound healing response can become dysregulated, resulting in scarring and fibrosis (8–10). When fibrosis occurs, it leads to reduced lung function, resulting in a low quality of life and often death (11).
There are limited treatment options for pulmonary fibrosis. Traditionally, corticosteroids are used for the treatment of acute respiratory distress syndrome (ARDS) and pulmonary fibrosis (PF). However, during a viral infection, these interventions dampen the immune response and often result in worsened disease (11, 12). Due to this lack of therapeutic options, there is a critical need to understand the molecular pathways involved in the development of fibrosis, thus helping to identify novel targets for therapy.
We have used mouse infections with SARS-CoV as a model system to aid in identifying pathways that lead to virus-induced fibrosis. We have reported previously that STAT1−/− mice on the C57BL/6J background were able to clear SARS-CoV from their lungs at 9 days postinfection but showed severe fibrotic lesions (13) compared to those in wild-type (WT) mice. Additionally, this induction of fibrosis by SARS-CoV was independent of the role of type I, type II, and type III interferon receptors, indicating a novel role for STAT1 in fibrosis development (14). In our current study, we demonstrated that wound healing- and fibrosis-related genes are highly upregulated in STAT1−/− mice infected with SARS-CoV. Many studies have identified the epidermal growth factor receptor (EGFR) pathway as a key pathway controlling the wound healing response (15, 16) and fibrosis (17–20). Interestingly, STAT1 is activated upon ligand binding to EGFR and negatively regulates the proliferative effects of EGFR signaling (21, 22). We hypothesized that EGFR signaling was overactive in STAT1−/− mice, resulting in a dysregulated wound healing and proliferative response resulting in fibrosis. Mice containing a constitutively active EGFR were infected with SARS-CoV, which results in increased lung pathology and an increase in fibrosis gene induction. The key driver of this pathway in wild-type mice is the ligands that are released from damaged cells to bind EGFR and activate the wound healing response. There are seven canonical ligands that bind and activate EGFR: epidermal growth factor (EGF), heparin-binding EGF-like growth factor (HB-EGF), amphiregulin (AREG), epiregulin (EREG), betacellulin (BTC), epigen (EGN), and transforming growth factor α (TGF-α). We find that AREG and HB-EGF are highly upregulated during SARS-CoV infection, and in combination with SARS-CoV infection they are able to induce severe lung pathology when added exogenously to mice, demonstrating the role of EGFR activation in controlling lung repair. Taken together, our results demonstrate that EGFR signaling is a key regulator of SARS-CoV-induced lung damage and that targeting this response could protect against the development of pulmonary fibrosis caused by respiratory viruses such as SARS-CoV.
RESULTS
Wound healing and fibrosis genes are upregulated in STAT1−/− mice.
We have previously demonstrated that SARS-CoV infection of STAT1−/− mice induced severe lung pathology and fibrotic lesions throughout the lungs (23). We sought to further evaluate the role of STAT1 in wound healing and fibrosis by infecting 10- to 12-week-old STAT1−/− mice with either phosphate-buffered saline (PBS) or 1 × 10⁵ PFU/mouse of SARS-CoV(MA15) to analyze mRNA transcripts induced during infection. Microarray and transcriptome analyses were performed on total RNA isolated from mouse lungs at days 2, 5, and 9 postinfection (23). Analysis of the transcriptome of lungs postinfection identified that a subset of wound healing pathway genes were induced in the lungs of mice after infection with SARS-CoV(MA15) (Fig. 1A and Table 1). During infection, a number of genes associated with the wound healing response (e.g., CCL11, CCL3, CXCL1, IL-6, and IFNa) are upregulated in both WT and STAT1−/− lungs at day 2 postinfection. In wild-type mice, the expression levels of most of these genes return to baseline by day 9 postinfection. However, in SARS-CoV-infected STAT1−/− mice, most wound healing-associated genes remain at elevated levels through 9 days postinfection. A similar trend is observed in STAT1−/− mice for genes associated with pulmonary fibrosis (Fig. 1B and Table 2). This suggests that a dysregulation of the wound healing and fibrosis pathways in these mice may be leading to the enhanced pathology previously noted.
FIG 1.
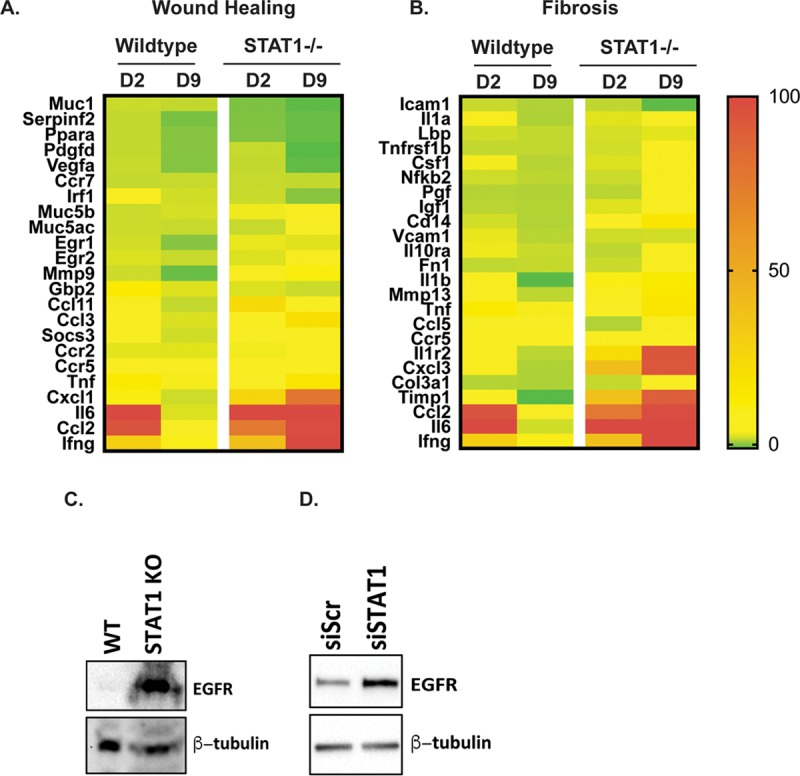
STAT1−/− mice show sustained expression of wound healing and fibrosis genes. (A and B) Transcriptome analysis was performed on RNA extracted from SARS-CoV(MA15)-infected wild-type and STAT1 mouse lungs at 2 and 9 days postinfection. Expression values were normalized to values from PBS-infected mice to obtain fold induction. Heat maps of fold induction of wound healing-associated genes (A) and fibrosis-associated genes (B) were generated. The color gradient on right corresponds shows the level of induction. (C) Western blot analysis of protein lysates from the livers of wild-type and B6/STAT1−/− mice probed with anti-EGFR and anti-β-tubulin antibodies. (D) Western blot analysis of protein lysate prepared from NIH 3T3(7d) cells constitutively overexpressing EGFR (NIH 3T3-HER1) that have been transfected with either scrambled siRNA (siScr) or STAT1-targeted siRNAs (siSTAT1) and probed using anti-EGFR and anti-β-tubulin (as a loading control) antibodies.
TABLE 1.
Wound healing gene expression in STAT1−/− micea
| Gene symbol | Relative expression in: |
|||
|---|---|---|---|---|
| WT mice |
STAT1−/− mice |
|||
| Day 2 | Day 9 | Day 2 | Day 9 | |
| Muc1 | 1.29986 | 1.04614 | −1.51015 | −2.55651 |
| Serpinf2 | 1.01115 | −1.63573 | −1.38256 | −2.18101 |
| Ppara | 1.00125 | −1.08087 | −1.29986 | −2.19736 |
| Pdgfd | 1.06518 | −1.06871 | 1.1381 | −2.70099 |
| Vegfa | 1.23618 | −1.21831 | 1.04422 | −2.43374 |
| Ccr7 | 1.08586 | 1.18972 | 1.16655 | 1.04476 |
| Irf1 | 4.04691 | 1.52281 | 1.26393 | −1.01238 |
| Muc5b | 1.3183 | 1.6797 | 2.70855 | 4.56796 |
| Muc5ac | 1.35509 | 1.21457 | 1.17111 | 5.33632 |
| Egr1 | 1.60686 | −1.04595 | 2.45153 | 2.09479 |
| Egr2 | 1.92212 | 1.19719 | 1.93977 | 3.80375 |
| Mmp9 | 1.37307 | −2.14111 | 3.74189 | 11.27213 |
| Gbp2 | 12.69319 | 2.0167 | 1.93066 | 1.3219 |
| Ccl11 | 3.92026 | 1.05249 | 22.86222 | 5.56046 |
| Ccl3 | 7.76705 | 1.87718 | 8.31221 | 20.41055 |
| Socs3 | 4.46954 | 1.50706 | 7.46821 | 6.87737 |
| Ccr2 | 2.24554 | 2.15301 | 2.75011 | 3.85156 |
| Ccr5 | 4.60715 | 4.08151 | 4.72431 | 8.34201 |
| Tnf | 13.19841 | 2.92891 | 5.64845 | 16.35162 |
| Cxcl1 | 10.83663 | 1.41553 | 25.88305 | 78.11474 |
| Il6 | 100 | 1.92978 | 100 | 100 |
| Ccl2 | 94.86786 | 5.16725 | 75.92502 | 98.44142 |
| Ifng | 29.23737 | 9.98188 | 37.89887 | 100 |
The gene expression values were used to create the heat maps in Fig. 1A.
TABLE 2.
Fibrosis gene expression in STAT1−/− micea
| Gene symbol | Relative expression in: |
|||
|---|---|---|---|---|
| WT mice |
STAT1−/− mice |
|||
| Day 2 | Day 9 | Day 2 | Day 9 | |
| Icam1 | 1.69378 | 1.1068 | 1.47573 | −1.00647 |
| Il1a | 3.10717 | 1.05043 | 2.35623 | 5.0465 |
| Lbp | 1.9229 | 1.53939 | 2.04328 | 2.43989 |
| Tnfrsf1b | 1.55513 | 1.53192 | 1.94174 | 4.41983 |
| Csf1 | 2.91465 | 1.25105 | 2.24403 | 4.06079 |
| Nfkb2 | 1.86125 | 1.40111 | 1.79161 | 3.39869 |
| Pgf | 1.21993 | 1.11856 | 1.33818 | 4.45127 |
| Igf1 | 1.36038 | 1.19207 | 2.30448 | 5.70829 |
| Cd14 | 1.96933 | 1.13208 | 5.9869 | 15.69982 |
| Vcam1 | 2.59025 | 1.29817 | 1.87524 | 1.98274 |
| Il10ra | 2.75582 | 1.74685 | 1.45605 | 3.15495 |
| Fn1 | 1.51984 | 1.64266 | 1.75948 | 4.56116 |
| Il1b | 4.1476 | −1.09942 | 10.4967 | 12.77579 |
| Mmp13 | 4.82245 | 1.46204 | 3.69105 | 14.36081 |
| Tnf | 13.19841 | 2.92891 | 5.64845 | 16.35162 |
| Ccl5 | 7.0727 | 7.4746 | 1.14224 | 3.57468 |
| Ccr5 | 4.60715 | 4.08151 | 4.72431 | 8.34201 |
| Il1r2 | 6.41685 | 1.37701 | 21.24623 | 93.87097 |
| Cxcl3 | 3.16254 | 1.08293 | 39.21717 | 93.56942 |
| Col3a1 | 1.22402 | 1.06237 | 1.63512 | 5.99945 |
| Timp1 | 8.65571 | −1.12833 | 37.49491 | 89.14169 |
| Ccl2 | 94.86786 | 5.16725 | 75.92502 | 98.44142 |
| Il6 | 100 | 1.92978 | 100 | 100 |
| Ifng | 29.23737 | 9.98188 | 37.89887 | 100 |
The gene expression values were used to create the heat maps in Fig. 1B.
The EGFR pathway is upregulated in STAT1−/− mice.
Previous studies on repair of damaged tissue, regulation of wound healing, and development of fibrosis have identified EGFR signaling as being a key modulator of this response (15–20). Our transcriptomic pathway analysis identified epidermal growth factor receptor (EGFR) as being a key regulator of many of the wound healing genes identified after SARS-CoV infection. We hypothesized that the increased wound healing response in STAT1−/− mice may be due to differences in basal EGFR protein levels between mouse strains. To test this, we performed Western blotting on protein isolated from the liver tissue of wild-type and STAT1−/− mice and found that there are significantly elevated levels of EGFR in STAT1−/− mice compared to wild-type mice, suggesting that the lack of STAT1 may affect basal EGFR protein levels (Fig. 1C). There is known interplay between EGFR and STAT1, with activated EGFR recruiting and subsequently activating STAT1 (22). STAT1 in turn suppresses the proliferative effects of EGFR signaling (21). However, the details of how STAT1 regulates EGFR are not well understood.
In an attempt to further investigate the role of STAT1 in regulating EGFR protein expression in a simpler system, we obtained NIH 3T3 cells constitutively expressing EGFR (called NIH 3T3-HER1 cells) (24). We hypothesized that STAT1 protein levels may regulate EGFR signaling and/or expression. To investigate this, STAT1 mRNA was knocked down in NIH 3T3-HER1 cells using small interfering RNA (siRNA), and the expression of EGFR was compared to that in cells treated with scrambled siRNA by Western blotting (Fig. 1D). STAT1 knockdown resulted in significantly higher levels of EGFR protein than in control cells. This result is consistent with higher EGFR protein levels found in STAT1−/− mouse liver, suggesting that STAT1 deficiency leads to higher levels of EGFR protein. The upregulation of EGFR could produce increased but an uncontrolled wound healing, leading to fibroblast proliferation and fibrosis.
EGFR expression in EGFR(DSK5) mice.
To investigate the effects of EGFR overactivation during SARS-CoV infection, we utilized a strain of mice that have a mutated EGFR gene leading to constitutive activation of EGFR, called EGFR(DSK5) mice (25). The EGFR encoded by the DSK5 allele carries a point mutation in the kinase domain resulting in a constitutively active EGFR. We characterized the mRNA levels of Egfr in the lungs of wild-type and EGFR(DSK5) mice with and without SARS-CoV infection and found that gene expression of Egfr remained relatively unchanged in both wild-type and EGFR(DSK5) mice during a SARS-CoV(MA15) infection (Fig. 2A). Once EGFR is activated, it is internalized and undergoes lysosomal degradation (25–29). This recycling is continuous in EGFR(DSK5) mice, reducing total EGFR(DSK5) cellular protein. In agreement with previously published work, we also observed decreased levels of EGFR(DSK5) in the livers of 10- to 12-week-old EGFR(DSK5) mice (Fig. 2B). We were unable to detect EGFR in the lungs of any mice due to technical difficulties. To circumvent this technical issue, we isolated fibroblasts from lungs of wild-type and EGFR(DSK5) mice and looked for EGFR protein levels by Western blotting in the presence and absence of EGFR ligands (Fig. 2C and D). Fibroblasts isolated from EGFR(DSK5) mice showed lower levels of EGFR than wild-type fibroblasts (Fig. 2C, upper panel). Adding EGFR ligands (a combination of HB-EGF and AREG) resulted in a further reduction of EGFR in EGFR(DSK5) fibroblasts, whereas wild-type fibroblasts maintained their levels. An increase in phospho-ERK1/2 levels was seen after ligand addition, demonstrating that the EGFR pathway was activated in both wild-type and EGFR(DSK5) fibroblasts (Fig. 2C, middle and lower panels). These data suggest that there is a novel positive and negative feedback loop in activation and expression levels of both proteins.
FIG 2.
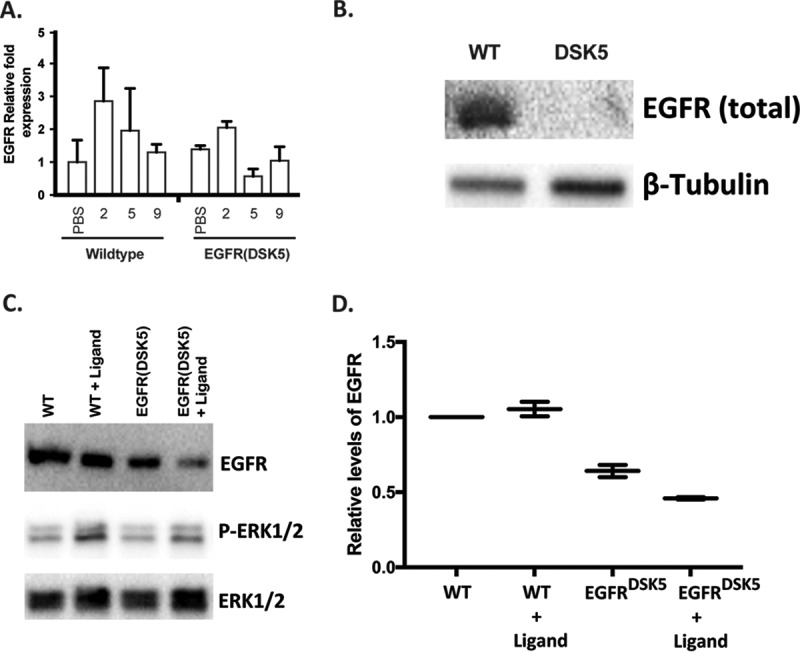
EGFR(DSK5) mice express similar levels of RNA but show lower levels of protein in lung fibroblasts and the liver. (A) RNA from lungs of 10- to 12-week-old wild-type EGFR(DSK5) mice infected with PBS or SARS-CoV(MA15) for 2, 5, and 9 days postinfection were analyzed for relative EGFR mRNA by qRT-PCR. (B) Protein lysates from the livers of 12-week-old wild-type and EGFR(DSK5) mice were analyzed by Western blotting using anti-EGFR and anti-β-tubulin antibodies. (C) Lung fibroblasts isolated from 12-week-old wild-type and EGFR(DSK5) mice were treated with an 2.5 ng/ml of HB-EGF and AREG each, and Western blot analysis was performed on protein lysates using anti-EGFR, anti-phopho-ERK1/2, and anti-total ERK1/2 antibodies. (D) Quantitation of bands from panel C, showing EGFR band intensities normalized to total ERK1/2 intensity.
SARS-CoV infection of EGFR(DSK5) mice leads to enhanced lung damage.
The in vitro analysis with EGFR(DSK5) fibroblasts suggests that the constitutively active EGFR(DSK5) allele could lead to EGFR signaling dysregulation which may alter pathogenesis of SARS-CoV in these mice compared to wild-type mice. To determine if an overactive EGFR signaling pathway could lead to increased pathogenesis of SARS-CoV, we infected 10- to 12-week-old wild-type and EGFR(DSK5) mice intranasally with SARS-CoV(MA15) or PBS and monitored them for 9 days. Mice were weighed daily, and groups were euthanized for analysis at days 2, 5, and 9 postinfection. Mice that received PBS showed minimal weight loss during the experiment (Fig. 3A). Wild-type 129S1 and EGFR(DSK5) mice infected with SARS-CoV(MA15) lost ∼12% of their body weight through 4 days postinfection and then recovered to their starting weight by 9 days postinfection (Fig. 3A). Other than weight loss, there were no obvious clinical presentations of disease in either mouse strain. Lungs were harvested at days 2, 5, and 9 postinfection for analysis of virus titer. Wild-type and EGFR(DSK5) mouse lungs had similar virus titers at days 2 and 5 postinfection, and both showed clearance by day 9 postinfection (Fig. 3B).
FIG 3.

SARS-CoV(MA15)-infected EGFR(DSK5) mice show increased lung pathology at day 9 postinfection. (A) Ten- to 12-week-old wild-type and EGFR(DSK5) mice were intranasally inoculated with either PBS or 105 PFU of SARS-CoV(MA15) per mouse. Weight loss is expressed as percentage of starting weight, and error bars indicate standard deviations (n = 3). (B) Viral titer of SARS-CoV(MA15) in the lungs of infected wild-type and EGFR(DSK5) mice. (C) H&E-stained section of 4% PFA-fixed lungs from PBS- and SARS-CoV(MA15)-infected wild-type and EGFR(DSK5) mice at 2 and 9 days postinfection (10× magnification). The experiment was performed with n = 3 per group, and images are representative of each group. (D) Immunohistochemistry was performed on 5-μm-thick sections of lungs from PBS- and SARS-CoV(MA15)-infected wild-type and EGFR(DSK5) mice with an anti-PCNA antibody. The chromogenic reaction was performed using a DAB/HRP kit and shows a brown stain for PCNA. (E) Western blot analysis of lung lysates from PBS- and SARS-CoV(MA15)-infected wild-type and EGFR(DSK5) mice probed with anti-PCNA and anti-β-tubulin antibodies. A representative blot is shown. (F) Quantitation of PCNA expression from Western blots (n = 3). Values for PCNA levels were normalized to β-tubulin, and all values are expressed relative to PCNA levels in PBS-treated wild-type mice.
Lungs were fixed in 4% paraformaldehyde (PFA) at each time point, sectioned, and stained with hematoxylin and eosin (H&E) for histopathological analysis. At day 2 postinfection, both wild-type and EGFR(DSK5) mice showed infection of ciliated epithelial cells, noted by denudation of bronchiolar epithelial cells and mild perivascular cuffing (Fig. 3C). At day 9 postinfection, wild-type mice infected with SARS-CoV(MA15) resolved the infection with repair of the airway structure and minimal inflammation. While no significant effect was seen in weight loss or viral titer, the EGFR(DSK5) mice infected with SARS-CoV(MA15) exhibited severe pathology in their lungs (Fig. 3C, lower right panel). There was increased perivascular inflammation with interstitial edema, and the alveolar and interstitial spaces were filled with proteinaceous fluid and inflammatory cells. These data suggest that constitutive activation of EGFR results in more severe lung pathology, independent of virus titers and clinical signs, during SARS-CoV infection.
EGFR(DSK5) mouse lungs display cellular overproliferation after SARS-CoV(MA15) infection.
One of the key events in the wound healing process is the proliferation of fibroblasts followed by the secretion of fresh extracellular matrix (ECM) components on which new tissue is built (6, 30, 31). This is followed by a contraction of the fibroblast population by apoptosis and is an important step in effective resolution of wound healing (32). A failure to initiate the contraction of fibroblasts can result in fibrosis, and overproliferation of fibroblasts near the airways is often seen during pulmonary fibrosis (6). Since the activation of EGFR is a key signal for fibroblasts to proliferate (33–35), we reasoned that the effect of constitutively active EGFR on wound healing may result in exaggerated proliferation of cells in response to lung damage after SARS-CoV infection. To determine if an overactive EGFR is driving an exaggerated proliferative response during infection, we performed immunohistochemical (IHC) staining for proliferating cell nuclear antigen (PCNA), which is a marker of actively proliferating cells. Lung sections from wild-type and EGFR(DSK5) mice infected with SARS-CoV(MA15) or PBS at day 9 postinfection were stained with anti-PCNA antibody (Fig. 3D). PCNA is localized to the nucleus in proliferating cells and can be seen as darkly staining nuclei in positive cells. Airways from PBS-inoculated wild-type and EGFR(DSK5) mice had few if any PCNA-positive cells. At day 9 postinfection with SARS-CoV(MA15), wild-type lungs showed only disparate cells positive for PCNA, signifying the resolution of the wound healing response. In contrast, lungs from SARS-CoV(MA15)-infected EGFR(DSK5) mice displayed high levels of PCNA-positive nuclei in cells surrounding the airways, demonstrating that these lungs had sustained cellular proliferation implying unresolved wound healing activity. We compared the amounts of PCNA in total lung homogenates of wild-type or EGFR(DSK5) mice inoculated with either PBS or SARS-CoV during a time course of infection by Western blotting (Fig. 3E and F). At days 2 and 5 postinfection similar amounts of PCNA were observed in both wild-type and EGFR(DSK5) mice. By day 9 postinfection, the level of PCNA had decreased in the wild-type mice. However, in EGFR(DSK5) mice, the level of PCNA remained significantly elevated (P = 0.036), corroborating the IHC staining (Fig. 3E and F).
Increased pathogenesis in aged EGFR(DSK5) mice compared to aged wild-type mice.
Although we observed striking differences in lung pathology between wild-type and EGFR(DSK5) mice, we did not see a difference in the clinical outcome. All 10- to 12-week-old wild-type and EGFR(DSK5) mice survived the SARS-CoV(MA15) infection and followed similar trajectories of recovery. The adverse sequelae associated with SARS-CoV in human patients were observed primarily in the elderly (1, 36). It has also been reported that in some rodent models EGFR expression increases with age and show dysregulated activation (37, 38). We reasoned that older EGFR(DSK5) mice may show a more marked difference in lung pathology than older wild-type mice. Typically, aged mouse models are >18 months old; however, these mice are immunoscenescent, which would confound our results on wound healing and fibrosis. We chose 20- to 24-week-old mice as an aged model such that they have markers of wound healing dysfunction on a background of immune competence. To determine the effects of constitutively activated EGFR signaling in the context of age, we infected 20- to 24-week-old wild-type and EGFR(DSK5) mice with 1 × 10⁵, 1 × 10⁴, and 1 × 10³ PFU/mouse of SARS-CoV(MA15) by intranasal inoculation and followed pathogenesis for 9 days. The doses of 1 × 10⁵ and 1 × 10⁴ PFU/mouse were 30% lethal in older wild-type mice (n = 10) and 80% lethal in older EGFR(DSK5) mice (n = 10) by 5 days postinfection (Fig. 4A). The dose of 1 × 10³ PFU/mouse was not lethal in older wild-type or EGFR(DSK5) mice, and both groups showed similar weight loss and recovery profiles over 9 days postinfection (Fig. 4B). Lung sections from both wild-type and EGFR(DSK5) mice infected at 1 × 10³ PFU/mouse at day 9 postinfection were stained with H&E, and their pathologies were compared to that of PBS-inoculated mice (Fig. 4C). Histological analysis found that in PBS-inoculated 20-week-old wild-type or EGFR(DSK5) mice, there was no damage or inflammation. SARS-CoV-infected older EGFR(DSK5) mice had higher levels of lung damage than older wild-type mice. We observed increased edema, perivascular cuffing, interstitial inflammation, and cuffing around airways. PCNA levels were elevated in EGFR(DSK5) mouse lungs compared to those of the wild type, indicating actively proliferating cells (Fig. 4D and E).
FIG 4.

Older EGFR(DSK5) mice are more susceptible to a SARS-CoV(MA15) infection than younger mice. (A) Ten- to 12-week-old (young) and 20- to 24-week-old (old) mice were intranasally inoculated with PBS or SARS-CoV(MA15) at 104 or 105 PFU/mouse. Survival was monitored for 9 days postinfection. (B) Twenty- to 24-week-old mice were intranasally inoculated with either PBS or SARS-CoV(MA15) at 103 PFU per mouse. Weight loss was monitored for 9 days postinfection. Error bars indicate standard deviation (n = 5). (C) H&E-stained sections of 4% PFA-fixed lungs from either PBS- or SARS-CoV(MA15)-inoculated 20- to 24-week-old wild-type or EGFR(DSK5) mice at day 9 postinfection (10× magnification). The experiment was performed with n = 5 per group, and images are representative of each group. (D) Western blot analysis of lung lysates from PBS- and SARS-CoV(MA15)-infected 20- to 24-week-old wild-type and EGFR(DSK5) mice probed with anti-PCNA and anti-β-tubulin antibodies. Representative blots are shown. (E) Quantitation of PCNA expression from Western blots, normalized to β-tubulin (n = 3).
Overactivation of fibrosis genes in EGFR(DSK5) mice after SARS-CoV infection.
Since we found that EGFR(DSK5) mice infected with SARS-CoV have increased lung pathology at day 9 postinfection (Fig. 3), we wanted to determine if genes were similarly upregulated in SARS-CoV infection of STAT1−/− mice and EGFR(DSK5) mice, with a focus on wound healing- and fibrosis-associated genes. To determine if wound healing- and fibrosis-associated genes are overactivated in SARS-CoV-infected EGFR(DSK5) mice, we performed transcriptomic analysis on RNA isolated from the lungs of wild-type and EGFR(DSK5) mice infected with either PBS or SARS-CoV at 1 × 10⁵ PFU/mouse at days 2 and 9 postinfection. Genes associated with wound healing and fibrosis are shown in a heat map comparing wild-type and EGFR(DSK5) mice after infection (Fig. 5A and B and Tables 3 and 4). We found that at day 2 postinfection in both wild-type and EGFR(DSK5) mice, there was an increase in expression of genes associated with wound healing, including those seen upregulated in STAT1−/− mice (Fig. 1). Interestingly, in comparison to the STAT1−/− transcriptome analysis, most wound healing-associated gene transcript levels were not significantly altered between wild-type and EGFR(DSK5) mice at day 9 (Fig. 5A). Expression of fibrosis genes also showed a similar trend at day 2 postinfection, where wild-type and EGFR(DSK5) mice both expressed higher levels of most fibrosis genes (Fig. 5B). At day 9 postinfection, fibrosis gene expression in wild-type mice had returned to baseline, whereas EGFR(DSK5) mice showed elevated expression of three fibrosis related genes, Ccl2, Col3a1, and Timp1, in their lungs (Fig. 5B).
FIG 5.

EGFR(DSK5) mice show upregulation of the fibrosis genes Ccl2, Col3a1, and Timp1. (A and B) Transcriptome analysis was performed on RNA extracted from SARS-CoV(MA15)-infected wild-type and EGFR(DSK5) mouse lungs at 2 and 9 days postinfection. Expression values were normalized to values from PBS-infected mice to obtain fold induction. Heat maps of fold induction of wound healing-associated genes (A) and fibrosis-associated genes (B) were generated. (C to E) RNAs from the lungs of PBS- and SARS-CoV(MA15)-infected mice were analyzed by qRT-PCR to estimate Ccl2, Col3a1, and Timp1 expression in 10- to 12-week-old WT and EGFR(DSK5) mice (C), 10- to 12-week-old WT and STAT1−/− mice infected at 105 PFU/mouse (D), and 20- to 24-week-old WT and EGFR(DSK5) mice infected at 103 PFU/mouse (E).
TABLE 3.
Wound healing gene expression in EGFR(DSK5) micea
| Gene symbol | Relative expression in: |
|||
|---|---|---|---|---|
| WT mice |
EGFR(DSK5) mice |
|||
| Day 2 | Day 9 | Day 2 | Day 9 | |
| Muc1 | 1.24958472 | 1.059318398 | 1.237576321 | 1.148746031 |
| Serpinf2 | 1.005275039 | 1.076343995 | 1.296937894 | 0.973959931 |
| Ppara | 0.963372045 | 1.024514844 | 1.085309629 | 0.943750413 |
| Pdgfd | 0.828721779 | 0.82046192 | 0.790101376 | 0.913608219 |
| Vegfa | 0.993267708 | 0.897096776 | 1.059201306 | 0.986298634 |
| Ccr7 | 0.700600751 | 0.959284087 | 0.755442443 | 0.557370151 |
| Irf1 | 3.217282227 | 1.287565169 | 4.585635657 | 1.798946617 |
| Muc5b | 2.315258479 | 1.205862028 | 2.581860544 | 2.648811986 |
| Muc5ac | 0.979148208 | 0.947593371 | 1.06899625 | 1.252384293 |
| Egr1 | 1.420986631 | 0.807842801 | 1.571599337 | 0.630374865 |
| Egr2 | 1.16188651 | 1.100819603 | 1.303659654 | 1.11804732 |
| Mmp9 | 0.815740435 | 0.661425844 | 1.138275813 | 0.657387816 |
| Gbp2 | 8.568837904 | 2.29627115 | 10.9306369 | 3.227642748 |
| Ccl11 | 1.741165116 | 1.033461871 | 1.914661024 | 0.954395463 |
| Ccl3 | 7.374959894 | 2.209217831 | 8.531527869 | 2.015877993 |
| Socs3 | 2.345988438 | 1.344297965 | 3.175192396 | 1.657704406 |
| Ccr2 | 1.898114964 | 2.56370902 | 1.972274106 | 2.335924319 |
| Ccr5 | 2.396554655 | 2.530801276 | 3.197457529 | 2.551879222 |
| Tnf | 3.893191375 | 1.903284029 | 4.91475242 | 2.02484063 |
| Cxcl1 | 2.721699771 | 1.301744615 | 3.299285797 | 1.44789156 |
| Il6 | 23.77820489 | 1.885805582 | 30.85256895 | 2.526872922 |
| Ccl2 | 22.06441303 | 2.780114177 | 24.08748908 | 4.780781876 |
| Ifng | 1.312446528 | 1.17875933 | 1.763109244 | 1.316881769 |
The gene expression values were used to create the heat maps in Fig. 5A.
TABLE 4.
Fibrosis gene expression in EGFR(DSK5) micea
| Gene symbol | Relative expression in: |
|||
|---|---|---|---|---|
| WT mice |
EGFR(DSK5) mice |
|||
| Day 2 | Day 9 | Day 2 | Day 9 | |
| Icam1 | 1.5488509 | 1.149609225 | 1.855424964 | 1.596337223 |
| Il1a | 3.288089931 | 1.360019535 | 3.733819792 | 1.268028953 |
| Lbp | 2.114673337 | 1.354119802 | 2.465446331 | 1.651924068 |
| Tnfrsf1b | 2.141017245 | 1.571891356 | 2.567532492 | 1.604735456 |
| Csf1 | 2.614548822 | 1.074479563 | 3.017590801 | 1.192906217 |
| Nfkb2 | 2.23092147 | 1.477704937 | 2.553398864 | 1.689226187 |
| Pgf | 1.297801029 | 0.922719994 | 1.559461165 | 1.21046921 |
| Igf1 | 1.729322597 | 1.466890553 | 1.183183704 | 1.79667449 |
| Cd14 | 2.273261608 | 1.63241027 | 2.797950968 | 2.300910993 |
| Vcam1 | 3.872032809 | 2.275403928 | 3.813511014 | 2.692949764 |
| Il10ra | 2.636166587 | 1.738759567 | 3.434222512 | 1.570842461 |
| Fn1 | 0.965818404 | 1.042014427 | 0.876528132 | 1.518873118 |
| Il1b | 2.976961766 | 1.462845702 | 3.944742834 | 1.255383575 |
| Mmp13 | 1.446779091 | 0.858945741 | 1.421877303 | 1.09470478 |
| Tnf | 3.893191375 | 1.903284029 | 4.91475242 | 2.02484063 |
| Ccl5 | 5.896558456 | 4.5596542 | 7.093102609 | 4.125477387 |
| Ccr5 | 2.396554655 | 2.530801276 | 3.197457529 | 2.551879222 |
| Il1r2 | 4.379792999 | 0.976313838 | 6.631179804 | 1.364979541 |
| Cxcl3 | 2.090822527 | 1.715251649 | 2.235176947 | 1.41874425 |
| Col3a1 | 2.153502052 | 1.984695884 | 1.9827388 | 3.452700619 |
| Timp1 | 10.10057928 | 2.157322024 | 13.36329825 | 7.326072203 |
| Ccl2 | 22.06441303 | 2.780114177 | 24.08748908 | 4.780781876 |
| Il6 | 23.77820489 | 1.885805582 | 30.85256895 | 2.526872922 |
| Ifng | 1.312446528 | 1.17875933 | 1.763109244 | 1.316881769 |
The gene expression values were used to create the heat maps in Fig. 5B.
To validate the transcriptome data, the expression of Ccl2, Col3a1, and Timp1 was analyzed by quantitative reverse transcriptase PCR (qRT-PCR) analysis of lung samples at days 2, 5, and 9 postinfection of wild-type and EGFR(DSK5) mice (Fig. 5C). Ccl2 was upregulated 4.8-fold in wild-type mice and 35.7-fold in EGFR(DSK5) mice. Col3a1 was upregulated 1.7-fold in wild-type mice and 3.8-fold in EGFR(DSK5) mice. Timp1 was upregulated 2.0-fold in wild-type mice and 18.5-fold in EGFR(DSK5) mice (Fig. 5C). In STAT1−/− mice, qRT-PCR analysis showed that Ccl2 was upregulated 9.4-fold, versus 2.6-fold for the wild type, and Timp1 expression levels were upregulated 6.2-fold, compared to 1.1-fold for wild-type mice (Fig. 5D, top and bottom panels). Col3a1 levels were elevated in STAT1−/− mice at day 9 postinfection but not to a statistically significant level (Fig. 5D, middle panel). The expression levels of Ccl2 and Timp1 in the lungs of older EGFR(DSK5) mice infected at 1 × 10³ PFU/mouse were elevated compared to those in wild-type mice, but no difference was seen in the expression of Col3a1 between wild-type and EGFR(DSK5) mice (Fig. 5E). These data suggest that while there was no elevation in wound healing genes as a whole in EGFR(DSK5) mice, a subset of fibrosis genes were overactivated in the EGFR(DSK5) mice after SARS-CoV infection.
The EGFR ligands amphiregulin and HB-EGF are upregulated during SARS-CoV infection.
Our data support the hypothesis that EGFR is a key regulator of lung disease after SARS-CoV infection. EGFR is activated after the binding of specific ligands to its extracellular ligand-binding domain (39). We next hypothesized that there may be a specific subset of EGFR ligands induced during SARS-CoV(MA15) infection in mice that are responsible for the activation of EGFR during SARS-CoV infection in mice. Expression of the seven canonical EGFR ligand genes areg, egf, ereg, tgfa, epgn, hbegf, and btc were quantified by microarray analysis (Fig. 6A). To validate and quantify the findings on a separate cohort, we performed quantitative RT-PCR to measure transcript levels in SARS-CoV(MA15)-infected lungs of wild-type and EGFR(DSK5) mice. We found no gene induction of egf, btc, tgfa, ereg, and epgn in SARS-CoV-infected wild-type or EGFR(DSK5) mice compared to PBS control-inoculated mice (data not shown). However, two genes, hbegf and areg, were induced during infection, which corroborates the trends seen in the microarray data. In wild-type mice, the levels of hbegf and areg peaked by day 2 postinfection, decreasing at day 5 and returning to baseline by day 9 postinfection (Fig. 6B, left panels). Interestingly, the expression pattern for areg and hbegf in wild-type mice follows that of virus titers (Fig. 3B). In EGFR(DSK5) mice, hbegf levels continued to rise through 9 days postinfection, but areg decreased at day 5 and returned to levels that, while higher, did not increase over baseline through day 9 postinfection (Fig. 6B, right panels). These data suggest that AREG and HB-EGF are expressed during SARS-CoV infection and may be the ligands responsible for initiating EGFR activation.
FIG 6.

Expression of HB-EGF and AREG is induced during SARS-CoV infection, and their exogenous overexpression can induce fibrosis. (A) Transcriptomic analysis showing expression values of the seven canonical EGFR ligands. The ligands HB-EGF and AREG are highlighted with red boxes. (B) RNA was extracted from 10- to 12-week-old wild-type and EGFR(DSK5) mice inoculated with either PBS or SARS-CoV(MA15). Levels of HB-EGF and AREG mRNAs were estimated by qRT-PCR. Expression values were normalized to those for PBS-treated wild-type mice. Error bars indicate standard deviations (n = 3). (C) Twenty-week-old wild-type mice were intranasally inoculated with PBS or SARS-CoV(MA15) at 103 PFU/mouse. Mice were injected every day with either PBS or EGFR ligands (AREG plus HB-EGF at 2.5 μg each/mouse/day) beginning on the day of infection until day 9 postinfection. Mice were monitored for weight loss every day. (D) H&E-stained section of 4% PFA-fixed lungs from either PBS- or SARS-CoV(MA15)-inoculated 20-week-old wild-type mice that received either PBS or EGFR ligands at day 9 postinfection (10× magnification). The experiment was performed with n = 5 per group, and images are representative of each group.
Intranasal administration of AREG and HB-EGF to mice during SARS-CoV infection exacerbates disease in wild-type mice.
We showed that lung injury caused by SARS-CoV(MA15) infection activates gene expression of areg and hbegf. This appears to be a normal part of disease progression where the ligands bind to EGFR and activate the wound healing process. Our data also show that after a successful resolution of wound healing, gene expression of areg and hbegf normally returns to basal levels. If EGFR ligand expression remains persistent, it may lead to fibrosis. This idea is supported by observations in transgenic mouse models where constitutive expression of various EGFR ligands resulted in fibrosis (40–43). We reasoned that exogenous administration of EGFR ligands in older wild-type mice could reproduce the exacerbated lung pathology seen in the EGFR(DSK5) mice, as they would induce constitutive EGFR activation. To test this, 20-week-old wild-type mice were intraperitoneally (i.p.) administered AREG and HB-EGF protein at the time of SARS-CoV(MA15) infection and every day until 9 days postinfection. Mice were monitored daily for survival and weight loss. There were no differences in weight loss between groups during the 9 days (Fig. 6C). However, in the ligand-treated mice, we found enhanced perivascular cuffing, edema, and thickening of the alveolar septa compared to those in the PBS-treated group (Fig. 6D). These data further support the idea that overactivation of the EGFR results in more severe lung pathology and limited resolution of SARS-CoV-induced tissue damage.
DISCUSSION
SARS-CoV is a recently emerged viral pathogen that causes severe respiratory infection, leading to death in ∼10% of infected individuals and disproportionately affecting the elderly (44). Long-term follow-up studies have shown that many survivors of severe SARS-CoV infection show signs of fibrosis in their lungs (45–47), again disproportionately affecting older patients. The molecular pathways that are involved in the development of fibrosis are not well understood, making it challenging to identify novel targets for therapy. In this study, we used a mouse model of SARS-CoV infection to show that a dysregulated EGFR pathway is associated with the development of PF-like disease.
Infection with SARS-CoV in mice and humans causes severe damage to epithelial cells lining the airways. This damage is repaired by a complex wound healing process involving several different cell types. A dysregulation of the wound healing process results in fibrosis (30). We previously demonstrated that in STAT1−/− mice infected with a mouse-adapted strain of SARS-CoV, called SARS-CoV(MA15), there was increased lung damage and the induction of fibrotic lesions (13, 14). STAT1−/− mice are also more susceptible to fibrosis induction by bleomycin administration (48), making this a suitable model to study the development of fibrosis. Subsequent analysis of the transcriptome of lungs from SARS-CoV(MA15)-infected STAT1−/− mice identified the upregulation of genes involved in wound healing. The major node at the head of this pathway is EGFR, which controls many downstream cascades that lead to cell proliferation, mucus secretion, inflammatory response, and tissue repair. Our data suggest that EGFR signaling remains active in STAT1−/− mice after SARS-CoV virus clearance, ultimately resulting in fibrosis.
To investigate the role of overactive EGFR signaling, we used a strain of mice, EGFR(DSK5), that carries a point mutation that renders EGFR constitutively active. These mice display an easily recognizable skin phenotype due to overproliferation of skin keratinocytes that express this mutant EGFR (25). The constitutive activation of EGFR in this mouse strain leads to recycling of EGFR from the plasma membrane in various tissues, much like what is seen with wild-type EGFR that has been activated by ligand binding (25, 49). Consequently, they show lower levels of EGFR on the surface of cells and display consequences of EGFR activation (such as the overproliferation of some cell types). The lungs of EGFR(DSK5) mice infected with SARS-CoV(MA15) have increased expression of markers of fibrosis (Timp1, Col3a1, and CCL2) and show a sustained proliferative response in fibroblasts surrounding the airways even after clearance of virus from the lungs (Fig. 3), suggesting that overactive EGFR signaling contributes to fibrosis.
Advanced age is a major comorbidity in pulmonary fibrosis caused by SARS-CoV or by other respiratory viruses (50) and in idiopathic pulmonary fibrosis (IPF), where the trigger for the disease is unknown (51). This is usually attributed to the lack of a robust immune response in the elderly (52). However, the molecular pathways driving the development of fibrosis in an older population are not well understood due to the lack of a suitable animal model. In our study, 10- to 12-week-old EGFR(DSK5) mice displayed increased lung pathology without any increase in mortality or morbidity. In stark contrast, older mice showed increased mortality and lung pathology compared to younger mice (Fig. 4), making it a suitable model to study how SARS-CoV induces fibrosis in the elderly. We also showed that administration of the EGFR ligands HB-EGF and AREG to older wild-type mice can increase lung pathology (Fig. 6). Taken together, our data show that EGFR signaling is a key regulator of SARS-CoV-induced lung damage leading to fibrosis.
Current therapeutics such as tyrosine kinase inhibitors (Erlotinib, Gefitinib, etc.) and TGF-β inhibitors have potential for the treatment of fibrosis. However, the total inhibition of EGFR signaling can also be detrimental to lung health (53, 54). Non-small-cell lung cancer (NSCLC) patients treated with Erlotinib and Gefitinib carried an increased risk of developing interstitial lung disease (ILD) with PF. However, animal models of fibrosis paint a mixed picture. Mouse models of fibrosis using bleomycin have shown that tyrosine kinase inhibitors can prevent the development of lung fibrosis (55). Conversely, transgenic mice constitutively overexpressing some of the EGFR ligands tend to spontaneously develop fibrosis (56, 57), and the deficiency of some EGFR ligands is beneficial in reducing PF in a bleomycin model (58). Taken together, these studies indicate that activation of EGFR contributes to fibrosis and that inhibition of EGFR signaling can protect against fibrosis. Studies on influenza A virus show that amphiregulin protects against virus-induced lung pathology in female mice, further complicating the picture (59). Other studies have also shown that tyrosine kinase inhibitors exacerbate PF (60) and that conditional loss of the EGFR ligand HB-EGF contributes to liver fibrosis (61), demonstrating the complex nature of EGFR signaling pathway integration.
The wound healing process involves a series of well coordinated events, and EGFR signaling is one of the key regulators of this process (62). Our data show that EGFR ligands are expressed at the onset of wound healing (day 2 postinfection) and return to baseline after the resolution of injury (day 9 postinfection) (Fig. 6B). This coincides with the expression of wound healing genes at day 2 and downregulation of these genes by day 9 (Fig. 1A and 5A). Dysregulation in either the initial activation or the eventual downregulation of this pathway would disrupt the wound healing process, resulting in fibrosis. Thus, an appropriate timing for therapeutic intervention needs to determined. Our work suggests that future development and testing of therapeutics for fibrosis should focus on preserving the kinetics of the wound healing response.
MATERIALS AND METHODS
Ethics statement.
This study was carried out in strict accordance with the recommendations in the Guide for the Care and Use of Laboratory Animals (63). All mice in this study were treated following Institutional Animal Care and Use Committee (IACUC) guidelines, and procedures were approved by the University of Maryland School of Medicine IACUC.
Viruses, cells, and antibodies.
The construction of SARS-CoV(MA15) has been previously described (64). SARS-CoV(MA15) stocks were prepared, their titers were determined, and they were stored at −80°C. Vero E6 cells (catalog no. CRL-1586; ATCC, Manassas, VA) were grown in minimal essential medium (MEM) (catalog no. 10-010-CV; Corning/CellGro, Manassas, VA) supplemented with 10% fetal bovine serum (FBS) (catalog no. F4135; Sigma, St. Louis, MO), 2 mM l-glutamine (catalog no. 25030081; ThermoFisher, NY), and 1% penicillin-streptomycin (Gemini Bioproducts, West Sacramento, CA). NIH 3T3(7d)-HER1 stable cells were a gift from Anne Hamburger (Department of Pathology, University of Maryland, Baltimore) and were grown in Dulbecco's modified Eagle's medium (DMEM) (catalog no. 11965118; ThermoFisher, NY) supplemented with 10% heat-inactivated fetal bovine serum and 500 μg/ml Geneticin (catalog no. 10131-035; ThermoFisher, NY) at 37°C in a 5% CO2 incubator. Construction of NIH 3T3(7d)-HER1 cells has been described by Cohen et al. (24). Antibodies used were against EGFR (clone D3881 [catalog no. 4267]; Cell Signaling Technologies [CST]), P-ERK1/2 (catalog no. 9101; CST), ERK1/2 (catalog no. 9102; CST), β-tubulin (catalog no. T5201; Sigma, St. Louis, MO), and proliferating cell nuclear antigen (PCNA) (clone PC10 [catalog no. 2586]; CST).
siRNA knockdown of genes.
NIH 3T3(7d)-HER1 cells were seeded at a density of 75,000 cells per well of a 12-well plate and allowed to adhere overnight. siRNA for STAT1 (catalog no. L-058881-00-0005; Dharmacon/GE Healthcare) or a nontargeting control (catalog no. D-001810-10-50) were transfected using the Lipofectamine RNAiMAX transfection reagent (catalog no. 13778150; ThermoFisher, NY) according to the manufacturer's instructions. At 48 h posttransfection, cells were harvested for gel electrophoresis by lysing the cells directly in 1× Laemmli sample buffer or for RNA extraction in TRIzol (catalog no. 15596026; ThermoFisher, NY).
Mouse breeding.
129S1/SvImJ (WT mice) and C57/Bl6 mice were purchased from Jackson Laboratories (Bar Harbor, ME). STAT1−/− mice were a gift from David Levy (New York University [NYU]), and EGFR(DSK5) mice (25) were a gift from David Threadgill (Texas A&M University). Mice were bred and housed in the animal facilities at the University of Maryland, Baltimore, MD (UMB). Since the EGFR(DSK5) mutation is a dominant mutation, EGFR(DSK5) heterozygotic males were bred with wild-type 129S1 females.
In vivo mouse infections.
All SARS-CoV infections of mice were performed in an animal biosafety level 3 (ABSL3) facility at the University of Maryland, Baltimore, MD, using appropriate practices as described previously (13). Mice were euthanized at various time points, and lung tissue was harvested for further analysis.
i.p. administration of EGFR ligands.
Recombinant soluble HB-EGF (catalog no. 259-HE/CF; R&D Systems) and amphiregulin (catalog no. 989-AR/CF; R&D Systems) were reconstituted in sterile 1× phosphate-buffered saline at a concentration of 200 μg/ml, aliquoted, and stored at −20°C until use. Each ligand (12.5 μl) was further diluted in 25 μl of sterile PBS for each mouse to obtain a combined concentration of 5 μg ligand per mouse. Mice were injected intraperitoneally (i.p.) on day 0 with the ligand and concurrently infected intranasally with PBS or SARS-CoV(MA15) at 103 PFU/mouse. Ligands were administered i.p. every day for the next 9 days. Mice were weighed every day and monitored for clinical symptoms.
Viral titers.
Fifty percent tissue culture infectious dose (TCID50) values from SARS-CoV(MA15)-infected lungs were calculated by infecting multiple replicates of Vero E6 cells plated on 96-well plates. Serial dilutions (1:5) were performed for the virus-containing lung lysates in Vero E6 culture medium (complete MEM) such that at least the last two dilutions had no detectable virus in any of the replicates. The infection proceeded for 3 days before cells were fixed with 4% PFA and stained with 0.05% crystal violet in 20% methanol. The TCID50 was calculated using the formula log10 TCID50 = Xp + (0.5 × D) − (D × Sp), where Xp is the last sample where all sample replicates are positive, D is the serial dilution log, and Sp is the sum of the proportion of replicates at all dilutions where positive values are seen (starting with the Xp dilution).
Histological analysis.
The largest lung lobes were fixed in 4% paraformaldehyde (PFA) in phosphate-buffered saline (PBS) for a minimum of 24 h, after which they were sent to the Histology Core at the University of Maryland, Baltimore, for paraffin embedding and sectioning. Sections were prepared at five-micrometer thickness and stained using hematoxylin and eosin (H&E) by the Histology Core Services (University of Maryland). Slides were imaged using a Carl Zeiss Axioskop 2 microscope equipped with the accompanying Axioset software program.
Immunohistochemistry.
Five-micrometer sections of mouse lungs affixed on slides were provided by the Histology Core at the University of Maryland, Baltimore. The slides were deparaffinized using two changes of xylene for 5 min per wash. A series of ethanol washes with progressively increasing amounts of water was used to rehydrate the sections. Antigen retrieval was performed by boiling slides in sodium citrate buffer (10 mM sodium citrate, 0.05% Tween 20, pH 6.0) for 5 min and incubating for 15 min, followed by washes in double-distilled water (ddH2O). Endogenous peroxide was blocked in 0.3% (vol/vol) H2O2 in methanol for 30 min, followed by washes in ddH2O. Sections were blocked using 5% bovine serum albumin (BSA) in PBS. Primary antibody was diluted in PBS–1% BSA–0.05% NP-40–2% normal goat serum. Anti-PCNA antibody was used at a 1:1,000 dilution and probed overnight at 4°C. Slides were washed again and probed with a horseradish peroxidase-conjugated anti-mouse secondary antibody for 2 h. The color reaction was performed using the diaminobenzidine (DAB) kit (Vector Laboratories, Burlingame, CA) as per the manufacturer's instructions.
Isolation of mouse lung fibroblasts.
Mouse lung fibroblasts were isolated by the procedure described by Seluanov et al. (65), with some modifications. In brief, mouse lungs were dissected and rinsed in PBS to remove as much blood as possible. Lungs were processed using a lung dissociation kit (catalog no. 130-095-927; Miltenyi Biotech, San Diego, CA) as per the manufacturer's instructions. After the second disruption step using the GentleMACS dissociator, all the cells along with any unprocessed chunks of lung tissue were washed once in sterile PBS. After this wash, cells were resuspended in DMEM-F12 (50/50) medium with 15% FBS and 1× antibiotic/antimycotic and plated on a T175 flask. The flask was monitored daily to look for fibroblasts adhering to the surface. After 3 to 4 days, the medium with unadhered cells was spun down and cells resuspended in fresh medium and transferred to a new flask to obtain more fibroblasts. Any adhered fibroblasts in the first flask were allowed to grow for around 10 to 14 days and pooled with fibroblasts obtained from the second flask. When the cells attain confluence, they can be frozen down in freezing medium (DMEM-F12 medium with 50% FBS, antibiotics, and 10% dimethyl sulfoxide [DMSO]) for long-term storage in liquid nitrogen.
cDNA synthesis and real-time PCR.
RNA was quantitated when possible, and about 100 to 500 ng of RNA was used per reaction. If RNA extraction was performed under BSL3 conditions, quantitation was not possible and 5 μl of RNA was used per cDNA synthesis reaction. cDNA synthesis was performed using the RevertAid kit (ThermoFisher, NY). The manufacturer's instructions were followed, with a total reaction volume of 20 μl per sample. After cDNA synthesis, the volume of the reaction mixture was brought up to a 100 μl with ultrapure water, and the mixture was further diluted 10-fold for PCR using TaqMan gene expression assay primers (ABI/ThermoFisher, NY). 18S rRNA levels were used to normalize RNA levels for real-time PCR.
Microarray analysis.
RNA extraction and cDNA synthesis were performed under BSL3 conditions. RNA was extracted by the TRIzol method with an RNeasy minikit (catalog no. 74104; Qiagen). First-strand cDNA synthesis was performed using the WT expression kit (catalog no. 4411974; Ambion/ThermoFisher). For RNA extraction and cDNA synthesis, the instructions included with the kit were followed without modification. Array hybridization and data acquisition were performed at the microarray core facility at the University of Maryland, Baltimore, on the GeneChip mouse gene 2.0 ST Array. Analysis of the Affymetrix mouse gene 2.0 ST microarrays was performed using Microsoft Excel and R (66). Data were loaded and normalized via the robust multiarray average (RMA) method (67, 68) using the Affy software package (69). Data sets from three replicates per condition were generated from EGFR(DSK5) lungs: PBS- and SARS-CoV(MA15)-infected mice at 2 days and 9 days postinfection and corresponding littermate WT controls. Heat maps of selected gene lists were made with GraphPad Prism software (GraphPad Software, Inc., La Jolla, CA). The heat maps in Fig. 1 were from reanalyzed data from wild-type and STAT1−/− mice whose initial data sets were published by Zornetzer et al. (23). Briefly, for the Zornetzer data set, genes were selected based on textbook analysis of variance (ANOVA) of microarray intensity scores, with a significance criterion of a P value of <0.05. In each group (n = 3), comparisons were made between WT and STAT1−/− mice. These gene lists were reduced by requiring a change of at least 1.5-fold between the group averages. Data from the data set of Zornetzer et al. were reanalyzed for the genes displayed in Fig. 1.
Western blots.
Protein samples were prepared in 1× lysis buffer (50 mM Tris-HCl [pH 7.4], 1% Triton X-100, 150 mM NaCl, 2 mM EDTA, 1% NP-40) containing protease and phosphatase inhibitors. For lung lysates from SARS-CoV(MA15)-infected mice, after mixing with the above lysis buffer, a secondary lysis was performed using an SDS-containing lysis buffer (final concentrations, 20 mM Tris-HCl [pH 7.6], 150 mM NaCl, 1% NP-40, 0.5% SDS, and 5 mM EDTA). Protein amounts were estimated by using the Bradford assay (catalog no. B6916; Sigma, St. Louis, MO) to normalize amounts before loading. Samples were resolved by SDS-PAGE on 4 to 20% gradient TGX gels (catalog no. 456-1093 or 456-1096; Bio-Rad, Hercules, CA) and transferred to polyvinylidene fluoride (PVDF) membranes (catalog no. IPFL00010; EMD Millipore, Billerica, MA) by the wet transfer method (XCell SureLock minicell transfer system; Bio-Rad/ThermoFisher, NY). Transferred membranes were blocked in 5% milk and probed with primary and horseradish peroxidase (HRP)-conjugated secondary antibodies as per the manufacturer's recommendations. Blots were developed using ECL Prime Western blotting reagent (catalog no. GERPN 2232; Sigma, St. Louis, MO) as per the manufacturer's instructions. Image acquisition was performed using a ChemiDoc (Bio-Rad, Hercules, CA). Image analysis and quantitation were performed using the ImageLab software (Bio-Rad, Hercules, CA). Densitometry values were obtained from bands of images that were not overexposed using volume tools. Background was adjusted for each band locally. Values were normalized against those for a housekeeping protein (β-tubulin), and relative expression values were calculated using one control condition (PBS treated or untreated) as a reference point.
ACKNOWLEDGMENTS
We thank Kirsten Kulcsar (UMB) and Stuart Weston (UMB) for helpful suggestions on editing the manuscript.
This work was funded by NIH/NIAID grants R01AI095569 to M.B.F. and T32AI095190 to T.V.
REFERENCES
- 1.Chan K, Zheng J, Mok Y, Li Y, Liu Y-N, Chu C, Ip M. 2003. SARS: prognosis, outcome and sequelae. Respirology 8:S36–S40. doi: 10.1046/j.1440-1843.2003.00522.x. [DOI] [PMC free article] [PubMed] [Google Scholar]
- 2.Cheng PKC, Wong DA, Tong LKL, Ip S-M, Lo ACT, Lau C-S, Yeung EYH, Lim WWL. 2004. Viral shedding patterns of coronavirus in patients with probable severe acute respiratory syndrome. Lancet 363:1699–1700. doi: 10.1016/S0140-6736(04)16255-7. [DOI] [PMC free article] [PubMed] [Google Scholar]
- 3.Xie L, Liu Y, Xiao Y, Tian Q, Fan B, Zhao H, Chen W. 2005. Follow-up study on pulmonary function and lung radiographic changes in rehabilitating severe acute respiratory syndrome patients after discharge. Chest 127:2119–2124. doi: 10.1378/chest.127.6.2119. [DOI] [PMC free article] [PubMed] [Google Scholar]
- 4.Hui DS, Wong KT, Ko FW, Tam LS, Chan DP, Woo J, Sung JJY. 2005. The 1-year impact of severe acute respiratory syndrome on pulmonary function, exercise capacity, and quality of life in a cohort of survivors. Chest 128:2247–2261. doi: 10.1378/chest.128.4.2247. [DOI] [PMC free article] [PubMed] [Google Scholar]
- 5.Antonio GE, Wong KT, Hui DSC, Wu A, Lee N, Yuen EHY, Leung CB, Rainer TH, Cameron P, Chung SSC, Sung JJY, Ahuja AT. 2003. Thin-section CT in patients with severe acute respiratory syndrome following hospital discharge: preliminary experience. Radiology 228:810–815. doi: 10.1148/radiol.2283030726. [DOI] [PubMed] [Google Scholar]
- 6.Wynn TA. 2008. Cellular and molecular mechanisms of fibrosis. J Pathol 214:199–210. doi: 10.1002/path.2277. [DOI] [PMC free article] [PubMed] [Google Scholar]
- 7.Wynn TA. 2004. Fibrotic disease and the T(H)1/T(H)2 paradigm. Nat Rev Immunol 4:583–594. doi: 10.1038/nri1412. [DOI] [PMC free article] [PubMed] [Google Scholar]
- 8.Wynn TA. 2007. Common and unique mechanisms regulate fibrosis in various fibroproliferative diseases. J Clin Invest 117:524–529. doi: 10.1172/JCI31487. [DOI] [PMC free article] [PubMed] [Google Scholar]
- 9.Schäfer M, Werner S. 2007. Transcriptional control of wound repair. Annu Rev Cell Dev Biol 23:69–92. doi: 10.1146/annurev.cellbio.23.090506.123609. [DOI] [PubMed] [Google Scholar]
- 10.Meneghin A, Hogaboam CM. 2007. Infectious disease, the innate immune response, and fibrosis. J Clin Invest 117:530–538. doi: 10.1172/JCI30595. [DOI] [PMC free article] [PubMed] [Google Scholar]
- 11.Gross TJ, Hunninghake GW. 2001. Idiopathic pulmonary fibrosis. N Engl J Med 345:517–525. doi: 10.1056/NEJMra003200. [DOI] [PubMed] [Google Scholar]
- 12.Collard HR, Moore BB, Flaherty KR, Brown KK, Kaner RJ, King TE, Lasky JA, Loyd JE, Noth I, Olman MA, Raghu G, Roman J, Ryu JH, Zisman DA, Hunninghake GW, Colby TV, Egan JJ, Hansell DM, Johkoh T, Kaminski N, Kim DS, Kondoh Y, Lynch DA, Müller-Quernheim J, Myers JL, Nicholson AG, Selman M, Toews GB, Wells AU, Martinez FJ, Idiopathic Pulmonary Fibrosis Clinical Research Network Investigators. 2007. Acute exacerbations of idiopathic pulmonary fibrosis. Am J Respir Crit Care Med 176:636–643. doi: 10.1164/rccm.200703-463PP. [DOI] [PMC free article] [PubMed] [Google Scholar]
- 13.Page C, Goicochea L, Matthews K, Zhang Y, Klover P, Holtzman MJ, Hennighausen L, Frieman M. 2012. Induction of alternatively activated macrophages enhances pathogenesis during severe acute respiratory syndrome coronavirus infection. J Virol 86:13334–13349. doi: 10.1128/JVI.01689-12. [DOI] [PMC free article] [PubMed] [Google Scholar]
- 14.Frieman MB, Chen J, Morrison TE, Whitmore A, Funkhouser W, Ward JM, Lamirande EW, Roberts A, Heise M, Subbarao K, Baric RS. 2010. SARS-CoV pathogenesis is regulated by a STAT1 dependent but a type I, II and III interferon receptor independent mechanism. PLoS Pathog 6:e1000849. doi: 10.1371/journal.ppat.1000849. [DOI] [PMC free article] [PubMed] [Google Scholar]
- 15.Tokumaru S, Higashiyama S, Endo T, Nakagawa T, Miyagawa JI, Yamamori K, Hanakawa Y, Ohmoto H, Yoshino K, Shirakata Y, Matsuzawa Y, Hashimoto K, Taniguchi N. 2000. Ectodomain shedding of epidermal growth factor receptor ligands is required for keratinocyte migration in cutaneous wound healing. J Cell Biol 151:209–220. doi: 10.1083/jcb.151.2.209. [DOI] [PMC free article] [PubMed] [Google Scholar]
- 16.Repertinger SK, Campagnaro E, Fuhrman J, El-Abaseri T, Yuspa SH, Hansen LA. 2004. EGFR enhances early healing after cutaneous incisional wounding. J Investig Dermatol 123:982–989. doi: 10.1111/j.0022-202X.2004.23478.x. [DOI] [PubMed] [Google Scholar]
- 17.Chen J, Chen J-K, Nagai K, Plieth D, Tan M, Lee T-C, Threadgill DW, Neilson EG, Harris RC. 2012. EGFR signaling promotes TGFβ-dependent renal fibrosis. J Am Soc Nephrol 23:215–224. doi: 10.1681/ASN.2011070645. [DOI] [PMC free article] [PubMed] [Google Scholar]
- 18.Fuchs BC, Hoshida Y, Fujii T, Wei L, Yamada S, Lauwers GY, McGinn CM, DePeralta DK, Chen X, Kuroda T, Lanuti M, Schmitt AD, Gupta S, Crenshaw A, Onofrio R, Taylor B, Winckler W, Bardeesy N, Caravan P, Golub TR, Tanabe KK. 2014. Epidermal growth factor receptor inhibition attenuates liver fibrosis and development of hepatocellular carcinoma. Hepatology 59:1577–1590. doi: 10.1002/hep.26898. [DOI] [PMC free article] [PubMed] [Google Scholar]
- 19.Hardie WD, Davidson C, Ikegami M, Leikauf GD, Le Cras TD, Prestridge A, Whitsett JA, Korfhagen TR. 2008. EGF receptor tyrosine kinase inhibitors diminish transforming growth factor-alpha-induced pulmonary fibrosis. Am J Physiol Lung Cell Mol Physiol 294:L1217–L1225. doi: 10.1152/ajplung.00020.2008. [DOI] [PubMed] [Google Scholar]
- 20.Hardie WD, Piljan-Gentle A, Dunlavy MR, Ikegami M, Korfhagen TR. 2001. Dose-dependent lung remodeling in transgenic mice expressing transforming growth factor-alpha. Am J Physiol Lung Cell Mol Physiol 281:L1088–1094. [DOI] [PubMed] [Google Scholar]
- 21.Ohtsubo M, Takayanagi A, Gamou S, Shimizu N. 2000. Interruption of NFkappaB-STAT1 signaling mediates EGF-induced cell-cycle arrest. J Cell Physiol 184:131–137. [DOI] [PubMed] [Google Scholar]
- 22.Andl CD, Mizushima T, Oyama K, Bowser M, Nakagawa H, Rustgi AK. 2004. EGFR-induced cell migration is mediated predominantly by the JAK-STAT pathway in primary esophageal keratinocytes. Am J Physiol Gastrointest Liver Physiol 287:G1227–1237. doi: 10.1152/ajpgi.00253.2004. [DOI] [PubMed] [Google Scholar]
- 23.Zornetzer GA, Frieman MB, Rosenzweig E, Korth MJ, Page C, Baric RS, Katze MG. 2010. Transcriptomic analysis reveals a mechanism for a prefibrotic phenotype in STAT1 knockout mice during severe acute respiratory syndrome coronavirus infection. J Virol 84:11297–11309. doi: 10.1128/JVI.01130-10. [DOI] [PMC free article] [PubMed] [Google Scholar]
- 24.Cohen BD, Kiener PA, Green JM, Foy L, Fell HP, Zhang K. 1996. The relationship between human epidermal growth-like factor receptor expression and cellular transformation in NIH3T3 cells. J Biol Chem 271:30897–30903. doi: 10.1074/jbc.271.48.30897. [DOI] [PubMed] [Google Scholar]
- 25.Fitch KR, McGowan KA, van Raamsdonk CD, Fuchs H, Lee D, Puech A, Herault Y, Threadgill DW, de Angelis MH, Barsh GS. 2003. Genetics of dark skin in mice. Genes Dev 17:214–228. doi: 10.1101/gad.1023703. [DOI] [PMC free article] [PubMed] [Google Scholar]
- 26.Scheving LA, Zhang X, Garcia OA, Wang RF, Stevenson MC, Threadgill DW, Russell WE. 2014. Epidermal growth factor receptor plays a role in the regulation of liver and plasma lipid levels in adult male mice. Am J Physiol Gastrointest Liver Physiol 306:G370–G381. doi: 10.1152/ajpgi.00116.2013. [DOI] [PMC free article] [PubMed] [Google Scholar]
- 27.Tomas A, Futter CE, Eden ER. 2014. EGF receptor trafficking: consequences for signaling and cancer. Trends Cell Biol 24:26–34. doi: 10.1016/j.tcb.2013.11.002. [DOI] [PMC free article] [PubMed] [Google Scholar]
- 28.Futter CE, Pearse A, Hewlett LJ, Hopkins CR. 1996. Multivesicular endosomes containing internalized EGF-EGF receptor complexes mature and then fuse directly with lysosomes. J Cell Biol 132:1011–1023. doi: 10.1083/jcb.132.6.1011. [DOI] [PMC free article] [PubMed] [Google Scholar]
- 29.Fox CF, Wrann M, Linsley P, Vale R. 1979. Hormone-induced modification of EGF receptor proteolysis in the induction of EGF action. J Supramol Struct 12:517–531. doi: 10.1002/jss.400120411. [DOI] [PubMed] [Google Scholar]
- 30.Diegelmann RF, Evans MC. 2004. Wound healing: an overview of acute, fibrotic and delayed healing. Front Biosci 9:283–289. doi: 10.2741/1184. [DOI] [PubMed] [Google Scholar]
- 31.Wynn TA, Ramalingam TR. 2012. Mechanisms of fibrosis: therapeutic translation for fibrotic disease. Nat Med 18:1028–1040. doi: 10.1038/nm.2807. [DOI] [PMC free article] [PubMed] [Google Scholar]
- 32.Wilson MS, Wynn TA. 2009. Pulmonary fibrosis: pathogenesis, etiology and regulation. Mucosal Immunol 2:103–121. doi: 10.1038/mi.2008.85. [DOI] [PMC free article] [PubMed] [Google Scholar]
- 33.Chen P, Gupta K, Wells A. 1994. Cell movement elicited by epidermal growth factor receptor requires kinase and autophosphorylation but is separable from mitogenesis. J Cell Biol 124:547–555. doi: 10.1083/jcb.124.4.547. [DOI] [PMC free article] [PubMed] [Google Scholar]
- 34.Carpenter G, Cohen S. 1978. Human epidermal growth factor: binding of the polypeptide to human fibroblasts and stimulation of cell proliferation. Natl Cancer Inst Monogr 1978:149–156. [PubMed] [Google Scholar]
- 35.Barrandon Y, Green H. 1987. Cell migration is essential for sustained growth of keratinocyte colonies: the roles of transforming growth factor-α and epidermal growth factor. Cell 50:1131–1137. doi: 10.1016/0092-8674(87)90179-6. [DOI] [PubMed] [Google Scholar]
- 36.Tai DY, Lew TW, Loo S, Earnest A, Chen MI, Tan Tock Seng Hospital SARS ICU Group. 2003. Clinical features and predictors for mortality in a designated national SARS ICU in Singapore. Ann Acad Med Singapore 32:S34–36. [PubMed] [Google Scholar]
- 37.Liu L, Turner JR, Yu Y, Khan AJ, Jaszewski R, Fligiel SE, Majumdar AP. 1998. Differential expression of EGFR during early reparative phase of the gastric mucosa between young and aged rats. Am J Physiol 275:G943–G950. [DOI] [PubMed] [Google Scholar]
- 38.Tureaud J, Sarkar FH, Fligiel SE, Kulkarni S, Jaszewski R, Reddy K, Yu Y, Majumdar AP. 1997. Increased expression of EGFR in gastric mucosa of aged rats. Am J Physiol 273:G389–G398. [DOI] [PubMed] [Google Scholar]
- 39.Schneider MR, Wolf E. 2009. The epidermal growth factor receptor ligands at a glance. J Cell Physiol 218:460–466. doi: 10.1002/jcp.21635. [DOI] [PubMed] [Google Scholar]
- 40.Schneider MR, Dahlhoff M, Herbach N, Renner-Mueller I, Dalke C, Puk O, Graw J, Wanke R, Wolf E. 2005. Betacellulin overexpression in transgenic mice causes disproportionate growth, pulmonary hemorrhage syndrome, and complex eye pathology. Endocrinology 146:5237–5246. doi: 10.1210/en.2005-0418. [DOI] [PubMed] [Google Scholar]
- 41.Hardie WD, Kerlakian CB, Bruno MD, Huelsman KM, Wert SE, Glasser SW, Whitsett JA, Korfhagen TR. 1996. Reversal of lung lesions in transgenic transforming growth factor alpha mice by expression of mutant epidermal growth factor receptor. Am J Respir Cell Mol Biol 15:499–508. [DOI] [PubMed] [Google Scholar]
- 42.Hardie WD, Bruno MD, Huelsman KM, Iwamoto HS, Carrigan PE, Leikauf GD, Whitsett JA, Korfhagen TR. 1997. Postnatal lung function and morphology in transgenic mice expressing transforming growth factor-alpha. Am J Pathol 151:1075–1083. [PMC free article] [PubMed] [Google Scholar]
- 43.Means AL, Ray KC, Singh AB, Washington MK, Whitehead RH, Harris RC Jr, Wright CVE, Coffey RJ Jr, Leach SD. 2003. Overexpression of heparin-binding EGF-like growth factor in mouse pancreas results in fibrosis and epithelial metaplasia. Gastroenterology 124:1020–1036. doi: 10.1053/gast.2003.50150. [DOI] [PubMed] [Google Scholar]
- 44.Lau EHY, Hsiung CA, Cowling BJ, Chen C-H, Ho L-M, Tsang T, Chang C-W, Donnelly CA, Leung GM. 2010. A comparative epidemiologic analysis of SARS in Hong Kong, Beijing and Taiwan. BMC Infect Dis 10:50. doi: 10.1186/1471-2334-10-50. [DOI] [PMC free article] [PubMed] [Google Scholar]
- 45.Ong K-C, Ng AW-K, Lee LS-U, Kaw G, Kwek S-K, Leow MK-S, Earnest A. 2005. 1-Year pulmonary function and health status in survivors of severe acute respiratory syndrome. Chest 128:1393–1400. doi: 10.1378/chest.128.3.1393. [DOI] [PMC free article] [PubMed] [Google Scholar]
- 46.Hui DSC, Wong KT, Antonio GE, Tong M, Chan DP, Sung JJY. 2009. Long-term sequelae of SARS: physical, neuropsychiatric, and quality-of-life assessment. Hong Kong Med J Xianggang Yi Xue Za Zhi 15(Suppl 8):S21–S23. [PubMed] [Google Scholar]
- 47.Wu X, Dong D, Ma D. 2016. Thin-section computed tomography manifestations during convalescence and long-term follow-up of patients with severe acute respiratory syndrome (SARS). Med Sci Monit Int Med J Exp Clin Res 22:2793–2799. [DOI] [PMC free article] [PubMed] [Google Scholar]
- 48.Walters DM, Antao-Menezes A, Ingram JL, Rice AB, Nyska A, Tani Y, Kleeberger SR, Bonner JC. 2005. Susceptibility of signal transducer and activator of transcription-1-deficient mice to pulmonary fibrogenesis. Am J Pathol 167:1221–1229. doi: 10.1016/S0002-9440(10)61210-2. [DOI] [PMC free article] [PubMed] [Google Scholar]
- 49.Dahlhoff M, Rose C, de Angelis MH, Wolf E, Schneider MR. 2012. Negative feedback mechanisms surpass the effect of intrinsic EGFR activation during skin chemical carcinogenesis. Am J Pathol 180:1378–1385. doi: 10.1016/j.ajpath.2011.12.017. [DOI] [PubMed] [Google Scholar]
- 50.Thompson WW, Shay DK, Weintraub E, Brammer L, Cox N, Anderson LJ, Fukuda K. 2003. Mortality associated with influenza and respiratory syncytial virus in the United States. JAMA 289:179–186. doi: 10.1001/jama.289.2.179. [DOI] [PubMed] [Google Scholar]
- 51.Collard HR. 2010. The age of idiopathic pulmonary fibrosis. Am J Respir Crit Care Med 181:771–772. doi: 10.1164/rccm.201001-0049ED. [DOI] [PubMed] [Google Scholar]
- 52.McElhaney JE, Effros RB. 2009. Immunosenescence: what does it mean to health outcomes in older adults? Curr Opin Immunol 21:418–424. doi: 10.1016/j.coi.2009.05.023. [DOI] [PMC free article] [PubMed] [Google Scholar]
- 53.Inoue A, Saijo Y, Maemondo M, Gomi K, Tokue Y, Kimura Y, Ebina M, Kikuchi T, Moriya T, Nukiwa T. 2003. Severe acute interstitial pneumonia and gefitinib. Lancet 361:137–139. doi: 10.1016/S0140-6736(03)12190-3. [DOI] [PubMed] [Google Scholar]
- 54.Shi L, Tang J, Tong L, Liu Z. 2014. Risk of interstitial lung disease with gefitinib and erlotinib in advanced non-small cell lung cancer: a systematic review and meta-analysis of clinical trials. Lung Cancer Amst Neth 83:231–239. doi: 10.1016/j.lungcan.2013.11.016. [DOI] [PubMed] [Google Scholar]
- 55.Ishii Y, Fujimoto S, Fukuda T. 2006. Gefitinib prevents bleomycin-induced lung fibrosis in mice. Am J Respir Crit Care Med 174:550–556. doi: 10.1164/rccm.200509-1534OC. [DOI] [PubMed] [Google Scholar]
- 56.Perugorria MJ, Latasa MU, Nicou A, Cartagena-Lirola H, Castillo J, Goñi S, Vespasiani-Gentilucci U, Zagami MG, Lotersztajn S, Prieto J, Berasain C, Avila MA. 2008. The epidermal growth factor receptor ligand amphiregulin participates in the development of mouse liver fibrosis. Hepatology 48:1251–1261. doi: 10.1002/hep.22437. [DOI] [PubMed] [Google Scholar]
- 57.Korfhagen TR, Swantz RJ, Wert SE, McCarty JM, Kerlakian CB, Glasser SW, Whitsett JA. 1994. Respiratory epithelial cell expression of human transforming growth factor-alpha induces lung fibrosis in transgenic mice. J Clin Invest 93:1691–1699. doi: 10.1172/JCI117152. [DOI] [PMC free article] [PubMed] [Google Scholar]
- 58.Madtes DK, Elston AL, Hackman RC, Dunn AR, Clark JG. 1999. Transforming growth factor-alpha deficiency reduces pulmonary fibrosis in transgenic mice. Am J Respir Cell Mol Biol 20:924–934. doi: 10.1165/ajrcmb.20.5.3526. [DOI] [PubMed] [Google Scholar]
- 59.Hall OJ, Limjunyawong N, Vermillion MS, Robinson DP, Wohlgemuth N, Pekosz A, Mitzner W, Klein SL. 2016. Progesterone-based therapy protects against influenza by promoting lung repair and recovery in females. PLoS Pathog 12:e1005840. doi: 10.1371/journal.ppat.1005840. [DOI] [PMC free article] [PubMed] [Google Scholar]
- 60.Suzuki H, Aoshiba K, Yokohori N, Nagai A. 2003. Epidermal growth factor receptor tyrosine kinase inhibition augments a murine model of pulmonary fibrosis. Cancer Res 63:5054–5059. [PubMed] [Google Scholar]
- 61.Takemura T, Yoshida Y, Kiso S, Kizu T, Furuta K, Ezaki H, Hamano M, Egawa M, Chatani N, Kamada Y, Imai Y, Higashiyama S, Iwamoto R, Mekada E, Takehara T. 2013. Conditional loss of heparin-binding EGF-like growth factor results in enhanced liver fibrosis after bile duct ligation in mice. Biochem Biophys Res Commun 437:185–191. doi: 10.1016/j.bbrc.2013.05.097. [DOI] [PubMed] [Google Scholar]
- 62.Werner S, Grose R. 2003. Regulation of wound healing by growth factors and cytokines. Physiol Rev 83:835–870. [DOI] [PubMed] [Google Scholar]
- 63.National Research Council. 2011. Guide for the care and use of laboratory animals, 8th ed National Academies Press, Washington, DC. [Google Scholar]
- 64.Roberts A, Deming D, Paddock CD, Cheng A, Yount B, Vogel L, Herman BD, Sheahan T, Heise M, Genrich GL, Zaki SR, Baric R, Subbarao K. 2007. A mouse-adapted SARS-coronavirus causes disease and mortality in BALB/c mice. PLoS Pathog 3:e5. doi: 10.1371/journal.ppat.0030005. [DOI] [PMC free article] [PubMed] [Google Scholar]
- 65.Seluanov A, Vaidya A, Gorbunova V. 2010. Establishing primary adult fibroblast cultures from rodents. J Vis Exp 5:2033. doi: 10.3791/2033. [DOI] [PMC free article] [PubMed] [Google Scholar]
- 66.R Development Core Team. 2011. R: a language and environment for statistical computing. The R Foundation for Statistical Computing, Vienna, Austria. [Google Scholar]
- 67.Bolstad BM, Irizarry RA, Astrand M, Speed TP. 2003. A comparison of normalization methods for high density oligonucleotide array data based on variance and bias. Bioinformatics 19:185–193. doi: 10.1093/bioinformatics/19.2.185. [DOI] [PubMed] [Google Scholar]
- 68.Irizarry RA, Hobbs B, Collin F, Beazer-Barclay YD, Antonellis KJ, Scherf U, Speed TP. 2003. Exploration, normalization, and summaries of high density oligonucleotide array probe level data. Biostatistics 4:249–264. doi: 10.1093/biostatistics/4.2.249. [DOI] [PubMed] [Google Scholar]
- 69.Gautier L, Cope L, Bolstad BM, Irizarry RA. 2004. affy—analysis of Affymetrix GeneChip data at the probe level. Bioinformatics 20:307–315. doi: 10.1093/bioinformatics/btg405. [DOI] [PubMed] [Google Scholar]