ABSTRACT
The HIV-1 core consists of the viral genomic RNA and several viral proteins encased within a conical capsid. After cell entry, the core disassembles in a process termed uncoating. Although HIV-1 uncoating has been linked to reverse transcription of the viral genome in target cells, the mechanism by which uncoating is initiated is unknown. Using time-lapse atomic force microscopy, we analyzed the morphology and physical properties of isolated HIV-1 cores during the course of reverse transcription in vitro. We found that, during an early stage of reverse transcription the pressure inside the capsid increases, reaching a maximum after 7 h. High-resolution mechanical mapping reveals the formation of a stiff coiled filamentous structure underneath the capsid surface. Subsequently, this coiled structure disappears, the stiffness of the capsid drops precipitously to a value below that of a pre-reverse transcription core, and the capsid undergoes partial or complete rupture near the narrow end of the conical structure. We propose that the transcription of the relatively flexible single-stranded RNA into a more rigid filamentous structure elevates the pressure within the core, which triggers the initiation of capsid disassembly.
IMPORTANCE For successful infection, the HIV-1 genome, which is in the form of a single-stranded RNA enclosed inside a capsid shell, must be reverse transcribed into double-stranded DNA and released from the capsid (in a process known as uncoating) before it can be integrated into the target cell genome. The mechanism that triggers uncoating is a pivotal question of long standing. By using atomic force microscopy, we found that during reverse transcription the pressure inside the capsid increases until the internal stress exceeds the strength of the capsid structure and the capsid breaks open. The application of AFM technologies to study purified HIV-1 cores represents a new experimental platform for elucidating additional aspects of capsid disassembly and HIV-1 uncoating.
KEYWORDS: HIV-1, atomic force microscopy, capsid, reverse transcription, uncoating
INTRODUCTION
Following fusion between the HIV-1 membrane and the target cell membrane, the viral core is released into the host cell cytoplasm. The core consists of the single-stranded viral RNA (ssRNA) genome and associated proteins encapsulated within a cone-shaped capsid composed of ∼250 CA (p24) protein hexamers and 12 CA pentamers (1–3). Successful infection requires reverse transcription of the ssRNA into double-stranded DNA (dsDNA) that is then transported into the nucleus, where it integrates into the target cell genome. Since the intact HIV-1 core is too large to cross the nuclear pore (reviewed in reference 4), the capsid is thought to disassemble prior to nuclear import in a process known as uncoating. This is supported by a study which shows by superresolution microscopy differences in size of reverse transcription complexes between the cytoplasm and the nucleus in infected cells (5). Several studies suggest that HIV-1 uncoating is regulated by CA and cellular factors. The cellular proteins cyclophilin A and CPSF6 (6, 7) interact with the viral capsid and appear to influence infection by controlling uncoating (8, 9). Capsid stabilization by these host proteins also appears to limit viral DNA-dependent activation of innate immune responses (10). Early studies showed that amino acid changes in CA can alter intrinsic capsid stability and the rate of uncoating (11, 12). In addition, many CA mutants exhibit reduced infectivity and reduced reverse transcription activity. An early report suggested that reverse transcription is required for HIV-1 uncoating in target cells (13). Subsequently, Hulme et al. reported that inhibition of reverse transcription can delay uncoating (14); this conclusion was supported by subsequent workers using complementary cell-based assays (15, 16). In a more recent study employing a novel fluorescence-based HIV-1 imaging assay, uncoating was observed to accelerate upon the initiation of reverse transcription (17). Another study, using a readout that relies on translation of viral RNA, concluded that reverse transcription remodels the viral core and yet continues to limit access of the genome to cytoplasmic factors (18), a finding reminiscent of capsid-dependent shielding of the reverse-transcribed HIV-1 genome from cytoplasmic DNA sensors (10). Collectively, these studies revealed that uncoating is influenced by intrinsic capsid stability and is promoted by reverse transcription.
While the aforementioned studies strongly indicate that HIV-1 uncoating is promoted by reverse transcription, a key question remains: what is the molecular trigger of uncoating? Addressing this question using commonly available imaging techniques is challenging owing to the relatively small size of the HIV-1 core (∼80 nm) (19). Atomic force microscopy (AFM) provides a unique means to analyze isolated viral cores during reverse transcription under physiological conditions. Here, we used a combination of two distinct AFM techniques to analyze the structure and mechanical properties of isolated HIV-1 cores during the course of reverse transcription in vitro. We show that HIV-1 capsid disassembly can be directly triggered by reverse transcription. As reverse transcription progresses, an internal stress builds up until it exceeds the strength of the core structure, the capsid is ruptured, and the core stiffness declines. To our knowledge, our study represents the first images of HIV-1 cores undergoing morphological changes during reverse transcription.
RESULTS
To study the morphological changes in the HIV-1 core occurring during reverse transcription, we isolated and purified HIV-1 cores from viral particles by modifying a previously described method (19) and then deposited them on hexamethyldisilazane (HMDS)-coated microscope glass slides for AFM analysis. All measurements were carried out in 3-(N-morpholino)propanesulfonic acid (MOPS) buffer. First, we analyzed the average stiffness of cores, which can be defined as the force needed to elastically deform a structure, during the time course of reverse transcription (Fig. 1A), with average stiffness value prior to reverse transcription (0.12 ± 0.03 N/m, n = 19) positioned at time zero. Next, we initiated reverse transcription by adding reverse transcription buffer (to achieve a final concentration of 100 μM deoxyribose-containing nucleotide triphosphates [dNTPs] and 1 mM MgCl2 [20]) and monitored core stiffness as a function of time. The core stiffness increased from initiation of reverse transcription to a maximum (0.33 ± 0.06 N/m, n = 7) at 7 h that was approximately 300% higher than the initial stiffness. Of the total 7 cores examined at this time point, only one failed to exhibit a significant increase in its measured stiffness. Subsequently, the core stiffness decreased abruptly (0.15 ± 0.03 N/m, n = 12). Core stiffness gradually declined over the remainder of the time course, which ended after 24 h of reverse transcription. In addition to the average stiffness, which we obtained by measuring various cores at different time points, we also performed consecutive measurements on several individual cores during the course of reverse transcription (Fig. 1B). Acquiring a stiffness profile of an individual core during 24 h of reverse transcription is technically challenging: repetitive scanning of the same core by the AFM probe often detached the core from the substrate. Nonetheless, we were able to monitor and measure the stiffness profiles of five individual cores undergoing reverse transcription. Interestingly, the mechanical trajectories during reverse transcription of each individual core were very similar to the average traces, indicating that the majority of cores exhibited synchronous behavior during the reaction (Fig. 1B). Notably, each of them exhibited a spike in stiffness at 7 h of reverse transcription, followed by an initial rapid decrease in stiffness that subsequently declined to baseline.
FIG 1.
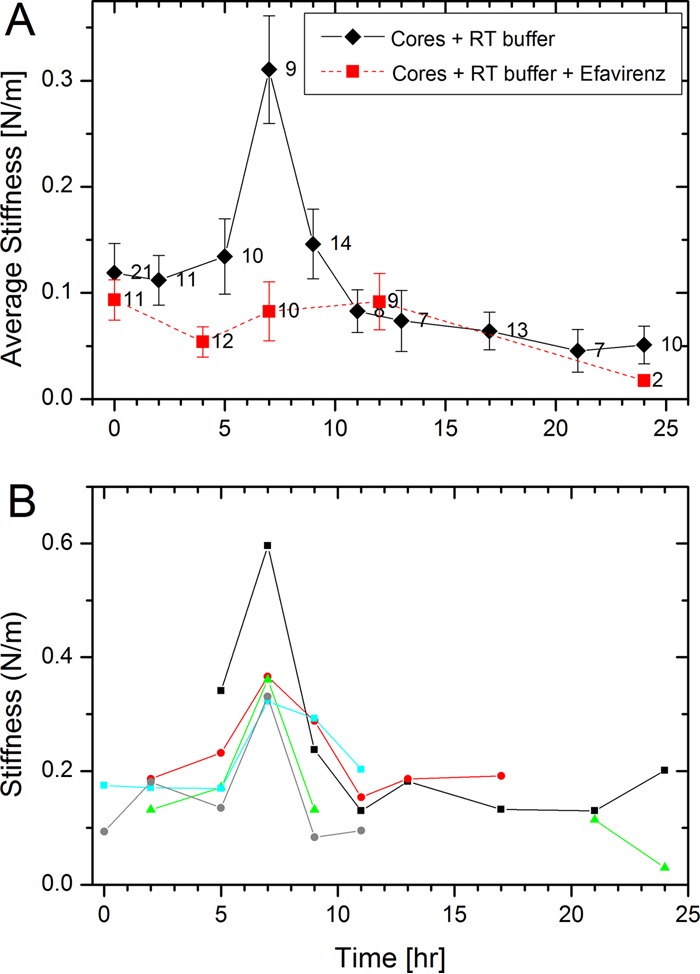
Changes in the stiffness of HIV-1 cores during reverse transcription. Cores were adhered to HMDS-coated glass slides and kept in MOPS buffer. Reactions were initiated by adding dNTPs and MgCl2 to the cores, and their stiffness values were measured using AFM. The initial average stiffness value of cores prior to reverse transcription is represented as time zero. (A) The average stiffness values of cores in the absence or presence of the reverse transcription inhibitor efavirenz are plotted in black and red, respectively. The error bars represent the standard errors of the mean, and the number of cores analyzed is indicated beside each data point. (B) Stiffness trajectories of five individual isolated HIV-1 cores as a function of the progress of reverse transcription.
To correlate the observed changes in the mechanical properties of the cores with reverse transcription, we performed two sets of control experiments. In the first, we prevented reverse transcription by excluding deoxynucleoside triphosphates (dNTPs) from the reverse transcription buffer. Consequently, we did not observe changes in the properties of the cores during the time course of the experiments (data not shown). In the second set, we added the reverse transcriptase inhibitor, efavirenz, to the buffer. Figure 1A (red curve) shows that the stiffness of the cores remained practically unchanged throughout the duration of the measurement when reverse transcription was inhibited. Based on these observations, we conclude that the observed changes in core stiffness are a direct consequence of reverse transcription.
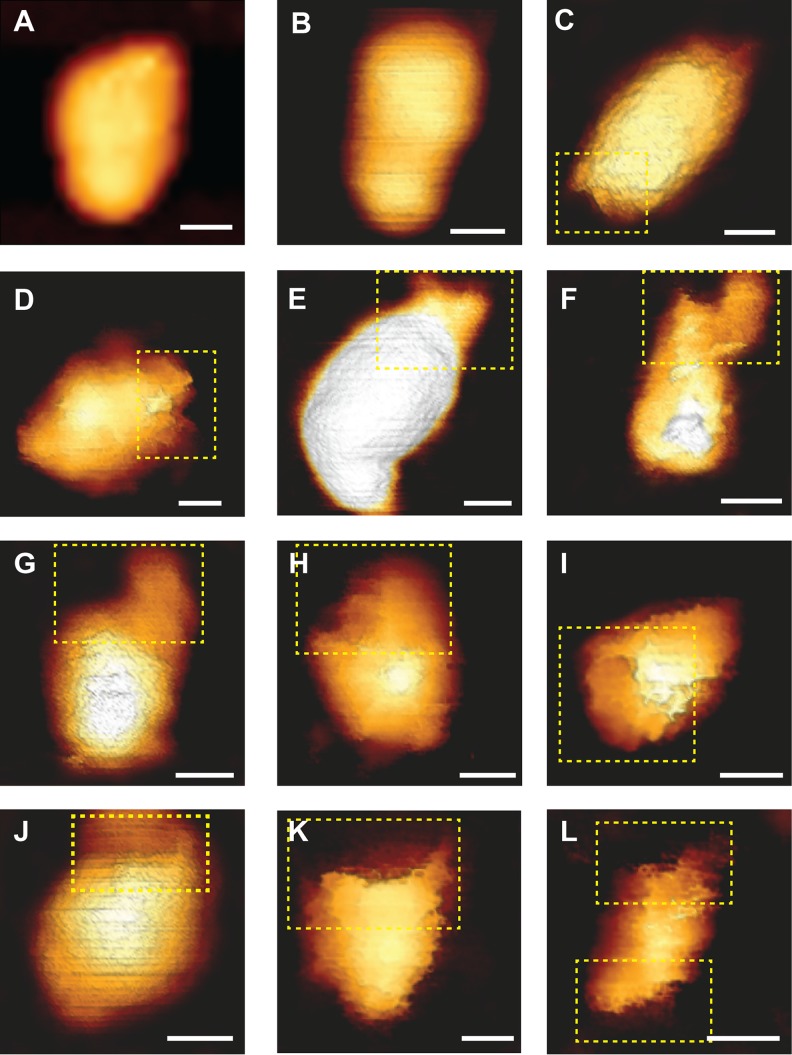
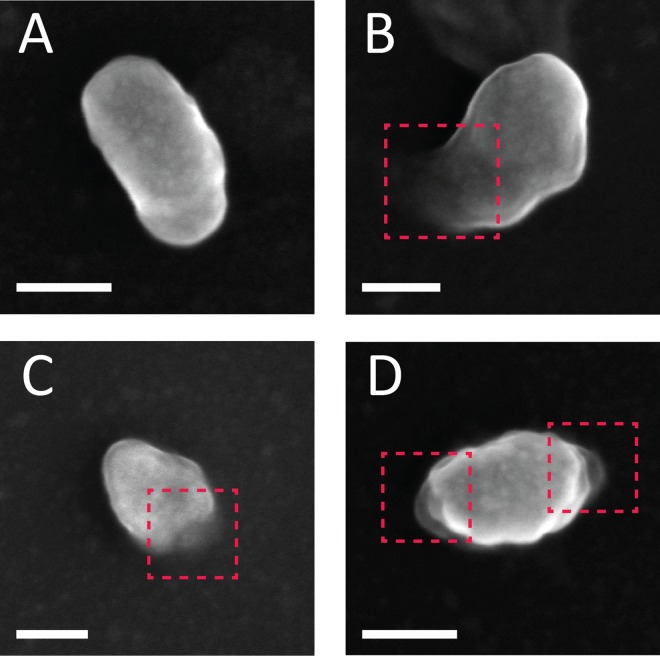
To complement the mechanical analysis, we characterized the morphology of the core during the course of reverse transcription by AFM operated in the quantitative imaging mode. In this imaging mode, a force curve is acquired at each pixel to a predefined maximal loading force. The topographic image is determined by the displacement of a Z-piezo scanner that is required to reach the maximal load. Prior to reverse transcription, HIV-1 cores exhibited a well-defined cone-shaped structure. Two representative cores (out of a total of 20 cores that were imaged) are shown in Fig. 2A and B. However, 12 to 17 h into reverse transcription, the cores underwent structural deformation. They often became swollen (averaged height of 58 ± 6 nm compared to 43 ± 3 nm prior to reverse transcription), and a variably sized opening in the capsid frequently appeared. The opening was sometimes relatively small (Fig. 2C to E), whereas in other instances it was expanded (Fig. 2F and G). Intriguingly, the opening did not form in the main body (of any of the 59 total cores visualized during reverse transcription); rather, the rupture was localized at or near the narrow end of the core. As the reaction proceeded, the core underwent further disassembly and the opening grew until it spanned the entire width of the core (Fig. 2H to K). In two instances, capsid failure was observed at both narrow ends of the core (Fig. 2L). Analysis of the samples beyond 17 h of reverse transcription revealed mostly fragments of various sizes that lacked a defined morphology, with very few objects resembling that of a viral core (data not shown). At the beginning of each experiment, before reverse transcription is induced, we detected, on average, one to two cores in a 5×5-μm scan area. However, beyond 17 h of reverse transcription, the number of intact cores dramatically decline, and, on average, only a single intact core was observed in a large (35 by 35 μm) scan area. We therefore conclude that, between 17 and 24 h of reverse transcription, the majority of cores underwent complete disassembly. We observed a relatively small fraction of cores that neither underwent morphological changes nor broke open during the 24-hour reaction. When dNTPs were excluded, or when reverse transcription inhibitor was added to the reverse transcription buffer, the morphology of the cores remained intact, and we did not observe any structural alterations throughout the time course. In addition, the average number of intact cores per μm2 in our AFM images was unchanged during the entire length of the experiment (27 cores imaged). In parallel, core morphology was analyzed using scanning electron microscopy (Fig. 3). Similar to the AFM analysis, openings were observed toward the narrow end of the capsid (Fig. 3B and C; total number of cores imaged, 88). Rarely (n = 3), cores with openings at both ends were observed.
FIG 2.
Topographic AFM images of the morphological changes that HIV-1 cores undergo during reverse transcription. Cores were adhered to HMDS-coated glass slides and kept in MOPS buffer. Transcription was initiated by adding dNTPs and MgCl2 to the cores. Images were acquired using the QI mode. (A and B) Typical cone-shaped cores observed prior to reverse transcription (out of a total of 20 cores that were imaged). (C to L) Deformed and damaged cores visualized after 17 to 19 h of reverse transcription. For clarity, openings in the cores are shown within a dashed yellow rectangle. Scale bars, 50 nm. A total of 59 cores were visualized during reverse transcription.
FIG 3.
SEM analysis of HIV-1 cores morphology during reverse transcription. (A) Intact core observed prior to reverse transcription. (B to D) Damaged cores exhibiting openings at the vicinity of capsid's narrow end visualized after 15 h of reverse transcription (total number of cores imaged was 88). A core with openings at both ends is shown in panel D. For clarity, openings in the cores are shown within dashed red rectangles. Scale bars, 50 nm.
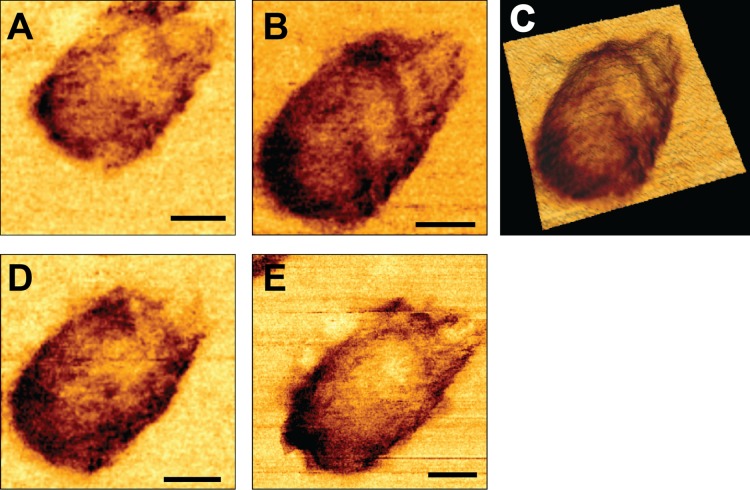
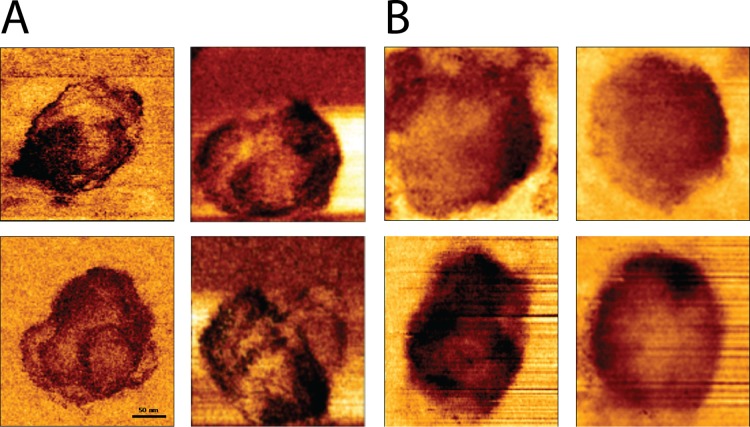
To bridge the mechanical and morphological analyses, we also acquired high lateral resolution mechanical maps of the core surface (QI imaging mode; JPK Instruments) (Fig. 4). These mechanical maps provide a qualitative view of the core's stiffness distribution in contrast to the more common AFM topographic images, which provide a height distribution map of the sample. In these images, a darker color represents a higher stiffness value. Prior to reverse transcription, the core surfaces exhibited some mechanical variations; however, they lacked any defined pattern or structure. Strikingly, 7 h into reverse transcription, a clear spiral pattern appeared in the core surface. This pattern may indicate the existence of a stiff coiled filament located in the inner periphery underneath the core surface (Fig. 4B and C). Comparable striations in the capsid's mechanical maps were observed in 15 of 23 analyzed cores (4 representative cores are displayed in Fig. 5A). As reverse transcription proceeded, the pattern began to disappear (Fig. 4D) until it was completely gone after 17 h (Fig. 4E). When reverse transcription was inhibited by efavirenz, the mechanical maps of the core surface had a more homogenous stiffness distribution, lacking any clear pattern (Fig. 5B). The coherence between the time course of the coiled filament and reverse transcription suggests that this structure represents a newly synthesized product of the reverse transcription reaction or an intermediate complex between RT and the partially transcribed ssRNA. This filament appears to be stiffer than ssRNA and may pose a challenge to the ability of the volume-constrained viral capsid to accommodate it. Organizing this filament in a spiral architecture reduces its curvature radius and permits packaging within the capsid. Moreover, the arrangement of the filament in an organized structure implies that it may have specific interactions with the capsid subunits. These interactions may reinforce the structure of the capsid and may be the reason for the observed increased stiffness of the core after 7 h of reverse transcription. Similar reinforcement interactions between viral DNA and capsids are known to occur in the mouse minute virus (21) and during packaging of DNA bacteriophage genomes (22).
FIG 4.
High-resolution spatial mechanical mapping of an individual HIV-1 core surface during reverse transcription. Cores were adhered to HMDS-coated glass slides and kept in MOPS buffer. Reactions were initiated by adding dNTPs and MgCl2 to the cores. Images were acquired using the QI mode. (A) The mechanical map of a core before the beginning of reverse transcription. (B) The same core after 7 h of reverse transcription. (C) A three-dimensional tilted rendition of the core shown in panel B. The mechanical map was overlaid onto the core topography to correlate between the two data sets. (D and E) Mechanical maps of the same core after 13 and 17 h of reverse transcription, respectively. Scale bars, 50 nm.
FIG 5.
High-resolution spatial mechanical mapping of HIV-1 cores. Cores were adhered to HMDS-coated glass slides and kept in MOPS buffer. Reverse transcription was initiated by adding dNTPs and MgCl2 to the cores. Stiffness surface distributions of cores after 7 h of reverse transcription in the absence (A) or presence (B) of the reverse transcription inhibitor efavirenz are shown. Images were acquired using the QI mode. The total number of cores analyzed was 23.
In studies involving detergent-permeabilized virions, the efficiency of reverse transcription in vitro is typically low, suggesting that the effects observed with purified cores may not be a direct consequence of viral DNA synthesis. Therefore, to evaluate the efficiency of reverse transcription, we carried out endogenous reverse transcription (ERT) reactions and quantified the efficiency of reverse transcription by quantitative PCR (qPCR) for viral DNA synthesis and the number of cores by RT-PCR for viral genomic RNA (Fig. 6). Our analysis demonstrated that 40 to 50% of the viral RNA was converted to DNA in the initial step of reverse transcription (minus strand strong stop), indicating that a significant fraction of the cores were active for reverse transcription. In contrast, only 1% of the templates continued to the next step (DNA synthesized immediately following the first-strand transfer step). In addition, the ERT kinetic analysis shows that reverse transcription activity was completed within the first 2 h. This result appears kinetically discordant with our AFM analysis of cores during reverse transcription, in which the core stiffness was peaked at 7 h. The observed discrepancy could result from differences between the two types of experiments: the ERT analysis was performed on soluble HIV-1 cores, whereas immobilized cores were used for the AFM studies. It is therefore possible that reverse transcription in immobilized cores is slower than that in soluble cores. To test this possibility, we added efavirenz to the transcription buffer 2.5 h into reverse transcription and monitored the reaction progress by AFM. If the transcription activity is terminated within the first 2 h, as indicated by our ERT analysis, the addition of efavirenz after 2.5 h should have no effect. However, we observed that the stiffness of the cores was essentially unchanged throughout the remainder of the measurement (Fig. 7). Moreover, the morphology of the cores remained intact throughout the experiment time course (24 h), as did the number of observed intact cores per μm2 (the total number of cores imaged was 38). Based on these results, we suggest that the rate of reverse transcription is slower in immobilized cores versus in solution. At present, we cannot rule out the possibility that reverse transcription in immobilized cores may proceed beyond the synthesis of minus strand strong stop DNA more efficiently: despite extensive efforts, we were unsuccessful at quantifying ERT in immobilized cores. Nonetheless, our solution-based ERT assays of HIV-1 cores demonstrated that a majority of the isolated HIV-1 cores were competent for the initial stage of reverse transcription.
FIG 6.
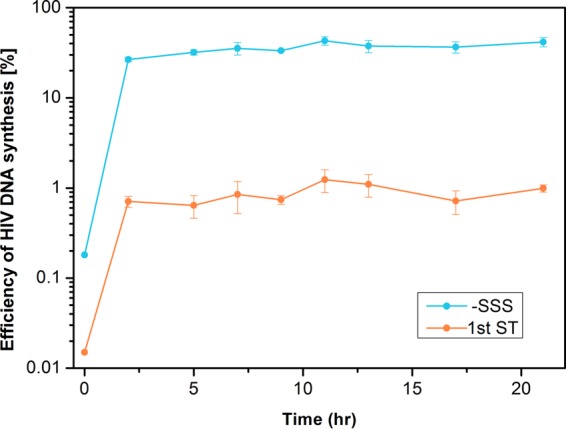
Kinetic analysis of endogenous reverse transcription in purified HIV-1 cores. Endogenous reverse transcription was analyzed with gradient-purified wild-type HIV 1 cores. Reactions were initiated by the addition of dNTPs and MgCl2 and incubated at 37°C for the indicated time periods, and the copy numbers of the minus-strand strong stop and first-strand transfer products were determined by qPCR. The efficiency of the viral cDNA synthesis was calculated as the percentage of viral RNA converted to the respective viral cDNA product. Similar results were obtained when reactions were performed at 25°C to simulate the reactions performed for AFM analysis.
FIG 7.
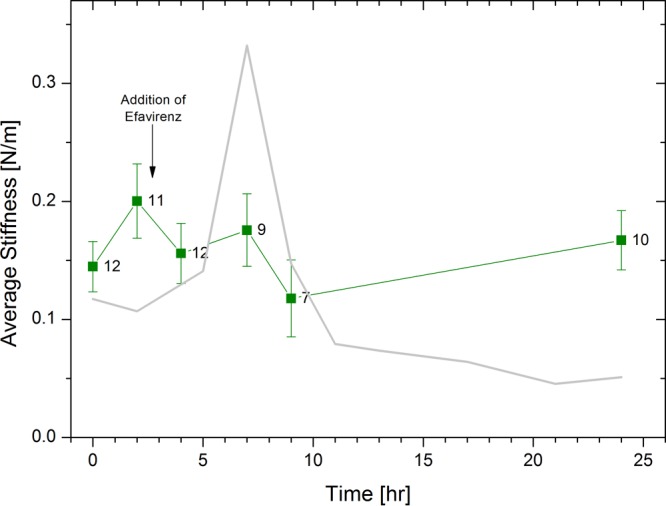
Average measured stiffness values of isolated HIV-1 cores as a function of the progress of reverse transcription with delayed addition of efavirenz. Reverse transcription was initiated by adding dNTPs and MgCl2 to the cores. At 2.5 h into the reaction, RT inhibitor (100 nM efavirenz) was added to the reverse transcription buffer. WT data without RT inhibitor (taken from Fig. 1) is presented as a gray line for comparison. The error bars represent the standard errors of the mean, and the number of cores analyzed is indicated beside each data point.
Mutations in CA can alter the intrinsic stability of the HIV-1 core, as well as their stiffness (11, 12, 23). To determine whether CA mutations altering the intrinsic stiffness of the viral capsid would affect the stiffness and morphological changes occurring during reverse transcription, we measured the effect of the hyperstable capsid mutant E45A on the core's morphology and stiffness. First, we analyzed the average stiffness of E45A cores, during the time course of reverse transcription (Fig. 8), with average stiffness values prior to reverse transcription (0.21 ± 0.02 N/m, n = 11) positioned at time zero. In agreement with our previously reported findings (23), the mutated core's initial stiffness was nearly twice that of wild-type HIV-1 cores (0.12 ± 0.03 N/m, n = 19). Next, we initiated reverse transcription and monitored core stiffness values as a function of time. The average core stiffness increased to a maximum of 0.33 ± 0.03 N/m (n = 9) at 5 h. While the maximum stiffness value of E45A cores was similar to that of WT, the peak appeared earlier (4 h compared to 7 h in WT). Subsequently, core stiffness dropped back to its initial value (0.21 ± 0.02 N/m, n = 10) and remained unchanged over the duration of the reaction, which was terminated after 24 h. However, during the reaction, the cores remained intact without observed opening (total of 22 cores were imaged).
FIG 8.
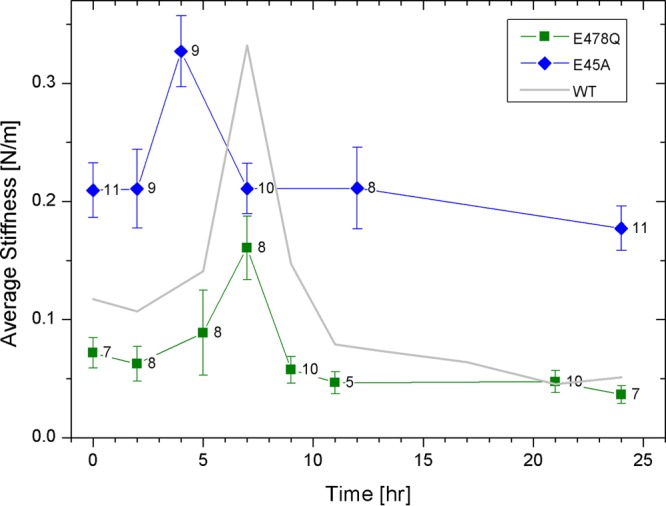
Measured stiffness values of isolated E45A and E478Q HIV-1 cores as a function of the progress of reverse transcription. Cores were adhered to HMDS-coated glass slides and kept in MOPS buffer. Transcription was initiated by adding dNTPs and MgCl2 to the cores, and their stiffness was measured by AFM. The initial average stiffness value of cores prior to reverse transcription is represented as time zero. WT data (taken from Fig. 1) is presented as a gray line for comparison. The error bars represent the standard error of the mean, and the number of cores analyzed is indicated beside each data point.
In another set of experiments, we examined cores from an RT mutant defective in RNaseH activity (E478Q). In separate ERT assays with permeabilized virions in which we followed the progress of reverse transcription by qPCR, we confirmed that the mutant is competent for synthesis of minus strand strong stop DNA but is selectively impaired in minus strand transfer (Fig. 9). During reverse transcription, E478Q cores exhibited maximal stiffness at 7 h, with a lower stiffness peak (0.16 ± 0.03 N/m, n = 8) compared to WT (0.33 ± 0.06 N/m, n = 7). The mutant cores remained intact throughout the duration of the experiment (total of 21 cores were imaged). Thus, while ERT reactions demonstrated that the minus strand transfer reaction is relatively inefficient, AFM analysis indicates that strong stop synthesis is insufficient for reverse transcription-driven capsid disassembly in vitro.
FIG 9.
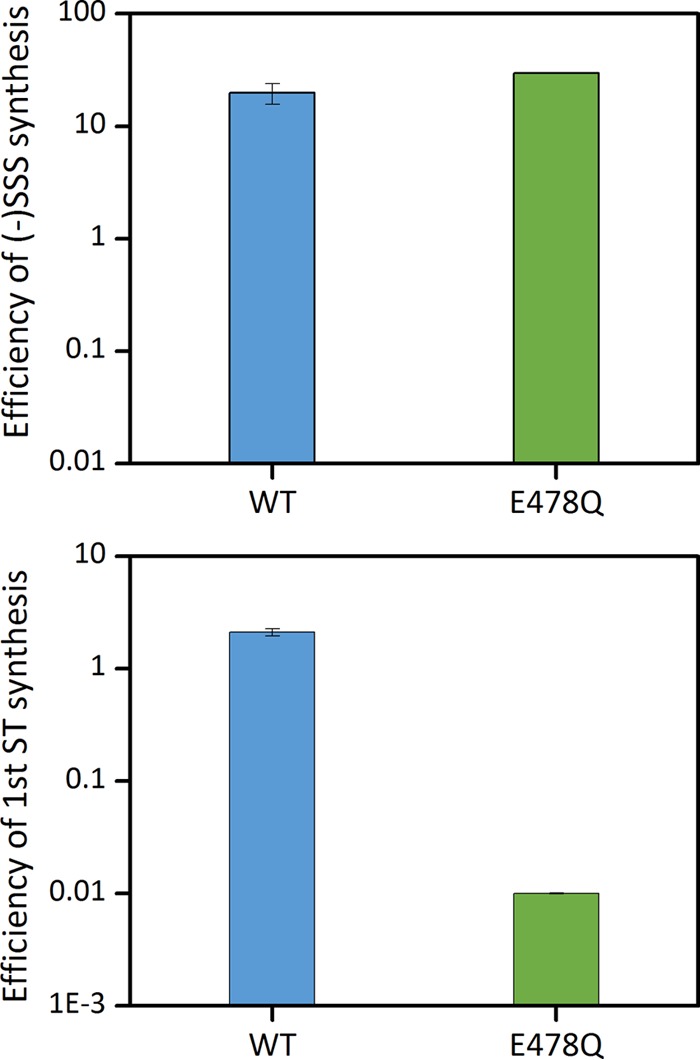
Endogenous reverse transcription in WT and RT mutant virions. Endogenous reverse transcription was performed with permeabilized gradient-purified wild-type (blue bars) and E478Q RT mutant (green bars) HIV-1 particles. Viral cDNA synthesis was initiated by the addition dNTPs and MgCl2, followed by incubation at 37°C. Reactions were terminated at 6 h, and the indicated reverse transcription products were assayed by qPCR. The efficiency of the viral cDNA synthesis was calculated as a percentage of the input HIV-1 RNA in each reaction.
DISCUSSION
In this study, we monitored the morphological and mechanical changes in isolated HIV-1 cores during the course of reverse transcription. We observed that in the wild type (WT) and the E478Q RT mutant, the core's stiffness increased to a maximum at 7 h after the initiation of reverse transcription. Interestingly, in the E45A capsid mutant the peak stiffness appeared sooner, after 4 h of transcription. This kinetic difference may be related to the observation that E45A cores appear to be more permeable to small molecules than WT cores (24), suggesting that reverse transcription may occur more rapidly owing to enhanced dNTP influx. Recent data suggest that nucleotides are transported into the core through electrostatic channels that were found in CA hexamers (25). It is possible that the increased permeability of the E45A cores is due to changes in these channels. In parallel, high-resolution stiffness distribution maps of WT cores reveal the formation of a stiff coiled filamentous structure beneath the capsid surface. The observed stiffness increase represents the growth in the internal pressure applied by the stiff filament. Subsequently, the coiled structure disappears, the stiffness of the capsid declined abruptly, and the cores are partially or completely ruptured. When the reverse transcription inhibitor, efavirenz, was added to the buffer, or when dNTPs were excluded from the buffer, the stiffness of the cores was unchanged and the cores remained intact, during the entire length of the measurement (24 h). We conclude that the characteristic stiffness profile that is accompanied with capsid disassembly depends on reverse transcription.
Based on our findings, we propose that, during reverse transcription, a stiff filamentous structure begins to organize into a spiral structure underneath the surface of the core. This structure is unlikely to represent dsDNA, since the efficiency of reverse transcription in soluble cores was similar to that in immobilized cores. Thus, at this stage we cannot determine whether the observed filamentous structure represents an intermediate complex between RT and the viral RNA, the RNA-DNA heteroduplex, or another product of the reverse transcription reaction. Nonetheless, our results suggest that prior to reverse transcription, the viral RNA is folded in a compact conformation that can be encapsulated within the viral capsid. During reverse transcription, the formation of the strong stop DNA likely induces profound changes in the ribonucleoprotein complex that correspond to the formation of the coiled filamentous structure. As reverse transcription progresses, the curved filament applies an increasing internal force that pushes outward onto the core surface, which is conceptually consistent with a recent theoretical analysis (26). Consequently, the measured stiffness of the core increases, because this internal force acts against the force applied by the AFM probe. Although defects in HIV-1 cores have been described, a recent report suggests that a major fraction of HIV-1 particles contain cores without apparent holes or gaps in the capsid (2). The internal pressure of the core can increase only if its structure is intact, and the observed pressure buildup is consistent with an intact capsid lattice. After approximately 7 h of reverse transcription, the core stiffness declines. In contrast to the WT, the stiffness decrease observed in the E45A and E478Q mutants is ∼2-fold smaller and did not result in capsid disassembly. We therefore postulate that the decrease in the core stiffness may be due to an additional conformational change of the stiff filament. Furthermore, the RNase H mutant (E478Q) results show that while strong stop DNA synthesis is necessary for capsid disassembly, it is not sufficient. When the stress applied by the filament exceeds the strength of the core structure, the capsid is perforated. Our structural analysis did not detect any damage to the core at the 7-h time point, which may indicate that this early fracture event is too subtle to be detected by AFM. In the following hours, the fracture continues to grow, until the opening is sufficiently large that it appears in our AFM topographic images and scanning electron microscopy (SEM) analysis (Fig. 2C to L and Fig. 3B to D). The failure of the core structure is expected to begin at the least stable region of the capsid. We observed that the cores normally broke open in the proximity of the core narrow end. A structural study conducted using high-resolution electron microscopy showed that the local density of CA pentamers is highest at the narrow end of the core (1–3, 27). This region may be weaker due to the differences in intersubunit contacts within pentamers compared to hexamers, as recently shown (2). Thus, we speculate that the structural failure of the core begins at one or several pentamer locations at the narrow end. Unfortunately, we currently lack the spatial resolution required to determine whether core opening originates at the capsid pentamers. Lentiviruses are characterized by conical-shaped cores, whereas other retroviruses have more spherical-shaped cores. In addition, lentiviruses are more efficient in infecting nondividing cells, and their infectivity depends on capsid stability. It is therefore tempting to speculate that the cone-shaped cores are important for lentivirus infection by introducing inherently structural weak zones. As the internal pressure is increased during reverse transcription, these weak regions will fail and initiate capsid disassembly. We are currently studying other lentiviruses to determine whether they share similar reverse transcription induce capsid disassembly, as we have shown in HIV-1.
It should be noted that ours and others' (20, 28) biochemical analyses indicate that HIV-1 reverse transcription of ssRNA is not completed in vitro. These studies, together with our findings, imply that initiation of uncoating does not require complete reverse transcription of the viral genome. Moreover, because this work was performed with purified HIV-1 cores in the absence of cellular proteins, it does not appear necessary to require a direct role for cellular factors in the initiation of uncoating. Reverse transcription appears to be sufficient to generate the first breach in the capsid. Of course, this does not formally exclude a role for cellular proteins in modulating either early or late stages of uncoating.
Examination of core morphology during reverse transcription using AFM revealed that capsid disassembly and reverse transcription proceed in tandem. Our mechanical analysis indicates that, prior to core breakage, the stiffness of the core increases immensely. We submit that the increased stiffness, induced by reverse transcription, mechanically triggers capsid disassembly by stressing the capsid lattice. This ensures that HIV-1 uncoating occurs only after the core encounters a favorable cytoplasmic environment for reverse transcription. The E45A mutant results demonstrate the mechanical interplay between the stability of the capsid and the force that is generated during reverse transcription. If the capsid stability is too high, the force generated during reverse transcription is not sufficient to breach the capsid structure. It is possible that similar mechanical mechanism prevented E478Q capsid disassembly during reverse transcription. In the latter case, the initial stiffness of the core was similar to WT, but the maximum peak stiffness was 2-fold lower, which may not be sufficient to fracture the capsid. At this stage, however, we cannot rule out the possibility that the E478Q mutation prevents capsid disassembly through an alternative mechanism. For example, the degradation of the template RNA may be required for capsid disassembly. Determining the identity of the trigger for capsid disassembly and its mechanism will be the focus of future studies.
MATERIALS AND METHODS
Isolation of HIV-1 cores.
HIV-1 cores were isolated from pseudovirus particles. To produce pseudo HIV-1 viruses, approximately 106 HEK293T cells (from American Type Culture Collection) were transfected with 2.5 μg of ΔEnv IN- HIV-1 plasmid (DHIV3-GFP-D116G) (29) using 10 μg of polyethylenimine (PEI; Sigma-Aldrich). The medium was removed after 20 h, and the cells were washed with sterile phosphate-buffered saline. Fresh medium was then added (Dulbecco modified Eagle medium supplemented with 10% heat-inactivated bovine serum, 1% penicillin-streptomycin, and 1% glutamine), and the cells were incubated at 37°C in 5% CO2. The supernatant was harvested after 6 h, centrifuged at 1,000 rpm for 10 min, and filtered through a 0.45-μm-pore size filter. Viruses (60 ml) were concentrated by ultracentrifugation in a SW-28 rotor (25,000 rpm, 2 h, 4°C) using OptiPrep density gradient medium (Sigma-Aldrich). Virus particles were banded at the buffer-OptiPrep interface. Nearly 90% of the upper and lower layers were removed by using a syringe. Then, 10 ml of TNE buffer (50 mM Tris-HCl, 100 mM NaCl, 0.1 mM EDTA [pH 7.4]) was added to the tube, and the sample was mixed by gentle pipetting. The mixture was placed in 100-kDa molecular mass cutoff Vivaspin 20 centrifugal concentrators (Sartorius AG, Germany) and centrifuged twice at 2,500 × g for 25 to 30 min at 4°C, until the final volume of supernatant in the concentrators reached 200 to 300 μl.
Viral cores were isolated from the virus-containing supernatant using a modified version of a previously described protocol (19). Briefly, TNE buffer (∼40 μl) containing purified HIV-1 pseudovirus particles was mixed with equal amount of 1% Triton-X diluted in 100 mM MOPS buffer (pH 7.0) and centrifuged at 13,800 × g for 8 min at 4°C. The supernatant was removed, and the pellet was resuspended in MOPS buffer (∼80 μl). The sample was centrifuged again at 13,800 × g for 8 min at 4°C, and the pellet was resuspended in MOPS buffer (10 μl).
AFM measurements and analysis.
A MOPS buffer solution containing the isolated cores (10 μl) was incubated for 30 min on hexamethyldisilazane (HMDS)-coated microscope glass slides. Measurements were carried out with a JPK Nanowizard Ultra-Speed atomic force microscope (JPK Instruments, Berlin, Germany) mounted on an inverted optical microscope (Axio Observer; Carl Zeiss, Heidelberg, Germany). Silicon nitride probes with a mean cantilever spring constant of 0.12 N/m (DNP; Bruker) were used. The spring constant of the probes were determined experimentally by measuring thermal fluctuation (30). Imaging was performed in quantitative imaging (QI) mode, which is a force curve-based imaging mode. Briefly, a force curve is acquired at each pixel to a predefined maximal loading force. The height topographic image is determined by the displacement of a Z-piezo scanner, which is required to reach the preset maximal load. The slopes of the force curves at each pixel are used to generate the high-lateral-resolution mechanical map images. Images were acquired at a rate of 0.5 lines/s and a loading force of 300 pN. All measurements were carried out in MOPS buffer on nonfixed cores. Each set of experiments consisted of at least three independent preparations of cores.
Capsid stiffness was determined based on indentation type experiments as previously described (31–33). Each capsid stiffness value was obtained by acquiring a set of 20 force distance curves at 24 different locations on the capsid surface. Each curve was acquired by elastically indenting the sample to a maximum of 4 nm (corresponding to a maximum loading force of 0.2 to 1.5 nN). Curves were obtained at a rate of 20 Hz. Prior to analysis, each curve within a set was shifted to set the deflection in the noncontact section to zero. The set of force distance curves was then averaged. Stiffness was calculated using Hooke's law on the assumption that the experimental system may be modeled as two springs (the capsid and the cantilever) arranged in series. To reduce the error in the calculated point stiffness, we chose cantilevers such that the measured point stiffness was <70% of the cantilever spring constant. Data analysis was carried out using MATLAB software (The Math Works, Natick, MA).
Scanning electron microscopy imaging.
Virus cores isolated and purified as described above were deposited on 1 mg/ml poly-l-lysine-coated silica chips. Cores were then fixed with Karnovski fixative at room temperature for 1 h, followed by incubation overnight at 40°C. After fixation, the samples were incubated in 1% osmium tetroxide in 0.1 M sodium cacodylate buffer for 1 h at room temperature. Dehydration in increasing ethanol concentrations was followed by critical point drying (Bal-Tec, Lichtenstein). The samples were sputter coated with 2-nm chromium and visualized by SEM using a FEG Ultra55 scanning electron microscope (Zeiss).
ERT with WT virus and CA and RT mutant viruses for AFM analysis.
Reverse transcription was induced in cores attached to HMDS-coated microscope glass slides. To initiate reverse transcription, MOPS buffer was replaced with reverse transcription buffer (100 μM dNTPs and 1 mM MgCl2 in 100 mM MOPS buffer [pH 7.0]) (20). To study the effect of the reverse transcription inhibitor (efavirenz; AIDS Reagent Program, National Institutes of Health [NIH]), efavirenz was added to the reverse transcription buffer to achieve final concentrations of 100 μM dNTPs, 1 mM MgCl2, and 100 nM efavirenz. All measurements were carried out at room temperature (23 to 25°C).
Assay of HIV-1 ERT activity in permeabilized HIV-1 particles.
WT (R9.Env−) and RT mutant (E478Q, also in R9.Env− background) viruses were produced by transfecting 293T cells with PEI transfection reagent (Sigma-Aldrich) as follows. 293T cells were cultured in Dulbecco modified Eagle medium (DMEM) supplemented with 10% fetal bovine serum and penicillin-streptomycin (100 IU/ml and 100 μg/ml) at 37°C and 5% CO2. Three million 293T cells were plated on 100-mm cell culture dishes in 9 ml of culture medium 1 day prior to the transfection. The next day, the cells exhibited about 50% confluence and were transfected with 10 μg of the WT or RT mutant plasmid DNA and 40 μl of 1-mg/ml PEI transfection reagent. Twelve plates of 293T cells were transfected per virus to be analyzed. The cultures were incubated at 35°C, 3% CO2 for 14 to 16 h. The medium was then aspirated, the cells were washed twice with 5 ml of DMEM without serum, followed by the addition of 5.5 ml of fresh complete medium to each plate. The cultures were grown for 48 h. The harvested virus supernatants were centrifuged at 1,500 × g for 5 min to pellet cells and debris and then clarified by passing through a 0.45-μm-pore size syringe filter. To remove any carryover plasmid DNA, the filtered virus was treated with DNase I (Calbiochem) at 2 μg/ml in the presence of 10 mM MgCl2 at 37°C for 1 h. The virus supernatant was then transferred to a 38.5-ml polyallomer centrifuge tube (for the Beckman SW32Ti rotor) and underlaid with 3 ml of 20% (wt/vol) sucrose. The viruses were then pelleted by centrifugation at 32,000 rpm for 3 h at 4°C (175,000 × g). The supernatant was removed by aspiration, and the virus pellet in each tube was gently resuspended in 250 μl of STE buffer (10 mM Tris-HCl [pH 7.4], 100 mM NaCl, 1 mM EDTA) at 4°C for 2 to 4 h. The resuspended virus samples were overlaid on 30 to 70% linear sucrose density gradients, and the gradients were centrifuged for 16 to 18 h at 187,000 × g (32,000 rpm in Beckman SW32Ti rotor) at 4°C. Then, 1-ml fractions were then collected from the top of the gradient and analyzed for CA content by a p24 enzyme-linked immunosorbent assay (PMID 245608). For the ERT assay, 5 μl of the fraction with peak CA content was added to 45 μl of 1.1× ERT assay buffer to yield final concentrations of 10 mM Tris-HCl (pH 7.9), 0.25 mM dNTP mix [four dNTPs], 1.2 mM MgCl2, and 0.05% [vol/vol] Triton X-100). In control reactions, the reverse transcriptase inhibitor efavirenz was added to a final concentration of 0.5 μM. Reaction mixtures were incubated at 37°C for either 0 or 6 h. The reactions were terminated by adding proteinase K to a concentration of 1 mg/ml and incubation at 57°C for 1 h, followed by heat inactivation at 98°C for 15 min. HIV-1 DNA was assayed by qPCR using stage-specific viral DNA primers with a MX-3000p instrument and SYBR green detection. R9ΔE plasmid was used to generate a standard curve in each experiment. HIV-1 genomic RNA was assayed by isolating total RNA from the peak virus fraction using TRIzol (Bio-Rad), followed by cDNA synthesis using an iScript cDNA synthesis kit (Bio-Rad) and qPCR on the cDNA products as described above. The ERT efficiency was calculated as a percentage of the viral RNA that was converted to the respective DNA products in the reactions.
HIV-1 primers for real-time PCR.
The HIV-1 primers used for real-time PCR were as follows: minus-strand strong stop forward primer, 5′-GGTCTCTCTGGTTAGACCA-3′; minus-strand strong stop reverse primer, 5′-AAGCAGTGGGTTCCCTAGTTAG-3′; first-strand transfer forward primer, 5′-AGCAGCTGCTTTTTGCCTGTACT-3′; and first-strand transfer reverse primer, 5′-ACACAACAGACGGGCACACAC-3′.
ACKNOWLEDGMENTS
We thank Jing Zhou, Milena Pesic, and Ayelet Orenbuch for technical assistance.
The electron microscopy studies were supported in part by the Irving and Cherna Moskowitz Center for Nano and Bio-Nano Imaging at the Weizmann Institute of Science. R.R. and S.R. were supported by fellowships from the Kreitman School of Advanced Studies (Ben-Gurion University of the Negev). This study was supported in part by NIH grant RO1 AI076121 and by the Israel Science Foundation (grant 1115/13). The efavirenz was obtained from the NIH AIDS Reagent Program, Division of AIDS, National Institute of Allergy and Infectious Disease, NIH.
REFERENCES
- 1.Ganser BK, Li S, Klishko VY, Finch JT, Sundquist WI. 1999. Assembly and analysis of conical models for the HIV-1 core. Science 283:80–83. doi: 10.1126/science.283.5398.80. [DOI] [PubMed] [Google Scholar]
- 2.Mattei S, Glass B, Hagen WJ, Krausslich HG, Briggs JA. 2016. The structure and flexibility of conical HIV-1 capsids determined within intact virions. Science 354:1434–1437. doi: 10.1126/science.aah4972. [DOI] [PubMed] [Google Scholar]
- 3.Zhao G, Perilla JR, Yufenyuy EL, Meng X, Chen B, Ning J, Ahn J, Gronenborn AM, Schulten K, Aiken C, Zhang P. 2013. Mature HIV-1 capsid structure by cryo-electron microscopy and all-atom molecular dynamics. Nature 497:643–646. doi: 10.1038/nature12162. [DOI] [PMC free article] [PubMed] [Google Scholar]
- 4.Matreyek KA, Engelman A. 2013. Viral and cellular requirements for the nuclear entry of retroviral preintegration nucleoprotein complexes. Viruses 5:2483–2511. doi: 10.3390/v5102483. [DOI] [PMC free article] [PubMed] [Google Scholar]
- 5.Lelek M, Di Nunzio F, Henriques R, Charneau P, Arhel N, Zimmer C. 2012. Superresolution imaging of HIV in infected cells with FlAsH-PALM. Proc Natl Acad Sci U S A 109:8564–8569. doi: 10.1073/pnas.1013267109. [DOI] [PMC free article] [PubMed] [Google Scholar]
- 6.Lee K, Ambrose Z, Martin TD, Oztop I, Mulky A, Julias JG, Vandegraaff N, Baumann JG, Wang R, Yuen W, Takemura T, Shelton K, Taniuchi I, Li Y, Sodroski J, Littman DR, Coffin JM, Hughes SH, Unutmaz D, Engelman A, KewalRamani VN. 2010. Flexible use of nuclear import pathways by HIV-1. Cell Host Microbe 7:221–233. doi: 10.1016/j.chom.2010.02.007. [DOI] [PMC free article] [PubMed] [Google Scholar]
- 7.Price AJ, Jacques DA, McEwan WA, Fletcher AJ, Essig S, Chin JW, Halambage UD, Aiken C, James LC. 2014. Host cofactors and pharmacologic ligands share an essential interface in HIV-1 capsid that is lost upon disassembly. PLoS Pathog 10:e1004459. doi: 10.1371/journal.ppat.1004459. [DOI] [PMC free article] [PubMed] [Google Scholar]
- 8.De Iaco A, Luban J. 2014. Cyclophilin A promotes HIV-1 reverse transcription but its effect on transduction correlates best with its effect on nuclear entry of viral cDNA. Retrovirology 11:11. doi: 10.1186/1742-4690-11-11. [DOI] [PMC free article] [PubMed] [Google Scholar]
- 9.Shah VB, Shi J, Hout DR, Oztop I, Krishnan L, Ahn J, Shotwell MS, Engelman A, Aiken C. 2013. The host proteins transportin SR2/TNPO3 and cyclophilin A exert opposing effects on HIV-1 uncoating. J Virol 87:422–432. doi: 10.1128/JVI.07177-11. [DOI] [PMC free article] [PubMed] [Google Scholar]
- 10.Rasaiyaah J, Tan CP, Fletcher AJ, Price AJ, Blondeau C, Hilditch L, Jacques DA, Selwood DL, James LC, Noursadeghi M, Towers GJ. 2013. HIV-1 evades innate immune recognition through specific cofactor recruitment. Nature 503:402–405. doi: 10.1038/nature12769. [DOI] [PMC free article] [PubMed] [Google Scholar]
- 11.Forshey BM, von Schwedler U, Sundquist WI, Aiken C. 2002. Formation of a human immunodeficiency virus type 1 core of optimal stability is crucial for viral replication. J Virol 76:5667–5677. doi: 10.1128/JVI.76.11.5667-5677.2002. [DOI] [PMC free article] [PubMed] [Google Scholar]
- 12.Tang S, Murakami T, Agresta BE, Campbell S, Freed EO, Levin JG. 2001. Human immunodeficiency virus type 1 N-terminal capsid mutants that exhibit aberrant core morphology and are blocked in initiation of reverse transcription in infected cells. J Virol 75:9357–9366. doi: 10.1128/JVI.75.19.9357-9366.2001. [DOI] [PMC free article] [PubMed] [Google Scholar]
- 13.Arhel NJ, Souquere-Besse S, Munier S, Souque P, Guadagnini S, Rutherford S, Prevost MC, Allen TD, Charneau P. 2007. HIV-1 DNA flap formation promotes uncoating of the preintegration complex at the nuclear pore. EMBO J 26:3025–3037. doi: 10.1038/sj.emboj.7601740. [DOI] [PMC free article] [PubMed] [Google Scholar]
- 14.Hulme AE, Perez O, Hope TJ. 2011. Complementary assays reveal a relationship between HIV-1 uncoating and reverse transcription. Proc Natl Acad Sci U S A 108:9975–9980. doi: 10.1073/pnas.1014522108. [DOI] [PMC free article] [PubMed] [Google Scholar]
- 15.Yang Y, Fricke T, Diaz-Griffero F. 2013. Inhibition of reverse transcriptase activity increases stability of the HIV-1 core. J Virol 87:683–687. doi: 10.1128/JVI.01228-12. [DOI] [PMC free article] [PubMed] [Google Scholar]
- 16.Cosnefroy O, Murray PJ, Bishop KN. 2016. HIV-1 capsid uncoating initiates after the first strand transfer of reverse transcription. Retrovirology 13:58. doi: 10.1186/s12977-016-0292-7. [DOI] [PMC free article] [PubMed] [Google Scholar]
- 17.Francis AC, Marin M, Shi J, Aiken C, Melikyan GB. 2016. Time-resolved imaging of single HIV-1 uncoating in vitro and in living cells. PLoS Pathog 12:e1005709. doi: 10.1371/journal.ppat.1005709. [DOI] [PMC free article] [PubMed] [Google Scholar]
- 18.Da Silva Santos C, Tartour K, Cimarelli A. 2016. A novel entry/uncoating assay reveals the presence of at least two species of viral capsids during synchronized HIV-1 infection. PLoS Pathog 12:e1005897. doi: 10.1371/journal.ppat.1005897. [DOI] [PMC free article] [PubMed] [Google Scholar]
- 19.Welker R, Hohenberg H, Tessmer U, Huckhagel C, Krausslich HG. 2000. Biochemical and structural analysis of isolated mature cores of human immunodeficiency virus type 1. J Virol 74:1168–1177. doi: 10.1128/JVI.74.3.1168-1177.2000. [DOI] [PMC free article] [PubMed] [Google Scholar]
- 20.Zhang H, Dornadula G, Pomerantz RJ. 1996. Endogenous reverse transcription of human immunodeficiency virus type 1 in physiological microenvironments: an important stage for viral infection of nondividing cells. J Virol 70:2809–2824. [DOI] [PMC free article] [PubMed] [Google Scholar]
- 21.Carrasco C, Carreira A, Schaap IA, Serena PA, Gomez-Herrero J, Mateu MG, de Pablo PJ. 2006. DNA-mediated anisotropic mechanical reinforcement of a virus. Proc Natl Acad Sci U S A 103:13706–13711. doi: 10.1073/pnas.0601881103. [DOI] [PMC free article] [PubMed] [Google Scholar]
- 22.Hernando-Perez M, Miranda R, Aznar M, Carrascosa JL, Schaap IA, Reguera D, de Pablo PJ. 2012. Direct measurement of phage phi29 stiffness provides evidence of internal pressure. Small 8:2366–2370. doi: 10.1002/smll.201200664. [DOI] [PubMed] [Google Scholar]
- 23.Ramalho R, Rankovic S, Zhou J, Aiken C, Rousso I. 2016. Analysis of the mechanical properties of wild type and hyperstable mutants of the HIV-1 capsid. Retrovirology 13:17. doi: 10.1186/s12977-016-0250-4. [DOI] [PMC free article] [PubMed] [Google Scholar]
- 24.Xu H, Franks T, Gibson G, Huber K, Rahm N, Strambio De Castillia C, Luban J, Aiken C, Watkins S, Sluis-Cremer N, Ambrose Z. 2013. Evidence for biphasic uncoating during HIV-1 infection from a novel imaging assay. Retrovirology 10:70. doi: 10.1186/1742-4690-10-70. [DOI] [PMC free article] [PubMed] [Google Scholar]
- 25.Jacques DA, McEwan WA, Hilditch L, Price AJ, Towers GJ, James LC. 2016. HIV-1 uses dynamic capsid pores to import nucleotides and fuel encapsidated DNA synthesis. Nature 536:349–353. doi: 10.1038/nature19098. [DOI] [PMC free article] [PubMed] [Google Scholar]
- 26.Rouzina I, Bruinsma R. 2014. DNA confinement drives uncoating of the HIV virus. Eur Phys J Spec Top 223:1745–1754. doi: 10.1140/epjst/e2014-02223-x. [DOI] [Google Scholar]
- 27.Sundquist WI, Krausslich HG. 2012. HIV-1 assembly, budding, and maturation. Cold Spring Harb Perspect Med 2:a006924. doi: 10.1101/cshperspect.a015420. [DOI] [PMC free article] [PubMed] [Google Scholar]
- 28.Warrilow D, Stenzel D, Harrich D. 2007. Isolated HIV-1 core is active for reverse transcription. Retrovirology 4:77. doi: 10.1186/1742-4690-4-77. [DOI] [PMC free article] [PubMed] [Google Scholar]
- 29.Dehart JL, Andersen JL, Zimmerman ES, Ardon O, An DS, Blackett J, Kim B, Planelles V. 2005. The ataxia telangiectasia-mutated and Rad3-related protein is dispensable for retroviral integration. J Virol 79:1389–1396. doi: 10.1128/JVI.79.3.1389-1396.2005. [DOI] [PMC free article] [PubMed] [Google Scholar]
- 30.Hutter JL, Bechhoefer J. 1993. Calibration of Atomic-Force Microscope Tips. Rev Sci Instrum 64:1868–1873. doi: 10.1063/1.1143970. [DOI] [Google Scholar]
- 31.Kol N, Gladnikoff M, Barlam D, Shneck RZ, Rein A, Rousso I. 2006. Mechanical properties of murine leukemia virus particles: effect of maturation. Biophys J 91:767–774. doi: 10.1529/biophysj.105.079657. [DOI] [PMC free article] [PubMed] [Google Scholar]
- 32.Kol N, Shi Y, Tsvitov M, Barlam D, Shneck RZ, Kay MS, Rousso I. 2007. A stiffness switch in human immunodeficiency virus. Biophys J 92:1777–1783. doi: 10.1529/biophysj.106.093914. [DOI] [PMC free article] [PubMed] [Google Scholar]
- 33.Pang HB, Hevroni L, Kol N, Eckert DM, Tsvitov M, Kay MS, Rousso I. 2013. Virion stiffness regulates immature HIV-1 entry. Retrovirology 10:4. doi: 10.1186/1742-4690-10-4. [DOI] [PMC free article] [PubMed] [Google Scholar]


