Abstract
Kung-Som is a popular traditional Thai fermented shrimp product. It is rich in glutamic acid, which is the major substrate for the biosynthesis of gamma-aminobutyric acid (GABA) by lactic acid bacteria (LAB). In the present study, LAB from Kung-Som were isolated, screened for GABA formation, and the two isolates that transform glutamic acid most efficiently into GABA were identified. Based on the API-CHL50 fermentation profile and a phylogenetic tree of 16S rDNA sequences, strain CS3 and CS5 were identified as Lactobacillus futsaii, which was for the first time shown to be a promising GABA producer. L. futsaii CS3 was the most efficient microorganism for the conversion of 25 mg/mL monosodium glutamate (MSG) to GABA, with a maximum yield of more than 99% conversion rate within 72 h. The open reading frame (ORF) of the glutamate decarboxylase (gad) gene was identified by PCR. It consists of 1410 bp encoding a polypeptide of 469 amino acids with a predicted molecular weight of 53.64 kDa and an isoelectric point (pI) of 5.56. Moreover, a good quality of the constructed model of L. futsaii CS3 was also estimated. Our results indicate that L. futsaii CS3 could be of interest for the production of GABA-enriched foods by fermentation and for other value-added products.
Electronic supplementary material
The online version of this article (doi:10.1007/s12088-016-0632-2) contains supplementary material, which is available to authorized users.
Keywords: Gamma-aminobutyric acid (GABA), Glutamate decarboxylase (gad) gene, Kung-Som, Lactic acid bacteria, Lactobacillus futsaii
Introduction
Gamma-aminobutyric acid (GABA) is a four-carbon free amino acid that is widely present in bacteria, plants and vertebrates. GABA is well known as a bioactive substance with several physiological functions and hence a great application potential in functional foods and pharmaceuticals. It acts as major inhibitory neurotransmitter in the sympathetic nervous system, and shows anti-diabetic and antihypertensive effects in humans. In addition, consumption of GABA-enriched foods inhibits cancer cell proliferation and can control lipid levels in serum, as well as pain and anxiety [1, 2].
Kung-Som is a Thai fermented food made from shrimp, sugar, salt, and is typically fermented with a natural, spontaneous microbiota, mainly various lactic acid bacteria (LAB) [3]. In general, LAB can prolong the shelf life of food, enhance its safety and nutritional value, improve food texture, and contribute to a pleasant sensory profile of the final product. Therefore, the use of suitable GABA-producing LAB strains as starter cultures in food fermentation processes can help to achieve bio-synthetic in situ production of GABA in various products. This provides a way of replacing chemically synthesized GABA, and at the same time offering the consumer with new attractive, GABA-enriched food products. This approach also reduces the production cost because the addition of exogenous GABA is omitted [4].
Glutamate decarboxylase (GAD) catalyzes the decarboxylation of glutamic acid or glutamate to GABA and is thus the essential enzyme for GABA production. The enzyme needs pyridoxal 5′-phosphate (PLP) as a cofactor [5]. Glutamic acid is found in Kung-Som products in ample amounts since the main ingredient shrimp is a rich source of glutamic acid [6]. Yet, studies on GABA-producing LAB in Kung-Som have not been reported. The development of Kung-Som containing higher levels of GABA that will contribute additional functional properties to this product seems a promising application. In the present study, the isolation and the identification of GABA-producing LAB from Kung-Som were performed.
Materials and Methods
Isolation and Screening of GABA-Producing LAB
Twelve Kung-Som samples were purchased from different local markets in Songkhla Province, Thailand. Samples were homogenized in sterile 0.1% (w/v) peptone (HiMedia, Mumbai, India), spread onto MRS agar (LabM, Lancashire, UK) supplemented with 0.02% (w/v) bromocresol purple and incubated at 37 °C for 24 h. Bacterial colonies exhibiting a yellow zone on the plates were tested for catalase activity and Gram-staining. Catalase-negative and Gram-positive isolates were cultivated in MRS broth containing 25 mg/mL monosodium glutamate (MSG) (Ajinomoto, Bangkok, Thailand) at 37 °C for 24 h. The culture was then centrifuged at 8000×g at 4 °C for 5 min to obtain a clear supernatant. Presence of GABA in this supernatant was first analyzed by using thin-layer chromatography (TLC). Briefly, GABA was determined qualitatively using Silicagel 60 F254 TLC plates (Merck, Darmstadt, Germany). One microliter of supernatant was spotted onto the TLC plates. TLC was conducted using an 1-butanol:acetic acid:distilled water (5:2:2) mixture, the plate was subsequently sprayed with 0.5% (w/v) ninhydrin solution and then heated at 105 °C for 2 min. The Rf value was calculated as follows: Rf = migration distance by component/migration distance by solvent. Cultures of bacterial strains showing the same Rf value as the authentic GABA standard (Sigma-Aldrich, Steinheim, Germany) were selected for quantitation by HPLC.
Identification of GABA-Producing LAB
Morphological characterization of the best GABA-producing isolates was done by examining colony growth, cell morphology, together with the Gram reaction and catalase test. Biochemical characterization was performed using the API 50 CHL fermentation strips (bioMérieux, Inc., Marcy l’Etoile, France).
Genomic DNA from the best GABA producing isolates was extracted and used as template for PCR to amplify the 16S rDNA by using the universal bacterial primers 8f (5′-AGAGTTTGATCCTGGCTCAG-3′) and 1492r (5′-GGTTACCTTGTTACGACTT-3′). Purified PCR products were cloned into the pGEM T-Easy vector (Promega, Madison, USA) and transformed into E. coli JM109 by the heat shock method [7]. The sequencing results were compared with known sequences using the BLAST program (www.ncbi.nlm.nih.gov/BLAST/).
Growth Profile and GABA Production of Lactobacillus futsaii CS3
L. futsaii CS3 was cultivated in MRS broth with 25 mg/mL of total MSG containing 1% (v/v) inoculum (OD600 ~ 0.4–0.5). Incubation was performed at 37 °C for 72 h. Growth of the strain was determined by measuring culture turbidity at 600 nm every 3 h. In addition, culture pH, lactic acid content [8] and GABA concentration were measured at the same time intervals. The GABA conversion efficiency (%) was calculated from the equation according to Ratanaburee et al. [9].
GABA Analysis
Sample Preparation
Quantitative analysis of GABA in the culture broth was performed by derivatization with o-phthaldialdehyde (OPA) (Sigma-Aldrich, Steinheim, Germany) before detection using RP-HPLC according to Populin et al. [10] with some modifications. The OPA solution (pH 9.3) was prepared by mixing 5.0 mL of methanolic OPA (0.25 g of OPA in 50 mL of methanol), 20 mL of borate buffer (pH 9.9) and 50 µL of 2-mercaptoethanol. The borate buffer solution was prepared by mixing 0.2 M boric acid (dissolved in 0.2 M potassium chloride) and 0.2 M sodium hydroxide in a ratio of 50:50 (v/v). Fifteen microliters of sample and 75 µL of the OPA solution were mixed and allowed to stand for 2 min before injection into the column.
Reversed-Phase High-Performance Liquid Chromatography (RP-HPLC) Analysis
RP-HPLC determination of GABA was performed with an Agilent Technologies 1200 series binary pump, autosampler and a fluorescence detector equipped with an automatic liquid sampler, injector program. The column used was a Hypersil ODS C18 reverse phase column (4.6 × 250 mm, 5 μm) thermostatted at 30 °C. The separation of OPA-derivatives was performed with a mobile phase, consisting of 370 mL of milli-Q water plus 90 mL of 0.1 M phosphate buffer at pH 7.0 as solvent A, while solvent B was acetonitrile. The gradient elution program was held at 13% of B for 15 min, ramped at 50% of B (40 min), then at 85% of B (60 min) and held until the end of the run (62 min) with a flow rate of 1.0 mL/min. Detection was performed with a spectrofluorometer, model G1321A set at 330 nm (λ excitation) and 440 nm (λ emission).
Cloning of the gad Gene
Based on a sequence comparison of open reading frames (ORF) of the glutamate decarboxylase genes (gad) from Lactobacillus available in GenBank (www.ncbi.nlm.nih.gov) and conserved sequences identified, a pair of primers, gad_F (5′-ATGGCAATGTTATACGGTAAACAC-3′) and gad_R (5′-TCAGTGTGTGAATCCGTATTTCTT-3′), was designed to amplify the ORF of the gad gene from L. futsaii. The amplified fragments were cloned into the pGEM T-Easy vector and transformed into competent cells of E. coli JM109 by the heat shock method [7]. Similarity of the isolated gad gene with others was analyzed using the online BLAST program. The molecular mass and the predicted isoelectric point (pI) of the corresponding glutamate decarboxylase protein (GAD) were obtained through ExPASy.
Computer Modeling
The molecular model of GAD from L. futsaii CS3 was obtained by homology modeling via the SWISS-MODEL server [11]. The structure of GadB from E. coli at low pH (PDB ID: 1PMM) was selected as the template for model building. Sequence alignment was performed using ClustalX [12]. The resulting model was evaluated with the SWISS-MODEL server.
Results and Discussion
Screening and Identification of GABA-Producing LAB
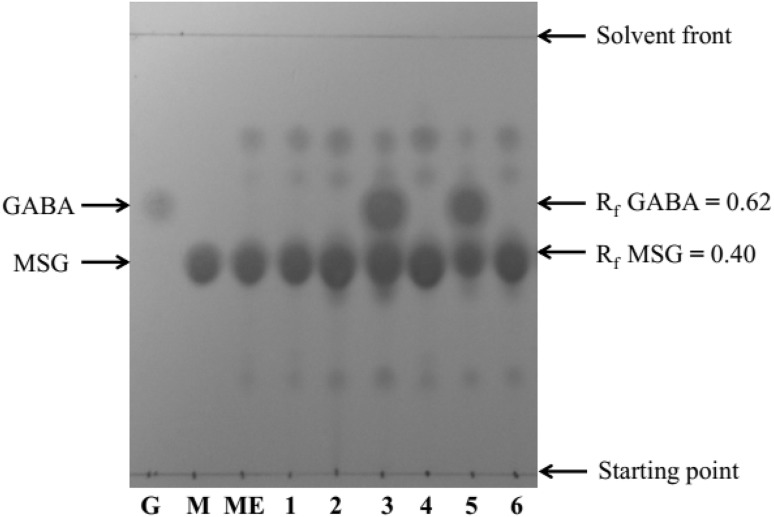
Among 600 single LAB isolates tested, only two isolates (CS3 and CS5) exhibited a strong spot for GABA by the TLC method when MSG was present in the growth medium (Fig. 1). In addition, GABA formation was quantitatively confirmed using RP-HPLC. The GABA concentration when using strain CS3 was 3.25 and 6.30 mg/mL at 24 and 48 h, respectively. Strain CS5 produced GABA at 2.55 and 6.0 mg/mL after 24 and 48 h, respectively.
Fig. 1.
Thin-layer chromatography analysis of GABA production by isolated LAB. Lane G, GABA standard; M, MSG standard; ME, MRS medium containing 25 mg/mL MSG (control); 1–6, isolate CS1–CS6, respectively
The two selected, GABA-producing isolates CS3 and CS5 were Gram-positive, rod-shaped, catalase negative and facultative anaerobic bacteria. The phenotypic results obtained with the API system (Table S1) indicated that both strain CS3 and CS5 correspond to the species Lactobacillus futsaii when compared with the type strains L. futsaii YM0097T, JCM 17355T or BCRC 80278T according to Chao et al. [13].
In addition, 16S rDNA sequence analysis (Fig. S1) showed that strains CS3 and CS5 belong to the species L. futsaii with 99.80 and 99.66% identity of the sequence from L. futsaii YM0097T (accession no. HQ322270), respectively. Therefore, the strains CS3 and CS5 were designated as L. futsaii CS3 and L. futsaii CS5, respectively. The nucleotide sequences of the 16S rDNA from L. futsaii CS3 and CS5 were deposited in the DNA Data Bank of Japan (DDBJ) under the accession numbers AB839950 and LC019014, respectively.
Growth Profile and GABA Production of L. futsaii CS3
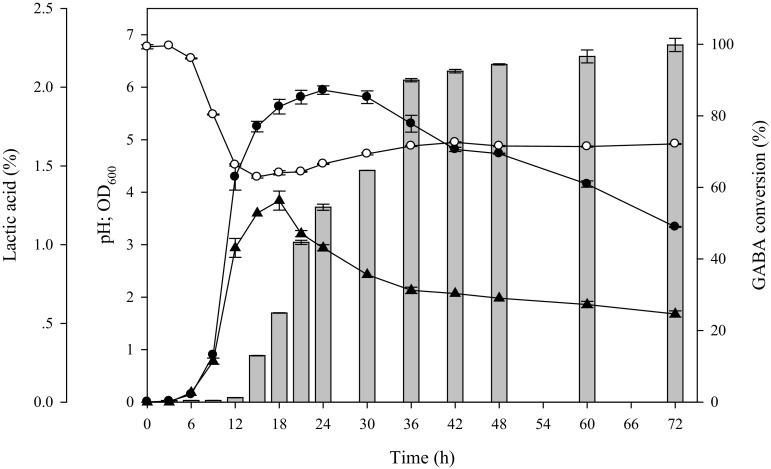
Growth and GABA production of L. futsaii CS3 are shown in Fig. 2. The bacterium grew rapidly within the first 24 h (~9 log CFU/mL), which was correlated with a sharpe decrease in pH due to lactic acid formation. The lactic acid concentration reached a maximum of ~1.3% after the pH had dropped to 4.5. Only when the pH value of the medium dropped to pH 4.5, GABA was produced. Subsequently, the concentration of GABA reached a plateau with a maximum concentration around 36 h. We noted that L. futsaii CS3 could almost completely convert MSG to GABA with a maximum yield of more than 99% MSG conversion within 72 h. Initially, the pH value decreased significantly due to lactic acid formation by L. futsaii during growth, especially during the exponential phase, whereas the pH gradually increased once GABA formation started. Our results show a trend similar to that reported by Cho et al. [14] who indicated that increased growth and a decreased pH had a significant effect on GABA production. In addition, Lin [15] reported that GABA synthesis is related to bacterial GAD, which plays a major role in the acid-resistance mechanism. Cytoplasmic decarboxylation results in the consumption of an intracellular proton after the uptake of glutamate by its specific transporter. The reaction product GABA is exported from cells by an antiporter, and the net result is an increase in the pH of the cytoplasm, due to the removal of hydrogen ions, and a slight increase in the extracellular pH, due to the exchange of extracellular glutamate for the more alkaline GABA [14]. Of the three acid resistance systems known in E. coli, the gad system is by far the most potent in conferring acid resistance to the bacteria in the stationary phase, giving them survival capacity for at least 2 h in a strongly acidic environment (pH < 2.5), such as that of the stomach [16]. It is hence conceivable that the gad system plays a similar role in lactobacilli.
Fig. 2.
Time course of a cultivation of Lactobacillus futsaii CS3 in MRS broth containing 25 mg/mL MSG. Symbols: optical density at 600 nm (filled circle), GABA production (% GABA conversion) (grey bars), broth pH value (open circle) and lactic acid concentration (filled triangle)
Identification of the gad Gene in L. futsaii CS3
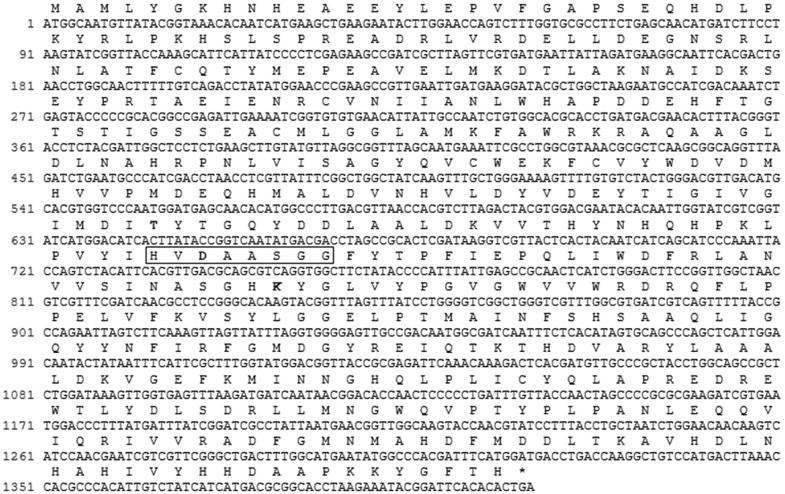
The presence of gad genes in LAB has been shown in several previous reports [17, 18]. Its presence suggests an increased ability to produce GABA, since GAD must be active to convert glutamate into GABA. Using primers for conserved regions of published gad genes we cloned a DNA fragment from L. futsaii. Sequence analysis showed that this cloned fragment of the gad gene from L. futsaii CS3 contained a complete ORF of 1410 nucleotides encoding a protein of 469 amino acids (Fig. 3) with a predicted molecular weight of 53.64 kDa and an isoelectric point (pI) of 5.56 as estimated by the ExPASy program.
Fig. 3.
Nucleotide and deduced amino acid sequence of the Lactobacillus futsaii CS3 gadB gene. The predicted amino acids sequence (single-letter abbreviation) is shown above the nucleotide sequence. The presumed catalytic amino acid residues (Thr215 and Asp247, and Lys280) are shown in bold
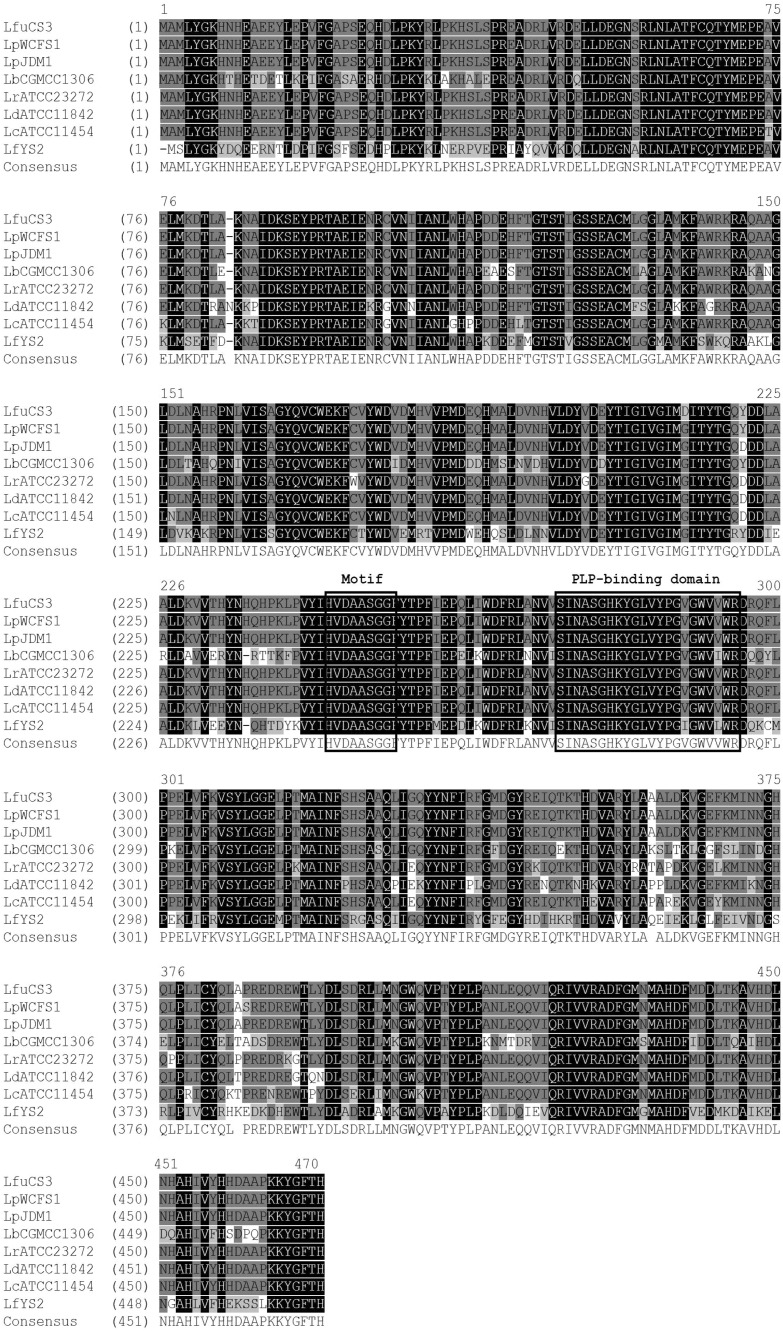
In addition, the deduced amino acid sequence corresponding to the CS3 gad gene belongs to the gadB family of pyridoxal-dependent decarboxylases. Sequence alignment of the deduced amino acid sequence with other GAD sequences showed a highly conserved catalytic domain that belong to the PLP-dependent decarboxylase superfamily. The deduced amino acid sequence of the gadB gene from L. futsaii CS3 showed a conserved lysine residue (Lys280) that is known to be crucial for the binding of PLP as well as the proposed active site residues (Thr215 and Asp247) that promote decarboxylation. Moreover, the motif HVDAASGG, which is highly conserved in PLP-dependent decarboxylases, was discovered in the L. futsaii CS3 gad sequence (Fig. 4) [17, 19]. Furthermore, a modeled structure of L. futsaii CS3 GAD was constructed using the SWISS-MODEL server (Fig. S2), which was proven statistically to be a good model according to the Global Model Quality Estimation (GMQE) value of 0.74. Since GAD is localized exclusively in the cytoplasm at neutral pH, but is recruited to the membrane when the pH falls [16], the subunit A of GadB from E. coli at low pH was used as the template for modeling. Correspondingly, GAD of L. futsaii CS3 is composed of three domains, the N-terminal domain (residues 1–59), the large domain (residues 60–350) and the small domain (residues 351–469). The nucleotide sequence of the gadB gene from L. futsaii CS3 was submitted to the DDBJ nucleotide sequence database under the accession no. AB986192.
Fig. 4.
Alignment of the amino acid sequence of Lactobacillus futsaii CS3 GadB (LfuCS3) with GadB proteins from other LAB (LpWCFS1, Lactobacillus plantarum WCFS1; LpJDM1, Lactobacillus plantarum JDM1; LbCGMCC1306, Lactobacillus brevis CGMCC1306; LrATCC23272, Lactobacillus reuteri ATCC23272; LdATCC11842, Lactobacillus delbrueckii subsp. bulgaricus ATCC11842; LcATCC11454, Lactococcus lactis subsp. lactis ATCC11454; LfYS2, Lactobacillus fermentum YS2). The amino acid residues (HVDAASGG) marked by a box are highly conserved in pyridoxal 5′-phosphate-dependent decarboxylases; the amino acid residues in the second box represent the pyridoxal 5′-phosphate binding domain
Conclusion
Lactobacillus futsaii CS3 isolated from Kung-Som is a strain with potential application in novel, GABA-enriched functional foods since a number of fermented foods are based on fermentation with different Lactobacillus spp. In addition, we report here for the first time the sequence of the gadB gene from L. futsaii. These results may provide useful information for the potential expression of LAB gad genes in other microbes. The modeled structure of L. futsaii CS3 GAD was based on the sequence of this gene, and should be useful for future work with the enzyme. It will further expand the application area of GABA-producing LAB to GABA-enriched foods and other value-added products.
Electronic supplementary material
Below is the link to the electronic supplementary material.
Phylogenetic tree of the 16S rDNA sequences of strain CS3 and CS5 with recognized Lactobacillus species. Bootstrap values expressed as percentages of 1000 replications (greater than 50% are shown at the branch points). Bar, 0.01 substitutions per nucleotide position (DOCX 145 kb)
Cartoon representation of the homology model of the GadB monomer at low pH. The N-terminal domain is colored yellow, the large domain is in pink color, the small domain or C-terminal is shown in deep blue color, and the β-hairpin region is colored green. The PLP-binding domain and motif sheets are colored light blue and white, respectively (DOCX 380 kb)
Acknowledgements
This study was financially supported by the Thailand Research Fund through the Royal Golden Jubilee Ph.D. Program (Grant No. PHD/0060/2556) and Shell Centennial Education Fund, Shell Companies in Thailand. Some part of this research was funded by Prince of Songkla University through Contract No. AGR580355S. The authors thank the Scientific Equipment Center, Prince of Songkla University, Hat Yai, Songkhla, Thailand for their excellent technical assistance.
Funding
This study was funded by the Thailand Research Fund through the Royal Golden Jubilee Ph.D. Program (Grant No. PHD/0060/2556). This study was funded by Shell Centennial Education Fund, Shell Companies in Thailand. This study was funded by Prince of Songkla University through Contract No. AGR580355S.
Compliance with ethical standards
Conflict of interest
The authors declare that they have no conflict of interest.
Footnotes
Electronic supplementary material
The online version of this article (doi:10.1007/s12088-016-0632-2) contains supplementary material, which is available to authorized users.
References
- 1.Diana M, Quílez J, Rafecas M. Gamma-aminobutyric acid as a bioactive compound in foods: a review. J Funct Foods. 2014;10:407–420. doi: 10.1016/j.jff.2014.07.004. [DOI] [Google Scholar]
- 2.Tajabadi N, Ebrahimpour A, Baradaran A, Rahim RA, Mahyudin NA, Manap MY, Bakar FA, Saari N. Optimization of γ-aminobutyric acid production by Lactobacillus plantarum Taj-Apis362 from honeybees. Molecules. 2015;20:6654–6669. doi: 10.3390/molecules20046654. [DOI] [PMC free article] [PubMed] [Google Scholar]
- 3.Sanchart C, Benjakul S, Rattanaporn O, Haltrich D, Maneerat S. Efficiency of the V3 region of 16S rDNA and the rpoB gene for bacterial community detection in Thai traditional fermented shrimp (Kung-Som) using PCR-DGGE techniques. Songklanakarin J Sci Technol. 2015;37:291–297. [Google Scholar]
- 4.Li H, Cao Y. Lactic acid bacterial cell factories for gamma-aminobutyric acid. Amino Acids. 2010;39:1107–1116. doi: 10.1007/s00726-010-0582-7. [DOI] [PubMed] [Google Scholar]
- 5.Dhakal R, Bajpai VK, Baek KH. Production of GABA (γ-aminobutyric acid) by microorganisms: a review. Braz J Microbiol. 2012;43:1230–1241. doi: 10.1590/S1517-83822012000400001. [DOI] [PMC free article] [PubMed] [Google Scholar]
- 6.Daul CB, Slattery M, Reese G, Lehrer SB. Identification of the major brown shrimp (Penaeus aztecus) allergen as the muscle protein tropomyosin. Int Arch Allergy Immunol. 1994;105:49–55. doi: 10.1159/000236802. [DOI] [PubMed] [Google Scholar]
- 7.Chung CT, Niemela SL, Miller RH. One-step preparation of competent Escherichia coli: transformation and storage of bacterial cells in the same solution. Proc Natl Acad Sci USA. 1989;86:2172–2175. doi: 10.1073/pnas.86.7.2172. [DOI] [PMC free article] [PubMed] [Google Scholar]
- 8.Association of Official Analytical Chemists . Official methods of analysis. 18. Virginia: AOAC International; 2005. [Google Scholar]
- 9.Ratanaburee A, Kantachote D, Charernjiratrakul W, Penjamras P, Chaiyasut C. Enhancement of γ-aminobutyric acid in a fermented red seaweed beverage by starter culture Lactobacillus plantarum DW12. Electron J Biotechnol. 2011 [Google Scholar]
- 10.Populin T, Moret S, Truant S, Conte LS. A survey on the presence of free glutamic acid in foodstuffs, with and without added monosodium glutamate. Food Chem. 2007;104:1712–1717. doi: 10.1016/j.foodchem.2007.03.034. [DOI] [Google Scholar]
- 11.Arnold K, Bordoli L, Kopp J, Schwede T. The SWISS-MODEL workspace: a web-based environment for protein structure homology modelling. Bioinformatics. 2006;22:195–201. doi: 10.1093/bioinformatics/bti770. [DOI] [PubMed] [Google Scholar]
- 12.Thompson JD, Gibson TJ, Plewniak F, Jeanmougin F, Higgins DG. The CLUSTAL_X windows interface: flexible strategies for multiple sequence alignment aided by quality analysis tools. Nucleic Acids Res. 1997;25:4876–4882. doi: 10.1093/nar/25.24.4876. [DOI] [PMC free article] [PubMed] [Google Scholar]
- 13.Chao SH, Kudo Y, Tsai YC, Watanabe K. Lactobacillus futsaii sp. nov., isolated from fu-tsai and suan-tsai, traditional Taiwanese fermented mustard products. Int J Syst Evol Microbiol. 2012;62:489–494. doi: 10.1099/ijs.0.030619-0. [DOI] [PubMed] [Google Scholar]
- 14.Cho SY, Park MJ, Kim KM, Ryu JH, Park HJ. Production of high γ-aminobutyric acid (GABA) sour kimchi using lactic acid bacteria isolated from mukeunjee kimchi. Food Sci Biotechnol. 2011;20:403–408. doi: 10.1007/s10068-011-0057-y. [DOI] [Google Scholar]
- 15.Lin Q. Submerged fermentation of Lactobacillus rhamnosus YS9 for γ-aminobutyric acid (GABA) production. Braz J Microbiol. 2013;44:183–187. doi: 10.1590/S1517-83822013000100028. [DOI] [PMC free article] [PubMed] [Google Scholar]
- 16.Capitani G, De Biase D, Aurizi C, Gut H, Bossa F, Grütter MG. Crystal structure and functional analysis of Escherichia coli glutamate decarboxylase. EMBO J. 2003;22:4027–4037. doi: 10.1093/emboj/cdg403. [DOI] [PMC free article] [PubMed] [Google Scholar]
- 17.Fan E, Huang J, Hu S, Mei L, Yu K. Cloning, sequencing and expression of a glutamate decarboxylase gene from the GABA-producing strain Lactobacillus brevis CGMCC 1306. Ann Microbiol. 2012;62:689–698. doi: 10.1007/s13213-011-0307-5. [DOI] [Google Scholar]
- 18.Park JY, Jeong SJ, Kim JH. Characterization of a glutamate decarboxylase (GAD) gene from Lactobacillus zymae. Biotechnol Lett. 2014;36:1791–1799. doi: 10.1007/s10529-014-1539-9. [DOI] [PubMed] [Google Scholar]
- 19.Park KB, Oh SH. Cloning, sequencing and expression of a novel glutamate decarboxylase gene from a newly isolated lactic acid bacterium, Lactobacillus brevis OPK-3. Bioresour Technol. 2007;98:312–319. doi: 10.1016/j.biortech.2006.01.004. [DOI] [PubMed] [Google Scholar]
Associated Data
This section collects any data citations, data availability statements, or supplementary materials included in this article.
Supplementary Materials
Phylogenetic tree of the 16S rDNA sequences of strain CS3 and CS5 with recognized Lactobacillus species. Bootstrap values expressed as percentages of 1000 replications (greater than 50% are shown at the branch points). Bar, 0.01 substitutions per nucleotide position (DOCX 145 kb)
Cartoon representation of the homology model of the GadB monomer at low pH. The N-terminal domain is colored yellow, the large domain is in pink color, the small domain or C-terminal is shown in deep blue color, and the β-hairpin region is colored green. The PLP-binding domain and motif sheets are colored light blue and white, respectively (DOCX 380 kb)


