

Abstract
Placement parameters for microstimulation electrodes in a visual prosthesis are evaluated based on models of retinotopic position of macaque and human lateral geniculate nucleus. Phosphene patterns were simulated for idealized microwire electrodes as well as for currently available clinical electrodes. For idealized microwire electrodes, spacing as large as 600 micrometers in three dimensions would allow for over 250 phosphenes per visual hemifield in macaques and 800 in humans.
Index Terms: visual prosthesis, LGN, foveal magnification
I. Introduction
MICROSTIMULATION in the dorsal lateral geniculate nucleus (LGN) of the primate thalamus has been shown to produce small visual percepts known as phosphenes [1], similar to those elicited through microstimulation of human retina and visual cortex [2]–[5]. Determining a realizable arrangement of electrode contacts, in both number and location, is an important part of designing a prosthetic vision device based on LGN microstimulation.
Many groups have attempted to simulate prosthetic vision (eg, [4], [6]–[13]), and to determine the minimum number of pixels necessary to perform basic tasks such as reading, object recognition and navigation. Heretofore, the arrangement of pixels has been on a regular array, in great part because of the regular mapping of visual space onto the retina through the optics of the eye. However, the distribution of light-sensitive cells across the retina is not uniform (eg, [14]), being highly weighted toward the fovea at the center of the visual field. This compressed layout is relaxed during the projection to the constant neuronal density of subsequent stages of processing, so that after the retina, the central part of the visual field has a disproportionately large volume of tissue devoted to it, in an effect called foveal or cortical magnification [15].
Foveal magnification contributes to the illusion of uniformly high-resolution visual perception even though the region where high resolution is available is sharply restricted to the central part of the visual field [16], [17]. A visual prosthesis designed to take advantage of the endogenous, uneven sampling of visual space might be expected to provide a higher level of benefit to blind patients than one with an even sampling.
Accordingly, we performed a design study of electrode placements for a prosthetic vision device, based on the observation that the evoked percept for a given electrode position is largely equivalent to the response fields of cells near the tip [1]. We simulated a variety of potential electrode configurations and surgical approaches for LGN to guide electrode design and placement strategies. Simulations were performed with the high-fidelity response field data from a model macaque LGN [18], and for a coarse model based on the lower-fidelity data from fMRI measurements in human [19].
We sought to answer the following questions, motivated by our desire to bring a prosthetic device to clinical use, and our curiosity as to the practicality of such a device given the size of LGN and limitations its volumetric extent might impose on the number of implantable microelectrode wires:
Question 1: What three dimensional (3D) contact density and placement is necessary to have 50 to 400 points within the central 10 degrees of visual space?
Question 2: What is the ideal placement for a two dimensional (2D) array of contacts with 600 μm spacing that completely spans the LGN?
Question 3: What percept locations are possible with a customized clinical deep brain stimulation (DBS) electrode, specifically the Ad-Tech Medical Instruments (Racine, WI; http://www.adtechmedical.com) macro-micro system modified to hold sixty microwire contacts trimmed to three different lengths?
Question 4: What range of percept locations are possible with an unmodified clinical DBS electrode, specifically the four-contact cuff-style Medtronic (Minneapolis, MN; http://www.medtronic.com) electrode?
These four questions are intended to span the range of the purely speculative (Question 1) to the immediately possible (Question 4). The answers should guide future experiments and inform the design of a prosthetic device for humans.
II. Methods
Two basic assumptions of electrode-tissue interactions were made. First, as brain tissue is conformally displaced during microelectrode insertion [20], it was thought reasonable to assume that microwire electrodes occupy zero volume and therefore leave the retinotopy of the area undisturbed. This simplifies determination of the response field locations of cells at the tips of each electrode. Although our first assumption ignores the serious issue of tissue damage due to mechanical displacement and insult (see Discussion), it is reasonable for microelectrodes and makes the present analysis tractable. Electrodes that are large enough to non-conformally distort tissue upon insertion, through effects like tearing, do not support this simple, direct method. Therefore, for the Medtronic electrode, it was assumed that the electrode replaced the tissue in the cylinder it occupied such that the retinotopy of the area was, again, undistorted (see Discussion).
Our second assumption was that, given the reported microstimulation levels in the early visual system that generate focal or point-like phosphenes (eg, [1], [4], [5], [13], [21]), the range of activated tissue was limited to a small three-dimensional radius about electrode contacts. For microwire style electrodes, this volume forms a miniature sphere at the tip of each microwire; for cuff style electrodes, this volume forms a thin cylinder at each cuff (see Discussion). Simulation of placing electrodes in the tissue, therefore, consisted of determining the appropriate three-dimensional coordinates in published matrices of elevation and eccentricity data [18], and reading off the response field positions. Response field sizes were determined based on published measurements of size versus eccentricity distributions [22] (see Discussion).
The first and second Questions were addressed using idealized sets of microwire tips spanning three and two dimensions respectively. Simulations were performed with varying electrode density, measuring the arrangement of response field locations of cells near the plurality of tips. In each of these cases the electrode array was assumed to extend beyond the edges of LGN. For a set of electrode tips spanning only two dimensions, an easier engineering challenge than constructing a set spanning three dimensions, simulations were performed varying planar orientation and depth for a fixed tip density.
Three-dimensional tip density was also computed using measurements of functional activation in human LGN from Schneider, Richter and Kastner [19]. Because of limitations in their experimental design and reported data, we confined our computations to the central 10 degrees of visual space.
The third and fourth Questions were addressed using idealized models of readily available clinical electrodes. Simulations were performed varying electrode placement along different dorsoventral (axial) penetrations and simulating the arrangement of aggregate response field locations of cells near the contacts (tips or cuffs).
Simulations comprised four Cases:
Case 1: An array of microwire electrodes such that the tips form a three-dimensional isotropic grid with mean Cartesian spacing of λ where the grid spans the entirety of LGN in each dimension.
Case 2: An array of microwire electrodes such that the tips form a two-dimensional isotropic grid with mean Cartesian spacing of λ at various dorsoventral, lateromedial, and posterioanterior depths, where the grid spans the entirety of LGN at the section depth.
Case 3: A single Ad-Tech tuft-style deep brain stimulation electrode with 60 distal microwires trimmed to three distinct lengths, implanted using various dorsoventral approaches. This is a modification of their standard design both in terms of wire count and trim length.
Case 4: A single, standard, Medtronic deep brain stimulation electrode with cuff style contacts, implanted using various dorsoventral approaches.
III. Results
A. Three-Dimensional Sampling
An idealized prosthesis would have electrode tips evenly distributed throughout the LGN. Accordingly, we simulated such a placement of electrodes in monkey LGN where the electrode tips were located on a regular three-dimensional grid with spacing λ and then individually perturbed by a fixed normal distribution of σ = 500 μm. The tip perturbation is intended to simulate the potential inaccuracies that might be seen with a given implantation and is is on par with what is achieved in functional stereotaxic deep brain surgery [23].
Simulations were performed for λ values of 1000, 800, 600, 400, and 200 μm for an electrode tip matrix that was assumed to span beyond the entirety of LGN. Each simulation was repeated 100 times with different perturbation noise. The number of tips landing in LGN, and therefore the number of phosphene points generated in the visual field, was counted. The number of tips falling within monkey LGN is 59 through 6900 with decreasing λ; the number of points generated within the central part of the visual field is approximately half as many, 25 through 2900. The ratio of tips falling within the parvocellular layers versus magnocellular layers of monkey LGN is approximately 4:1. Details can be found in Table 1, and further information regarding parvocellular versus magnocellular layers can be found in the Discussion.
TABLE I.
LGN Electrode Tip Count for 3d Isotropic Placement Matrix
|
Monkey†
|
Human‡
|
||||
|---|---|---|---|---|---|
| λ (μm) | Total Points | Magno | Parvo | Within 10° | Within 10° |
|
|
|
|
|
|
|
| 1000 | 59± 7 | 12± 3 | 46± 6 | 25± 5 | 193± 42 |
| 800 | 112± 9 | 24± 5 | 88± 9 | 48± 7 | 378± 82 |
| 600 | 260±13 | 55± 7 | 205±12 | 112± 9 | 895± 194 |
| 400 | 880±27 | 185±13 | 695±25 | 376±17 | 3,020± 654 |
| 200 | 6,965±77 | 1,461 ±38 | 5,504±64 | 2,974±44 | 24,161±5232 |
|
|
|
||||
The mean and standard deviations of the numbers of electrode tips landing in LGN were counted for varying average densities based on Cartesian electrode tip spacing (λ). The total count of electrode tips falling in one hemisphere’s LGN is given, along with the breakdown for those in magnocellular and parvocellular layers, and the total number that fell within the portion of LGN representing the central 10 degrees of visual space.
For human data, the mean and standard deviation of LGN volume representing the inner 10 degrees of visual space have been normalized by λ3 using volumetric data from 14 LGNs (volumes of 138, 139, 153, 162, 170, 177, 182, 200, 200, 208, 209, 241, 247, 280 mm3 for the central 10 degrees, data extracted from Schneider, et al., 2004 [19], bottom right panel of Fig. 5; compare with 25 mm3 for monkey, see main text).
Additionally, data were taken from the fMRI study of human LGN retinotopy by Schneider, Richter and Kastner [19], where the volumes for human LGN representing given eccentricities were reported for 14 LGNs from 7 subjects. These volume measurements were used to estimate the number of electrode tips that would fall within the portion of human LGN representing the inner 10 degrees of visual space by normalizing each volume by λ3, however, unlike the case for the monkey data, no Monte Carlo simulations were performed because high-resolution retinotopy maps are not yet available. Instead, results based on the different individual volumes were used to compute means and standard deviations. The simulated number of tips was found to range 193±42 through 24,000±5,200 with decreasing λ (see Discussion). As the ratio of volumes devoted to central vision for human and monkey LGN is approximately eight-to-one (human volumes given in Table 1, caption; monkey volume computed from Erwin et al. [18] data to be 25 mm3 by counting all voxels with eccentricity less than or equal to 10 degrees), the ratio in the number of phosphenes between the two species for a given λ is similar. Details can again be found in Table 1.
The distribution of response fields found for the monkey model and varying electrode tip densities can be seen in Fig. 1, where the effects of foveal magnification are evident from the increasing density of points toward the center of the figure. Recall that each electrode tip generates a single point in these simulations. Densities of 50, 100, 200 and 400 contacts within the central 10 degrees are achieved with electrode tip spacings of approximately 800, 600, 500 (not shown in Table 1), and 400 μm.
Fig. 1.
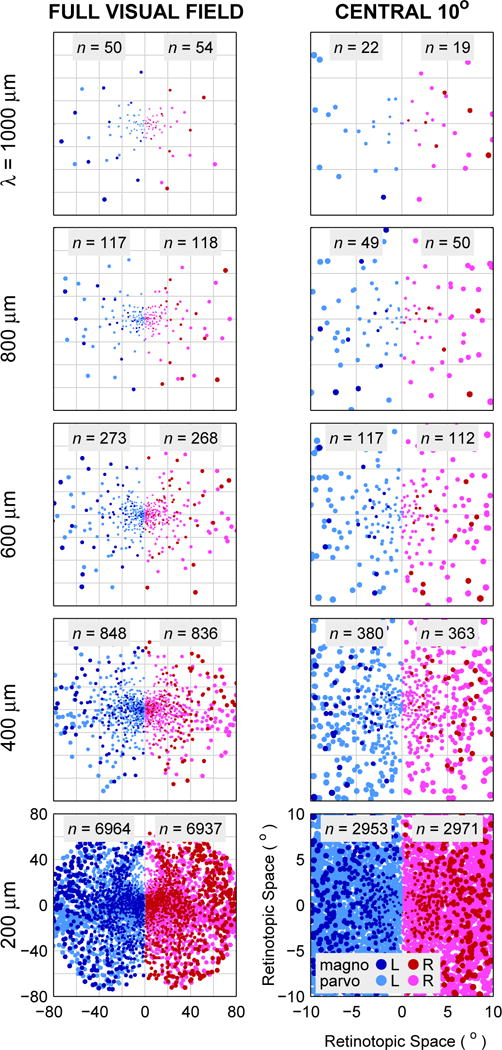
Simulated monkey LGN response field locations for electrode tip placements in three-dimensional matrices with λ = 1000, 800, 600, 400, and 200 μm mean isotropic Cartesian spacing. Positions of electrode tips began on a regular grid and were individually perturbed by normally distributed noise of σ = 500 μm. Then, the response field locations based on those tip locations were read out from published position-based eccentricity and elevation data, and combined with published response field size data to generate the figures. Left Column: Positions of response fields in left and right hemifields analogous to a bilateral implantation with electrode tips placed in three dimensions, at varying spacing decreasing by row from 1000 to 200 μm. Lighter colors (light red and light blue) are response fields from parvocellular tip locations, darker colors (dark red and dark blue) from magnocellular tip locations. Right Column: The central 10 degrees of visual space for the electrode positionings in the left column. For central vision, the coverage of visual space has become substantial by λ = 400 μm and is approaching complete by 200 μm, as individual phosphenes overlap. Additional density would presumably continue to increase potential resolution.
B. Planar Sampling
Rather than implanting a full 3D matrix of electrode tips as simulated above, a simpler engineering task would be to implant a set of electrodes of equal length whose tip locations would approximate a single plane. This would be simpler for two reasons: first, because for a given contact density, fewer total electrodes would be involved, and second, because all electrodes could be made to the same length, rather than potentially a different length for each electrode for a 3D matrix of tips. We therefore simulated three separate surgical approaches using the monkey model: the traditional dorsoventral approach used for DBS implants in midbrain structures where, in our case, the electrode tips lie along axial planes (orthogonal to the long axis of the body), a lateromedial approach where electrode tips are in sagittal planes (as if viewed from the side), and a posterioanterior approach where electrode tips are in coronal planes (as if viewed from the rear). Simulations were performed with in-plane electrode tip spacing of 600 μm and at 500 μm increments along the penetration axis.
To evaluate each placement of electrode tips, and thus in aggregate each surgical approach, we compared the distribution of response field positions against those from an even, isotropic 3D sampling in LGN (as computed above). The motivation was to avoid electrode tip placements with substantially higher irregularity or non-uniformity in phosphene configurations under the assumption that such configurations are of lower utility. The evaluation index used was the logarithm of the two-dimensional Kolmogorov-Smirnov (KS) probability [24] on the response field positions as compared to those from the reference 3D sampling of LGN. This statistic measures the probability that two 2D sets of points are drawn from the same underlying two-dimensional distribution, and was a somewhat arbitrary criterion that we hoped would identify percept configurations of higher utility and was not intended as a strict metric.
For each surgical approach, one or two placements were typically identified as being preferable according to this evaluation index. Overall, the lateromedial approach, with electrode tips in sagittal planes, was found to be preferable (see Fig. 3). The optimal location was found to be approximately midway through the LGN for each approach, although not necessarily at the depth with the largest number of tips falling within LGN. The mean evaluation index values at the respective best position for each approach were significantly different (t-test, p < 0.001 for all three comparisons).
Fig. 3.
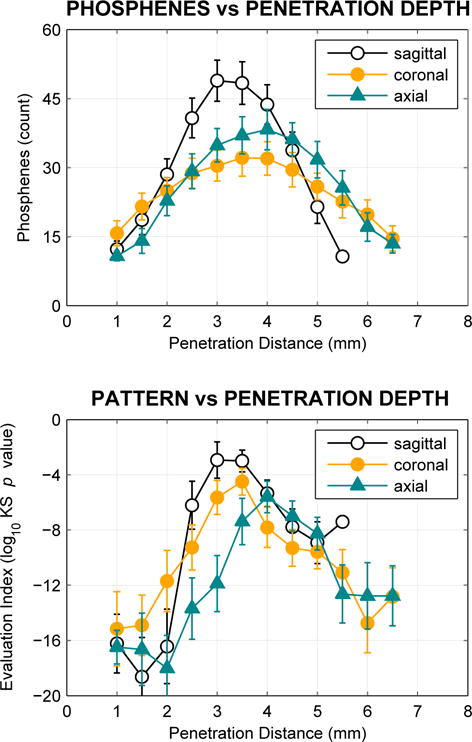
Phosphene count (upper graph) and placement evaluation (lower graph) for lateromedial (approaching from the side of the head, with tips forming sagittal planes), dorsoventral (from the top, axial planes), and posterioanterior (from the rear, coronal planes) approaches. Every 500 μm along each approach, the locations of electrodes in a noise-perturbed 2D array with 600 μm average spacing were examined. Electrodes that fell within LGN were counted, and the distribution of response field locations evaluated by comparing to a full 3-D sampling at 600 μm with a Kolmogorov-Smirnov test as an evaluation index (see main text). More positive values of the index indicate higher similarity to the reference 3D sampling. Fig. 2 shows one such sequence of placements along the lateromedial approach. This process was repeated 100 times. Data for positions with fewer than 10 phosphenes, typically at the start and end of penetrations, have been suppressed as the evaluation index does not return meaningful values with very few points. Maximal phosphene count is found midway through the structure, and maximal evaluation index is found at the same point, or one nearby. Across approaches, the sagittal approach yields the highest phosphene count as well as the the best evaluation index (although see Discussion).
C. Sampling Using Clinical Electrodes
Certain companies (such as Ad-Tech) are currently making DBS electrodes that combine the traditional cuff-style contacts with a tuft of microwires that exit distally. Response field placements for the microwire portion of these electrodes were simulated, assuming 60 (3 × 20) wires per electrode, where wires were trimmed by equal probability to one of three lengths that differed by 1 mm. This was viewed as a realistic engineering possibility, intermediate between a full three-dimensional tip array and a degenerate two-dimensional array as presented above. The microwire electrodes were assumed to splay out from a central encasing sheath until the tips were evenly separated on a planar 250 μm grid centered on the penetration axis. The same three penetration axes were used as above, lateromedial, posterioanterior, and dorsoventral; the optimal positioning for the dorsoventral penetration, based on the KS evaluation index, is shown in Fig. 5.
Fig. 5.
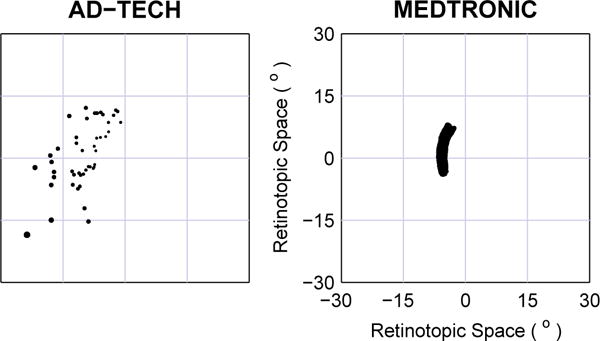
Phosphene positions for clinical electrodes. Left: The microwire portion of Ad-Tech style electrodes with leads trimmed to three levels. Phosphenes shown for 60 microwires total, at three trim lengths separated by 1 mm, at the optimal placement based on the KS evaluation index (see main text). Right: Medtronic style electrodes with 4 cuff contacts 1.5 mm long with 0.5 mm inter-cuff spacing. In this typical placement, the phosphenes appear to form a single wide arc in perceptual space, but there are four independent segments along the arc corresponding to the individual cuffs that lie within the body of LGN. The evaluative index does not give meaningful results for these placements as the percepts are not dispersed, and thus was not used here. Instead an arbitrary, but typical, placement was selected for this figure (see main text for the range of possibilities).
A more traditional DBS electrode, such as manufactured by Medtronic, consists of three or four relatively large conductive cuffs along the shaft of the electrode, separated by insulating material. These were simulated with a dorsoventral penetration axis similar to the surgical approach used when such electrodes are implanted for treatment of movement disorders [25], [26]. Because the contacts have substantial extent compared to microwire tips, the resulting phosphenes form wide arcs rather than points. A typical positioning is shown in Fig. 5, however, possible phosphene patterns range from nearly semicircular arcs close to the fovea, through more S or J shaped paths in the mid-periphery, to quarter-circle arcs in the far periphery. Because of the long extent of the electrode cuffs, and the folded layout of the LGN, there are also placements with phosphene patterns that form two segments, one in the upper visual field, one in the lower field.
IV. Discussion
The hope is that these results will inform the design of a device intended for use in humans. Although maps of human LGN are currently available [19], [27], they are of limited utility for the present effort, either because of low anatomical resolution or because they explore only the central part of visual space. High-resolution anatomic maps are being developed [28], which could be used to help constrain low-resolution functional maps, once the anatomical models are available.
Therefore we look to extending the macaque results to human LGN using the data that are presently available until we are able to make more accurate human measurements directly. Macaque LGN is a six-layered oblate structure. The four superior layers are part of the parvocellular system and span the entire extent of the LGN. The two inferior layers are part of the magnocellular system; these layers begin at the anterior pole and end somewhat short of the posterior pole. Although a strict delineation of the functions of the parvocellular and magnocellular systems is difficult, one distinction between the two is that the parvocellular system conveys color information while the magnocellular system conveys luminance. The six LGN layers carry signals from the two eyes in alternating form; these signals remain segregated until they arrive at V1. Half of the visual scene is represented in each hemisphere’s LGN, split along the vertical meridian. As the LGN is a three-dimensional structure that is used to represent a two-dimensional surface (the retina), there is redundancy along one dimension: Each point in the retina projects to a curved line in the LGN.
Although precise functional measurements have not been made in human LGN, studies of lesions [29] and observations from fMRI [19], [27], have verified that the general layout of human LGN follows that of the macaque. There are, however, some differences. The first is in size: the macaque LGN is about 55 mm3 in volume [18], while the human LGN is, on average, about five times larger, at 250±50 mm3 [19], [30], [31]. The human LGN is somewhat flatter [29], and appears to vary more both in size [30] and structure [32]. Human LGN layers often have irregular borders and the area can have a maximum of eight layers, rather than six, although this is not seen in every individual [32]. Despite these differences, the general structure appears to be the same, and in particular, the mapping of visual space to LGN appears to have the same layout with central vision at the posterior pole and upper and lower quadrants ranging in an approximate lateral-to-medial direction [19]. Therefore, we can take these results in macaque as a basis for human work, although refinements will undoubtedly be necessary as higher-precision functional data become available for human LGN.
One particular anatomical difference that will likely create a functional difference relevant to a visual prosthesis is the flatter aspect of human LGN when viewed in coronal (frontoparallel) section. We report above that the sagittal approach (coming in from the side of the head) for a 2D array of contacts is preferable in monkey because the phosphene layout more closely matches the normal visual density. This is because it is the approach most orthogonal to the lines of projection. The flatter form of the human LGN will reduce the attractiveness of sagittal penetrations and increase that of axial penetrations (coming in from the top of the head) in humans as compared to macaques.
We assumed that LGN was conformally displaced during electrode insertion for fine electrodes, and that the tissue was replaced, instead of displaced, for the Medtronic electrode. Both assumptions leave the underlying visual map essentially undisturbed and allowed the use of straightforward analysis techniques. For the Medtronic electrode in particular, the replacement assumption is likely an overestimate of the effective damage, but a conformal insertion would seem to underestimate it. Although not explored here, we would expect tissue tearing during insertion would result in sets of response fields somewhat between these two extremes. This would mean, for example, the arc in Fig. 5 would be somewhat less wide than presented.
Relatedly, of importance when designing a visual prosthesis with a large plurality of contacts is the fractional volume that the electrodes will occupy within the target structure, and therefore the potential damage they might cause. The volume of human LGN is about 250 mm3 and the longest axis is about 10 mm [19], [30], [31]. Considering a bundle of microwires where an average electrode penetrates halfway into the area, 500 electrodes each 25 μm in diameter would occupy 0.5 percent of LGN. In comparison, electrodes in the Utah silicon electrode array occupy 1 percent of the contained volume in a typical 1.5 mm long, 400 μm spacing, 10-by-10 configuration [33]. Also, Medtronic DBS electrodes, diameter 1.2 mm and active length 20 mm, are placed in globus pallidus, 3700 mm3, and substantia nigra, 800 mm3, for treatment of movement disorders [25], [26], [34] and respectively have 0.7 and 3 percent of the volume of these two structures. Because of the variability in human LGN size, and the desirability of minimizing total electrode volume, we would expect that a range of visual prosthesis DBS electrodes with differing contact counts would be available to the neurosurgeon, in a manner analogous to other medical devices that are adapted to variations in body size.
In humans, the LGN is approximately 1 cm away from subthalamic structures that are routinely used for sterotaxically implanting DBS electrodes [25], [26]. DBS electrodes are implanted using a rigid frame carefully aligned to the skull, and are inserted through small craniotomies cut near the top of the head. Because the craniotomies are small relative to those used in other brain surgeries, the procedure is considered minimally invasive [35], [36], although there are significant potential risks [37]. A series of test penetrations with traditional tungsten recording microelectrodes is often used before implanting a DBS electrode to verify 3D registration. While implanting the DBS electrode, micrometer control along the penetration axis is possible and the ultimate accuracy of placement orthogonal to the penetration axis is typically within 1 mm at depth [23].
The present research needs to be extended to psychophysical experiments such as done by Brindley [6], Normann [7], Schmidt [4], Humayun [38] and others, to determine the utility of differing electrode densities for various tasks, such as object localization, object recognition, facial recognition, navigation through familiar and unfamiliar environments, and so forth. Given the increase in volume of the human LGN as compared to the macaque structure, it is likely that an accordingly larger electrode spacing will suffice for a given desired contact count, easing bioengineering issues such as tissue displacement during electrode insertion. Nevertheless, the number of independent phosphenes necessary to perform a given task remains a subject for further research. Further, while microstimulation of a single electrode in monkey LGN produces pixel-like percepts that can be immediately used in a spatial task [1], it is as-yet undetermined if patterned stimulation across multiple electrodes can be used to produce coherent, dynamic percepts.
V. Summary
The combination of compact size and regular topography of LGN makes it an attractive target for electrical microstimulation in a visual prosthesis. Understanding the scales of potentially realizable contact densities and their distribution in visual space is important in designing an eventual device as well as more immediately achievable prototypes. Through simulations in a model macaque LGN, we have shown that reasonable three-dimensional tip spacings of microelectrodes provide non-trivial numbers of contact points within LGN. Moreover, readily available clinical electrodes can provide utility for a prosthesis through advantageous placement. While there are anatomical differences between macaque and human LGN, we have argued that the basic observations should be easily extensible. In short, while many scientific and engineering challenges remain, electrode density parameters do not present fundamental impediments to creating an artificial visual system with reasonably high resolution.
Fig. 2.
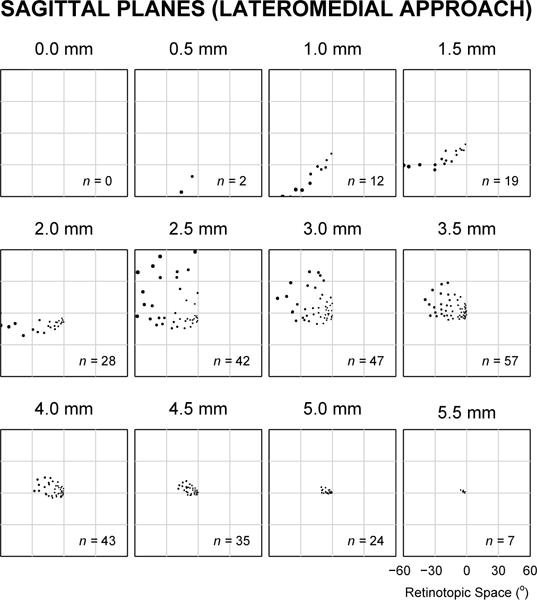
Typical response field locations for electrodes implanted in one hemisphere with tips at successive 500 μm depths along a lateromedial approach, such that electrode tips were evenly arranged in sagittal planes. See black traces in Fig. 3 for the evaluation index of sections in this figure.
Fig. 4.
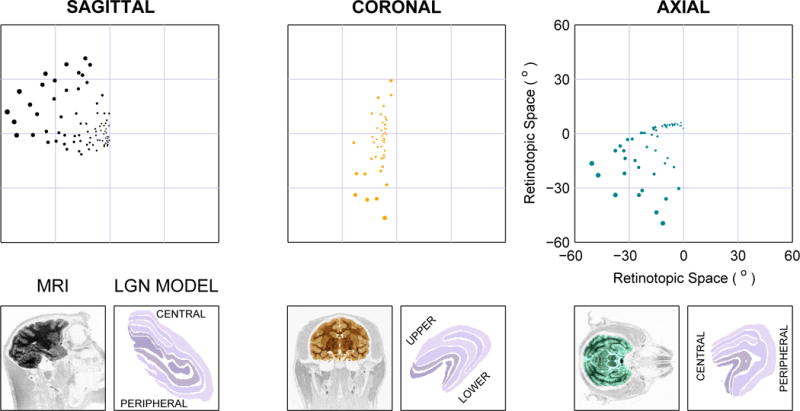
Comparison of single-hemisphere phosphene placement for the depths with maximal evaluation index (see Fig. 3) from the three approaches using 2D electrode arrays with 500 μm spacing. Below each plot is a magnetic resonance image (MRI) from a monkey showing the plane in which electrode tips would lie in the simulated approaches (lateromedial, posterioanterior, and dorsoventral), and an equivalent slice through the LGN model used in this study.
Acknowledgments
This work was supported under a grant from the Bushrod H. Campbell and Adah F. Hall Charity Fund.
Biographies

John S. Pezaris has an S.B. in Computer Science and an S.M. in Computer Science and Electrical Engineering from MIT, and a Ph.D. in Computation and Neural Systems from Caltech. He currently holds dual appointments as an Assistant in Neuroscience at the Massachusetts General Hospital and an Instructor at the Harvard Medical School, and is a co-founder of the AREADNE Conference Series. Information about the thalamic visual prosthesis project is available at http://sight2blind.org. Photo by Yeang Ch’ng.

R. Clay Reid has B.S. degrees in Mathematics and in Physics and Philosophy from Yale, a Ph.D. in Biophysics from The Rockefeller University, and an M.D. from from Cornell. He is a Professor of Neurobiology at Harvard Medical School, where his lab studies the physiology and anatomy of the mammalian visual system. His current research uses laser-scanning microscopy to image neural activity and electron microscopy for large-scale (multi-terabyte) 3D reconstructions of neural circuits. Photo by Yeang Ch’ng.
Contributor Information
John S. Pezaris, Neurosurgery Department of the Massachusetts General Hospital, Boston, MA 02114, USA.
R. Clay Reid, Neurobiology Department of the Harvard Medical School.
References
- 1.Pezaris JS, Reid RC. Demonstration of artificial visual percepts through thalamic microstimulation. PNAS. 2007;104(18):7670–7675. doi: 10.1073/pnas.0608563104. [DOI] [PMC free article] [PubMed] [Google Scholar]
- 2.Brindley GS, Lewin WS. The sensations produced by electrical stimulation of the visual cortex. J Physiol. 1968;196(2):479–493. doi: 10.1113/jphysiol.1968.sp008519. [DOI] [PMC free article] [PubMed] [Google Scholar]
- 3.Humayun MS, de Juan E, Dagnelie G, Greenberg RJ, Propst RH, Phillips DH. Visual perception elicited by electrical stimulation of retina in blind humans. Arch Ophthalmology. 1996;114(1):40–46. doi: 10.1001/archopht.1996.01100130038006. [DOI] [PubMed] [Google Scholar]
- 4.Schmidt EM, Bak MJ, Hambrecht FT, Kufta CV, O’Rourke DK, Vallabhanath P. Need to find title. Brain. 1996;119(2) doi: 10.1093/brain/119.2.507. [DOI] [PubMed] [Google Scholar]
- 5.Rizzo JF, Wyatt J, Lowenstein J, Kelly S, Shire D. Perceptual efficacy of electrical stimulation of human retina with a microelectrode array during short-term surgical trials. IOVS. 2003;44(12) doi: 10.1167/iovs.02-0817. [DOI] [PubMed] [Google Scholar]
- 6.Brindley GS. The number of information channels needed for efficient reading. J Physiol. 1964;177 [Google Scholar]
- 7.Cha K, Horch KW, Normann RA. Simulation of a phosphine-based visual field: Visual acuity in a pixelized vision system. Annals of Biomedical Engineering. 1992;20(4):439–449. doi: 10.1007/BF02368135. [DOI] [PubMed] [Google Scholar]
- 8.Chen SC, Hallum LE, Lovell NH, Suaning GJ. Visual acuity measurement of prosthetic vision: a virtual-reality simulation study. Journal of Neural Engineering. 2005;2(1):S135. doi: 10.1088/1741-2560/2/1/015. [DOI] [PubMed] [Google Scholar]
- 9.Hallum LE, Suaning GJ, Taubman DS, Lovell NH. Simulated prosthetic visual fixation, saccade, and smooth pursuit. Vision Research. 2005;45:775–778. doi: 10.1016/j.visres.2004.09.032. [DOI] [PubMed] [Google Scholar]
- 10.Dagnelie G, Keane P, Narla V, Yang L, Weiland J, Humayun M. Real and virtual mobility performance in simulated prosthetic vision. J Neural Engineering. 2007;4(1):S92. doi: 10.1088/1741-2560/4/1/S11. [DOI] [PubMed] [Google Scholar]
- 11.Sommerhalder J, Oueghlani E, Bagnoud M, Leonards U, Safran AB, Pelizzone M. Simulation of artificial vision: I. eccentric reading of isolated words, and perceptual learning. Vis Research. 2003;43:269–283. doi: 10.1016/s0042-6989(02)00481-9. [DOI] [PubMed] [Google Scholar]
- 12.Thompson JRW, Barnett GD, Humayun MS, Dagnelie G. Facial recognition using simulated prosthetic pixelized vision. IOVS. 2003;44:5035–5042. doi: 10.1167/iovs.03-0341. [DOI] [PubMed] [Google Scholar]
- 13.Wilms M, Eger M, Schanze T, Eckhorn R. Visual resolution with epi-retinal electrical stimulation estimated from activation profiles in cat visual cortex. Vis Neurosci. 2003;20:543–555. doi: 10.1017/s0952523803205083. [DOI] [PubMed] [Google Scholar]
- 14.Orban GA. (ser Studies of Brain Function Springer-Verlag).Neuronal Operations in the Visual Cortex. 1984;11 [Google Scholar]
- 15.Daniel PM, Whitteridge D. The representation of the visual field on the cerebral cortex in monkeys. J Physiol. 1961;159:203–221. doi: 10.1113/jphysiol.1961.sp006803. [DOI] [PMC free article] [PubMed] [Google Scholar]
- 16.Polyak SL. The Main Afferent Fiber Systems of the Cerebral Cortex in Primates. Berkeley, CA: University of California Press; 1932. [Google Scholar]
- 17.Brindley GS. Physiology of the Retina and the Visual Pathway. London: Edward Arnold Ltd; 1960. [Google Scholar]
- 18.Erwin E, Baker FH, Busen WF, Malpeli JG. Relationship between laminar topology and retinotopy in the rhesus lateral geniculate nucleus: results from a functional atlas. J Comp Neurol. 1999;407:92–102. [PubMed] [Google Scholar]
- 19.Schneider KA, Richter MC, Kastner S. Retinotopic organization and functional subdivisions of the human lateral geniculate nucleus: A high-resolution functional magnetic resonance imaging study. J Neurosci. 2004;24:8975–8985. doi: 10.1523/JNEUROSCI.2413-04.2004. [DOI] [PMC free article] [PubMed] [Google Scholar]
- 20.Bjornsson CS, Oh SJ, Al-Kofahi YA, Lim KL, Smith YJ, Turner JN, De S, Roysam B, Shain W, Kim SJ. Effects of insertion conditions on tissue strain and vascular damage during neuroprosthetic device insertion. J Neural Eng. 2006;3:196–207. doi: 10.1088/1741-2560/3/3/002. [DOI] [PubMed] [Google Scholar]
- 21.Tehovnik EJ, Slocum WM, Carvey CE, Schiller PH. Phosphene induction and the generation of saccadic eye movements by striate cortex. J Neurophysiol. 2005;93:1–19. doi: 10.1152/jn.00736.2004. [DOI] [PubMed] [Google Scholar]
- 22.Croner LJ, Kaplan E. Receptive fields of p and m ganglion cells across the primate retina. Vis Res. 1995;35:7–24. doi: 10.1016/0042-6989(94)e0066-t. [DOI] [PubMed] [Google Scholar]
- 23.Holloway KL, Gaede SE, Starr PA, Rosenow JM, Amakrishnan VR, Henderson JM. Frameless stereotaxy using bone fiducial markers for deep brain stimulation. J Neurosurg. 2005;103(3):404–413. doi: 10.3171/jns.2005.103.3.0404. [DOI] [PubMed] [Google Scholar]
- 24.Smallwood RH. A two-dimensional kolmogorov-smirnov test for binned data. Phys Med Biol. 1996;(41):125–135. doi: 10.1088/0031-9155/41/1/010. [DOI] [PubMed] [Google Scholar]
- 25.Kumar R, Lozano AM, Kim YJ, Hutchison WD, Sime E, Halket E, Lang AE. Double-blind evaluation of subthalamic nucleus deep brain stimulation in advanced parkinson’s disease. Neurology. 1998;51(3):850–855. doi: 10.1212/wnl.51.3.850. [DOI] [PubMed] [Google Scholar]
- 26.Limousin P, Krack P, Pollak P, Benazzouz A, Ardouin C, Hoffmann D, Benabid A-L. Electrical stimulation of the subthalamic nucleus in advanced parkinson’s disease. N Eng J Med. 1998;339(16):1105–1111. doi: 10.1056/NEJM199810153391603. [DOI] [PubMed] [Google Scholar]
- 27.Chen W, Zhu X-H, Thulborn KR, Ugurbil K. Retinotopic mapping of lateral geniculate nucleus in humans using functional magnetic resonance imaging. PNAS. 1999;96:2430–2434. doi: 10.1073/pnas.96.5.2430. [DOI] [PMC free article] [PubMed] [Google Scholar]
- 28.Malpeli JG. personal communication. 2007 [Google Scholar]
- 29.Polyak SL. The Vertebrate Visual System. University of Chicago Press; 1957. [Google Scholar]
- 30.Andrews TJ, Halpern SD, Purves D. Correlated size variations in human visual cortex, lateral geniculate nucleus, and optic tract. J Neurosci. 1997;17(8):2859–2868. doi: 10.1523/JNEUROSCI.17-08-02859.1997. [DOI] [PMC free article] [PubMed] [Google Scholar]
- 31.Zworykin VP. Some new data on individual quantitative peculiarities of the human lateral geniculate body. Arkiv Anatomii Gistologii i Embriologii. 1980;78(3):24–27. [PubMed] [Google Scholar]
- 32.Hickey TL, Guillery RW. Variability of laminar patterns in the human lateral geniculate nucleus. J Comp Neurol. 1979;183:221–246. doi: 10.1002/cne.901830202. [DOI] [PubMed] [Google Scholar]
- 33.Jones KE, Campbell PK, Normann RA. A glass/silicon composite intracortical electrode array. Ann of Biomed Eng. 1991;20(4):423–437. doi: 10.1007/BF02368134. [DOI] [PubMed] [Google Scholar]
- 34.Geng D-Y, Li X-Y, Zee C-S. Magnetic resonance imaging-based volumetric analysis of basal ganglia nuclei and substantia nigra in patients with parkinson’s disease. Neurosurg. 2006;58(2):256–262. doi: 10.1227/01.NEU.0000194845.19462.7B. [DOI] [PubMed] [Google Scholar]
- 35.Yamamoto T, Katayama Y, Hirayama T. Minimally invasive neurosurgery for involuntary movement and intractable pain: from destructive surgery to electrical stimulation therapy. Funct Neurosurg. 1997;36:23–28. [Google Scholar]
- 36.Mogilner AY, Benabid A-L, Rezai AR. Brain stimulation: current applications and future prospects. Thalamus and Related Systems. 2001;1:255–267. [Google Scholar]
- 37.Hariz MI. Complications of deep brain surgery. Movement Disorders. 2002;17(S3):S162–S166. doi: 10.1002/mds.10159. [DOI] [PubMed] [Google Scholar]
- 38.Hayes JS, Yin VT, Piyathaisere D, Weiland JD, Humayun MS, Dagnelie G. Visually guided performance of simple tasks using simulated prosthetic vision. Artificial Organs. 2003;27(11):1016. doi: 10.1046/j.1525-1594.2003.07309.x. [DOI] [PubMed] [Google Scholar]