Abstract
To simultaneously overcome the challenges imposed by the nature of optical imaging characterized by a range of artifacts including space-varying signal to noise ratio (SNR), scattered light, and non-uniform illumination, we developed a novel method that segments the 3-D vasculature directly from original fluorescence microscopy images eliminating the need for employing pre- and post-processing steps such as noise removal and segmentation refinement as used with the majority of segmentation techniques. Our method comprises two initialization and constrained recovery and enhancement stages. The initialization approach is fully automated using features derived from bi-scale statistical measures and produces seed points robust to non-uniform illumination, low SNR, and local structural variations. This algorithm achieves the goal of segmentation via design of an iterative approach that extracts the structure through voting of feature vectors formed by distance, local intensity gradient, and median measures. Qualitative and quantitative analysis of the experimental results obtained from synthetic and real data prove the effcacy of this method in comparison to the state-of-the-art enhancing-segmenting methods. The algorithmic simplicity, freedom from having a priori probabilistic information about the noise, and structural definition gives this algorithm a wide potential range of applications where i.e. structural complexity significantly complicates the segmentation problem.
Keywords: Image segmentation, Non-uniform illumination, Tubular structures
1. Introduction
Tubular networks are one of the fundamental structures in biological and medical studies. They are found in the skeletal structures, nerve fibers, systems for propagating gases (intrathoracic airway trees) and fluids (vascular and microvascular networks), and are subject of extended studies [1, 2, 3, 4]. When imaging, it is of crucial importance to devise effcient segmentation methods that deliver an accurate platform for further analysis such as bifurcation detection, centerline approximation, or shape matching operations. The work in this paper focuses on the volumetric extraction of interconnected tubular structures from various forms of biological imagery with specific application to vascular networks.
Common to vascular detection methods, an initial stage is necessary to denoise, enhance, and binarize the raw data [5, 6]. Segmentation of vasculature is of high importance for quantitative analysis and visualization purposes in diverse fields of study such as neuroscience [7] and tumor monitoring [8]. The segmented data set provides a means to extract crucial quantitative information about the vasculature such as surface areas, diameters, tortuosities, and branching patterns of vessels. It also can serve as a platform for performing further advanced processing [2].
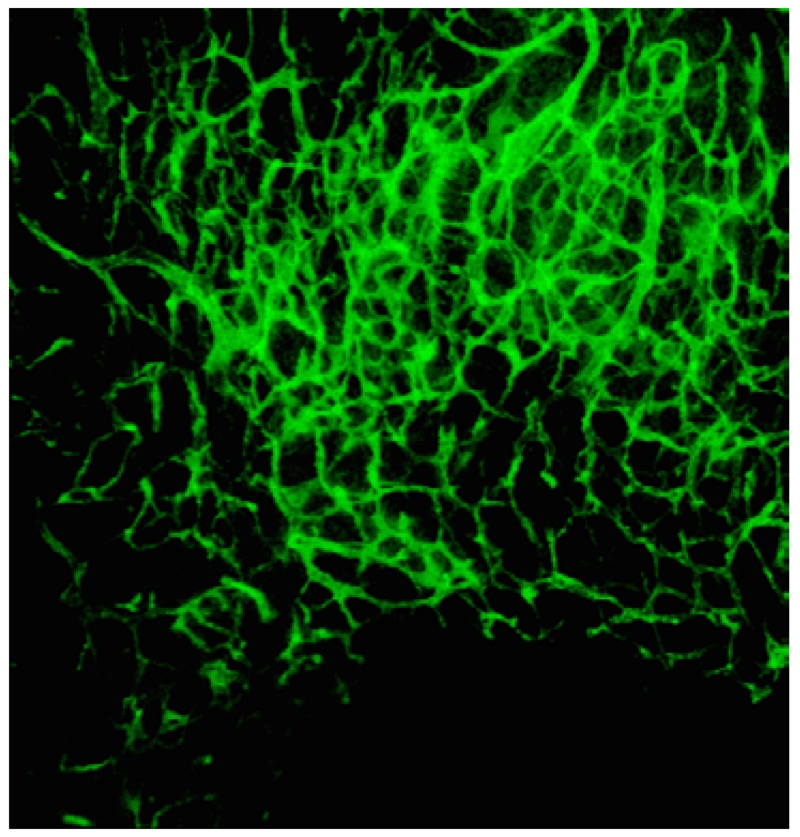
Of particular interest to us is the case of cortical microvasculature determination in murine models from 3-D fluorescence microscopy data stacks that manifest vessels of low tortuosity. This data of interest indeed calls for pre-processing as accurate and fast segmentation and volumetric reconstruction of the complex microvasculature networks from fluorescence microscopy images faces challenges owing to the existence of numerous imaging artifacts shown in Figure 1: uneven illumination, non-homogenous intensity distribution inside the vessels, low SNR regions, high spatial density or closeness of vessels, reduced contrast at edges, broken or faint vessels, and low frequency background variations caused by scattered light [5, 9]. The noise stems from several sources such as stochastic photon counting, thermal and electrical fluctuation in the imaging device, biological background, and non-uniform fluorophore distribution [9, 10]. Many of these problems are related to the photon counting nature of the imaging system. For that matter, the image quality is directly determined by the number of detected photons that is in turn controlled by the exposure time which has to be limited to preserve the health of the specimen as excessive fluorophore excitation causes cell phototoxicity and photobleaching [11]. Thus, lower number of detected photons results in an SNR reduction in the obtained images. Also, images of poorly stained samples are likely to show structural irregularities such as vessel breakage [12].
Figure 1.
In this maximum intensity projection of 3-D fluorescence microscopy image of murine cranial tissue, miscellaneous imaging artifacts are visible: uneven illumination (upper vs. lower parts), non-homogenous intensity distribution inside the vessels (visible in the larger vessels located at top right corner), low SNR regions (lower areas), high spatial density or closeness of vessels (majorly in the center-upper parts), reduced contrast at edges (visible as blurs mostly for the central vessels), broken or faint vessels (lower vessels), and low frequency background variations caused by scattered light (at higher density regions).
These issues result in two challenges: (1) identifying the smaller structures along with their connectivity (breakages are prevalent for these cases) and (2) the recovery of larger vessels that tend to be surrounded by heavy imaging artifacts making the boundaries more diffcult to perceive (over segmentation is an issue). Therefore, developing segmentation algorithms that can overcome imaging artifacts, are robust to the imaging artifacts and structural variations is of great importance.
Several studies have been done on the subject of vascular or in general term tubular structures segmentation for different imaging modalities [2, 13, 14]. They include methods such as active contours [16, 17], geometric model-based techniques [18, 19], or region growing approaches [20], tracking [21], and template-based methods [22]. Tracing-based algorithms work by following vascular segments starting from some initial seed points. These methods fail at recovering broken vessels and are highly dependent on the seed point selection. Matched filtering based approaches model the vessel structure as the intensity-ridges of a multiscale vesselness function [23]. These algorithms are susceptible to outliers and are not robust to noise [24]. Active contour approaches are flexible in terms of finding the intricate vessel shapes. However, they are prone to leakage into the background where edges have low contrast. This property can drastically undermine the performance of active contours where the segmented structure is dense and leakage will lead to merging of separate vessels. A popular region accumulation approach is the watershed transform, but this approach can result in over segmentation and requires further processing [25]. The method proposed in [26] that uses a combination of clustering and classification techniques to segment vasculature segments vasculature suffers from broken vasculature and requires a linking post processing. Also, its parameters are selected regardless of the structures size and undermine the performance of segmentation in networks of varying size vasculature. Finally, model-based methods require a prior information on the vascular structures [2]. Therefore, developing an effcient algorithm that can jointly retrieve microvascular volume and remove noise from data is necessary.
We have developed a new iterative region growing algorithm that is able to provide precise segmentation directly from the raw data without the pre-processing requirement of denoising or other image enhancing operations. The iteration starts with a robust initialization scheme that is unbiased to the non-uniform illumination or lower SNR conditions and is based on local statistical analysis of image intensities. A full segmentation is achieved by iteratively augmenting the seed points through classifying/voting of feature vectors formed by voxels location, local intensity gradient, and non-linear statistical measures information such as median level.
We perform vessel segmentation with the following contributions. First, we remove a priori probabilistic noise model and geometrical (such as curvature or branching pattern about the vessels except for the local diameter) assumptions. Then, a set of features derived from bi-scale statistical measures are defined and used to robustly (invariant to non-uniform illumination, low SNR, and local structural variations) and automatically derive the seed points. Finally, the segmentation algorithm is designed to directly restore the vasculature and simultaneously reject the imaging artifacts for enhancement. This method is automatic and does not require manual interaction. Collection of these features allows us to obtain an accurate segmentation from the 3-D fluorescence microscopy data. Experimental results obtained from synthetic and real datasets confirm that the proposed algorithm greatly improves upon the previous segmentation methods performed on vasculature data.
The remainder of this paper is organized as follows. In Section 2, we present the proposed segmentation technique in two parts of initialization and vessel recovery method. Section 3 presents the segmentation evaluation results obtained from synthetic (quantitative in terms of sensitivity and specificity) and real data (qualitative). The segmentation performance is compared to state-of-art methods using real fluoroscopic data in this section. Finally, Section 4 concludes the paper and indicates the possible future paths for continuing this study.
2. Methodology
This section explains the basics of vessel extraction process given in the Algorithm 1 and termed as Constrained Region Evolutionary Vessel Enhancement and Recovery (CREVER). There are two primary components to this process: initialization and vessel recovery. The basis of the extracted structure is founded in the initialization stage. Then, the full vasculature is built recursively in the vessel recovery part. The details of each of these parts are provided in the following subsections.
2.1. Notation
The notations in Table 2 will be used for the rest of paper:
Table 2.
Accuracy measure for detected edge points
| Dataset | 1 | 2 | 3 | 4 |
| PSNR (dB) | 8 | 6 | 4 | 2 |
| Average displacement (voxel) | 1.63 | 1.97 | 3.74 | 5.31 |
2.2. Initialization
As shown in the pipeline of Figure 2 and Algorithm 1, we propose a two scale kernel-based method to determine a set of seed points. The initialization is based on comparing patch-based statistical measures that have been proved to outperform the higher level features in structural classification of images [28]. This approach is similar to the ideas in [27] where signals are detected by thresholding mean-to-mean ratio of different kernels. However, the complex nature of artifacts in the data of interest calls for a more effective measure. Rank-ordered statistical filters are an effcient choice here for their robustness (effectiveness in suppressing Poisson and shot noise [29]) and low computational cost. The most well-known of this group is the median filter that is resilient measure of central tendency to outliers. This property allows them to be used directly on the original data as a means for finding the local dominant intensity. Advantageously, median filters balance noise reduction and over smoothing which is an inevitable by-product of majority of the denoising methods esp. linear filters that causes blurred edges and lowered contrast [30]. We have observed that median values of concentric kernels (cubes) of two different scales (side length) differ markedly if the center point is located on the microvasculatures. Microvasculature is of a spatially sparse structure, thus the median value of the smaller kernel ms even if the vesselsare faint in intensity will be significantly higher than the median value of the larger kernel ml in which lower intensity background voxels will dominate. Therefore, this feature is robust to non-uniform illumination where median of kernels are analyzed locally.
Figure 2.
The pipeline of initialization stage.
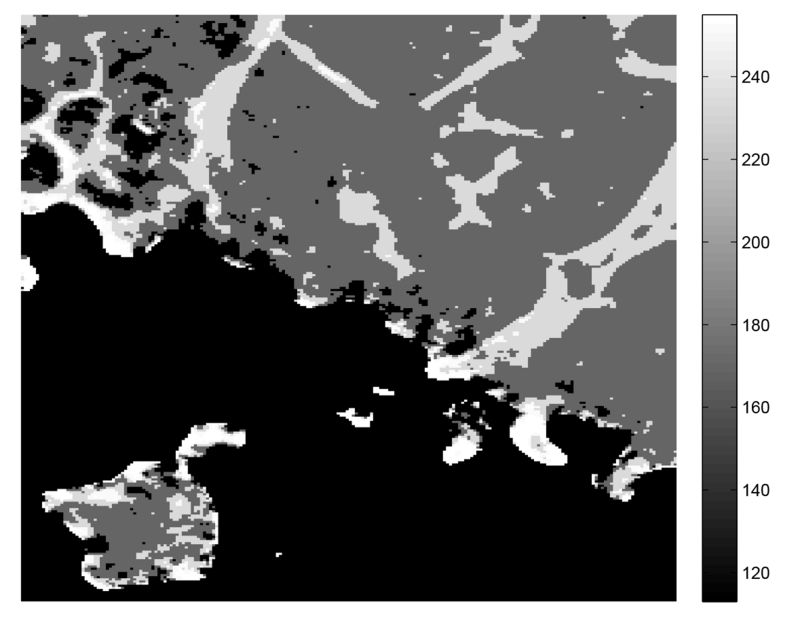
Four cases of bright vessel (A), noisy background (B), faint vessel (C), and dark background (D) are specified on maximum intensity projection (MIP) of a 3-D image in Figure 3 to illustrate this intuition. Histograms for the intensity distribution of the points located in the kernels of scales s (small) and l (large), s < l, are shown on the right side of the figure where median values are marked by blue and red diamond topped bars for small and large scale kernels. For background points, these values either do not differ considerably or the median in the larger neighborhood exceeds the smaller neighborhood in the proximity of other microvasculature. Therefore, the ratio obtained from the median filtered images using kernels of s × s × s and l × l × l size, centered on voxels (x, y, z) ∈ I, where ml ( x, y, z) ≠ 0 delivers a well-separable set of feature points by clustering of which one can obtain robust seed points Γ0 regardless of the mixed-noise, non-uniform illumination, and other imaging artifacts. One example of this ratio that is calculated for 2-D slice of the image in Figure 3 is shown in Figure 4. According to this figure, dimmer vessels especially in the lower and upper left corners have received larger levels (visualized by larger intensity values). Non-uniformity of vessel sizes and noise variance over the data gives a range of values to the ratio. However, a good selection of s and l ensures the least overlap between the clusters. Here, s and l are selected based on the vessel radius measurements obtained from the image I. The s is set as the smallest vessel radius, ρ1, to ensure the preservation of small structures. In order to balance locality and inclusiveness, l is chosen as twice the largest vessel diameter, 4ρ2. This amount allows for the incorporation of enough background and vasculature in the larger box. The radius at each foreground point in I is estimated by means of the method used in [31]. We first compute the ratio for all points, run k-means (k = 2) clustering [32], then set the Γ0 as the voxels in of the larger centroid cluster. Finally, to guarantee the structural enhancement besides recovery of faint vessels, Γ0 is augmented by inclusion of the points that are located in the brightest regions as they may not pass the 2-means thresholding in the highly noisy regions (where ml is also large):
| (1) |
Figure 3.
Four different classes of voxels observed in the original data are indicated here: Bright vessel (A), noisy background (B), faint vessel (C), and dark background (D). Histograms for the intensity distribution and the median value of the points located in the s and l-scale kernels are shown on the right side. For these histograms, dark values correspond to the left edge of the abscissa and light values for the right edge. Diamond topped bars mark median values on the histograms. Distinguishable comparative situation of median values is used as the basis for detecting relevant structures.
Figure 4.
The ratio obtained from the median filtered images using kernels of s × s × s and l × l × l size for pixels with ml ≠ 0.
2.3. Region growing structure retrieval
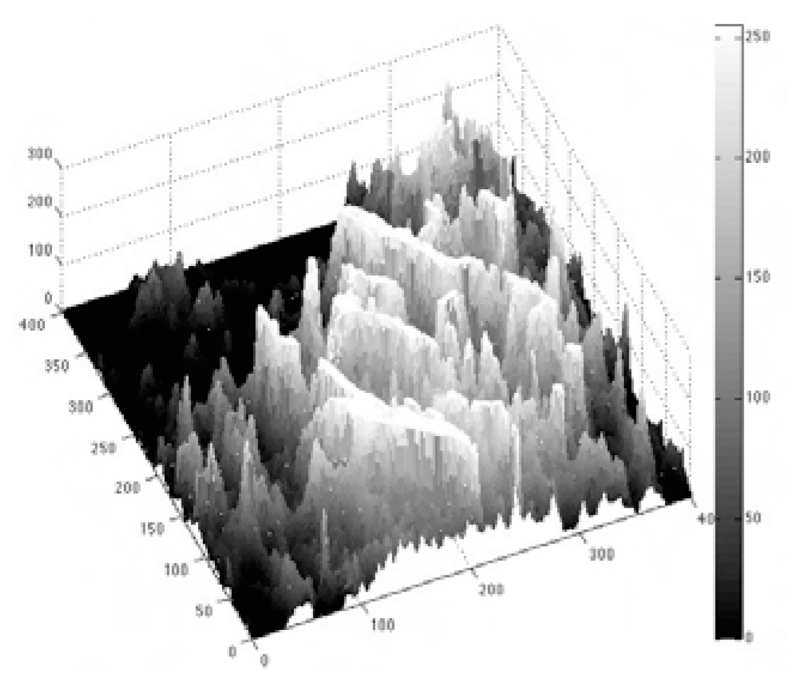
Given the detected seed points, we extract the entire volume through a region-growing method that simultaneously rejects imaging imperfections. This method recursively extracts the structure from raw data and eliminates the need for pre-processing operations such as enhancement or denoising. This method is based on the observation that local median intensity in cubic kernels typically decreases as kernel moves away from the vasculature’s centerline. Figure 5 illustrates this claim on the mesh plot of a 2-D grayscale image slice of microvasculature. The structured ridges marked by the brightest shades belong to the microvasculature. The brightness decreases smoothly by moving radially from the vessels centerlines. The intensity drops abruptly at the blood vessels boundaries where the desirable segmentation stops proceeding. Thus, the method as described in Algorithm 1, directs the segmentation along the areas with smoothest decreasing local intensity median value until reaching a sharp intensity drop that is detectable by the gradient feature. This is performed via voting for the voxels in the immediate 3-D neighborhood (maximum of 1-voxel distance in every direction) of the retrieved region that show similar statistical properties in terms of median value in their cubic vicinity, at each iteration.
Figure 5.
Mesh plot of a 2-D slice of a locally median filtered fluorescence microscopy image. Structured ridges marked by the brightest shades belong to the microvasculature.
More formally, with ms the median image value in all s × s × s kernels, we first form a sequence with monotonically decreasing order from max(ms) to min(ms) with unit step size. This sequence is shown with δ1 = max(ms), δ2, … , δn = δn−1 – 1, … , δN = min(ms) in the CREVER pseudocode at line 5. The number of iterations, N, is determined by the largest and smallest values of ms in the given image such that N = max(ms) − min(ms) + 1. The CREVER starts segmentation at iteration 0 from the seed points, Γ0, obtained from the grayscale image I, and refines Γn until reaching the Nth iteration. At the nth iteration, new voxels are classified/voted as part of the structure when their attributes satisfy three constraints: adjacency to the retrieved regions, having median intensity of equal or greater than the one determined by the iteration number (ms ≥ δn), and having a low normalized absolute gradient value (line 10) where
| (2) |
The last criterion prevents leakage across vessel boundaries. Finally, to avoid missed detections caused by imaging artifacts in the microvasculature, retrieved regions are morphologically closed at each step using a spherical structuring element of radius one, sph1, (line 11). Finally, the segmented image, IB, is obtained by thresholding the retrieved region at the last iteration, ΓN−1, with 0. Selection of τ has an important role in the method’s overall performance. For a small τ, region growing will be halted prematurely, and some regions will be missed. On the other hand, for a τ that is too large, many of the noisy background voxels will be included in the retrieved vasculature. This parameter is set as the mean of two clusters centroids found by the 2-means clustering of Ig to avoid either of these deficiencies.
Algorithm 1.
CREVER
| Inputs: Grayscale image I, ρ1, and ρ2 |
| Initialization: |
|
| Output: Binary Image IB |
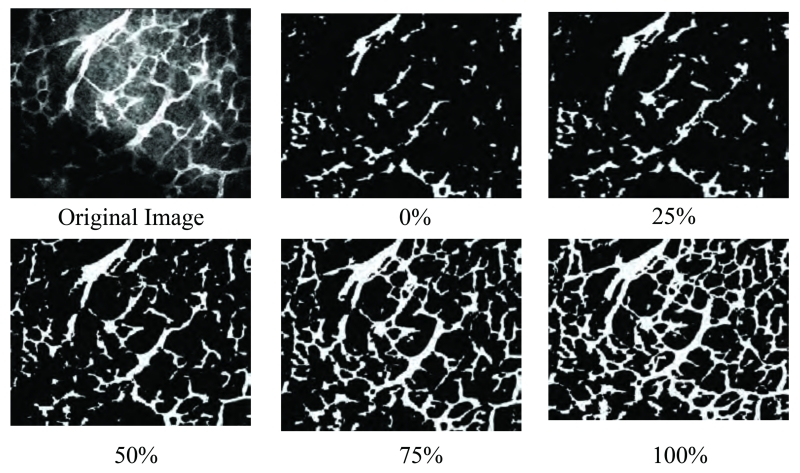
Figure 6 shows an example of the microvasculature segmentation via the CREVER method for a 2-D slice of a three dimensional fluorescence microscopy image from iteration 0 (seed points) to the last iteration. The final image demonstrates the accurate recovery of structures from noisy, artifacted, and low contrasted areas. To be specific, the results obtained for the lower left part of the image supports this claim. Inhomogeneous illumination greatly lowers the visibility of the vasculature in this part that is the reason of being missed by other denoising-segmenting methods as it will be shown in Section 3.2. Since the computations are done in cubic kernels, some of the structural content from the above and below slices of the current one are included in the enhancement process, which is the reason for having a slightly more complete structure than the original image in the final result. Processing in the cubic regions is the key feature of CREVER in reducing vessel breakages and improving the accuracy.
Figure 6.
A slice of an original 3-D fluorescence microscopy image, seed points, recovered microvasculature at 25, 50, 75, and 100% of the CREVER method’s development.
3. Experiments
In this section, effciency of the proposed method is assessed first by using the quantitative performance measures. Next, the vessel enhancement power is qualitatively shown and compared with those of other combination of methods using 3-D fluorescence microscopy images of murine samples. Finally, we investigate the effect of parameter selection on the proposed method’s per-formance.
3.1. Quantitative analysis
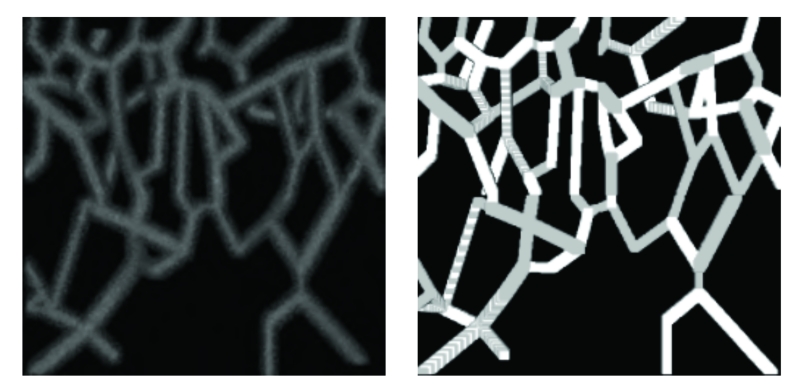
To conduct the quantitative evaluations, a set of synthetic images are generated by corrupting a single structure with varying amounts of noise to simulate different PSNRs. In detail, a synthetic image is formed by developing an interconnected tubular network from a specific ground truth graph similar to the approaches discussed in [33] using the same parameter values. This structure is shown on left side of Figure 7. The volume obtained from CREVER is provided on right side of the Figure 7. Different shades present in this demonstration of the binary data are resultant of the 3-D rendering approach. To achieve a target PSNR (peak signal-to-noise ratio), a common approach in Poisson noise assessment literature [10, 34] is used that is based on scaling the maximum intensity of image defined as
| (3) |
with MSE being the mean square error between the noisy and noise-free versions. For the following experiments, PSNR levels are changed from 2 to 15 dB in ten steps. For each PSNR, experiments are repeated ten times and the average is reported as final result.
Figure 7.
Left: MIP of synthetic image with PSNR= 5 dB. Right: the segmentation obtained by the CREVER method.
The performance of the CREVER is evaluated and compared with three state-of-the-art EM-based (expectation maximization) [35], graph-cut [36], and level-set [16] segmentation methods. These methods are tuned via exhaustive searching of optimal parameters to deliver their best performance for the given data sets.
As performance measures, true positive rate (TPR) or sensitivity and false positive rate (FPR) or (1-specificity) calculated as below
| (4) |
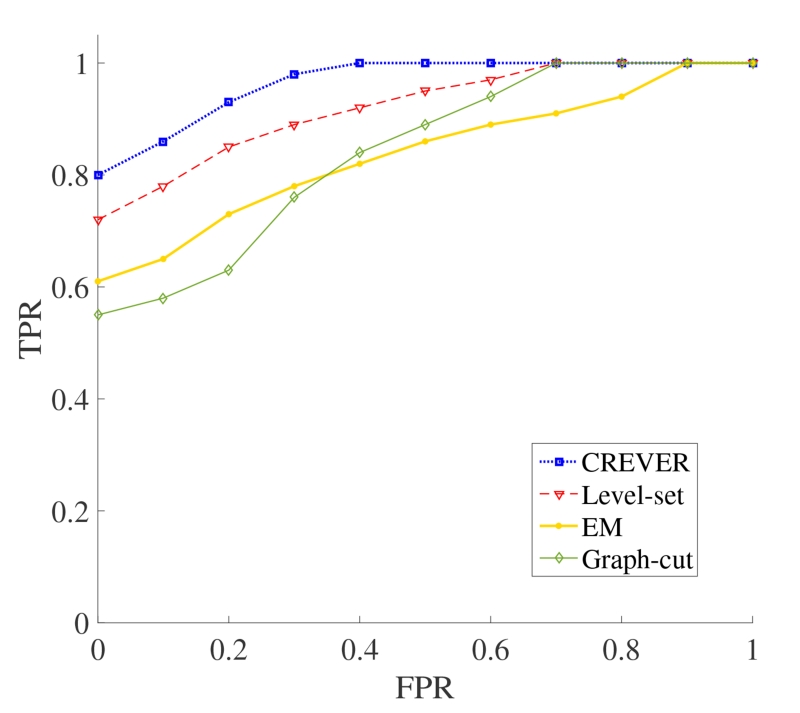
are used to draw the receiver operating characteristic (ROC) curves of these methods, shown in Figure 8, applied to the synthetic data. Results suggest that CREVER is superior in performance having the largest area under curve (AUC). Besides a high level of TPR, this method performs very well in rejecting background artifacts as measured by low false positive rates. Level-set method provides the next best performance behind CREVER. The EM-based and graph-cut segmentations perform inferior to the CREVER.
Figure 8.
The ROC curves obtained using CREVER (the proposed method), level-set, EM-based, and graph-cut segmentation methods using synthetic images with PSNRs in the range of 2 to 15 dBs.
To further emphasize the power of the CREVER method, accuracy of the retrieved vascular networks edges has been measured in terms of average displacement. Varying PSNR level over the structure in Figure 7 forms the synthetic datasets. The obtained edge points are determined as the foreground voxels with at least one background voxel in their 8-neighborhood. Then, they are matched to ground truth edge points via the Hungarian bipartite matching algorithm with Euclidean distance-based cost matrix. The average displacement is calculated as the average distance between all the pairs of corresponded points in voxel scale and provided in Table 2 for four datasets. The results start from a satisfactory level of 1.63 voxel for PSNR = 2 and increase as the noise level rises. Given the radius range in testing data (10-20 voxels), the results prove the accuracy of the segmentation boundaries and stability of the method against the noise.
3.2. Comparative qualitative analysis
Qualitative validation of the proposed algorithm has been completed by applying it to three sets of 3-D vascular images from murine nervous tissue. Testing datasets were selected such that they show a range of structural and noise properties. To generate these data, heterozygous Plexin-D1-fGFP transgenic mice were used to visualize GFP-expressing developing blood vessels in the embryonic thalamus. All animals were maintained and treated with approved Institutional Review Board protocol according to the National Institutes of Health guidelines and approved by the Institutional Animal Care and Use Committee at Harvard Medical School. Three dimensional vascular images (z-stacks) were acquired using a Leica LSM 510 META confocal microscope in embryonic thalamus. The SNR of images ranges from 3 to 7 dB roughly.
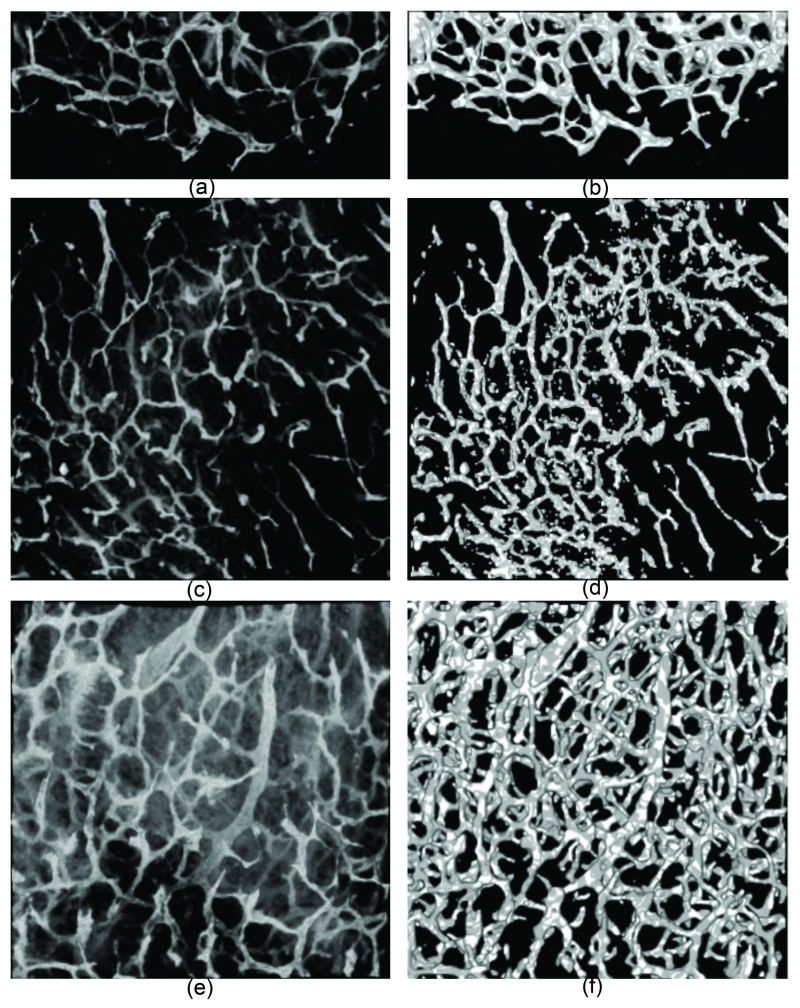
The first image, of size 200 × 450 × 50 voxels, is shown in Figure 9(a) with MIP where the MIP of its segmentation obtained by the CREVER method is also shown in Figure 9(b). The next data is obtained from a more homogenous (in vessel shape and size senses) microvascular network. However, the noise distribution differs markedly throughout the image as apparent from Figure 9(c). This image is of size 500 × 500 × 45 voxels. The segmented image is shown in Figure 9(d). This image has been collected from a thinly cut layer of tissue, thus isolated points are formed from recovery of those partial structures. The last dataset that is of size 400 × 400 × 50 voxels incorporates a spatially dense microvascular network with high noise content apparent in the original image shown in Figure 9(e). However, the segmentation presented in Figure 9(f) proves stability of the CREVER in presence of strong noise and artifact elements. The CREVER method has recovered the vasculature regardless of its local statistical variations, noise level, and structural properties such as vessel radius measure. Considering all cases, it is obvious that the proposed method produces an overall high quality segmentations of microvasculature from 3-D fluorescence microscopy images. It well preserves the structural specifications such as continuity and smoothness of the vessel boundaries while noticeably removing imaging artifacts and noise.
Figure 9.
Left side: The MIPs of real data sets. Right side: the segmentations obtained via the CREVER method.
Carrying on to the qualitative evaluation of CREVER, it is compared with the three segmentation algorithms of EM-based (expectation maximization), graph-cut, and level-set methods applied to the back-ground subtracted version of the image shown in Figure 6(a). Background subtraction is performed through the temporal median filtering [37] of the image stacks at the scale of the largest vessel in each dataset. The results presented in Figure 10 suggest the superiority of the CREVER method especially for small or low-resolution structures such as those in the left and lower left parts of the images marked by a red dashed circle. CREVER recovers the vasculature in a more non-selective manner regarding illumination uniformity, contrast level, and vascular size and is more robust to image artifacts. It also outperforms the other methods in retrieving the vasculature of low PSNR parts such as those located in the center of the image. The level-set method performs well in this region; however, it shows higher false negative rates for smaller branches. The EM-based method retrieves more structure compared to the graph-cut method where the graph-cut method performs with higher accuracy in terms of false positive rate
Figure 10.
Segmentation of Figure 6 obtained via the (a) CREVER applied to the raw data and (b) EM segmentation, (c) graph-cut, and (d) level-set methods initialized on the background subtracted image.
The computational complexity of the CREVER method is dominated by the median filtering’s cost that is in turn dependent on the larger kernel size, . Since l is dependent on the largest vessel radius in the given data, computational complexity is consequently relative to the imaged tissue’s vasculature measure. The iterations count in the CREVER part however, is data independent and is bounded by the maximum voxel intensity of the data. Finally, this method scales to data of arbitrary size as all the operations are parallelizable for disjoint partitions from an image.
3.3. Parameter analysis
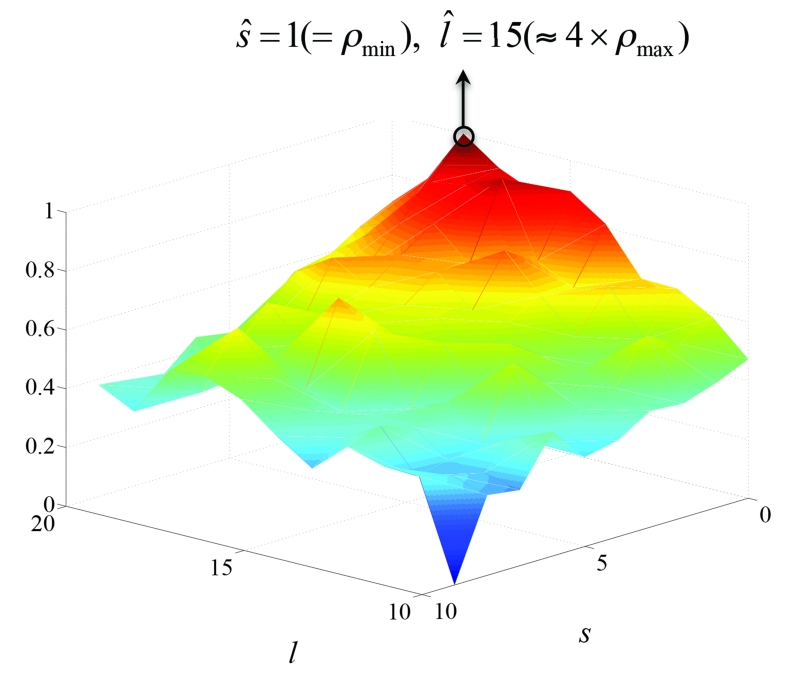
In section 2.2, it was shown that parameters s and l are set by approximations of the smallest and largest vessel radii. Here, we show that these assignments are optimal and show that deviation from these values deterio-rates the performance. Figure 11 shows the mesh plot of the segmentation accuracy (ACC) metric defined as
| (5) |
where TNR and FNR are true and false negative rates. The ACC is measured over the segmentations obtained from the synthetic image in Figure 7(a) vs. varying s and l values where vessel radius ranges from 1(= ρ1) to 4(= ρ2) in the synthetic image. This plot shows that the best ACC is achieved when the parameters are around the same ratio of the vessel radii as discussed in Section 2.2, s = 1(= ρ1) and l = 15(≈ 4 × ρ2).
Figure 11.
Mesh plot of the ACC obtained from segmentations of the synthetic image in Figure 7(a) vs. s and l.
4. Conclusion
This paper addresses the segmentation problem of 3-D vascular networks. Acquiring high quality segmentation of these structures is essential for post-processing operations like centerline extraction and quantitative shape analysis. A novel iterative algorithm is proposed that is based on a bi-scale filtering scheme. The proposed method is tested on the fluorescence microscopy images of the murine cranial microvasculature. These images manifest miscellaneous types of noise, varying SNRs, uneven contrast, and structural complexity that prove to be challenging for existing segmentation methods even when they process denoised and pre-processed data. Our method iteratively retrieves the vasculature and robustly builds the structural pattern of interest while rejecting the imaging artifacts. The search algorithm uses a greedy approach which selects the locally optimal voxels that are in compliance with the structure at each iteration. These voxels are the points for which the radial distance and standard intensity deviation are in the acceptable range from the given retrieved region. Evaluations on real fluorescence microscopy and synthetic data show that the presented method has high specificity and sensitivity while it outperforms state-of-the-art methods. Without loss of generality, this method is applicable to images of two dimension and with less computational complexity. Also, the algorithm can be adapted for different imaging modalities with different probabilistic models of noise. The segmentation method can generalized to images of other tubular shapes including neurons and retina’s vasculature with some modifications such as intensity scaling.
Table 1.
Notations used for the vessel recovery process.
| I | Grayscale image |
| ρ 1 | Smallest radius of all the vessels |
| ρ 2 | Largest radius of all the vessels |
| ms | Median filtered I by small scale kernels |
| ml | Median filtered I by large scale kernels |
| ∇ | First order finite difference approximation to gradient operator |
| ||·|| | Euclidean distance |
| ⊕ | Morphological dilation |
| ⊖ | Morphological erosion |
| sph 1 | Spherical structural element of radius 1 |
Acknowledgements
The authors would like to thank the Enhanced Neuroimaging Core at Harvard NeuroDiscovery Center for helping with confocal imaging. We also thank Dr. Yutaka Yoshida from Cincinnati Childrens Hospital for providing the Plexin D1-fGFP mouse. This work was supported by the National Science Foundation award 0958345 (S.A. and X.X.), the Goldenson post-doctoral fellowship (A.B.-Z.), the Harvard/MIT Joint Research Grants Program in Basic Neuroscience (X.X., B.L., and C.G.), NIH grant R01LM011415 (X.X.), United States.
Footnotes
Publisher's Disclaimer: This is a PDF file of an unedited manuscript that has been accepted for publication. As a service to our customers we are providing this early version of the manuscript. The manuscript will undergo copyediting, typesetting, and review of the resulting proof before it is published in its final citable form. Please note that during the production process errors may be discovered which could affect the content, and all legal disclaimers that apply to the journal pertain.
References
- [1].Jackowski M, Papademetris X, Dobrucki LW, Sinusas AJ, Staib LH. Characterizing vascular connectivity from microCT images. Med. Image Comput. Comput.-Assisted Intervention (MICCAI) 2005:701–708. doi: 10.1007/11566489_86. [DOI] [PubMed] [Google Scholar]
- [2].Lesage D, Angelini ED, Bloch I, Funka-Lea G. A review of 3D vessel lumen segmentation techniques: Models, features and extraction schemes. J. Medical image analysis. 2009;13(6):819–845. doi: 10.1016/j.media.2009.07.011. [DOI] [PubMed] [Google Scholar]
- [3].Kim J, Oh WJ, Gaiano N, Yoshida Y, Gu C. Semaphorin 3E-Plexin-D1 signaling regulates VEGF function in developmental angiogenesis via a feedback mechanism. Genes Dev. 2011;25:1399–1411. doi: 10.1101/gad.2042011. [DOI] [PMC free article] [PubMed] [Google Scholar]
- [4].Blinder P, Tsai PS, Kaufhold JP, Knutsen PM, Suhl H, Kleinfeld D. The cortical angiome: an interconnected vascular network with noncolumnar patterns of blood flow. Nat. Neurosci. 2013;(16):889–897. doi: 10.1038/nn.3426. [DOI] [PMC free article] [PubMed] [Google Scholar]
- [5].Sarder P, Nehorai A. Deconvolution methods for 3-D fluorescence microscopy images. IEEE Signal Processing Magazine. 2006;23(3):32–45. [Google Scholar]
- [6].Suri JS, Liu K, Reden L, Laxminarayan S. A review on MR vascular image processing algorithms: acquisition and prefiltering: part I. IEEE Trans. Inform. Technol. Biomed. 2002;6:324–337. doi: 10.1109/titb.2002.804139. [DOI] [PubMed] [Google Scholar]
- [7].Wang R, Li C, Wang J, Wei X, Li Y, Zhu Y, Zhang S. Threshold segmentation algorithm for automatic extraction of cerebral vessels from brain magnetic resonance angiography images. J. neuroscience methods. 2015;241:30–36. doi: 10.1016/j.jneumeth.2014.12.003. [DOI] [PubMed] [Google Scholar]
- [8].Kording F, Weidensteiner C, Zwick S, Osterberg N, Weyerbrock A, Staszewski O, Elverfeldt D, Reichardt W. Simultaneous assessment of vessel size index, relative blood volume, and vessel permeability in a mouse brain tumor model using a combined spin echo gradient echo echo-planar imaging sequence and viable tumor analysis. J. Magnetic Resonance Imaging. 2014;40(6):1310–1318. doi: 10.1002/jmri.24513. [DOI] [PubMed] [Google Scholar]
- [9].Boulanger J, Kervrann C, Bouthemy P, Elbau P, Sibarita JB, Salamero J. Patch-based nonlocal functional for denoising fluorescence microscopy image sequences. IEEE Transactions on Medical Imaging. 2010;29(2):442–454. doi: 10.1109/TMI.2009.2033991. [DOI] [PubMed] [Google Scholar]
- [10].Luisier F, Blu T, Unser M. Image denoising in mixed Poisson-Gaussian noise. IEEE Transactions on Image Processing. 2011;20(3):696–708. doi: 10.1109/TIP.2010.2073477. [DOI] [PubMed] [Google Scholar]
- [11].Carlton PM, Boulanger J, Kervrann C, Sibarita JB, Salamero J, Gordon-Messer S, Bressang D, Haberg JE, Haaseh S, Shaoa L, Winotoa L, Matsudaa A, Knera P, Uzawai S, Gustafssona M, Kamj Z, Agard DA, Sedat JW. Fast live simultaneous multi-wavelength four-dimensional optical microscopy. Proceedings of the National Academy of Sciences. 2010;107(37):16016–16022. doi: 10.1073/pnas.1004037107. [DOI] [PMC free article] [PubMed] [Google Scholar]
- [12].White JG, Amos WB, Fordham M. An evaluation of confocal versus conventional imaging of biological structures by fluorescence light microscopy. The Journal of cell biology. 1987;105(1):41–48. doi: 10.1083/jcb.105.1.41. [DOI] [PMC free article] [PubMed] [Google Scholar]
- [13].Olabarriaga SD, Smeulders AW. Interaction in the segmentation of medical images: A survey. J. Medical image analysis. 2001;5(2):127–142. doi: 10.1016/s1361-8415(00)00041-4. [DOI] [PubMed] [Google Scholar]
- [14].Kirbas C, Quek F. A review of vessel extraction techniques and algorithms. ACM Computing Surveys (CSUR) 2004;36(2):81–121. [Google Scholar]
- [15].Olabarriaga S, Breeuwer M, Niessen W. Minimum cost path algorithm for coronary artery central axis tracking in CT images. Med. Image Comput. Comput.-Assisted Intervention (MICCAI) 2003:687–694. [Google Scholar]
- [16].Chan TF, Vese LA. Active contours without edges. IEEE Transactions on Image Processing. 2001;10(2):266–277. doi: 10.1109/83.902291. [DOI] [PubMed] [Google Scholar]
- [17].Yan P, Kassim AA. MRA image segmentation with capillary active contours. Med. Image Anal. 2006;10(3):317–329. doi: 10.1016/j.media.2005.12.002. [DOI] [PubMed] [Google Scholar]
- [18].Qian X, Brennan MP, Dione DP, Dobrucki WL, Jackowski MP, Breuer CK, Sinusas AJ, Papademetris X. A non-parametric vessel detection method for complex vascular structures. Medical image analysis. 2009;13(1):49–61. doi: 10.1016/j.media.2008.05.005. [DOI] [PMC free article] [PubMed] [Google Scholar]
- [19].Mahadevan V, Narasimha-Iyer H, Roysam B, Tanenbaum HL. Robust model-based vasculature detection in noisy biomedical images. Information Technology in Biomedicine, IEEE Transactions on. 2004;8(3):360–375. doi: 10.1109/titb.2004.834410. [DOI] [PubMed] [Google Scholar]
- [20].Eiho S, Sekiguchi H, Sugimoto N, Hanakawa T, Urayama S. Branch-based region growing method for blood vessel segmentation; In Proceedings of International Society for Photogrammetry and Remote Sensing Congress; 2004.pp. 796–801. [Google Scholar]
- [21].Lee J, Beighley P, Ritman E, Smith N. Automatic segmentation of 3D micro-CT coronary vascular images. Medical image analysis. 2007;11(6):630–647. doi: 10.1016/j.media.2007.06.012. [DOI] [PubMed] [Google Scholar]
- [22].Friman O, Hindennach M, Peitgen HO. Template-based multiple hypotheses tracking of small vessels. Proc. IEEE Int. Symp. Biomed. Imaging. 2008:1047–1050. [Google Scholar]
- [23].Sofka M, Stewart CV. Retinal vessel centerline extraction using multiscale matched filters, confidence and edge measures. Medical Imaging, IEEE Transactions on. 2006;25(12):1531–1546. doi: 10.1109/tmi.2006.884190. [DOI] [PubMed] [Google Scholar]
- [24].Krissian K, Malandain G, Ayache N, Vaillant R, Trousset Y. Model-based detection of tubular structures in 3D images. Computer vision and image understanding. 2000;80(2):130–171. [Google Scholar]
- [25].Meijering E. Cell segmentation: 50 years down the road [life sciences] IEEE Signal Processing Magazine. 2012;29(5):140–145. [Google Scholar]
- [26].Zhu Y, Li F, Vadakkan TJ, Zhang M, Landua J, Wei W, Ma J, Dickinson ME, Rosen JM, Lewis MT, Zhan M, Wong ST. Three-dimensional vasculature reconstruction of tumour microenvironment via local clustering and classification. Interface focus. 2013;3(4):20130015. doi: 10.1098/rsfs.2013.0015. [DOI] [PMC free article] [PubMed] [Google Scholar]
- [27].Cao TTV. Nonhomogeneity Detection in CFAR Reference Windows Using the Mean-to-Mean Ratio Test (No. DSTO-TR-2608) Defence Science and Technology Organization; Edinburgh (Australia): 2012. [Google Scholar]
- [28].Deledalle C, Denis L, Tupin F. How to compare noisy patches? Patch similarity beyond Gaussian noise. International J. of Computer Vision, Springer Verlag (Germany) 2012;99(1):86–102. [Google Scholar]
- [29].Patidar P, Gupta M, Srivastava S, Nagawat AK. Image denoising by various filters for different noise. International Journal of Computer Applications. 2010:0975–8887. [Google Scholar]
- [30].Arias-Castro E, Donoho DL. Does median filtering truly preserve edges better than linear filtering? The Annals of Statistics. 2009:1172–1206. [Google Scholar]
- [31].Aylward SR, Bullitt E. Initialization, noise, singularities, and scale in height ridge traversal for tubular object centerline extraction. IEEE Transactions on Medical Imaging. 2002;21(2):61–75. doi: 10.1109/42.993126. [DOI] [PubMed] [Google Scholar]
- [32].Kanungo T, Mount DM, Netanyahu NS, Piatko CD, Silverman R, Wu AY. An effcient k-means clustering algorithm: Analysis and implementation. IEEE Transactions on Pattern Analysis and Machine Intelligence. 2002;24(7):881–892. [Google Scholar]
- [33].Almasi S, Xu X, Ben-Zvi A, Lacoste B, Gu C, Miller EL. A novel method for identifying a graph-based representation of 3-D microvascular networks from fluorescence microscopy image stacks. Medical image analysis. 2015;20(1):208–223. doi: 10.1016/j.media.2014.11.007. [DOI] [PMC free article] [PubMed] [Google Scholar]
- [34].Bindilatti A, Mascarenhas N. A Nonlocal Poisson Denoising Algorithm Based on Stochastic Distances. IEEE Signal Processing Letters. 2013;20(11):1010–1013. [Google Scholar]
- [35].Carson C, Belongie S, Greenspan H, Malik J. Blobworld: Image segmentation using expectation-maximization and its application to image querying. Pattern Analysis and Machine Intelligence, IEEE Transactions on. 2002;24(8):1026–1038. [Google Scholar]
- [36].Boykov YY, Jolly M. Interactive graph cuts for optimal boundary and region segmentation of objects in ND images; Eighth IEEE International Conference on Computer Vision, ICCV; 2001.pp. 105–112. [Google Scholar]
- [37].Piccardi M. Background subtraction techniques: a review. IEEE international conference on Systems, man and cybernetics. 2004;(4):3099–3104. [Google Scholar]


