Abstract
Bystander cells of the tumor microenvironment show evidence of DNA damage and inflammation that can lead to their oncogenic transformation. Mediator(s) of cell–cell communication that brings about these pro-oncogenic pathologies has not been identified. We show here that cell-free chromatin (cfCh) released from dying cancer cells are the key mediators that trigger both DNA damage and inflammation in the surrounding healthy cells. When dying human cancer cells were cultured along with NIH3T3 mouse fibroblast cells, numerous cfCh emerged from them and rapidly entered into nuclei of bystander NIH3T3 cells to integrate into their genomes. This led to activation of H2AX and inflammatory cytokines NFκB, IL-6, TNFα and IFNγ. Genomic integration of cfCh triggered global deregulation of transcription and upregulation of pathways related to phagocytosis, DNA damage and inflammation. None of these activities were observed when living cancer cells were co-cultivated with NIH3T3 cells. However, upon intravenous injection into mice, both dead and live cells were found to be active. Living cancer cells are known to undergo extensive cell death when injected intravenously, and we observed that cfCh emerging from both types of cells integrated into genomes of cells of distant organs and induced DNA damage and inflammation. γH2AX and NFκB were frequently co-expressed in the same cells suggesting that DNA damage and inflammation are closely linked pathologies. As concurrent DNA damage and inflammation is a potent stimulus for oncogenic transformation, our results suggest that cfCh from dying cancer cells can transform cells of the microenvironment both locally and in distant organs providing a novel mechanism of tumor invasion and metastasis. The afore-described pro-oncogenic pathologies could be abrogated by concurrent treatment with chromatin neutralizing/degrading agents suggesting therapeutic possibilities.
Introduction
Bystander effect is a phenomenon typically associated with ionizing radiation wherein non-targeted cells show evidence of heritable DNA damage and genomic instability.1 These effects are thought to result from damaging substances released from irradiated cells, as conditioned media of treated cells can induce damage in non-irradiated recipient cells.2 Cells of distant tissues also exhibit bystander or abscopal effects, which can have oncogenic consequences.3,4 Radio-sensitive mice have been reported to develop cancerous changes in the cerebellum following X-ray exposure to the body after the cranium is carefully shielded.5 Bystander effect is being increasingly recognized in relation to cancer. Non-cancerous cells of the tumor microenvironment show evidence of DNA damage response (DDR) in the form of positive staining for γ-H2AX and phospho-ATM.6 Bystander effect is not restricted to peri-tumoural cells alone, tumor-related DNA damage in cells of distant tissues have been reported in vivo.7,8 Mice bearing sub-cutaneous tumors show signs of DNA damage in several tissues, being most pronounced in proliferating cells.7 Inflammation is another long recognized component of the oncogenic process and an inflammatory microenvironment is evident in most cancers.9,10 The key features of the cancer-related inflammatory microenvironment include infiltration by lymphocytes and macrophages, presence of inflammatory cytokines and vascular endothelial growth factors involved in neo-vascularization and angiogenesis.11–13 Cancer is also associated with systemic inflammation similar to that observed in infections or inflammatory diseases.14–16 Cancer patients exhibit elevated serum levels of inflammatory cytokines and acute-phase proteins and alteration in peripheral blood count, gene expression patterns and erythrocyte sedimentation rates.14,17,18
Identification of agents responsible for inter-cellular communication that induce local and systemic bystander DNA damage and inflammation have remained elusive. We have recently reported that circulating cell-free chromatin (cfCh) isolated from serum of cancer patients can readily enter into nuclei of healthy cells to integrate into their genomes triggering DDR, dsDNA breaks and apoptosis both in vitro and in vivo.19–21 We hypothesized that cfCh that are released from dying cancer cells might similarly enter into bystander healthy cells of the tumor microenvironment and those of distant organs, activate DDR and damage their DNA. As dying cells are known to induce an inflammatory response in surrounding cells,22,23 we further hypothesized that cfCh from dying cancer cells might also be responsible for tumor-related inflammation in surrounding bystander cells. We show here that when dying cancer cells were co-cultivated with NIH3T3 cells or injected into mice, cfCh emerging from them readily entered into bystander cells and integrated into their genomes as detected by PCR and fluorescence in situ hybridization (FISH). Genomic integration induced dsDNA breaks, global transcriptional deregulation and intense upregulation of inflammatory cytokines. There is a large body of literature to show that DNA damage and inflammation act synergistically to drive the oncogenic process.11,24 Our results suggest that cfCh are the key agents that bring about both these inter-related pathologies in bystander cells of the tumor microenvironment and in those of distant tissues to create a pro-oncogenic milieu that could promote their cancerous transformation.
Results
Cellular uptake and nuclear accumulation of cfCh in vitro
BrdU-labeled dead Jurkat cells were co-cultivated with NIH3T3 cells and examined by confocal microscopy at 6 h. Numerous fluorescently labeled particles could be seen within the NIH3T3 cells, particularly within their nuclei (Figures 1a and b). Few intra-nuclear fluorescent particles were detectable when live Jurkat cells were used (Figures 1a and b). Nuclear uptake of fluorescent particles from dead Jurkat cells could be markedly inhibited (P<0.0001) by concurrent treatment with three chromatin neutralizing/degrading agents namely, anti-histone antibody complexed nanoparticles (CNPs), DNase I and resveratrol-copper (R-Cu) (Figures 1a and b). This finding that BrdU particles could be equally effectively eliminated by both anti-histone antibody CNPs as well as DNA-degrading agents indicated that BrdU particles were nothing other than chromatin fragments that contained both histones and DNA. Negative control experiments using the metabolic poison actinomycin D and those conducted at low temperature (31 °C) indicated that the uptake of cfCh from dead Jurkat cells was cellular energy dependent; there being significant reduction (P<0.0001) in uptake of fluorescently labeled cfCh under both these conditions (Supplementary Figure 1). A time-course analysis of uptake of fluorescent cfCh from dead Jurkat cells by nuclei of recipient NIH3T3 cells showed that nearly 100% of the cells had taken up cfCh by 3 h remaining elevated for the next 48 h followed by a sharp decline (Supplementary Figure 2).
Figure 1.
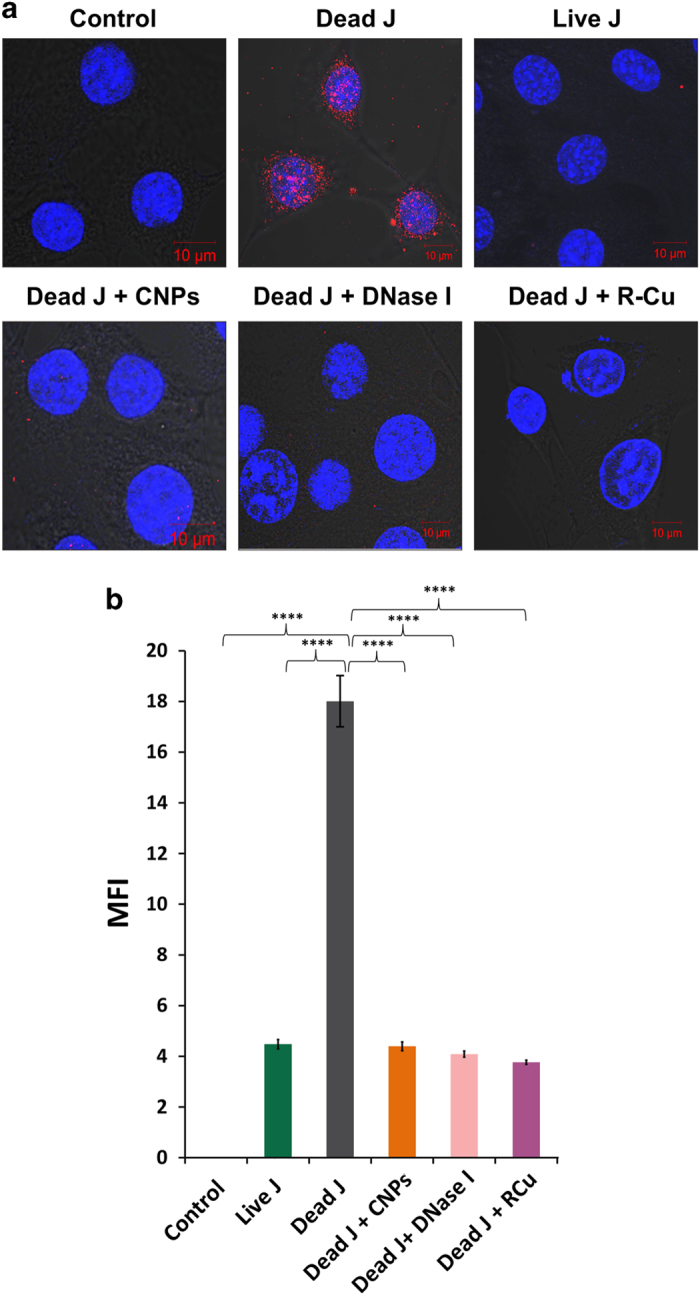
Cellular uptake and nuclear accumulation of cfCh and their prevention by chromatin neutralizing/degrading agents. (a) Representative laser scanning confocal microscopy images showing nuclear uptake of numerous fluorescent particles by NIH3T3 cells released from dead Jurkat cells pre-labeled with BrdU at 6 h. The uptake of cfCh is prevented by concurrent treatment with CNPs, DNase I and R-Cu. Few nuclear fluorescent signals are seen when live Jurkat cells were used. (b) Quantitative analysis of mean fluorescence intensity (MFI) of images given in a. Fifty nuclei were analyzed for quantifying MFI. Data were analyzed by Student’s t-test. ****P=0.0001. J, Jurkat cells.
Induction of bystander DDR and inflammation in vitro
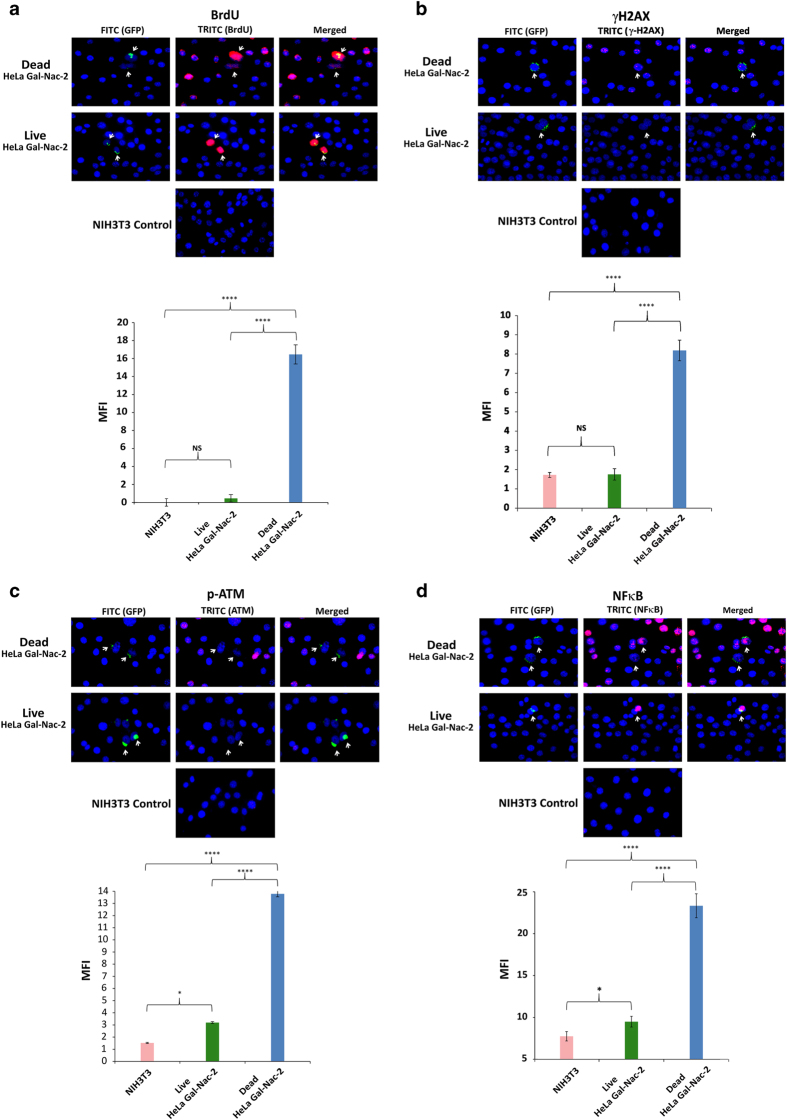
As it was our original hypothesis that cfCh might be responsible for bystander DNA damage and inflammation, we conducted experiments in which irradiated BrdU-labeled dying cells were co-cultivated with NIH3T3 cells at a ratio of 1 : 20. We used BrdU-labeled GalNAc-T2-GFP HeLa cells and irradiated them so that the cfCh-donor dead cells could be identified by virtue of their GFP green fluorescence. We clearly observed that BrdU-labeled cfCh particles that had emerged from irradiated GalNAc-T2-GFP HeLa cells had entered into nuclei of bystander living NIH3T3 cells (Figure 2a, upper panel). BrdU particles were not seen in the bystander cells when un-irradiated GalNAc-T2-GFP HeLa cells were used (Figure 2a, upper panel). Quantitative estimation of BrdU mean fluorescence intensity of control, irradiated and un-irradiated donor GalNAc-T2-GFP HeLa cells is given in Figure 2a lower panel, which clearly shows that BrdU particles are released from irradiated but not from un-irradiated cells. We also detected activation of H2AX and p-ATM in the bystander cells indicative of dsDNA breaks and DDR activation (Figures 2b and c). The latter were not seen when un-irradiated GalNAc-T2-GFP HeLa cells were co-cultured with NIH3T3 cells (Figures 2b and c). We further confirmed the activation of H2AX and p-ATM by western blot analysis. Supplementary Figure 3 clearly shows the presence of the expected γH2AX and p-ATM bands in case of irradiated GalNAc-T2-GFP HeLa cells but not in the case of un-irradiated HeLa cells. Bystander NIH3T3 cells also showed evidence of inflammation, which was confirmed by our detection of the pro-inflammatory transcription factor NFκB (Figure 2d). Evidence of apoptosis as indicated by active Caspase-3 expression in the bystander cells was also evident in the presence of irradiated GalNAc-T2-GFP HeLa cells but was absent when un-irradiated HeLa cells were used (Figure 2e).
Figure 2.
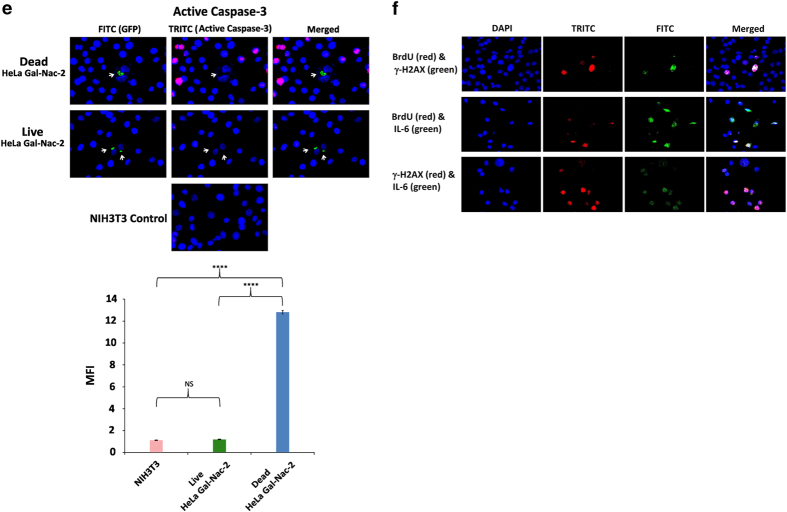
Bystander uptake of fluorescently labeled cfCh and activation of DNA damage and inflammation following co-cultivation of NIH3T3 cells with irradiated and un-irradiated GalNAc-T2-GFP HeLa cells. (a) Upper panel, fluorescent microscopy at 36 h showing uptake by bystander NIH3T3 cells of fluorescent cfCh particles released from BrdU pre-labeled dead, but not live, GalNAc-T2-GFP HeLa cells; lower panel, quantitative analysis of mean fluorescence intensity (MFI) of images given in upper panel. (b–e) Upper panels, fluorescent microscopy at 36 h showing activation of H2AX (b), p-ATM (c), NFκB (d) and active Caspase-3 (e) in bystander NIH3T3 cells. Lower panels, quantitative analysis of MFI of images given in upper panel. One thousand nuclei were gated and analyzed for quantifying MFI in each case. *P = 0.05; ****P = 0.0001; NS=Not Significant. Results (mean±S.E.) were analyzed by Student’s t-test. (f) Fluorescent microscopy of NIH3T3 cells co-cultivated with irradiated B16-F10 melanoma cells at 6 h showing BrdU and γ-H2AX co-expressing cells (upper panel); BrdU and IL-6 co-expressing cells (middle panel), and γ-H2AX and IL-6 co-expressing cells (lower panel).
Evidence that cfCh were directly responsible for DNA damage and inflammation in bystander cells is provided in Figure 2f in which NIH3T3 cells were co-cultivated with irradiated B16-F10 melanoma cells. We clearly observed co-localization of BrdU-labeled fluorescent cfCh signals with those of γH2AX (Figure 2f, upper panel) and IL-6 (Figure 2f, middle panel) confirming that cfCh were directly responsible for H2AX and IL-6 activation. Significantly, we also observed that γH2AX and IL-6 were often co-expressed by the same bystander cells (Figure 2f, lower panel) indicating that DNA damage and inflammation are closely linked pathologies that are concurrently activated. Further evidence of co-activation of DNA damage and inflammation is provided in Supplementary Figure 4 in which NIH3T3 cells were co-cultured with irradiated dying GalNAc-T2-GFP HeLa cells. It clearly shows co-localization of several fluorescent signals of γH2AX and NFκB as indicated by arrows.
Induction of bystander DDR and inflammation in vivo
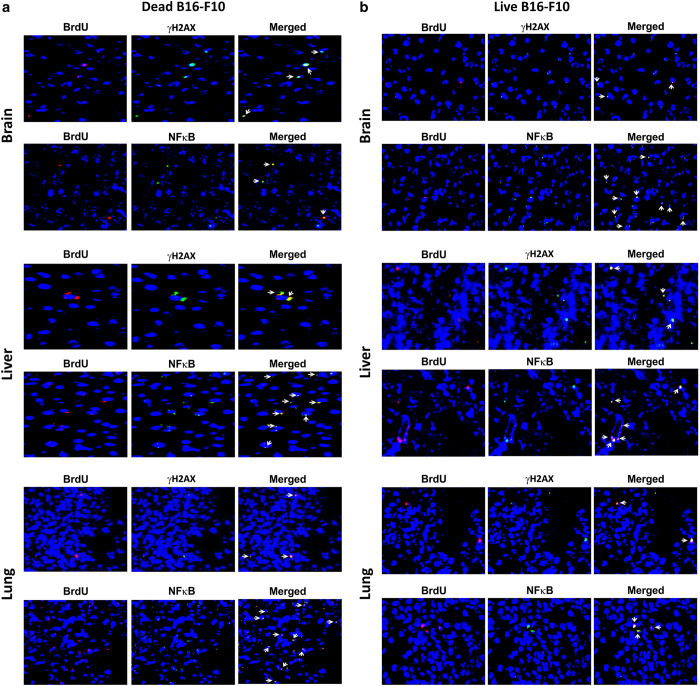
Upon intravenous injection into mice, dying cancer cells that reached distant organs could release cfCh and induce bystander DDR and inflammation in their cells. It is well-established that living cancer cells when injected intravenously undergo extensive cell death as a consequence of the shearing force of circulation.25,26 We used B16-F10 melanoma cells, rather than Jurkat cells, and injected them into isogenic C57/Bl6 mice. Jurkat cells were not used because it could be argued that Jurkat cells (human) might die when injected into mice, not because of shearing forces of circulation (and other factors), but because of an immune reaction mounted by the host due to cross-species incompatibility. As living B16-F10 melanoma cells are known to undergo extensive cell death upon intravenous injection,25 our hypothesis was that both dying and living B16-F10 cells would release cfCh particles into cells of the target organs upon reaching their respective destinations. Indeed, BrdU signals could be clearly detected in brain, lung and liver cell nuclei of injected mice indicating that cfCh from both dead and living B16-F10 melanoma cells had entered bystander cells of distant organs (Figures 3a and b, left hand panels). We also demonstrate activation of H2AX and NFκB in all three organs in case of both dying and living cells indicating activation of bystander DNA damage and inflammation (Figures 3a and b, middle panels). Significantly, BrdU fluorescent signals and those of γH2AX and NFκB often co-localized indicating that cfCh were directly responsible for activation of DNA damage and inflammation (Figures 3a and b, right hand panels). DAPI images of these organs from un-injected mice were given in Supplementary Figure 5.
Figure 3.
Detection of fluorescent signals in nuclei of cells of vital organs of mice following i.v. injection of dead and live B16-F10 cells pre-labeled with BrdU and activation of H2AX and NFκB. One hundred thousand BrdU pre-labeled dead and live B16-F10 cells were injected i.v. into mice and animals were killed after 72 h. (a, b) Detection of fluorescent BrdU signals (left hand panels) and activation of H2AX and NFκB (middle panels) in brain, liver and lung following i.v. injection of dead and live B16-F10 cells. It is noteworthy that BrdU signals frequently co-localize with fluorescent signals generated by H2AX and NFκB activation (right hand panels).
Finally, we observed, with respect to both dying (Figure 4, upper panel) and living cells (Figure 4, lower panel), that γH2AX and NFκB were co-expressed in the same cells of brain, liver and lung of mice. This is consistent with our in vitro findings that DNA damage and inflammation are closely linked pathologies and are activated through yet unidentified common pathway(s).
Figure 4.
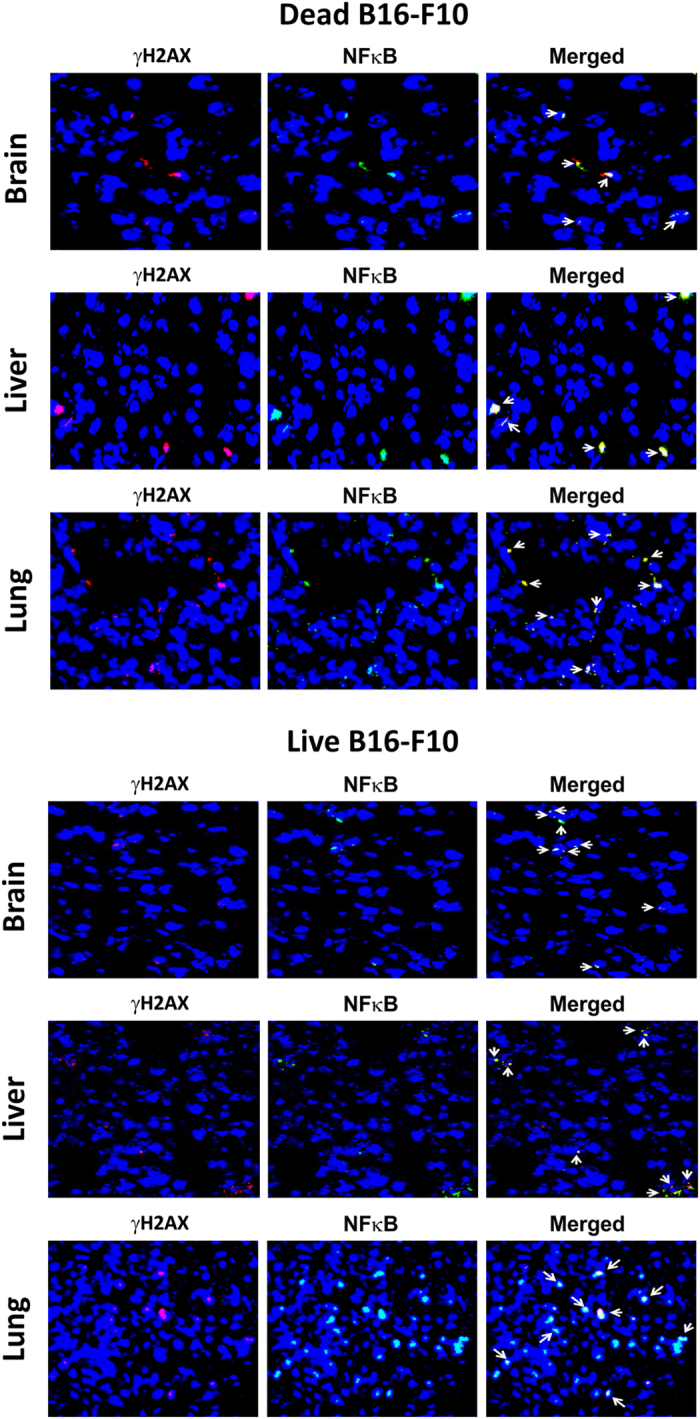
Co-localization of γH2AX and NFκB fluorescent signals in vital organs of mice following intravenous injection of dead (upper panels) and live (lower panels) B16-F10 cells. One hundred thousand dead and live B16-F10 cells were injected i.v. into mice and animals were killed after 72 h.
We undertook further control experiments in which we injected free BrdU alone to investigate whether BrdU itself could be responsible for the above findings. We arbitrarily injected into mice the same concentration of BrdU that we normally use for labeling cultured cells in vitro (13 μM) equated for blood volume of mice (5 ml). This dose is likely to be several orders of magnitude higher than the BrdU label contained in cfCh particles when dead or live B16-F10 melanoma cells were injected. Therefore, we also injected in the same experiments BrdU-labeled live and dead B16-F10 melanoma cells as comparators (Supplementary Figure 6A). The number of fluorescent signals following free BrdU injection was significantly lower compared to those observed following injection of fluorescently BrdU-labeled dead and live cancer cells indicating that BrdU signals in cells of distant organs were largely due to integration of labeled cfCh particles in their constituent cells. Free BrdU administration also failed to activate H2AX and NFκB in the three vital organs examined namely, brain, liver and lung (Supplementary Figure 6B).
Detection of transcriptional deregulation by microarray
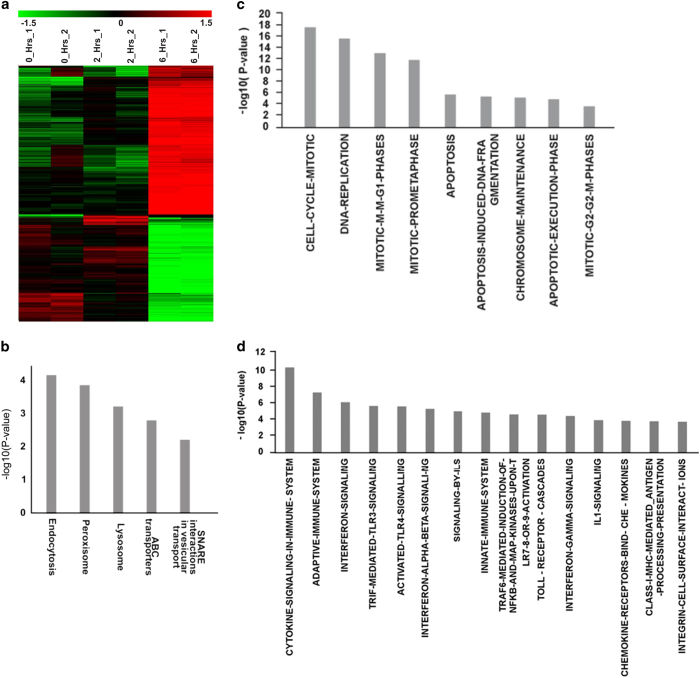
We next performed microarray analysis of NIH3T3 cells that had been co-cultivated with dead Jurkat cells at 0, 2 and 6 h. A heat map given in Figure 5a shows that nuclear entry of cfCh had triggered genome-wide transcriptional alterations of NIH3T3 cells after 2 and 6 h. Class comparison between NIH3T3_control (0 h) and NIH3T3+dead Jurkat_2 h resulted in 19 deregulated genes, which suggests that there was minimal transcriptional activation at this time point. However, at 6 h, 817 genes were found to be deregulated when compared to NIH3T3_control (0 h); while a comparison between NIH3T3+dead Jurkat at 2 versus 6 h revealed 777 deregulated genes (Figure 5a). When individual class comparison gene lists were combined to make a single gene list, which was representative of genes deregulated in at least one time point, a total of 1004 genes were found to be deregulated (Supplementary Table 2). Analysis of NIH3T3 cells co-cultivated with dead Jurkat cells at 6 h revealed upregulation of several pathways related to phagocytosis; cell cycle/DNA damage and inflammation (Figures 5b–d). The list of genes involved in these pathways is given in Supplementary Table 3.
Figure 5.
Microarray and pathway analysis of NIH3T3 cells treated with dead Jurkat cells. (a) Heat map of significantly differentially expressed genes in NIH3T3 cells treated with dead Jurkat cells at 0, 2 and 6 h in duplicates. Time points are shown in columns and differentially expressed genes in rows. They were grouped together based on the hierarchical clustering method. Red signifies upregulation status, whereas green signifies downregulation. Black color depicts no change in expression. Scale of heat map shown on the top of the figure. (b–d) Pathway analysis at 6 h showing upregulation of pathways associated with phagocytosis; cell cycle/DNA damage and inflammation, respectively.
Activation of DDR
In vitro experiments
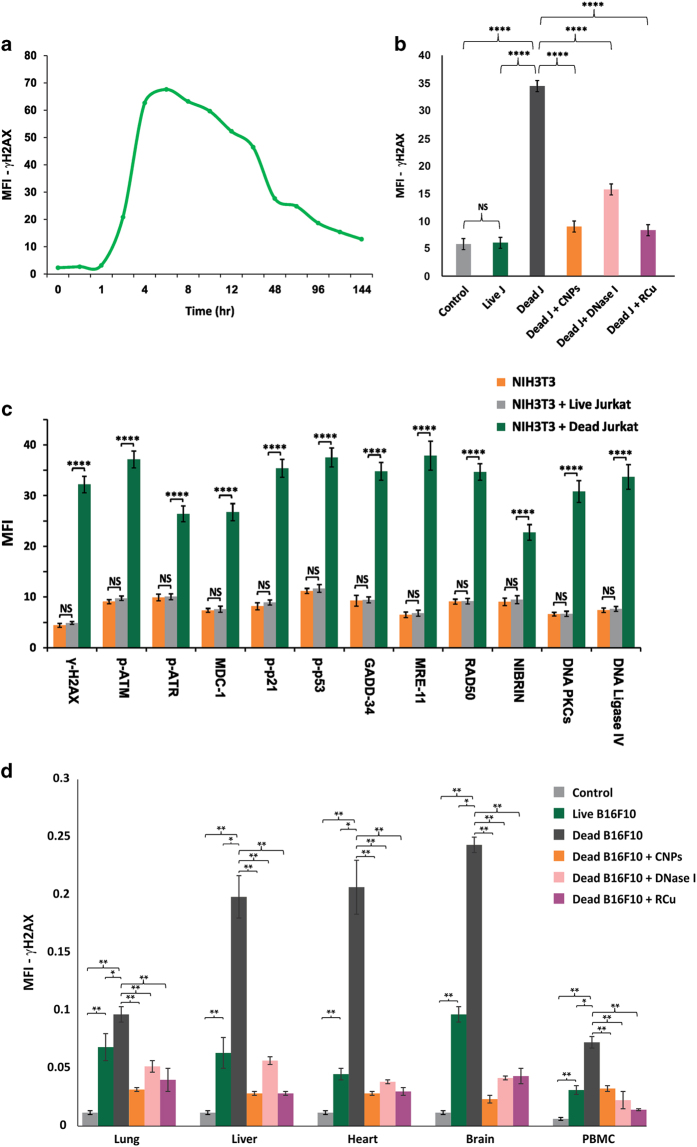
In order to investigate whether microarray results translated into activation of DDR proteins, we initially performed a time-course analysis of dynamics of DDR activation following co-cultivation of NIH3T3 cells with dead Jurkat cells using γ-H2AX as an end point. We detected upregulation of H2AX, which was maximally seen at 6 h and declined gradually thereafter but did not reach baseline levels even after 144 h (Figure 6a). We show that H2AX activation could be highly significantly inhibited (P<0.0001) in the presence of cfCh degrading/neutralizing agents namely, CNPs, DNase I and R-Cu indicating that cfCh was directly responsible for H2AX activation (Figure 6b; Supplementary Figure 7). H2AX activation was also not seen when live Jurkat cells were used in these co-cultivation experiments (Figure 6b; Supplementary Figure 7). Having ascertained the dynamics of H2AX activation that peaked at 6 h, we looked for expression of other DDR pathway proteins at 6 h that included ATM, ATR, MDC1, p-p53, p-p21, GADD34, Nibrin, Rad50, Mre11, as well as those involved in DNA repair by non-homologous end joining, namely, DNA-PKcs, DNA ligase IV. All the above DDR-related proteins were highly significantly activated (P<0.01 to P<0.0001) in NIH3T3 cells following co-cultivation with dead Jurkat cells (Figure 6c; Supplementary Figure 8). Co-cultivation of NIH3T3 cells with live Jurkat cells failed to activate DDR proteins (Figure 6c; Supplementary Figure 8).
Figure 6.
Activation of DDR in vitro and in vivo and its inhibition by chromatin neutralizing/degrading agents. (a) Time course of activation of H2AX in NIH3T3 cells following co-cultivation with dead Jurkat cells as detected by indirect immunofluorescence. The experiment was done in duplicate at each time point and 100 cells were analyzed in each case and the average mean fluorescence intensity (MFI) values are depicted in the graph. (b) Prevention of H2AX activation in NIH3T3 cells by CNPs, DNase I and R-Cu following co-cultivation with dead Jurkat cells at 6 h. The experiment was done in duplicate and 500 cells were analyzed in each case for calculating MFI. The histograms depict mean (±S.E.) values in each case. Results were analysed by Student’s t-test. ****P<0.0001. Note that live Jurkat cells do not activate H2AX. (c) Activation of various DDR and DNA repair proteins following co-cultivation of NIH3T3 cells with dead and live Jurkat cells at 6 h as detected by indirect immunofluorescence. The experiments were done in duplicate and 500 cells were analyzed for calculating MFI. The histograms depict mean (±S.E.) values in each case; results were analyzed by Student’s t-test. ****P<0.0001. (d) Activation of H2AX in vital organs and PBMCs following i.v. injection of dead and live B16-F10 cells into mice and their prevention by CNPs, DNase I and R-Cu. One hundred thousand B16-F10 cells were injected i.v. and animals killed after 24 h. The experiments were done in duplicate and 1000 cells were analyzed in each case for calculating MFI. The histograms depict mean (±S.E.) values in each case; results were analyzed by Student’s t-test. *P<0.05, **P<0.01.
In vivo experiments
We next examined if cfCh emanating from dead and live B16-F10 cells could activate systemic DDR in vital organs when injected intravenously into mice. We clearly found marked elevation of H2AX activation following injection of dead B16-F10 cells, which could be dramatically inhibited when animals were concurrently treated with cfCh degrading/neutralizing agents namely, CNPs, DNase I and R-Cu (Figure 6d; Supplementary Figure 9). Significantly, although live cells had failed to activate DDR in vitro, they were capable of activating H2AX in vivo, albeit to a significantly lesser extent, than that by dead B16-F10 cells (Figure 6d). This finding again indicated that cancer cells undergo extensive cell death following intravenous injection into mice. 25,26
Genomic integration of cfCh
As we had earlier proposed that activation of DDR by chromatin fragments isolated from serum of cancer patients was a critical factor in facilitating their genomic integration,19 we investigated whether cfCh that had emerged from dead Jurkat cells and had activated DDR in bystander NIH3T3 cells could integrate into their genomes?
FISH analysis
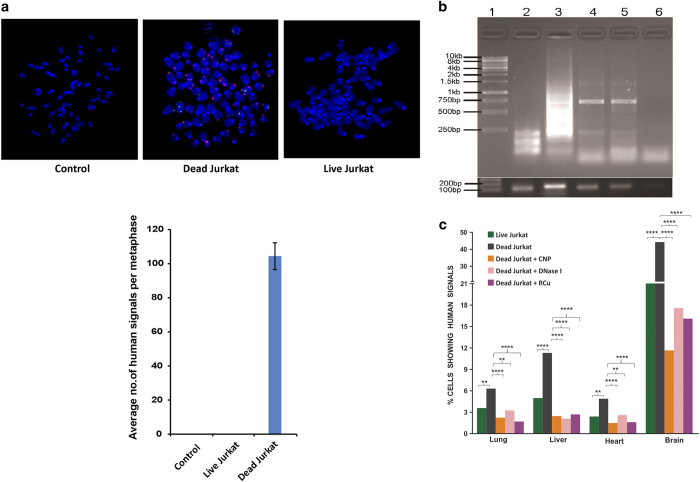
NIH3T3 cells co-cultivated with dead and live Jurkat cells were allowed to grow and metaphase spreads were prepared from them at tenth passage. FISH analysis on the metaphase preparations using human whole-genomic probes detected abundant positive signals indicating that human DNA from dead Jurkat cells had incorporated themselves into the genomes of NIH3T3 cells (Figure 7a, upper panel). We did not detect any FISH signals in metaphase spreads prepared from NIH3T3 cells co-cultivated with live Jurkat cells. A quantitative estimation of number of human signals per metaphase is shown (Figure 7a, lower panel).
Figure 7.
Genomic integration of cfCh in vitro and in vivo analyzed by FISH and PCR. (a) Representative FISH images showing presence of abundant human whole-genomic signals in metaphase spreads prepared from NIH3T3 cells co-cultivated with dead Jurkat cells at tenth passage (upper panel). No signals were detected when live Jurkat cells were similarly used. The human whole-genomic probe used did not cross react with mouse DNA. Quantitative analysis of number of human signals per metaphase (lower panel). Thirty metaphases were analyzed in each case. The figure represents mean values (±S.E.). (b) Gel image of PCR-amplified products showing human pan Alu elements in clones E7 and B10. Upper panel, lane 1: 1 kb ladder; lane 2: NIH3T3 cells (negative control); lane 3: human DOK cells (positive control); lane 4 and 5: E7 and B10 clones (respectively); lane 6: no template control. Lower panel, input control PCR, mouse β-ACTIN (104 bp) and human HER2 gene (136 bp) were amplified in mouse NIH3T3 clones and human DOK cells, respectively. (c) Detection of human DNA signals by FISH in vital organs of mice following i.v. injection of dead and live Jurkat cells and their prevention by concurrent treatment with CNPs, DNase I and R-Cu. One hundred thousand Jurkat cells were injected i.v. and animals killed after 7 days. Two animals were used in each case and 500 nuclei were examined for each organ. Percent cells showing human signals were recorded and mean values were compared by Χ 2-test. **P<0.01, ****P<0.0001. The human whole-genomic probe used did not cross react with mouse DNA.
Detection of human Alu elements
In order to confirm our results obtained with FISH, we looked for presence of human Alu sequences in two single-cell clones (E7 and B10) developed from NIH3T3 cells that had been co-cultivated with dead Jurkat cells using bioinformatics analysis. A total of 121 human Alu elements represented by 8 unique human Alu families in E7, and a total of 88 human Alu elements represented by 7 unique human Alu families in B10 were detected (Supplementary Table 4). We validated our results with PCR using pan Alu consensus primers, and found amplified fragments ranging from 250 bp to 1 kb with a prominent band ~750 bp in size (Figure 7b). These bands were not amplified in genomic DNA extracted from NIH3T3 cells (negative control). As expected, and consistent with earlier reports,27 pan Alu primers generated a smear in the human DOK cells (lane 3; positive control). Mouse β-ACTIN and human HER2 gene were used as input controls for mouse and human genomic DNA, respectively (Figure 7b, lower panel).
Genomic integration of cfCh in vivo
We next examined if cfCh released from intravenously injected cancer cells could integrate into genome of vital organs of mice. Both dead and live Jurkat cells were intravenously injected into Balb/C mice, which were killed on day 7. FISH analysis using human-specific whole-genomic and pan-centromeric probes detected many human DNA signals in nuclei of vital organs of mice injected with both dead and live Jurkat cells (Figure 7c; Supplementary Figures 10A and B). However, the number of human signals detected in case of injected dead cells was significantly higher than those detected with respect to injection of live cells (Figure 7c). These data again suggest that live cancer cells undergo cell death following intravenous injection and release cfCh that have the ability to integrate into genomes of target organs. Once again, we show that concurrent injection of cfCh degrading/neutralizing agents namely, CNPs, DNase I and R-Cu significantly reduce the number of human signals detected (P<0.01 to P<0.0001; Figure 7c).
Activation of inflammation
In vitro studies
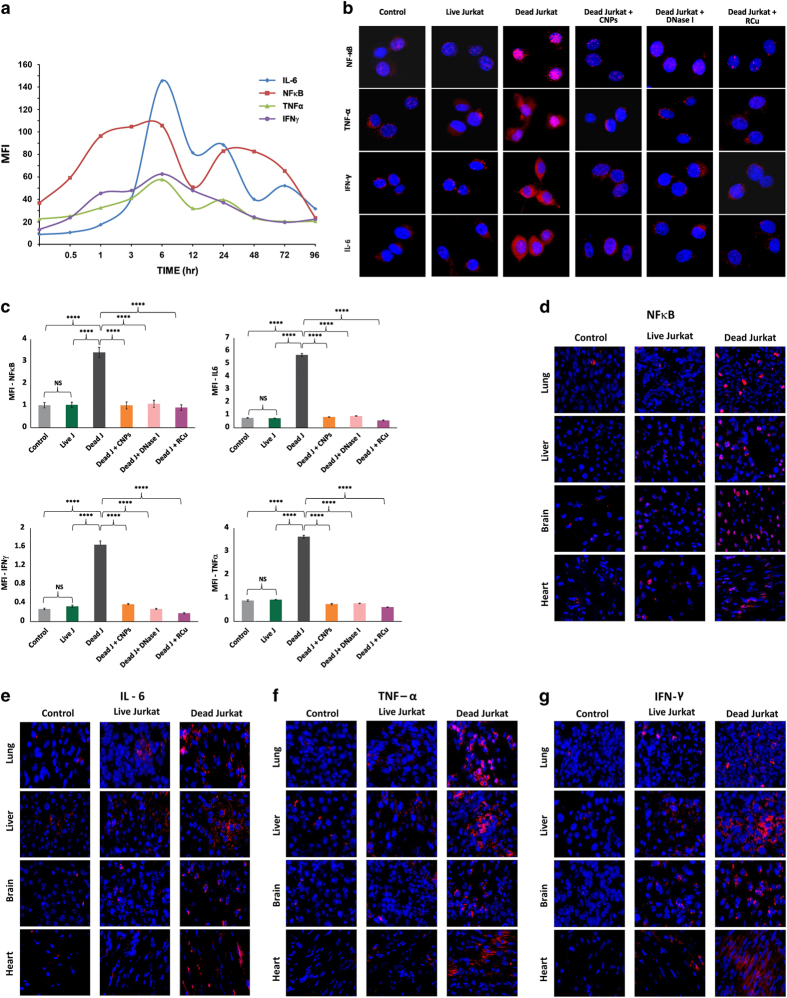
In order to investigate whether microarray results using Jurkat cells that showed upregulation of inflammatory pathways translated into activation of pro-inflammatory cytokines, we initially performed a time-course analysis to examine the induction of NFκB, IL-6, TNFα and IFNγ in NIH3T3 that were co-cultivated with dead Jurkat cells (Figure 8a). We detected upregulation of all four cytokines albeit with different kinetics for up to 96 h; in general, maximal activation was seen at around 6 h for all four cytokines (Figure 8a). We chose this time point (6 h) to examine if cfCh degrading/neutralizing agents namely, CNPs, DNase I and R-Cu would inhibit their activation. Figure 8b clearly shows that all three agents were highly effective in preventing upregulation of NFκB, IL-6, TNFα and IFNγ in NIH3T3 cells co-cultivated with dead Jurkat cells (P<0.0001). Co-cultivation of live Jurkat cells failed to activate inflammatory cytokines (Figure 8b). These findings are quantitatively depicted in Figure 8c.
Figure 8.
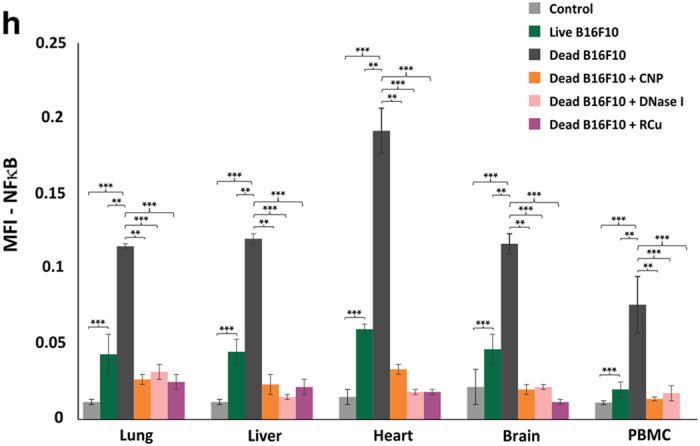
Activation of inflammation in vitro and in vivo and its prevention by chromatin neutralizing/degrading agents. (a) Time-course analysis of activation of inflammatory cytokines following co-cultivation of NIH3T3 cells with dead Jurkat cells as detected by indirect immunofluorescence. The experiments were done in duplicates at each time point and the mean values were plotted in the graph. (b) Representative images showing activation of inflammatory cytokines in NIH3T3 cells following co-cultivation with dead and live Jurkat cells with NIH3T3 cells at 6 h and their prevention by CNPs, DNase I and R-Cu. (c) Quantitative analysis of images shown in b. Activation of NFκB (left upper panel), IL-6 (right upper panel), IFNγ (left lower panel) and TNFα (right lower panel). The experiments were done in duplicate and 500 cells were analyzed in each case to determine mean fluorescence intensity (MFI). Mean (±S.E.) values are depicted in the histograms and the results were compared by Student’s t-test. ****P<0.0001. (d–g) Representative images showing activation of inflammatory cytokines at 72 h in vital organs of mice following intravenous injection of dead and live Jurkat cells (1×10⁵) as detected by indirect immunofluorescence. (h) Quantitative analysis of expression of NFκB following intravenous injection of dead and live B16-F10 cells (1×10⁵) and their prevention by CNPs, DNase I and R-Cu. The experiment was done in duplicate and 1000 cells were analyzed in each case to determine MFI. Mean (±S.E.) values are depicted in the histograms and the results were compared by Student’s t-test. **P<0.01, ***P<0.001.
In vivo studies
When injected intravenously, dead Jurkat cells induced an intense inflammatory response involving NFκB, IL-6, TNFα and IFNγ in lung, liver, brain and heart of mice at 72 h (Figures 8d–g). Injection of live Jurkat cells also activated the above cytokines albeit to a lesser degree (Figures 8d–g). We next conducted experiments using dead and live B16-F10 melanoma cells and observed similar systemic activation of inflammatory cytokines (Supplementary Figure 11). Quantitative analysis given in Figure 8h shows that the three chromatin neutralizing/degrading agents dramatically inhibited this inflammatory reaction in all organs examined as well as in PBMCs. The figure also shows that live B16-F10 cells were capable of activating NFκB but to a lesser degree.
Discussion
Transfer of DNA from dead cells in co-cultivation experiments have been reported previously.28–30 Bergsmedh et al. observed that apoptotic bodies that were released from H-ras(V12) and human c-myc-transfected rat fibroblasts were phagocytosed by p53−/p53− mouse cells and FISH could detect presence of rat or rat–mouse fusion chromosomes in their nuclei. Genomic integration of phagocytosed DNA led to oncogenic transformation of p53−/p53− mouse cells.28 Although induction of DNA damage and inflammation was not investigated in this study, we show here that genomic integration of cfCh released by dying cancer cells can directly trigger both DDR and inflammation in the bystander healthy cells both in vitro and in vivo, which can potentially lead to their oncogenic transformation (Figures 2f, 3a and b). We also show that DDR and inflammation are closely linked pathologies and are concurrently activated, and co-expressed by the same bystander cells both in vitro and in vivo thereby creating within them an intracellular milieu that is pro-oncogenic (Figure 2f, middle and lower panels, Figure 4; Supplementary Figure 4). Our results also highlight the rapidity and extent to which cfCh can infiltrate bystander cells; near maximal uptake of cfCh could be achieved as early as 1 h and innumerable cfCh particles could be seen entering their nuclei (Supplementary Figure 2). Nuclear accumulation of cfCh was followed by their genomic integration in host cells as detected by FISH and the presence of multiple unique human Alu elements in the recipient cells (Figures 7a–c). Genomic integration of cfCh resulted in genome-wide deregulation of transcription involving 1004 genes (Figure 5a; Supplementary Table 2) including upregulation of multiple pathways related to phagocytosis, DNA damage and inflammation (Figures 5b–d; Supplementary Table 3). Surprisingly, while live cancer cells when co-cultivated with NIH3T3 cells in vitro did not release cfCh (Figures 1a and b), and consequently did not activate DDR and inflammation in the bystander cells (Figures 6b, c and 8b, c), when injected intravenously into mice, live cancer cells underwent active cell death and released cfCh into bystander cells of distant target organs to induce γH2AX and NFκB, IL-6, IFNγ and TNFα (Figure 6d, 8d–h; Supplementary Figures 9). When injected in vivo, the incoming cfCh from both dead and live cells integrated themselves into genomes of cells of target organs, which was detectable by FISH (Figure 7c). In this regard, injected live cells behaved in a manner similar to dead cells having undergone apoptosis upon reaching distant target organs. Both dead and live cells exhibited co-localization of γH2AX and NFκB in the same bystander cells of brain, liver and lung when injected in vivo suggesting the creation of a pre-cancerous milieu in such cells (Figure 4).
DNA damage and inflammation are hallmarks of cancer and act synergistically to drive the oncogenic process.11,31 It has been proposed that DNA damage-induced mutations and genomic instability acting in tandem with inflammation can orchestrate a ‘perfect storm’ in the microenvironment of a tumor, which can lead to oncogenic transformation of the resident bystander cells.9 Our results show that cfCh from dead cancer cells are responsible for both DNA damage and inflammation, and that they are often co-activated in the same cells suggesting that such cells have a high potential for oncogenic transformation. Thus cfCh released from dying cancer cells may recruit bystander cells of the microenvironment into the oncogenic process thereby promoting local tumor invasion. cfCh may also play a key role in cancer metastasis as many circulating tumor cells (CTCs) are apoptotic in nature,32,33 which may lodge in distant organs to induce bystander oncogenesis in target cells thereby generating new cancers in host tissues that could masquerade as metastasis. Supportive evidence that dead CTCs might be involved in metastasis comes from ‘surprising’ observations that patients with breast cancer whose CTCs are enriched in apoptotic cells have a particularly poor prognosis,33 and in patients with colorectal cancer, apoptotic CTCs are associated with liver metastasis.34 It has been further suggested that different forms of cancer treatment namely, surgery, radiotherapy and chemotherapy could all mobilize CTCs into circulation thereby promoting metastatic spread of cancer.35 Our observation that cfCh degrading/neutralizing agents namely, CNPs, DNase I and R-Cu can abrogate bystander DNA damage and inflammation both in vitro and in vivo suggests therapeutic possibilities to prevent local and systemic spread of cancer.
Materials and methods
Cell lines and induction of cell death
We used three different cancer cell lines: B16-F10 (mouse melanoma), Jurkat (human lymphoblastic leukemia) and HeLa (human cervical cancer). The HeLa cells stably express a GFP fusion to the Golgi protein N-acetylgalactosaminyltransferase-2 (GalNAc-T2-GFP).36 The normal cell line used was NIH3T3 (mouse fibroblast). The sources and their culture conditions are given in Supplementary Table 1.
NIH3T3 cells were seeded at a density of 6×10⁴ cells in 35 mm3 culture dishes in 1.5 ml of DMEM+bovine calf serum (10%); after 16 h (cell count ~10×104), dead donor cells were usually added to them in a ratio of 1 : 1 unless specified otherwise. Cell death was induced in B16-F10 and Jurkat cells by treating them with adriamycin (5 μg/ml for 48 h) (Pfizer Products India Pvt. Ltd., Mumbai, India) or activated anti-Fas ligand (6 μg/ml for 24 h) (Millipore, Temecula, CA, USA; Catalog No. 05-201). Cell death was confirmed when >95% of the population was excluded by Trypan blue dye assay. After specified time periods the dead cells were collected, washed three times in 5 ml phosphate buffered saline (PBS) by centrifugation (600×g for 5 min) and the number of dead cells in the pellets was counted. Cell death in GalNAc-T2-GFP HeLa cells was induced by administering radiation from a Cobalt source (15 Gy). We also used live B16-F10, Jurkat and GalNAc-T2-GFP HeLa cells in control experiments. They were similarly washed, centrifuged and the cell pellets were used in co-cultivation experiments.
Co-cultivation experiments
Two different co-cultivation experiments were performed.
Co-cultivation of NIH3T3 cells with dead and live Jurkat cells: Jurkat cells (5×10⁶) were labeled with 13 μM BrdU (Sigma Chemicals, St Louis, MD, USA; Catalog No. B5002-100MG) for 24 h and induced to undergo cell death by treatment with anti-FAS ligand (24 h) or adriamycin as described above. Dead Jurkat cells were co-cultivated with NIH3T3 cells in a ratio of 1 : 1 in 35 mm3 petri dishes for specified time periods. Cells were thoroughly washed and processed for confocal microscopy, fluorescence microscopy or microarray analysis.
Co-cultivation of NIH3T3 cells with dead and live GalNAc-T2-GFP HeLa cells: GalNAc-T2-GFP HeLa cells were labeled with BrdU (25 μM for 36 h), washed, trypsinzed and seeded at a density of 5×10³ on cover slips in 35 mm3 petri dishes for 12 h allowing cells to attach to the cover slips. To induce cell death, they were administered ionizing radiation (15 Gy) and were immediately overlaid with 1×10⁵ NIH3T3 cells (1 : 20) and cultured for 36 h. Cells were thoroughly washed and processed for fluorescent microscopy for detection of BrdU signals and activation of H2AX, p-ATM, NFκB and active Caspase-3 in bystander NIH3T3 cells.
In vivo experiments
C57/BL6 mice (6–8 weeks old weighing ~20 g) obtained from and housed in the Institute Animal House Facility. The protocol for the experiment was approved by the Institutional Animal Ethics Committee (IAEC) of the Institute. Mice were intravenously injected with dead or live BrdU-labeled B16-F10 melanoma or Jurkat cells (10×104) and were killed after 24 or 72 h as specified by cervical dislocation and their vital organs and PBMCs removed, and processed for detection of fluorescent BrdU signals and activation of H2AX, NFκB, IL-6, TNFα and IFNγ. Control mice received saline injection. In some experiments, free BrdU was injected into mice in the same concentration that we normally use for labeling cultured cells in vitro (13 μM) after equating for blood volume of mice (5 ml).
Confocal microscopy
Co-cultivation of NIH3T3 cells with BrdU-labeled dead and live Jurkat cells
NIH3T3 cells grown on cover slips were co-cultivated with BrdU pre-labeled dead and live Jurkat cells in a ratio of 1 : 1. In some experiments chromatin neutralizing/degrading agents namely, CNPs, DNase I and R-Cu was added to the co-culture of dead Jurkat cells with NIH3T3 cells. The cover slips were collected at various time points as specified, washed in PBS, fixed with 4% paraformaldehyde for 30 min, washed thrice with PBS, treated with 0.02% Triton-X 100 for 30 min. This was followed by treatment with 2 M HCl for 1 h and washing three times with PBS and glycine. Cells were then treated with 3% BSA for 1 h and immuno-stained with anti-BrdU antibody (1 : 100 dilution) (Abcam, Cambridge, MA, USA; Catalog No. ab6326) overnight at 4 °C. Dylight-550 was used as secondary antibody (1 : 500 dilution) (Abcam, Catalog No. ab98387) for 1 h, mounted onto clean glass slides with Vecta-shield and stained with DAPI. The stained nuclei were visualized using Zeiss differential laser scanning confocal microscopy platform. Fifty nuclei were randomly chosen for analysis and the mean nuclear fluorescence intensity was measured using LSM Image Examiner 4.0 software (Carl Zeiss Jena GmbH, Oberkochen, Germany).
Microarray analysis
NIH3T3 cells were co-cultivated with dead Jurkat cells and microarray analysis performed as described below.
Data filtering using statistical parameters
Expression array hybridization using the Agilent labeling kit (Agilent’s Quick-Amp labeling Kit 5190-0442, Agilent Technologies, Santa Clara, CA, USA), Agilent hybridization kit (5188-5242, Agilent Technologies) and mouse GXP_8X60K slides were carried out by Genotypic Technology Private Ltd, Bengaluru, India according to the manufacturer’s protocol. Agilent Feature extraction software (Agilent Technologies) was used to extract raw data from image files followed by essential quality control steps. The data structure comprises of three samples in duplicates: NIH3T3_Control_(0 h), NIH3T3+dead Jurkat_(2 h) and NIH3T3+dead Jurkat_(6 h). All the pre-processing steps (background correction, normalization, probe filtration, etc) of the gene expression data were carried out using Agi4x44PreProcess Bioconductor package in R. For background correction and normalization between arrays, ‘backgroundCorrect (half)’ and ‘normalizeBetweenArrays (quantile)’ functions from the limma package were, respectively, used. To check variability across samples all data were log transformed and median centered. To exclude non-differential genes and to limit analysis only for significantly differential genes, class comparison was carried out between all possible groups using BRB array software.37 Class comparison between groups of arrays was based on univariate parametric test and inclusion of genes was based on P-values <0.05. Heat maps were generated using MeV software v4.9.0.38 GSEA analysis39 using KEGG gene set (http://www.genome.jp/kegg/pathway.html) was performed to identify underlying biological processes and pathways. This open source web-based tool uses a database of biological information curated from the literature.
Detection of DDR and inflammatory cytokines by indirect immunofluorescence
In vitro studies
NIH3T3 cells were co-cultivated with dead and live Jurkat cells for 6 h as described earlier. Methodology for detection of activated H2AX and other DDR proteins by indirect immunofluorescence including sources of reagents have been described by us earlier. 19 Activation of inflammatory cytokines was similarly analyzed by indirect immunofluorescence using specific antibodies after 6 h of co-cultivation. The antibodies used and their sources are given in Supplementary Table 5. Nuclear fluorescence of NFκB and cell-associated fluorescence of IL-6, TNFα, IFNγ were quantified using Image J Software (Wayne Rasband, National Institute of Mental Health, Bethesda, MD, USA). Experiments were done three times in duplicates; 500 cells were analyzed in each case and the mean of the three experiments was determined.
In vivo studies
C57/BL6 mice (6–8 weeks old weighing ~20 g) were injected intravenously with dead and live Jurkat or B16-F10 cells (10×104) as specified in 100 μl of saline; control mice were injected with saline alone. Two mice were used for treatment in each group. Animals were killed for collection of blood and removal of vital organs after 24 or 72 h as specified. The cryosections were processed for immunofluorescence for γH2AX was as described by us earlier,19 whereas induction of inflammatory cytokines was detected by indirect immunofluorescence as described above. For quantification of NFκB activation, at least 1000 cells were analyzed from 10 randomly chosen fields for each tissue for each mouse and 100 nuclei per animal were analyzed in case of PBMCs. The average number of nuclei exhibiting positive fluorescence was recorded using Image J software and the percentage figures calculated.
Experiments using cfCh degrading/neutralizing agents
Pullulan-histone antibody nanoconjugates (CNPs) were synthesized as described in our recent publication using H4 IgG.19,40 CNPs have been shown to specifically bind to chromatin fragments and inactivate them both in vitro and in vivo. In vitro experiments were performed on cells grown at a density of 10×104 and co-cultivated with dead Jurkat cells for 6 h (unless specified otherwise) in the presence or absence of CNPs (5 μg H4 IgG/ml). The treated cells were analyzed with respect to various parameters as described in the text. In vivo experiments were conducted by injecting mice intravenously with a single dose of dead cells (10×104 cells) through tail vein with and without concurrent injection of CNPs (50 μg H4 IgG/mouse i.p.). Treatment with CNPs was started 4 h prior to the administration of dead cells; and every 24 h thereafter. Animals were killed at specified times and their vital organs, namely, heart, lung, liver, brain as well as PBMCs were removed for analysis of different parameters as mentioned above.
DNase I
Bovine pancreatic DNase I was obtained from Sigma Aldrich (St Louis, MO, USA) (Catalog No. DN25-1G). About 0.05U of DNase I per 1.5 ml of culture media was used for in vitro experiments. Fifteen mg/kg of DNase I was administered i.p. in vivo experiments. The treatment of DNase I was started 4 h prior to administration of dead cells and every 12 h thereafter.
Resveratrol–copper
R is a widely investigated plant polyphenol with antioxidant properties.41 However, R acts as a pro-oxidant in the presence of Cu by its ability to reduce Cu (II) to Cu (I) thereby generating a free radical.42 R-Cu has been shown to be capable of cleaving plasmid DNA via this pro-oxidant property.43 We have recently reported that R-Cu can also degrade genomic DNA,44 and that the pro-oxidant property of R-Cu with respect to DNA degradation can be retained even when the molar concentration of Cu is reduced more than 1000-fold with respect to that of R.44 The R-Cu dose used in our in vitro experiments was at a molar ratio of 1 mM R : 0.0001 mM Cu. Resveratrol (2.3 mg) (Sigma, St Louis, CA, USA; Catalog No. R5010) was dissolved in 5 ml of 60% ethanol (2 mM) (solution A). Copper sulfate (4.98 mg) (MP Biomedicals, Illkirch, France; Catalog No. 191415) was dissolved in 1 ml distilled water (20 mM) and then serially diluted to 0.0002 mM concentration (solution B). About 50% v/v of solution A and solution B was mixed to obtain a mixture containing 1 mM R and 0.0001 mM Cu. One hundred μl of this mixture was added to 1.5 ml of culture media. For in vivo experiments, we used resveratrol and copper that have been approved for human use (TransMaxTR, Biotivia LLC, Arlington, VA, USA and Chelated Copper, J.R. Carlson Laboratories Inc., Arlington Heights, IL, USA). Contents of R capsules (500 mg) were dissolved in distilled water (0.4 mg/ml); chelated copper tablets (5 mg) were crushed into fine powder and dissolved in distilled water (0.04 μg/ml). Fifty μL of both the solutions were administered to mice by oral gavage one after the other at final dose of R=1 mg/kg and Cu=0.1 μg/kg, the ratio between R & Cu being maintained at ∼1: 10−4.
Fluorescence in situ hybridization
In vitro experiments
NIH3T3 cells were co-cultivated with dead and live Jurkat cells and allowed to grow. After 10 passages the cells were processed for FISH to detect the presence of human DNA signals on metaphase spreads as described us earlier. 19 Fifty metaphases were analyzed for presence of human genomic signals. The human whole-genomic FISH probes used were un-reactive to mouse DNA.
In vivo experiments
C57/BL6 mice (6–8 weeks old weighing ~20 g) were intravenously injected with dead and live Jurkat cells (10×104 cells) and were killed on day 7 by cervical dislocation and their vital organs and PBMCs removed, and processed for FISH. Control mice received saline injection. The treated and control groups contained two mice each and FISH for detection of human signals (genomic and/or centromeric) was performed as described by us earlier. 19 One thousand cells were analyzed per animal for each tissue from 10 randomly chosen fields and the percentage of nuclei showing human signals was recorded.
Detection of human Alu elements
We developed two single-cell clones (E7 and B10) from NIH3T3 cells co-cultivated with dead Jurkat cells and analyzed them for the presence of human Alu elements by whole-genome sequencing and pan Alu PCR. Sequencing was carried out using Illumina GA IIX (Genotypic Technology Pvt Ltd) and detection of Alu elements was carried out using bioinformatic analysis.19 The PCR experiment was performed as follows: genomic DNA was PCR amplified using primers for human pan Alu sequences – TC-65 (5ʹ-AAGTCGCGGCCGCTTGCAGTGAGCCGAGAT-3ʹ) and 517 (5ʹ-CGACCTCGAGTTGCAGTGAGCRYAGAT-3ʹ) as described by Nelson et al.27 In brief, Genomic DNA was extracted from the cells and quantified using Nanodrop 2000c Spectrophotometer (Thermo Fisher Scientific Inc., Wilmington, DE, USA). The pan Alu PCR reaction was performed in 20 μl volume containing 10 μl (2x) Biomix-Red master mix (Bio25005), 5 μM each primer, 200 ng gDNA from each sample. PCR condition was as follows: initial denaturation: 95 °C, 3 min; denaturation: 94 °C, 30 s; annealing: 55 °C, 30 s; extension: 72 °C, 5 min for 35 cycles and final extension 72 °C for 10 min. The all 20 μl PCR reaction was resolved on 1.2% agarose gel containing ETBR along with 1 kb ladder. The mouse β-ACTIN and human HER2 gene were used as input controls and PCR amplified using primers (OAD1487 5ʹ-CTAAGGCCAACCGTGAAAAG-3ʹ and OAD1488 5ʹ-ACCAGAGGCATACAGGGACA-3ʹ) and (OAD1099 5ʹ-GAGGCTGTGTGGTGTTTGG-3ʹ and OAD1100 5ʹ-CGTGGATGTCAGGCAGATG-3ʹ), respectively. The PCR conditions were as follows: initial denaturation: 95 °C, 3 min; denaturation: 94 °C, 30 s; annealing: 55 °C, 30 s; extension: 72 °C, 30 s for 35 cycles and final extension 72 °C for 5 min. The 20 μl PCR reaction was resolved on 1.8% agarose gel containing ETBR along with 100 bp ladder.
Statistical analysis
GraphPad Prism 5 (GraphPad Software, Inc., San Diego, CA, USA; Version 5.0) was used for statistical analysis. Data were compared using the Student’s t-test and by Χ 2 analysis, and as indicated in appropriate places in legends to figures.
Acknowledgments
The GalNAc-T2-GFP HeLa cells were a gift from Dr Dibyendu Bhattacharya, ACTREC. We acknowledge the contribution made by Shazia Mansoor, Nabila Akhtar, Fatema Khambati and Abhay Puthli. This study was supported by the Department of Atomic Energy, Government of India, through its grant CTCTMC to Tata Memorial Centre awarded to IM. AD is supported by an Intermediate fellowship from the Wellcome Trust/ DBT India Alliance (IA/I/11/2500278), by a grant from the Department of Biotechnology, Government of India (BT/PR2372/AGR/36/696/2011) and intramural grants (Seed-In-Air 2897, TMH Plan Project 2712 and IRB 92).
Footnotes
Supplementary Information accompanies the paper on the Cell Death and Discovery website (http://www.nature.com/cddiscovery)
The authors declare no conflict of interest.
References
- Mothersill C , Seymour CB . Radiation-induced bystander effects--implications for cancer. Nat Rev Cancer 2004; 4: 158–164. [DOI] [PubMed] [Google Scholar]
- Prise KM , O’Sullivan JM . Radiation-induced bystander signalling in cancer therapy. Nat Rev Cancer 2009; 9: 351–360. [DOI] [PMC free article] [PubMed] [Google Scholar]
- Koturbash I , Rugo RE , Hendricks CA , Loree J , Thibault B , Kutanzi K et al. Irradiation induces DNA damage and modulates epigenetic effectors in distant bystander tissue in vivo. Oncogene 2006; 25: 4267–4275. [DOI] [PubMed] [Google Scholar]
- Koturbash I , Loree J , Kutanzi K , Koganow C , Pogribny I , Kovalchuk O . In vivo bystander effect: cranial X-irradiation leads to elevated DNA damage, altered cellular proliferation and apoptosis, and increased p53 levels in shielded spleen. Int J Radiat Oncol Biol Phys 2008; 70: 554–562. [DOI] [PubMed] [Google Scholar]
- Mancuso M , Pasquali E , Leonardi S , Tanori M , Rebessi S , Di Majo V et al. Oncogenic bystander radiation effects in patched heterozygous mouse cerebellum. Proc Natl Acad Sci USA 2008; 105: 12445–12450. [DOI] [PMC free article] [PubMed] [Google Scholar]
- He H , Tian D , Guo J , Liu M , Chen Z , Hamdy FC et al. DNA damage response in peritumoral regions of oesophageal cancer microenvironment. Carcinogenesis 2013; 34: 139–145. [DOI] [PubMed] [Google Scholar]
- Redon CE , Dickey JS , Nakamura AJ , Kareva IG , Naf D , Nowsheen S et al. Tumors induce complex DNA damage in distant proliferative tissues in vivo. Proc Natl Acad Sci USA 2010; 107: 17992–17997. [DOI] [PMC free article] [PubMed] [Google Scholar]
- Martin OA , Redon CE , Nakamura AJ , Dickey JS , Georgakilas AG , Bonner WM . Systemic DNA damage related to cancer. Cancer Res 2011; 71: 3437–3441. [DOI] [PMC free article] [PubMed] [Google Scholar]
- Mantovani A , Allavena P , Sica A , Balkwill F . Cancer-related inflammation. Nature 2008; 454: 436–444. [DOI] [PubMed] [Google Scholar]
- Balkwill F , Charles KA , Mantovani A . Smoldering and polarized inflammation in the initiation and promotion of malignant disease. Cancer Cell 2005; 7: 211–217. [DOI] [PubMed] [Google Scholar]
- Colotta F , Allavena P , Sica A , Garlanda C , Mantovani A . Cancer-related inflammation, the seventh hallmark of cancer: links to genetic instability. Carcinogenesis 2009; 30: 1073–1081. [DOI] [PubMed] [Google Scholar]
- Balkwill FR , Capasso M , Hagemann T . The tumor microenvironment at a glance. J Cell Sci 2012; 125: 5591–5596. [DOI] [PubMed] [Google Scholar]
- Carmeliet P , Jain RK . Molecular mechanisms and clinical applications of angiogenesis. Nature 2011; 473: 298–307. [DOI] [PMC free article] [PubMed] [Google Scholar]
- Chechlinska M , Kowalewska M , Nowak R . Systemic inflammation as a confounding factor in cancer biomarker discovery and validation. Nat Rev Cancer 2010; 10: 2–3. [DOI] [PubMed] [Google Scholar]
- Kowalewska M , Nowak R , Chechlinska M . Implications of cancer-associated systemic inflammation for biomarker studies. Biochim Biophys Acta 2010; 1806: 163–171. [DOI] [PubMed] [Google Scholar]
- Roxburgh CS , McMillan DC . Cancer and systemic inflammation: treat the tumour and treat the host. Br J Cancer 2014; 110: 1409–1412. [DOI] [PMC free article] [PubMed] [Google Scholar]
- MacDonald N . Cancer cachexia and targeting chronic inflammation: a unified approach to cancer treatment and palliative/supportive care. J Support Oncol 2007; 5: 157–162, discussion 164-166, 183. [PubMed] [Google Scholar]
- Allin KH , Nordestgaard BG , Flyger H , Bojesen SE . Elevated pre-treatment levels of plasma C-reactive protein are associated with poor prognosis after breast cancer: a cohort study. Breast Cancer Res 2011; 13: R55. [DOI] [PMC free article] [PubMed] [Google Scholar]
- Mittra I , Khare NK , Raghuram GV , Chaubal R , Khambatti F , Gupta D et al. Circulating nucleic acids damage DNA of healthy cells by integrating into their genomes. J Biosci 2015; 40: 91–111. [DOI] [PMC free article] [PubMed] [Google Scholar]
- Mittra I . Circulating nucleic acids: a new class of physiological mobile genetic elements. F1000Res 2015; 4: 924. [DOI] [PMC free article] [PubMed] [Google Scholar]
- Basak R , Nair NK , Mittra I . Evidence for cell-free nucleic acids as continuously arising endogenous DNA mutagens. Mutat Res 2016; 793-794: 15–21. [DOI] [PubMed] [Google Scholar]
- Rock KL , Kono H . The inflammatory response to cell death. Annu Rev Pathol 2008; 3: 99–126. [DOI] [PMC free article] [PubMed] [Google Scholar]
- Berda-Haddad Y , Robert S , Salers P , Zekraoui L , Farnarier C , Dinarello CA et al. Sterile inflammation of endothelial cell-derived apoptotic bodies is mediated by interleukin-1α. Proc Natl Acad Sci USA 2011; 108: 20684–20689. [DOI] [PMC free article] [PubMed] [Google Scholar]
- Kiraly O , Gong G , Olipitz W , Muthupalani S , Engelward BP . Inflammation-induced cell proliferation potentiates DNA damage-induced mutations in vivo. PLoS Genet 2015; 11: e1004901. [DOI] [PMC free article] [PubMed] [Google Scholar]
- Fidler IJ . Metastasis: quantitative analysis of distribution and fate of tumor emboli labeled with 125 I-5-iodo-2’-deoxyuridine. J Natl Cancer Inst 1970; 45: 773–782. [PubMed] [Google Scholar]
- Kim JW , Wong CW , Goldsmith JD , Song C , Fu W , Allion MB et al. Rapid apoptosis in the pulmonary vasculature distinguishes non-metastatic from metastatic melanoma cells. Cancer Lett 2004; 213: 203–212. [DOI] [PubMed] [Google Scholar]
- Nelson DL , Ledbetter SA , Corbo L , Victoria MF , Ramírez-Solis R , Webster TD et al. Alu polymerase chain reaction: a method for rapid isolation of human-specific sequences from complex DNA sources. Proc Natl Acad Sci USA 1989; 86: 6686–6690. [DOI] [PMC free article] [PubMed] [Google Scholar]
- Bergsmedh A , Szeles A , Henriksson M , Bratt A , Folkman MJ , Spetz AL et al. Horizontal transfer of oncogenes by uptake of apoptotic bodies. Proc Natl Acad Sci USA 2001; 98: 6407–6411. [DOI] [PMC free article] [PubMed] [Google Scholar]
- Dvořáková M , Karafiát V , Pajer P , Kluzáková E , Jarkovská K , Peková S et al. DNA released by leukemic cells contributes to the disruption of the bone marrow microenvironment. Oncogene 2013; 32: 5201–5209. [DOI] [PubMed] [Google Scholar]
- García-Olmo DC , Domínguez C , García-Arranz M , Anker P , Stroun M , García-Verdugo JM et al. Cell free nucleic acids circulating in the plasma of colorectal cancer patients induce the oncogenic transformation of susceptible cultured cells. Cancer Res 2010; 70: 560–567. [DOI] [PubMed] [Google Scholar]
- Hanahan D , Weinberg RA . Hallmarks of cancer: the next generation. Cell 2011; 144: 646–674. [DOI] [PubMed] [Google Scholar]
- Méhes G , Witt A , Kubista E , Ambros PF . Circulating breast cancer cells are frequently apoptotic. Am J Pathol 2001; 159: 17–20. [DOI] [PMC free article] [PubMed] [Google Scholar]
- Smerage JB , Budd GT , Doyle GV , Brown M , Paoletti C , Muniz M et al. Monitoring apoptosis and Bcl-2 on circulating tumor cells in patients with metastatic breast cancer. Mol Oncol 2013; 7: 680–692. [DOI] [PMC free article] [PubMed] [Google Scholar]
- Allen JE , Saroya BS , Kunkel M , Dicker DT , Das A , Peters KL et al. Apoptotic circulating tumor cells (CTCs) in the peripheral blood of metastatic colorectal cancer patients are associated with liver metastasis but not CTCs. Oncotarget 2014; 5: 1753–1760. [DOI] [PMC free article] [PubMed] [Google Scholar]
- Martin OA , Anderson RL , Narayan K , MacManus MP . Does the mobilization of circulating tumour cells during cancer therapy cause metastasis? Nat Rev Clin Oncol 2017; 14: 32–44. [DOI] [PubMed] [Google Scholar]
- Storrie B , White J , Röttger S , Stelzer EH , Suganuma T , Nilsson T . Recycling of golgi-resident glycosyltransferases through the ER reveals a novel pathway and provides an explanation for nocodazole-induced Golgi scattering. J Cell Biol 1998; 143: 1505–1521. [DOI] [PMC free article] [PubMed] [Google Scholar]
- Simon R , Lam A , Li MC , Ngan M , Menenzes S , Zhao Y . Analysis of gene expression data using BRB-ArrayTools. Cancer Inform 2007; 3: 11–17. [PMC free article] [PubMed] [Google Scholar]
- Saeed AI , Sharov V , White J , Li J , Liang W , Bhagabati N et al. TM4: a free, open-source system for microarray data management and analysis. Biotechniques 2003; 34: 374–378. [DOI] [PubMed] [Google Scholar]
- Subramanian A , Tamayo P , Mootha VK , Mukherjee S , Ebert BL , Gillette MA et al. Gene set enrichment analysis: a knowledge-based approach for interpreting genome-wide expression profiles. Proc Natl Acad Sci USA 2005; 102: 15545–15550. [DOI] [PMC free article] [PubMed] [Google Scholar]
- Rekha MR , Pal K , Bala P , Shetty M , Mittra I , Bhuvaneshwar GS et al. Pullulan-histone antibody nanoconjugates for the removal of chromatin fragments from systemic circulation. Biomaterials 2013; 34: 6328–6338. [DOI] [PubMed] [Google Scholar]
- Gülçin İ . Antioxidant properties of resveratrol: a structure–activity insight. Innov Food Sci Emerg Technol 2010; 11: 210–218. [Google Scholar]
- de la Lastra CA , Villegas I . Resveratrol as an antioxidant and pro-oxidant agent: mechanisms and clinical implications. Biochem Soc Trans 2007; 35: 1156–1160. [DOI] [PubMed] [Google Scholar]
- Fukuhara K , Miyata N . Resveratrol as a new type of DNA-cleaving agent. Bioorg Med Chem Lett 1998; 8: 3187–3192. [DOI] [PubMed] [Google Scholar]
- Subramaniam S , Vohra I , Iyer A , Nair NK , Mittra I . A paradoxical relationship between resveratrol and copper (II) with respect to degradation of DNA and RNA. F1000Res Version 2 2015; 4: 1145 [revised 2016]. [DOI] [PMC free article] [PubMed] [Google Scholar]
Associated Data
This section collects any data citations, data availability statements, or supplementary materials included in this article.


