Abstract
Manual assessment of human epidermal growth factor receptor 2 (HER2) protein expression by immunohistochemistry (IHC) in gastric and gastroesophageal junction (GGEJ) adenocarcinomas is prone to interobserver variability and hampered by tumor heterogeneity and different scoring criteria. Equivocal cases are frequent, requiring additional in situ hybridization analysis. This study aimed to evaluate the accuracy of digital image analysis for the assessment of HER2 protein expression. In total, 110 GGEJ adenocarcinomas were included in tissue microarrays with 3 tissue cores per case. Two immunoassays, PATHWAY and HercepTest, and fluorescent in situ hybridization analysis were performed. The Visiopharm HER2-CONNECT Analysis Protocol Package was applied through the ONCOtopix digital image analysis software platform. HER2 membrane connectivity, calculated by the Analysis Protocol Package, was converted to standard IHC scores applying predetermined cutoff values for breast carcinoma as well as novel cutoff values. Cases with excessive cytoplasmic staining as well as HER2 amplified IHC negative cases were excluded from analysis. Applying HER2-CONNECT with connectivity cutoff values established for breast carcinoma resulted in 72.7% sensitivity and 100% specificity for the identification of HER2 positive gene amplified cases. By application of new cutoff values, the sensitivity increased to 100% without decreased specificity. With the new cutoff values, a 36% to 50% reduction of IHC equivocal cases was obtained. In conclusion, HER2-CONNECT with adjusted cutoff values seem to be an effective tool for standardized assessment of HER2 protein expression in GGEJ adenocarcinomas, decreasing the need for in situ hybridization analyzes.
Key Words: HER2, gastric cancer, immunohistochemistry, FISH, image analysis
Gastric and esophageal cancer account for the third and sixth most common cause, respectively, of cancer death worldwide.1 These cancers show poor prognosis with a 5-year survival rate of 28% and 18%, respectively, disregarding the stage of disease at diagnosis.2 The only potentially curable treatment is surgery. However, at the time of diagnosis most patients present with inoperable disease (except in countries with screening programs).3–5 Inoperable patients and patients with recurrent and metastatic cancer are offered palliative treatment. Approximately 18% of gastric and gastroesophageal junction (GGEJ) adenocarcinomas exhibit the tyrosine kinase human epidermal growth factor receptor 2 (HER2) overexpression,6 enabling treatment with the HER2 antibody trastuzumab in combination with chemotherapy.
HER2 expression is assessed semiquantitatively by immunohistochemistry (IHC), using defined and validated scoring criteria (Table 1) to identify patients eligible for trastuzumab treatment. Cases are classified as either negative, equivocal or positive for HER2 protein overexpression.7,8 However, this method is complicated by several pitfalls, including technical issues (different antibodies, IHC protocols and stainer platforms giving varying staining reactions),9,10 interobserver variability,8,9,11,12 and tumor heterogeneity.13–15 Equivocal cases (compromising 11.8% to 25%16,17) need further analysis by fluorescence in situ hybridization (FISH) or bright field in situ hybridization. These assays are less cost-effective and require more expertise to conduct than IHC assays. According to European Medicines Agency (EMA), treatment with trastuzumab should only be offered to patients with positive IHC result or IHC equivocal cases with confirmed HER2 gene amplification.18
TABLE 1.
Immunohistochemistry Scoring Guidelines for Interpretation of Human Epidermal Growth Factor Receptor 2 Protein Expression in Gastroesophageal Junction Adenocarcinoma

A more objective analysis method for evaluating HER2 protein expression in GGEJ adenocarcinomas can potentially be achieved by application of digital image analysis (DIA). This method is recommended for breast carcinomas by American Society of Clinical Oncology/College of American Pathologists.19 The DIA company, Visiopharm, has in collaboration with the Institute of Pathology, Aalborg University Hospital, developed and commercialized a software, HER2-CONNECT enabling an accurate analysis of HER2 IHC status in breast carcinomas.20 Similar software to assess HER2 IHC status in GGEJ adenocarcinomas has not yet been validated and launched. Few previous studies have evaluated the use of DIA for HER2 IHC expression in GGEJ adenocarcinomas, applying algorithms validated for breast carcinoma, but did not find optimal concordance with manual IHC interpretation and FISH.21,22 One study applied a software algorithm specifically designed for gastric adenocarcinomas. However, the concordance level between DIA and manual IHC and FISH result was not reported in the paper.13
The aim of the present study was to evaluate the accuracy of HER2-CONNECT as analysis tool for interpretation of HER2 protein expression in GGEJ adenocarcinomas based on HercepTest and PATHWAY immunoassays with FISH as reference.
MATERIALS AND METHODS
The material consisted of 110 consecutive resection specimens (RS) from GGEJ adenocarcinomas with sufficient amounts of tumor tissue for examination, collected retrospectively from the archives of Institute of Pathology, Aalborg University Hospital, during 2002 to 2015. No inclusion/exclusion criteria regarding neoadjuvant chemotherapy were used.
All specimens were subjected to standard processing methods including fixation in 10% neutral buffered formalin for 24 to 72 hours.
For the present study, 11 tissue microarray (TMA) blocks were constructed (TMA master, 3DHISTECH) as follows: from each of the 110 cases, 3 tumor-containing regions were identified on hematoxylin-eosin stained full slides and punched out of the paraffin blocks with a 2.0-mm needle. Each TMA further included 2 tissue cores of breast ductal carcinomas as run controls, 1 characterized as IHC HER2 equivocal and 1 IHC HER2 positive. Consecutive 4 μm sections were cut and mounted onto coated slides (FLEX IHC slides K8020, Dako). The sections were dried overnight at room temperature and stored at 20°C until staining.
The following assays were applied.
IHC: HercepTest (Dako, SK001)
Slides were immunostained according to the manufacturer’s recommendations and in brief processed as follows: the slides were dried at 60°C for 1 hour before deparaffinization in Tissue-Clear (Sakura), hydrated through alcohol to distilled water and submitted to heat-induced epitope retrieval for 40 minutes at 97°C in PT-link (Dako). After cooling down for 20 minutes, the slides were placed in the Autostainer Link 48 (Dako) and incubated with the primary antibody (rabbit polyclonal; Dako SK001) at room temperature for 30 minutes. Following wash in buffer, the visualization complex (horseradish peroxidase-labeled polymer, Dako, SK001) was applied for 30 minutes. After a wash in the buffer the slides were finally developed with 3,3'Diaminobenzidine tetrahydrocholoride (DAB) (Dako, SK001) and counterstained with Mayers hematoxylin (S3301, Dako).
IHC: PATHWAY (Ventana, 790-2991)
Slides were immunostained according to the manufacturer’s recommendations and in brief processed as follows: the slides were dried at 60°C for 1 hour and placed in the BenchMark Ultra instrument (Ventana), deparaffinized on-board and submitted to heat-induced epitope retrieval in cell conditioning 1 for 32 minutes at 95°C. Following endogenous peroxidase blocking, the primary antibody (rabbit monoclonal clone 4B5, 760-2991) was applied for 20 minutes at 36°C. After a wash in buffer the visualization complex, UltraView DAB (horseradish peroxidase -labeled multimer, Ventana, 760-500) was applied, and after a new wash in the buffer, the slides were finally developed with DAB (Ventana, 760-500) and counterstained with hematoxylin II (Ventana, 790-2208).
FISH: ZytoLight (Zytovision, Z-2015)
FISH analysis was performed according to the manufacturer’s recommendations as follows: the slides were dried at 60°C overnight before deparaffinization in xylene, hydrated through alcohol to distilled water, and heated in a pretreatment solution (Dako, K5799) in a domestic microwave oven (Blomberg) for 10 minutes. Hereafter, the slides were submitted to proteolytic digestion using pepsin (Dako, K5799) at room temperature for 10 minutes. Denaturation for 4 minutes at 90°C and hybridization for 16 hours at 37°C was performed in a hybridizer (Dako, S2450). The probes for hybridization were based on a dual-probe mix (Zytovision, Z-2015) containing a mixture of an orange fluorochrome direct labeled probe specific for the alpha satellite centromeric region of chromosome 17 and a green fluorochrome direct labeled probe specific for the chromosomal region 17q12-q21.1 harboring the HER2 gene. After a stringent wash at 65°C for 10 minutes, the slides were mounted with a fluorescence mounting medium containing 4′,6-diamidino-2-phenylindol dihydrocholoride and cover-slipped. The slides were stored at 2 to 8°C in the dark until analysis, which was terminated within 2 weeks, using a fluorescence microscope (Leica DMRXA).
Interpretation of IHC Assays
Interpretation of the IHC assays followed the validated scoring criteria for GGEJ adenocarcinoma (Table 1).7,8 The scoring criteria differ between RS and biopsy specimens (BS). Previous studies using TMAs constructed from RS have scored the cases with criteria for either RS or BS.8,11,13,23,24 The current study applied both criteria on the entire material to identify the method with best correlation to FISH.
Two observers scored the IHC slides. Discrepant cases were reevaluated to achieve consensus. The core with the highest score was considered the final result for the case.
Intratumoral heterogeneity was evaluated. A case was defined as heterogenous when it consisted of (1) both negative and equivocal/positives scores or (2) both equivocal and positive scores.
Furthermore, nonspecific staining, that is, cytoplasmic staining of tumor cells was assessed. A case was classified as inadequate if ≥10% of the tumor cells (RS criteria) or a cluster of ≥5 tumor cells (BS criteria) could not be assessed with certainty due to this aberrant staining pattern.
Interpretation of FISH
HER2 gene amplification was classified as negative if HER2/centromere 17 (CEN17) ratio was <2.0 and positive if HER2/CEN17 ratio was ≥2.0. For each core, 20 nonoverlapping representative nuclei were counted. FISH interpretation was conducted by an experienced biomedical laboratory scientist. FISH was evaluated in “hot spots” and if the result was discordant with IHC, the case was recounted (enumeration of 20 additional nuclei) using IHC to identify regions of interest (ROI).
DIA
TMA slides were scanned with NanoZoomer HT 1.0 (Hamamatsu) at ×40 magnification to obtain digital images available for automated image analysis.
The ONCOtopix Software Platform (Visiopharm) was used for DIA. First, the TMA Workflow module was used to create a TMA template, which fitted the design of the TMAs included in this study. An individual image for each core was automatically generated by adjusting the template to each TMA.
Next, The HER2-CONNECT Analysis Protocol Package was applied to the individual TMA cores generating a connectivity value. Connectivity is a continuous measure calculated by the size distribution of stained membrane fragments.20
Connectivity values were converted to negative (0/1+), equivocal (2+), and positive (3+) DIA scores primarily according to validated cutoff values determined for breast carcinoma specimens (Table 2).25 Secondary, connectivity values were compared with IHC and FISH results to determine new cutoff values, specifically adjusted for GGEJ adenocarcinoma specimens.
TABLE 2.
Cutoff Values for Conversion of Connectivity Values to Digital Image Analysis (DIA) Scores for Breast Carcinomas

Subsequently a new classification, called combined HER2 score, merging the IHC and FISH result was given for each core and case to simultaneously compare connectivity to both IHC and FISH results (Table 3).
TABLE 3.
Combined Human Epidermal Growth Factor Receptor 2 (HER2) Score Defined by Immunohistochemistry (IHC) and Fluorescent in Situ Hybridization (FISH) Score

The highest connectivity value and HER2/CEN17 ratio was selected from the 3 cores to represent each case.
Cases with excessive cytoplasmic staining were excluded from HER2-CONNECT analysis, as the Analysis Protocol Package was unable to distinguish the nonspecific staining from membranous staining.
Statistical Analysis
IBM SPSS Statistics 23.0 was used as statistical software. First, results from IHC interpretation using criteria for RS and BS were compared with FISH. The method providing highest analytical sensitivity and specificity was selected. Analytical sensitivity, specificity, and accuracy were calculated for both IHC assays interpreted manually and by HER2-CONNECT using FISH as reference. McNemar test was used to evaluate the difference between manual and automatic IHC assessment. The Cohen κ was calculated to analyze agreement between PATHWAY and HercepTest in relation to HER2-CONNECT results.
RESULTS
IHC and FISH results were available in 104 of the 110 cases included, for both PATHWAY and HercepTest. One case was excluded from all assays as no tumor cells could be identified. Five cases were not evaluable by FISH due to technical issues. Additional 2 and 3 cores were excluded for the PATHWAY and HercepTest assays, respectively, because of poor tumor tissue quality. The affected cases were thus represented by only 1 or 2 cores.
Comparison of Manual IHC Interpretation to FISH Results
Results from IHC interpretation, applying RS and BS scoring criteria, were compared with FISH (Table 4).
TABLE 4.
Comparison of Results From Manual Interpretation of Immunohistochemistry (IHC) to Fluorescent in Situ Hybridization (FISH) Results
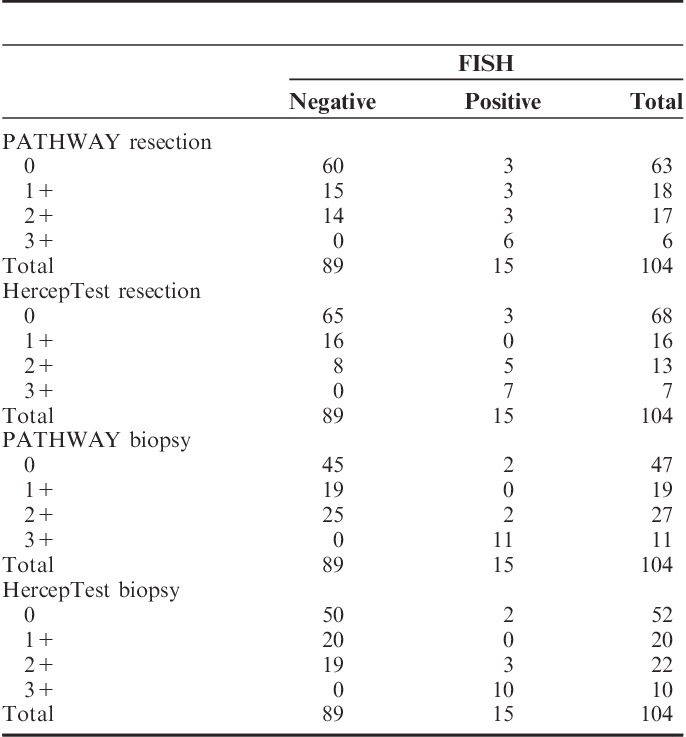
Two cases showing amplification by FISH showed no immunoreaction (scored 0) with PATHWAY and HercepTest. The 2 cases showed low-level amplification (HER2/CEN17 ratio of 2.1 to 2.2) in 1 and 2 cores, respectively, while the other cores were nonamplified by FISH.
Sensitivity, specificity, and accuracy were calculated for all assays (Table 5), excluding the 2+ cases. Scoring TMAs based on BS criteria provided the highest analytical sensitivity: 84.6% for PATHWAY and 83.3% for HercepTest. Specificity was 100% for both scoring methods and both IHC assays. The analytical accuracy increased with use of BS criteria compared with RS as seen in Table 5. The most optimal combination of sensitivity and specificity was thus attained when TMAs were scored analogous to biopsies. Therefore, only results from using criteria for BS were included in the further data analysis.
TABLE 5.
Sensitivity, Specificity, and Accuracy for Results From Manual Interpretation of Immunohistochemistry (IHC) Compared With Fluorescent in Situ Hybridization Results

The sensitivity increased to 100% for both PATHWAY and HercepTest when excluding the 2 cases, which were IHC negative but amplified by FISH. According to EMA, HER2 protein overexpression (2+/3+) must be identified in gene amplified cases to offer trastuzumab treatment18
Prevalence of HER2 Overexpression and Amplification
With PATHWAY 63.4% of the cases were manually scored as negative, 26.0% as equivocal and 10.6% as positive. With HercepTest 69.2% of the cases were scored as negative, 21.2% as equivocal, and 9.6% as positive (see Fig. 1 for examples of the different IHC scores).
FIGURE 1.
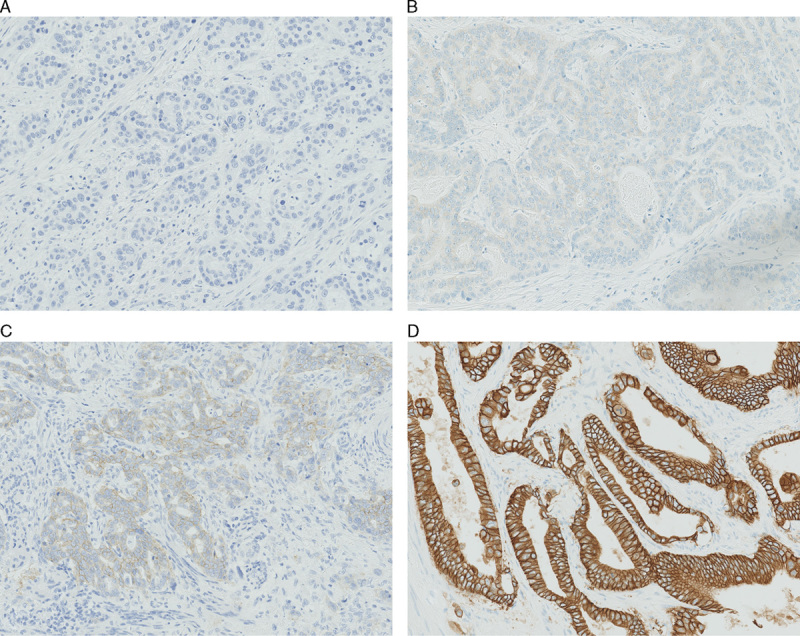
Examples of different human epidermal growth factor receptor 2 immunohistochemistry (IHC) scores (biopsy specimens criteria) IHC score 0 (A), IHC score 1+ (B), IHC score 2+ (C), IHC score 3+ (D) (A–D, ×20 magnification).
The prevalence of HER2 gene amplification assessed by FISH was 14.4% (15 cases). All 3+ cases for PATHWAY and HercepTest were amplified by FISH. Two of 27 equivocal cases with PATHWAY and 3 of 22 cases with HercepTest were positive for HER2 gene amplification.
Nonspecific Staining
The PATHWAY assay (which is based on the primary antibody clone 4B5) occasionally caused an aberrant cytoplasmic (as well as nuclear) staining reaction in tumor cells as well as in normal and dysplastic epithelial cells (Fig. 2). Seven cases (equal to 15 cores) were classified as inadequate with the PATHWAY assay due to cytoplasmic staining of tumor cells. All 7 cases were scored as IHC negative by HercepTest.
FIGURE 2.
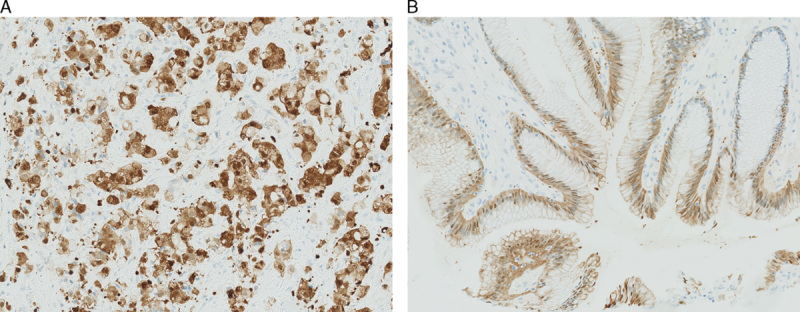
Nonspecific staining, PATHWAY, cytoplasmic and nuclear staining of tumor cells (A). B, PATHWAY, cytoplasmic and nuclear staining of normal epithelial cells. (A–B, ×20 magnification).
IHC—Tumor Heterogeneity
Heterogenous cases, that is cases with different IHC scores in the 3 cores were noted (Figs. 3A–C) in 18 cases (16.5%) with PATHWAY and 16 (14.7%) with HercepTest.
FIGURE 3.
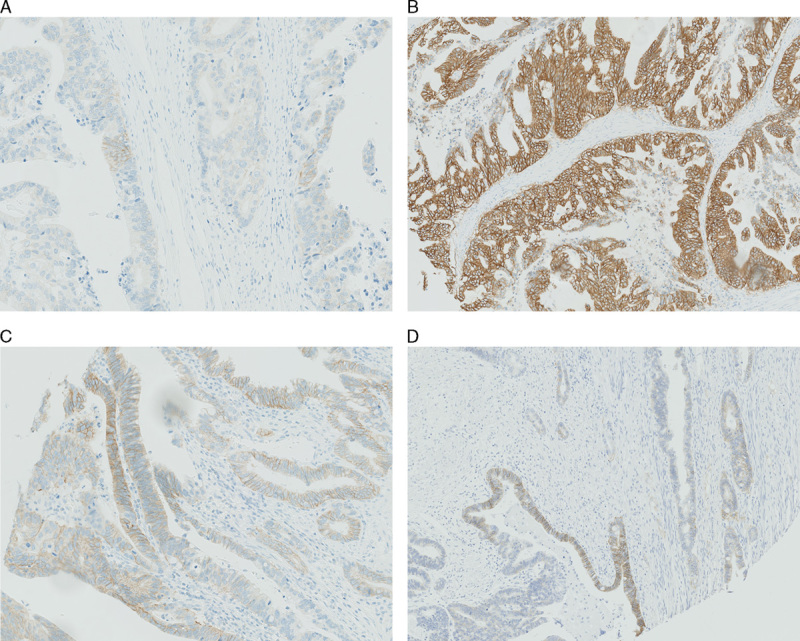
Heterogenous cases. A–C, Same case with different immunohistochemistry (IHC) scores (biopsy specimens criteria) in the 3 individual cores, using the PATHWAY assay. A, Scored as 2+ (only a small cluster of 2+ stained tumor cells), ×20. B, Scored as 3+, 10×. C, Scored as 3+ (only small clusters of 3+ staining, mostly 2+ staining), ×20. D, One core with IHC score ranging from 0 to 3+, ×10, using the HercepTest assay.
Different intensity of membranous staining within the same core was also observed (Fig. 3D).
HER2-CONNECT
All cases and cores with manual IHC score 0 and amplification by FISH were excluded from HER2-CONNECT analysis (as no membranous staining was available for analysis). For this reason, 2 cases (equal to 3 cores) from both IHC assays, and additional 3 cores for PATHWAY and 1 core for HercepTest were excluded. However, the other cores from the specific cases classified the final result for the case as equivocal or positive in manual IHC interpretation.
In total, 15 cores equaling 7 cases, for PATHWAY, classified as inadequate because of cytoplasmic staining were excluded from HER2-CONNECT analysis.
Cutoff values, originally determined for breast carcinoma samples (Table 2), were applied to convert connectivity to DIA scores in line with the manually applied IHC scores. The DIA scores were compared with FISH for all cases (Table 6).
TABLE 6.
Comparison of Digital Image Analysis (DIA) Scores to Fluorescent in Situ Hybridization (FISH) Applying Cutoff Values Designed for Breast Carcinoma (Cases)
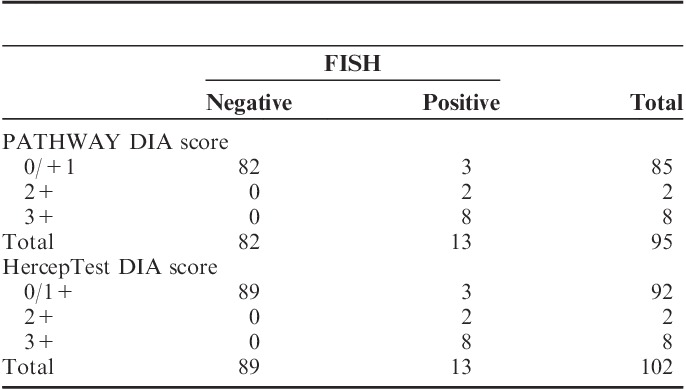
Three amplified cases were classified as negative by HER2-CONNECT for both IHC assays, when cutoff values for breast carcinomas were used. This resulted in a sensitivity of 72.7% and a specificity of 100% for both PATHWAY and HercepTest. Accuracy was 96.8% for PATHWAY and 97.0% for HercepTest.
The connectivity values were compared with combined HER2 scores to define the intervals for the new cutoff values (Fig. 4).
FIGURE 4.
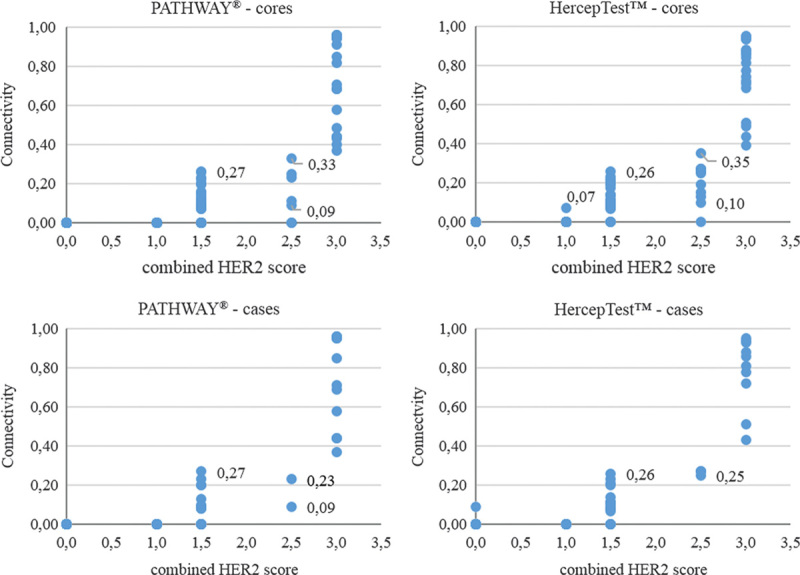
Correlation between connectivity and combined human epidermal growth factor receptor 2 (HER2) score for cores and cases.
The lowest connectivity value for a core with a combined HER2 score (HER2 IHC 2+/FISH pos) of 2.5 was 0.09 for PATHWAY and 0.10 for HercepTest. The highest connectivity value from the 3 cores per case was selected to represent the case. With HercepTest, 0.25 was the lowest value for a case with a combined 2.5 HER2 score. For PATHWAY, 0.09 was still the lowest value per case.
Two cores for PATHWAY and 1 core for HercepTest had a HER2 score of 2.5, but a connectivity of 0.00. The 2 other cores from the associated cases had higher connectivity values, classifying the cases as either equivocal or positive.
From Figure 4, adjusted levels for the cutoffs were obtained. Connectivity <0.09 was considered negative, connectivity between 0.09 and ≤0.30 as equivocal and connectivity >0.30 as positive.
Connectivity values were converted to DIA scores, applying the altered cutoff values. The new HER2-CONNECT results were compared with FISH (Table 7).
TABLE 7.
Comparison of HER2-CONNECT Results to Fluorescent In Situ Hybridization (FISH) Applying Altered Cutoff Values
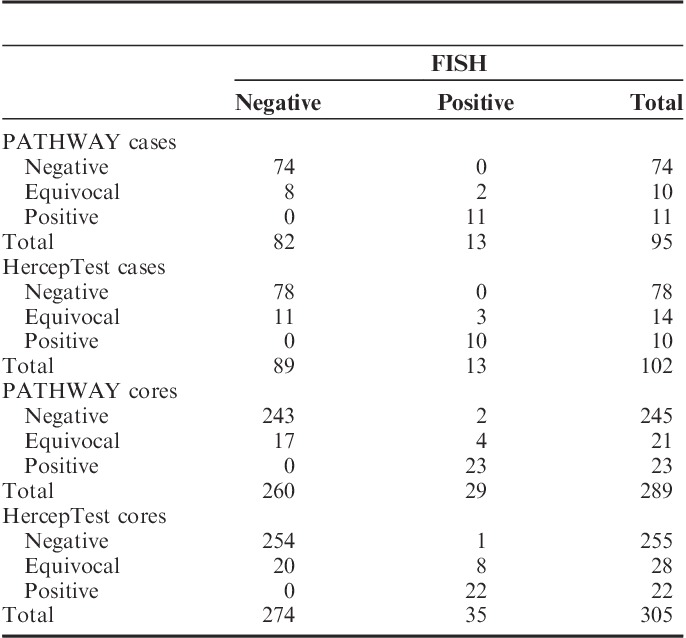
All cases classified as positive by HER2-CONNECT were amplified by FISH for both IHC assays. Two of 10 equivocal cases for PATHWAY and 3 of 14 cases for HercepTest had HER2 gene amplification. All cases classified as negative by HER2-CONNECT were nonamplified.
False negative results occurred when the individual cores instead of cases were compared with FISH. For PATHWAY and HercepTest 2 and 1 cores, respectively, were scored as negative by DIA, but amplified by FISH. The cores were all scored as 2+ by manual IHC interpretation.
The sensitivity, specificity, and accuracy was 100% for both PATHWAY and HercepTest, when the case results were used for calculation. The sensitivity was reduced to 92.0% with PATHWAY and 95.7% with HercepTest when the scores for each individual core were used instead of case result. Specificity remained 100%.
DIA Compared With Manual IHC Interpretation
The number of 2+ scores from manual IHC interpretation was compared with results from HER2-CONNECT analysis.
In total, 20 cases were scored as 2+ for PATHWAY by manual IHC interpretation. This number was reduced to 10 cases when HER2-CONNECT was applied. For HercepTest, 22 cases were scored as 2+ in manual IHC, which was reduced to 14 cases using HER2-CONNECT. The reduction equaled 50.0% and 36.4%, respectively, which was statistically significant (P<0.05) for both assays. There was total agreement regarding 3+ cases.
Comparison of HER2-CONNECT Results for PATHWAY and HercepTest
The agreement between PATHWAY and HercepTest was determined by comparing results for all cores. The agreement was analyzed by calculation of Cohen κ with use of DIA scores derived from connectivity. A κ value of 0.79 was found, indicating substantial agreement.26
DISCUSSION
Assessment of HER2 status in GGEJ adenocarcinomas is essential to identify patients, who are candidates for treatment with trastuzumab. An accurate method is mandatory and a cost-effective approach is appreciable. This study is to our best knowledge the first to evaluate the accuracy of HER2-CONNECT in relation to GGEJ adenocarcinomas.
HER2-CONNECT was originally developed as a diagnostic tool for breast carcinoma samples. Cutoff values, which convert connectivity to an equivalent IHC score, have been determined for breast carcinoma.25 Applying these cutoff values to our study material resulted in three HER2 amplified cases being classified as negative by DIA. All 3 cases were scored as equivocal by manual IHC interpretation, except 1 case which was scored as positive with PATHWAY.
Adjustment of the cutoff values was required to enhance precision of HER2-CONNECT, when analyzing GGEJ adenocarcinomas, to minimize the risk of false negative results and to reduce the proportion of equivocal cases. Applying the altered cutoffs for the cases included in the study resulted in a 100% sensitivity and specificity for both IHC assays. When comparing the score for each individual core to the associated FISH result, the sensitivity was reduced to 92.0% with PATHWAY and 95.7% with HercepTest. Furthermore, a statistically significant reduction of equivocal cases was observed for HER2-CONNECT. However, the cutoff values determined in this study need further validation and confirmation with inclusion of different samples, that is whole-sections, biopsy specimens, and samples from different institutions.
Comparison of connectivity with combined HER2 score, revealed that the lowest connectivity value for a case with a 2.5 HER2 score (IHC 2+ and amplified by FISH) was 0.09 for PATHWAY and 0.25 for HercepTest. Substantial agreement (κ=0.79) was found between the IHC assays for results from HER2-CONNECT analysis. However, the difference in lowest connectivity for a 2.5 HER2 case score indicate that separate cutoffs for different IHC assays could enhance precision of HER2-CONNECT.
False negative results occurred when DIA scores for individual cores, instead of cases, were compared with FISH results. For PATHWAY and HercepTest, 2 and 1 cores, respectively, were false negative. The cores were scored as 2+ by manual IHC interpretation. This might be a potential challenge for HER2-CONNECT with the present software configuration for cases with equivocal HER2 protein expression.
Connectivity and manual IHC score was discrepant in some cases, especially when the HER2 expression was heterogenous within a single core. The discrepant cases were reanalyzed and ROI were manually selected, instead of the automatic selection of the whole tissue core. The highest connectivity value was achieved when ROI only included the area with the strongest HER2 expression.
The HER2-CONNECT software recognized artifacts (pigments, etc.) as membranous staining, which lead to falsely high connectivity values. These cases were easily identified because of discrepancy between connectivity and manual IHC score and the DIA analysis evidently was based on nonrelevant structures.
Nonspecific cytoplasmic and nuclear staining was occasionally observed with PATHWAY, interfering with interpretation. Seven cases were classified as inadequate for this reason and excluded from HER2-CONNECT analysis. The software registered cytoplasmic and nuclear staining as membranous which gave falsely high connectivity values. The reduction of equivocal 2+ IHC cases was higher for PATHWAY compared with HercepTest, 50.0% versus 36.4%, when HER2-CONNECT analysis were performed. However, the 7 cases scored as inadequate because of nonspecific staining would still need retesting by an alternative IHC test. HercepTest in combination with HER2-CONNECT may be a superior method compared with PATHWAY for GGEJ adenocarcinomas as all cases could be evaluated with reduction of equivocal cases without compromising the sensitivity and specificity.
The HER2-CONNECT software algorithm was directly applied to GGEJ adenocarcinoma, only altering the cutoff values. Adjustment of the algorithm itself might enhance the effectiveness of the software further reducing the number of equivocal cases and increase accuracy when individual cores are compared with FISH. It is unknown whether alteration of the software algorithm could enable the software to distinguish the nonspecific staining from membranous, which was a challenge for IHC performed with PATHWAY. The cutoff values for GGEJ adenocarcinoma, set in this study, was lower than cutoffs determined for breast carcinoma. One reason for this difference could be the incomplete staining of membranes, which is characteristic for GGEJ adenocarcinomas. The software eliminates small membrane fragments from calculation of connectivity according to a specified cutoff size. This cutoff might be changed to optimize the compatibility of HER2-CONNECT to GGEJ adenocarcinomas.
Approximately 15% of the cases included in this study were classified as heterogenous (different IHC scores for cores from the same case), indicating the importance of including multiple tumor cores for a TMA set-up. Heterogenous cases typically reveal small foci of tumor cells with HER2 protein overexpression. These foci can be difficult to identify during FISH analysis. A combined gene protein assay has been developed by Ventana to ease interpretation. The assay allows simultaneous interpretation of HER2 protein expression and HER2 gene amplification in the same slide. Few studies have evaluated the assay for GGEJ adenocarcinomas, exhibiting promising results.27–29
In conclusion, this study has shown that HER2-CONNECT seems to be a useful tool in assessment of HER2 expression in GGEJ adenocarcinoma. Adjustment of cutoff values determined for breast carcinoma ensured a 100% analytical sensitivity, specificity and accuracy for case results when HER2-CONNECT was applied. The software failed to correctly classify 3 individual cores, leading to a sensitivity of 92.0% with PATHWAY and 95.7% with HercepTest. A statistically significant reduction of equivocal cases for PATHWAY (50.0%) and HercepTest (36.4%) was achieved for HER2-CONNECT. Adjustment of the software may potentially enhance the accuracy of HER2-CONNECT. Further studies with inclusion of additional samples types are required to validate results from this study.
Footnotes
Institute of Pathology, Aalborg University Hospital has collaborated with Visiopharm in the development of the software. M.V. is member of the Visiopharm Scientific Advisory Board. The remaining authors declare no conflict of interest.
REFERENCES
- 1.Ferlay J, Soerjomataram I, Ervik M, et al. GLOBOCAN 2012 v10, cancer incidence and mortality worldwide: IARC CancerBase no 11 [internet]. Lyon, france: International agency for research on cancer; 2013. http://globocan.iarc.fr. Updated 2013. Accessed 03/09, 2015. [Google Scholar]
- 2.Howlader N, Noone A, Krapcho M, et al. SEER cancer statistics review, 1975-2011, national cancer institute. bethesda, MD, based on november 2013 SEER data submission. http://seer.cancer.gov/csr/1975_2011/. Updated 2014. Accessed 03/09, 2015.
- 3.Tan YK, Fielding JWL. Early diagnosis of early gastric cancer. Eur J Gastroenterol Hepatol. 2006;18:821–829. [DOI] [PubMed] [Google Scholar]
- 4.Howlader N, Noone A, Krapcho M, et al. SEER cancer statistics review, 1975-2012, national cancer institute. bethesda, MD, based on november 2014 SEER data submission. http://seer.cancer.gov/csr/1975_2012/. Updated April 2015. Accessed 08/12, 2015.
- 5.Carcas LP. Gastric cancer review. J Carcinog. 2014;13:14–3163. 146506. eCollection 2014. [DOI] [PMC free article] [PubMed] [Google Scholar]
- 6.Jørgensen JT. Role of human epidermal growth factor receptor 2 in gastric cancer: Biological and pharmacological aspects. World J Gastroenterol. 2014;20:4526–4535. [DOI] [PMC free article] [PubMed] [Google Scholar]
- 7.Hofmann M, Stoss O, Shi D, et al. Assessment of a HER2 scoring system for gastric cancer: Results from a validation study. Histopathology. 2008;52:797–805. [DOI] [PubMed] [Google Scholar]
- 8.Rüschoff J, Dietel M, Baretton G, et al. HER2 diagnostics in gastric cancer - guideline validation and development of standardized immunohistochemical testing. Virchows Archiv. 2010;457:299–307. [DOI] [PMC free article] [PubMed] [Google Scholar]
- 9.Nordi QC. Assesment run G2 2011 (gastric cancer pilot module). http://www.nordiqc.org/Run-33-B12-G2/Assessment/assessment-G2-HER2.htm. Updated 2012. Accessed 08/24, 2015.
- 10.UK NEQAS ICC & ISH. Run 109: The gastric HER2 ICC module. http://www.ukneqasiccish.org/wp/wp-content/uploads/2015/07/run_109_journal.pdf. Updated 2015. Accessed 08/24, 2015.
- 11.Sheffield BS, Garratt J, Kalloger SE, et al. HER2/neu testing in gastric cancer by immunohistochemistry: assessment of interlaboratory variation. Arch Pathol Lab Med. 2014;138:1495–1502. [DOI] [PubMed] [Google Scholar]
- 12.Fox SB, Kumarasinghe MP, Armes JE, et al. Gastric HER2 testing study (GaTHER): An evaluation of gastric/gastroesophageal junction cancer testing accuracy in australia. Am J Surg Pathol. 2012;36:577–582. [DOI] [PubMed] [Google Scholar]
- 13.Fusco N, Rocco EG, Del Conte C, et al. HER2 in gastric cancer: A digital image analysis in pre-neoplastic, primary and metastatic lesions. Mod Pathol. 2013;26:816–824. [DOI] [PubMed] [Google Scholar]
- 14.Yang J, Luo H, Li Y, et al. Intratumoral heterogeneity determines discordant results of diagnostic tests for human epidermal growth factor receptor (HER) 2 in gastric cancer specimens. Cell Biochem Biophys. 2012;62:221–228. [DOI] [PubMed] [Google Scholar]
- 15.Lee HE, Park KU, Yoo SB, et al. Clinical significance of intratumoral HER2 heterogeneity in gastric cancer. Eur J Cancer. 2013;49:1448–1457. [DOI] [PubMed] [Google Scholar]
- 16.Van Cutsem E, Bang YJ, Feng-yi F, et al. HER2 screening data from ToGA: Targeting HER2 in gastric and gastroesophageal junction cancer. Gastric Cancer. 2015;18:476–484. [DOI] [PMC free article] [PubMed] [Google Scholar]
- 17.Aalborg University Hospital. Internal data from Institute of Pathology. 2015.
- 18.Europeans Medicines Agency. Assesment report for herceptin. procedure no. EMEA/H/C/278/II/0047 http://www.ema.europa.eu/docs/en_GB/document_library/EPAR_-_Assessment_Report_-_Variation/human/000278/WC500074921.pdf. Updated 2010. Accessed 08/12, 2015.
- 19.Wolff AC, Hammond ME, Schwartz JN, et al. American society of clinical oncology/college of american pathologists guideline recommendations for human epidermal growth factor receptor 2 testing in breast cancer. Arch Pathol Lab Med. 2007;131:18–43. [DOI] [PubMed] [Google Scholar]
- 20.Brugmann A, Eld M, Lelkaitis G, et al. Digital image analysis of membrane connectivity is a robust measure of HER2 immunostains. Breast Cancer Res Treat. 2012;132:41–49. [DOI] [PubMed] [Google Scholar]
- 21.Radu OM, Foxwell T, Cieply K, et al. HER2 amplification in gastroesophageal adenocarcinoma: Correlation of two antibodies using gastric cancer scoring criteria, H score, and digital image analysis with fluorescence in situ hybridization. Am J Clin Pathol. 2012;137:583–594. [DOI] [PMC free article] [PubMed] [Google Scholar]
- 22.Jeung J, Patel R, Vila L, et al. Quantitation of HER2/neu expression in primary gastroesophageal adenocarcinomas using conventional light microscopy and quantitative image analysis. Arch Pathol Lab Med. 2012;136:610–617. [DOI] [PMC free article] [PubMed] [Google Scholar]
- 23.Cho EY, Srivastava A, Park K, et al. Comparison of four immunohistochemical tests and FISH for measuring HER2 expression in gastric carcinomas. Pathology. 2012;44:216–220. [DOI] [PubMed] [Google Scholar]
- 24.Gasljevic G, Lamovec J, Contreras JA, et al. HER2 in gastric cancer: An immunohistochemical study on tissue microarrays and the corresponding whole-tissue sections with a supplemental fish study. Pathol Oncol Res. 2013;19:855–865. [DOI] [PubMed] [Google Scholar]
- 25.Holten-Rossing H, Moller Talman ML, Kristensson M, et al. Optimizing HER2 assessment in breast cancer: Application of automated image analysis. Breast Cancer Res Treat. 2015;152:367–375. [DOI] [PubMed] [Google Scholar]
- 26.Landis JR, Koch GG. The measurement of observer agreement for categorical data. Biometrics. 1977;33:159–174. [PubMed] [Google Scholar]
- 27.Werner D, Battmann A, Steinmetz K, et al. The validation of a novel method combining both HER2 immunohistochemistry and HER2 dual-colour silver in situ hybridization on one slide for gastric carcinoma testing. J Transl Med. 2014;12:160-5876-12-160. [DOI] [PMC free article] [PubMed] [Google Scholar]
- 28.Hirschmann A, Lamb TA, Marchal G, et al. Simultaneous analysis of HER2 gene and protein on a single slide facilitates HER2 testing of breast and gastric carcinomas. Am J Clin Pathol. 2012;138:837–844. [DOI] [PubMed] [Google Scholar]
- 29.Nishida Y, Kuwata T, Nitta H, et al. A novel gene-protein assay for evaluating HER2 status in gastric cancer: Simultaneous analyses of HER2 protein overexpression and gene amplification reveal intratumoral heterogeneity. Gastric Cancer. 2015;18:458–466. [DOI] [PubMed] [Google Scholar]


