

Abstract
Urate hydroperoxide is a product of the oxidation of uric acid by inflammatory heme peroxidases. The formation of urate hydroperoxide might be a key event in vascular inflammation, where there is large amount of uric acid and inflammatory peroxidases. Urate hydroperoxide oxidizes glutathione and sulfur-containing amino acids and is expected to react fast toward reactive thiols from peroxiredoxins (Prxs). The kinetics for the oxidation of the cytosolic 2-Cys Prx1 and Prx2 revealed that urate hydroperoxide oxidizes these enzymes at rates comparable with hydrogen peroxide. The second-order rate constants of these reactions were 4.9 × 10⁵ and 2.3 × 10⁶ m−1 s−1 for Prx1 and Prx2, respectively. Kinetic and simulation data suggest that the oxidation of Prx2 by urate hydroperoxide occurs by a three-step mechanism, where the peroxide reversibly associates with the enzyme; then it oxidizes the peroxidatic cysteine, and finally, the rate-limiting disulfide bond is formed. Of relevance, the disulfide bond formation was much slower in Prx2 (k3 = 0.31 s−1) than Prx1 (k3 = 14.9 s−1). In addition, Prx2 was more sensitive than Prx1 to hyperoxidation caused by both urate hydroperoxide and hydrogen peroxide. Urate hydroperoxide oxidized Prx2 from intact erythrocytes to the same extent as hydrogen peroxide. Therefore, Prx1 and Prx2 are likely targets of urate hydroperoxide in cells. Oxidation of Prxs by urate hydroperoxide might affect cell function and be partially responsible for the pro-oxidant and pro-inflammatory effects of uric acid.
Keywords: hydrogen peroxide, inflammation, oxidation-reduction (redox), peroxiredoxin, uric acid, urate hydroperoxide
Introduction
Uric acid is the end product of purine metabolism in humans. Urate, the anionic form of uric acid (pKa 5.4), accumulates in plasma in concentrations ranging from 50 to 420 μm in healthy individuals. The gene silencing of the enzyme uricase has been suggested to be an evolutionary advantage because urate is a facile electron donor (one-electron reduction potential = 0.59 V, pH 7.0, HU˙̄, H+/UH2−) and therefore a powerful antioxidant (1, 2). Urate chelates transition metals ions, reacts with hydroxyl radical, singlet oxygen (3), and hypochlorous acid (4) and neutralizes protein radicals (5). Despite its antioxidant ability, uric acid is associated with endothelial and renal dysfunction, hypertension, inflammation, and cardiovascular disease (6–10). Some of these conditions are linked to oxidative stress (11). In fact, urate itself has been reported to increase oxidative damage and to inactivate enzymes sensitive to oxidative stress (12–15). In this sense, the capability of urate to be an anti- or pro-oxidant is still a paradox (16).
At the molecular level, urate crystals activate the NLRP3 (Nod-like receptor protein 3) inflammasome (17). However, soluble urate also exerts pro-inflammatory effects by stimulating the oxidative burst in adipocytes (11, 18). Urate can be oxidized by the pro-inflammatory enzymes myeloperoxidase (MPO)3 and lactoperoxidase (LPO) to generate urate free radical and urate hydroperoxide (19, 20). Considering the levels of urate in human biological fluids, as well as the concentration of MPO and LPO in inflammatory environments (21, 22), a significant amount of urate hydroperoxide might be formed during inflammatory oxidative burst. Urate hydroperoxide oxidizes methionine and cysteine and reacts with glutathione at a rate constant of 13.8 m−1 s−1 (23). Therefore, proteins that contain thiol groups are putative urate hydroperoxide targets.
Peroxiredoxins are ubiquitous cysteine-dependent peroxidases. They reduce hydrogen peroxide, peroxynitrite, and organic peroxides at extremely high rates (24–31). There are six human Prxs (Prx1 to Prx6) that vary in their intracellular location and catalytic mechanisms. Prx1 and Prx2 are typical 2-Cys proteins present in cytosol (32). Their enzymatic cycle involves oxidation of the peroxidatic cysteine (CP) to a sulfenic acid, followed by disulfide bond formation with the resolving cysteine (CR) of another subunit, resulting in a head-to-tail covalent dimer. Their basic functional unit is a homodimer during the entire catalytic cycle, and they can assemble into high molecular weight species in cells (31, 33). During the catalytic cycle, the disulfide bond formation can be overcome if the oxidant concentration is sufficiently high to compete for the sulfenic acid to yield the sulfinic and sulfonic acid-hyperoxidized Prx (33–36). Hyperoxidation of Prx significantly limits the turnover of the enzyme. The intermolecular disulfide bond is mainly reduced by the thioredoxin-thioredoxin reductase system (32) and in some cases by glutaredoxin (37, 38). In contrast, the hyperoxidized form can only be reduced by sulfiredoxin, a slower process that consumes ATP (39, 40).
Prx1 and Prx2 share 91% of homology and 78% of identity in their amino acid sequences (41). Despite the similarities, Prx1 has four cysteine residues (Cys-52, Cys-71, Cys-83, and Cys-173) and Prx2 has three (Cys-51, Cys-70, and Cys-172). Indeed, these enzymes are not redundant, and structural differences provide unique functions (42, 43). Prx1 and Prx2 are oxidized at extraordinary high rates by hydrogen peroxide and can transfer these oxidizing equivalents to another signaling protein through thiol-disulfide exchange reactions, which seems to be relevant in redox signaling (44–47). For instance, Prx2 forms a redox relay with STAT3 (signal transducer and activator of transcription 3), inhibiting STAT3 migration to the nucleus (46). Prx1, however, can transfer their oxidizing equivalents to the ASK1 (apoptosis-regulating kinase-1 signaling), resulting in the phosphorylation of p38 and activation of apoptosis (47).
In this study, we investigated the kinetics and mechanism of the oxidation of Prx1 and Prx2 by urate hydroperoxide. The observed high rate constants indicate that these proteins might be preferential targets of urate hydroperoxide in cells. Hyperoxidation of Prxs only occurred at high concentrations of urate hydroperoxide and may not be relevant in vivo. Urate hydroperoxide oxidized Prx2 in intact erythrocytes to the same extent as hydrogen peroxide. In conclusion, this study contributes to the understanding of the catalytic mechanism of 2-Cys Prxs in the reduction of an organic peroxide formed during inflammatory processes.
Results
Oxidation of Prx by urate hydroperoxide
Initially, we sought to identify whether Prx1 and Prx2 would be oxidized by urate hydroperoxide. The enzymes were incubated with different concentrations of urate hydroperoxide, and the oxidation of Prxs was evaluated by the appearance of disulfide bond dimers (∼42 kDa) in non-reducing SDS-PAGE. An equimolar concentration of urate hydroperoxide and Prx was enough to convert almost all monomers into dimers (Fig. 1).
Figure 1.

Oxidation of Prx1 and Prx2 by urate hydroperoxide. Pre-reduced Prx1 and Prx2 (2 μm) were incubated in 50 mm sodium phosphate buffer, pH 7.4, with 0, 2, 5, 10, 20, 50, and 100 μm urate hydroperoxide for 5 min at room temperature. After reaction, 30 mm NEM was added to prevent further oxidation. Reduced and disulfide forms of Prx run as monomers and dimers in non-reducing SDS-polyacrylamide gel, respectively. These results are representative of three independent experiments.
Determination of the rate constants for the reaction of urate hydroperoxide with Prx
Next, we investigated the rate of Prx oxidation by urate hydroperoxide taking advantage of fluorescence changes during Prx oxidation (28, 48, 49). As described previously for typical 2-Cys Prx (31, 48, 49), a two-phase fluorescent profile was observed, displaying a rapid decrease and a subsequent slower increase in fluorescence intensity (Fig. 2A). Initially, the first rapid decay was fitted by a single exponential equation (Figs. 2B and 3A). The observed rate constants for the first rapid phase were linearly dependent on urate hydroperoxide concentration, and the determined second-order rate constants were k1 = 2.26 ± 0.13 × 10⁶ m−1 s−1 for Prx2 (Fig. 2C) and k1 = 4.90 ± 0.47 × 10⁵ m−1 s−1 for Prx1 (Fig. 3B).
Figure 2.
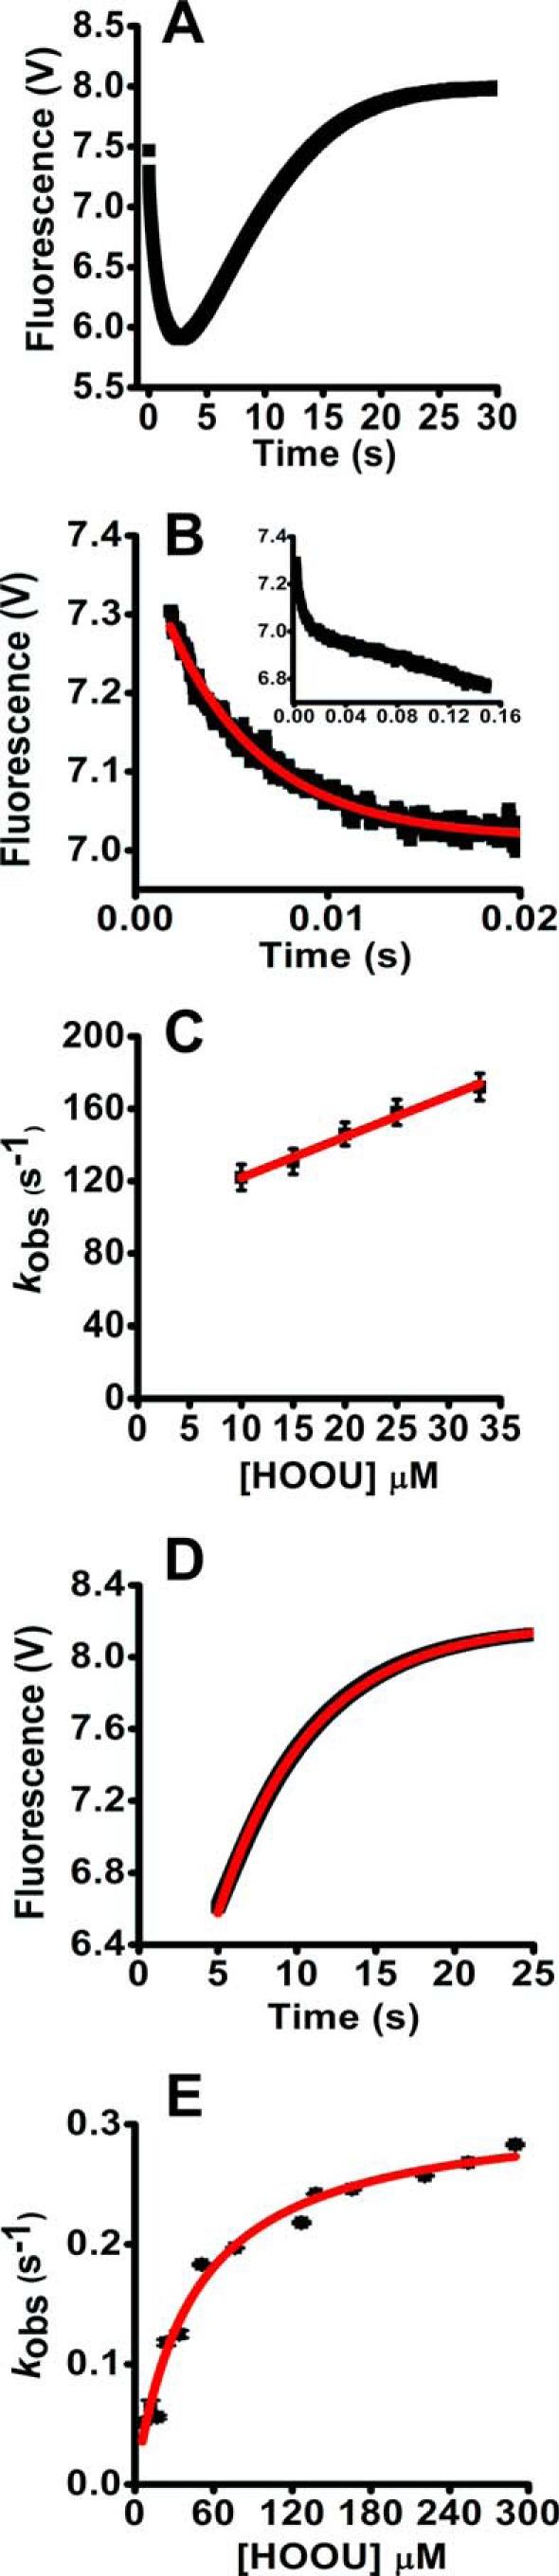
Kinetics of the oxidation of Prx2 by urate hydroperoxide. A, pre-reduced Prx2 (2 μm) was incubated with 20 μm urate hydroperoxide in 50 mm sodium phosphate buffer (pH 7.4; 22 °C). Reactions were monitored over time by the variation of intrinsic protein fluorescence (λex = 280 nm, emission filter >330 nm) in the stopped-flow instrument. B, first rapid phase of the reaction of Prx2 (2 μm) with 20 μm urate hydroperoxide. Observed rate constants (kobs) were calculated by single exponential equation. Inset shows the slower linear decay of Prx2 fluorescence. C, plot of kobs of the first rapid phase of the reaction of Prx2 versus urate hydroperoxide concentration. The second-order rate constant was calculated from this slope. D, fluorescence increase during the slow phase of the reaction of Prx2 (2 μm) with 20 μm urate hydroperoxide. Observed rate constants (kobs) were calculated by single exponential equation. E, plot for the kobs of the slow phase of the reaction of Prx2 versus urate hydroperoxide concentration. Non-linear curve was best fitted with a hyperbolic equation. V, voltage.
Figure 3.
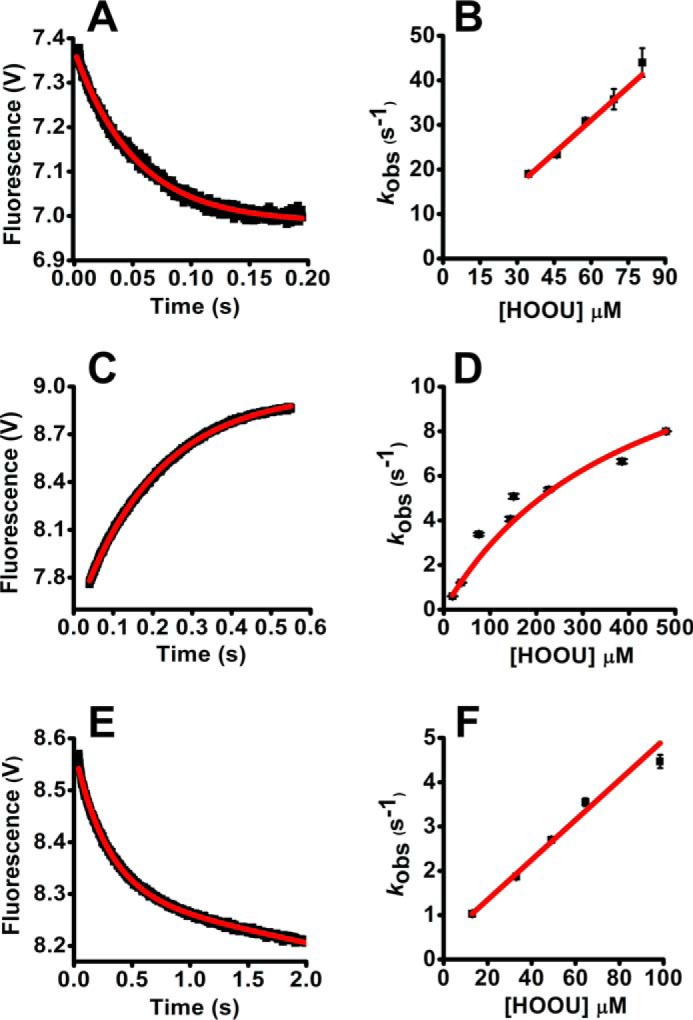
Kinetics of the oxidation of WTPrx1 and Prx1C83S/C173S by urate hydroperoxide. A, first rapid phase of the reaction of pre-reduced Prx1 (5 μm) incubated with 35 μm urate hydroperoxide in 50 mm sodium phosphate buffer (pH 7.4; 22 °C). Reactions were monitored over time by the variation of intrinsic protein fluorescence (λex = 280 nm, emission filter >330 nm) in the stopped-flow instrument. Observed rate constants (kobs) were calculated by single exponential equation. B, plot of kobs of the first rapid phase reaction of Prx1 versus urate hydroperoxide concentration. The second-order rate constant was calculated from this slope. C, fluorescence increase during the slow phase of the reaction of Prx1 (5 μm) with 240 μm urate hydroperoxide. Observed rate constants (kobs) were calculated by single exponential equation. D, plot of kobs of the slow phase of the reaction of Prx1 versus urate hydroperoxide. Non-linear curve was best fitted with a hyperbolic equation. E, first rapid phase of the reaction of pre-reduced Prx1 that was mutated at the resolving (Cys-173) and non-catalytic cysteine (Cys-83) (Prx1C83S/C173S, 5 μm) incubated with 65 μm urate hydroperoxide in 50 mm sodium phosphate buffer (pH 7.4; 22 °C). Observed rate constants (kobs) were calculated by single exponential plus straight line equation. F, plot of kobs of the first rapid phase of the reaction of Prx1 versus urate hydroperoxide concentration. V, voltage.
The linear fitting from kobs versus urate hydroperoxide concentration showed a clear non-zero y-intercept for Prx2, indicating that the first phase is reversible. The value of the y-intercept (k−1) was 99.0 ± 3.0 s−1 (Fig. 2C). The first fast decrease in Prx2 fluorescence (Fig. 2B) was followed by a slow linear decrease (Fig. 2B, inset). The rate of this linear decrease was independent of urate hydroperoxide concentration and could be the actual oxidation of the peroxidatic thiol to sulfenic acid.
In contrast, this slow linear decrease in fluorescence was not observed for Prx1. In addition, when the kobs of the first rapid fluorescence decrease of Prx1 was plotted against urate hydroperoxide concentrations, the linear fitting presented a close to zero y-intercept, 1.47 ± 2.12 s−1 (Fig. 3B).
Unlike the first phase, the kobs of the second phase levels off with increasing concentrations of urate hydroperoxide (Figs. 2E and 3D). The plot of kobs versus substrate concentration was well fitted to a non-linear hyperbolic equation. The limiting rate constants (k3) were 0.31 ± 0.01 s−1 for Prx2 (Fig. 2, D and E) and 14.9 ± 1.01 s−1 for Prx1 (Fig. 3, C and D).
No changes in Prx fluorescence were observed in the absence of oxidants or when thiols from Prxs were alkylated with N-ethylmaleimide (NEM) (supplemental Fig. S1). Kinetics of His-tagged Prx2 or His-tagged free Prx2 were very similar: 2.26 ± 0.13 × 10⁶ and 1.80 ± 0.12 × 10⁶ m−1s−1 for the first phase; the y-intercept (k−1) was 99.0 ± 3.0 and 43.0 ± 1.2 s−1 and k3 = 0.31 ± 0.01 and 0.38 ± 0.03 s−1, respectively (data not shown).
According to a three-step model reported for the oxidation of AhpC by hydrogen peroxide (43), the first rapid decay of fluorescence would correspond to the binding of the enzyme to the peroxide substrate and the oxidation of CP. Thus, k1 represents the enzyme-substrate complex formation and k−1 the complex dissociation. The slow fluorescence increase would represent the disulfide bond formation. To confirm that the fluorescence increase was due to the disulfide formation also in human Prxs, we used a double mutant Prx1 where the resolving (Cys-173) and the non-catalytic (Cys-83) cysteine were replaced by serine (Prx1C83S/C173S). As expected, upon oxidation by urate hydroperoxide, the intrinsic fluorescence of this mutant exhibited a rapid decay but lacked the second slow phase (Fig. 3E), suggesting that the rise in fluorescence observed in WTPrx1 was due to the disulfide bond formation.
The fluorescence decay for Prx1C83S/C173S presented a similar feature as for WTPrx1, and the kobs increased linearly with increasing concentrations of urate hydroperoxide (Fig. 3E). However, the second-order rate constant (k1) for this reaction was 1 order of magnitude lower for Prx1C83S/C173S (4.50 ± 0.18 × 10⁴ m−1 s−1, Fig. 3F) than for WTPrx1 and the k−1 was 0.44 ± 0.04 s−1. The second-order rate constant of the reaction of Prx2 with urate hydroperoxide was only 1–2 orders of magnitude lower than that with hydrogen peroxide 0.2–1.3 × 10⁸ m−1 s−1 (25, 26), showing that Prx2 might be a physiological target to urate hydroperoxide.
There are no rate constants reported for the reaction of Prx1 and hydrogen peroxide. Therefore, we carried out fluorescence experiments to determine it. The reaction of Prx1 with hydrogen peroxide was faster than with urate hydroperoxide, so we had to use sub-stoichiometric concentrations of substrate and employ an initial rate approach. By plotting the initial rates versus hydrogen peroxide concentration, the second-order rate constant was 3.80 ± 0.15 × 10⁷ m−1 s−1 (Fig. 4A). The linear plot intercepted the y axis at 4.42 ± 1.85 μm−1 s−1. The increase in fluorescence after mixing Prx1 with hydrogen peroxide followed first-order kinetics and was independent of hydrogen peroxide concentration. The kobs of this step was 9.0 ± 0.2 s−1 (Fig. 4B), which is very similar to that calculated when the substrate was urate hydroperoxide (14.9 ± 1.01 s−1, Fig. 3D). The independency of the nature of peroxide in this rate constant is additional evidence that the return in fluorescence is due to a disulfide bond formation with the resolving cysteine rather than hyperoxidation.
Figure 4.
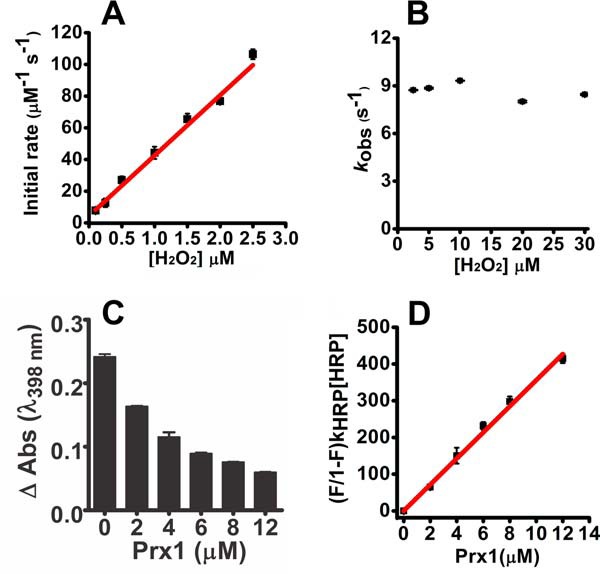
Kinetics of the oxidation of Prx1 by hydrogen peroxide. Pre-reduced Prx1 (5 μm) was incubated with sub-stoichiometric concentrations of hydrogen peroxide (0.1–2.5 μm) in 50 mm sodium phosphate buffer (pH 7.4; 22 °C). The reaction was monitored over time by the variation of intrinsic protein fluorescence (λex = 280 nm, emission filter >330 nm) in the stopped-flow instrument. A, initial rates were calculated from the slope within 10% total fluorescence decay and plotted against hydrogen peroxide concentration. B, observed rate constants (kobs) of the fluorescence increase in the slow phase of the reaction of Prx1 (5 μm) with hydrogen peroxide (2–30 μm) were calculated by single exponential equation and plotted against hydrogen peroxide concentration. C, competition kinetics for the oxidation of Prx1 by hydrogen peroxide. Horseradish peroxidase (HRP, 8 μm) was incubated with sub-stoichiometric concentration of hydrogen peroxide (4 μm) in 50 mm phosphate buffer (pH 7.4; 22 °C) plus 100 μm DTPA. The inhibition in the formation of compound I was dependent on the concentration of Prx1 (pre-reduced Prx1 ∼3.1 μmol of SH·μmol of protein−1). D, linear plot of (F/1 − F)·kHRP·[HRP] versus [Prx1] (slope = kPrx1 = 3.5 ± 0.10 × 10⁷ m−1s−1). Each bar represents the mean ± S.E.M. of three experiments. V, voltage.
We also determined the second-order rate constant for the reaction of Prx1 and hydrogen peroxide using the HRP competition assay (Equation 1). With this approach, the second-order rate constant determined was 3.5 ± 0.1 × 10⁷ m−1 s−1 (Fig. 4, C and D), which is very similar to that obtained by monitoring fluorescence and to the second-order rate constant reported for the reaction of Prx2 with hydrogen peroxide (25, 26).
Kinetic simulations for the reaction of urate hydroperoxide with Prx1 and Prx2
To characterize the mechanism of the reaction of Prx with urate hydroperoxide (HOOU), we fitted our experimental data into two models, a three-step (A + B ↔ C → D → E) and a two-step (A + B → C → D) sequential reactions (Models 1 and 2) by GEPASI.
Model 1.

Model 2.

In these simulations, all the rate constants were allowed to float. A better fit was obtained with the three-step model (Model 1) for Prx2 (Fig. 5, A and B; supplemental Table S1). In contrast, both models fitted quite well for Prx1, using either urate hydroperoxide (Fig. 5, C and D; supplemental Table S2) or hydrogen peroxide (Fig. 5, E and F; supplemental Table S3). Even though no difference between the two models was detected for Prx1, the rate constant for the first rapid reaction between Prx1 and urate hydroperoxide matched better the experimental data when fitted to Model 1 (supplemental Table S2).
Figure 5.
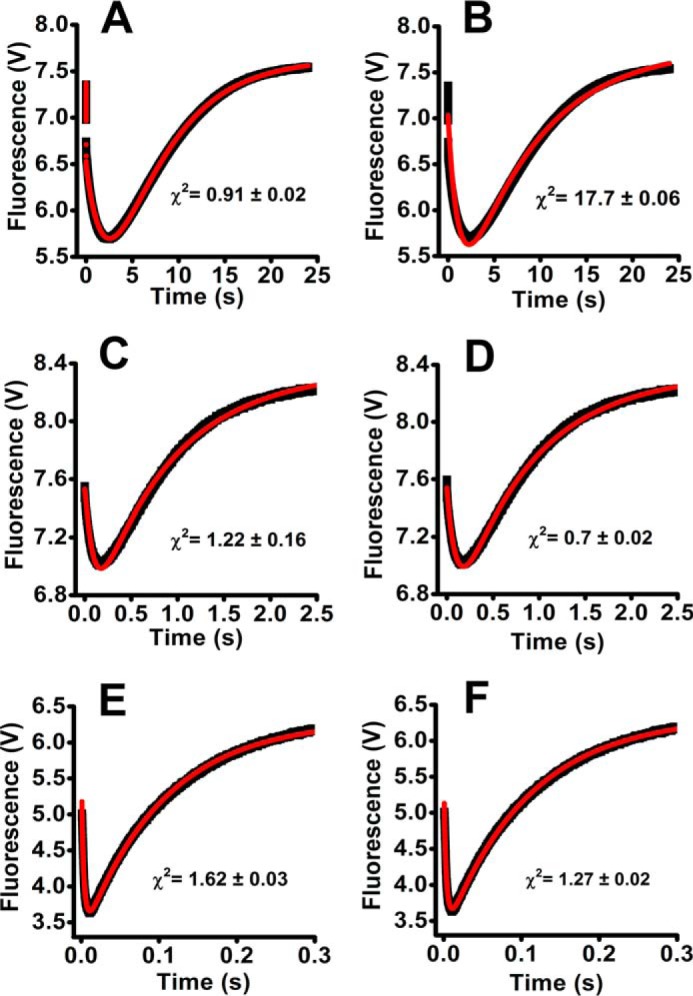
Fitting of Prx fluorescence changes during the reaction with urate hydroperoxide or hydrogen peroxide simulated as Model 1 or Model 2. The reaction mechanisms proposed in Model 1 (A, C, and E) and Model 2 (B, D, and F) are depicted under “Results.” GEPASI (3.0) was used to perform the simulation and fitting of the experimental data. Experimental (black lines) and simulated data (red lines) are represented for the reaction of 2 μm Prx2 with 33 μm urate hydroperoxide (A and B); 5 μm Prx1 with 37.5 μm urate hydroperoxide (C and D); 5 μm Prx1 with 2.5 μm hydrogen peroxide (E and F).
The simulations indicated that Model 1 reflects better the reaction of the urate hydroperoxide with Prx2. This model allowed calculation of the rate constant of the oxidation of the peroxidatic thiol to sulfenic acid (k2) (supplemental Table S1).
Analyses of Prx hyperoxidation by urate hydroperoxide
To confirm that the slow fluorescence increase was due to disulfide bond formation rather than hyperoxidation, both Prx1 and Prx2 enzymes were incubated with an excess of urate hydroperoxide for 5 min. Then the mixtures were treated with an excess of DTT, and the amount of sulfhydryl groups in Prx was determined. It is well established that DTT is able to reduce disulfide bond but not sulfinic (−SO2H) or sulfonic acid (−SO3H). Nearly all free thiols were recovered after DTT incubation (Fig. 6, A and B), showing that urate hydroperoxide, at the concentrations used in the kinetic assays, did not cause Prx hyperoxidation. We performed the same experiments using the His tag-free Prx2 and obtained similar results (supplemental Fig. S2). Employing a specific anti-Prx-SO2/3 antibody, hyperoxidation was found only at high concentrations of urate hydroperoxide (Fig. 6C). Hydrogen peroxide was used as a positive control, and in this case, Prx2 was much more sensitive than Prx1 to the hyperoxidation (Fig. 6C).
Figure 6.
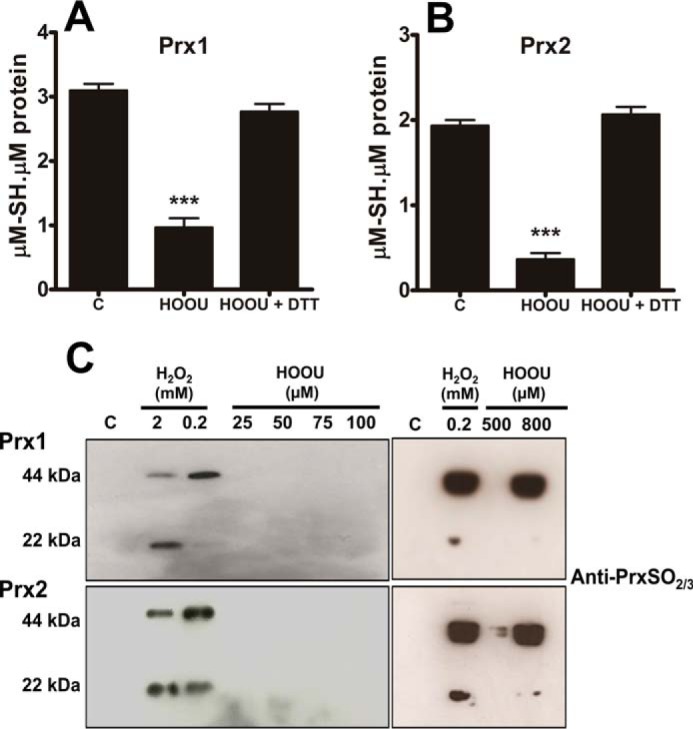
Analysis of Prx hyperoxidation by urate hydroperoxide and hydrogen peroxide. Prx1 (5 μm) (A) and Prx2 (5 μm) (B) were incubated in 50 mm sodium phosphate buffer, pH 7.4, with 220 μm urate hydroperoxide for 5 min at room temperature. Afterward, DTT was added in 3× molar excess per thiol and incubated for 2 h at 37 °C. Thiols were quantified by DTNB before and after reduction. Statistical analyses were performed by one-way analyses of variance (ANOVA); ***, p < 0.001 followed by Bonferroni's test, when compared with control group. C, control; HOOU, urate hydroperoxide. Each bar represents the mean ± S.E. of three independent experiments. C, enzymes were incubated with different concentrations of peroxides in 50 mm sodium phosphate buffer, pH 7.4, for 5 min at room temperature. The samples were separated in a non-reducing SDS-polyacrylamide gel, transferred to a polyvinylidene difluoride, and probed with an antibody to Prx-SO2/3. These results are representative of three experiments.
Oxidation of Prx2 from human red blood cells by urate hydroperoxide and hydrogen peroxide
Incubation of urate hydroperoxide or hydrogen peroxide with human red blood cells significantly oxidized Prx2 to the intermolecular disulfide species (Fig. 7, A, C, and D). Interestingly, the intermolecular disulfide dimer of Prx2 was also present in sample supernatants, and its amount increased on incubation of erythrocytes with hydrogen peroxide or urate hydroperoxide (Fig. 7, B and E). Such increase was not due to disruption of the plasma membrane because no hemolysis was detectable (Fig. 7F).
Figure 7.

Oxidation of Prx2 in erythrocytes by urate hydroperoxide or hydrogen peroxide. Human erythrocytes (1 × 10⁷) were incubated in 10 mm PBS, pH 7.4, plus 5 mm glucose with acetonitrile evaporated MP, 200 μm hydrogen peroxide, or 200 μm urate hydroperoxide for 10 min at 37 °C. Western blot analysis of Prx2 from erythrocyte homogenates (100 μg/lane) (A) and supernatant (10 μg/lane) (B) in non-reducing SDS-polyacrylamide gel. Reduced and disulfide forms of Prx ran as monomers and dimers in non-reducing SDS-polyacrylamide gel, respectively. Semi-quantitative band intensity of Prx2 monomer (C) and homodimer (D) from cell pellet was normalized by α-tubulin. E, band intensity of Prx2 homodimer in supernatants. F, absorbance of human erythrocyte supernatants (107) were measured at 405 nm and compared with the positive control (0.1% SDS). The percentage of hemolysis in the samples was relative to the positive control (100%). Each bar represents the mean ± S.D. of three independent experiments. Statistical analyses were performed by one-way analyses of variance (ANOVA); ***, p < 0.001 followed by Bonferroni's test, when compared with control group. C, control; HOOU, urate hydroperoxide. These results are representative of three experiments.
Discussion
Urate hydroperoxide is an oxidant generated by one-electron oxidation of uric acid with subsequent addition of superoxide anion radical to the urate free radical (23). Inflammatory peroxidases rapidly oxidize uric acid in the presence of hydrogen peroxide (19, 20). Therefore, we can expect a substantial amount of urate hydroperoxide in inflammatory sites, mainly at the vascular tissue, where urate accumulates. Urate hydroperoxide can be reduced by glutathione and methionine (23). However, it might react much faster with catalytic thiols in proteins.
Prx1 and Prx2 are important cytosolic antioxidants not only because of their abundance but also because of their high reactivity toward hydroperoxides (24, 28). Initially, we showed that an equimolar concentration of urate hydroperoxide was enough to fully oxidize both peroxidases to intermolecular disulfide (Fig. 1).
Next, we studied the kinetics of the reactions taking advantage of the redox-dependent changes in the fluorescence of 2-Cys Prxs because of the presence of a highly conserved tryptophan residue in their structures (31, 49, 50). For Prx2, the biphasic fluorescence behavior (Figs. 2 and 5) fitted better to a three-step mechanism (Model 1), where the peroxide would first bind to the Prx before oxidizing the catalytic cysteine (Fig. 8). This mechanism was recently proposed for the reaction of AhpC (bacterial 2-Cys Prx) with hydrogen peroxide and organic peroxides (49). Transient changes in fluorescence allowed us to obtain the rate constants for individual steps in the reaction: the substrate-Prx binding (k1); substrate-Prx dissociation (k−1); and disulfide formation (k3). The main difference in the kinetics of the reaction of urate hydroperoxide with Prx1 and Prx2 was the large y-intercept in the linear fitting of the first fast reaction (Table 1) and the linear second slow decrease in fluorescence that was observed in Prx2 but not in Prx1. In addition to these kinetic differences, our simulation data did not allow us to distinguish whether Prx1 forms or not a complex with the peroxide before oxidation to sulfenic acid (Fig. 5E).
Figure 8.

Hypothetical mechanism for the oxidation of Prx2 by urate hydroperoxide.
Table 1.
Summary of rate constants of experimental and simulated data of the reaction of Prx2 and Prx1 with HOOU
The simulated values in this table represent the reaction of 10-fold excess of HOOU over enzyme. The complete simulation data are given in supplemental Tables S1 and S2.
| k1 | k−1 | k2 | k3 | ||
|---|---|---|---|---|---|
| m−1 s−1 | s−1 | s−1 | s−1 | ||
| Prx2 | Experimental data | (2.26 ± 0.13) × 106 | 99.0 ± 3.0 | 0.31 ± 0.01 | |
| Model 1a | (9.43 ± 0.01) × 105 | 102.0 ± 8.9 | 2.87 ± 410 | 0.41 ± 0.03 | |
| Model 2a | (1.14 ± 0.18) × 104 | 0.12 ± 0.01 | |||
| Prx1 | Experimental data | (4.90 ± 0.47) × 105 | 1.47 ± 2.12 | 14.9 ± 1.01 | |
| Model 1b | (1.77 ± 0.79) × 105 | 0.4 ± 1.50 | 1.82 ± 0.69 | 33.26 ± 7.75 | |
| Model 2b | (3.72 ± 0.02) × 104 | 10.68 ± 0.14 |
a Prx2 (2 μm) and HOOU (20 μm) were used.
b Prx1 (5 μm) and HOOU (50 μm) were used.
Comparing the kinetics of the reaction of Prx 1 with different peroxides, the enzyme is clearly more efficient in reducing hydrogen peroxide than the bulkier urate hydroperoxide. The second-order rate constant was 2 orders of magnitude higher for hydrogen peroxide (3.8 ± 0.15 × 10⁷ m−1 s−1) than for urate hydroperoxide (4.90 ± 0.47 × 10⁵ m−1 s−1). Our results showed that the second-order rate constant of the reaction of hydrogen peroxide with Prx1 is very similar to that with Prx2 (0.2–1.3 × 10⁸ m−1 s−1) (25, 26), AhpC (49), and Tsa1 (31).
Another remarkable difference between Prx2 and Prx1 was the rate constant for the disulfide bond formation (k3) (Table 1). Disulfide bond formation was ∼50-fold slower in Prx2 than in Prx1. As expected, the rate constant for disulfide bond formation was independent of the nature of the peroxide. For Prx1, the rate constant for disulfide bond formation was 14.9 and 9 s−1 for the reaction with urate hydroperoxide and hydrogen peroxide, respectively. For Prx2, these rate constants were, respectively, 0.31 and 0.25 s−1 (Tables 1 and 2). Of relevance, the rate constants for disulfide bond formation were identical for His-tagged and His-tagged free Prx2 (data not shown). These values are lower than those found by indirect competition assay using catalase (35).
Table 2.
Summary of rate constants of the reaction of Prx2 and Prx1 with H2O2
| k1 | k3 | |
|---|---|---|
| m−1 s−1 | s−1 | |
| Prx2 | 0.2–1.3 × 10⁸a | 0.25 ± 0.01 |
| Prx1 | (3.80 ± 0.15) × 107 | 9.0 ± 0.2 |
Disulfide bond formation and hyperoxidation are two competing reactions that have the sulfenic acid as a common intermediate. Therefore, the slower rate constant for the disulfide bond formation is associated with a higher susceptibility to hyperoxidation (35, 51). In agreement, we found that Prx2 was more susceptible than Prx1 to hyperoxidation by both hydrogen peroxide and urate hydroperoxide (Fig. 6C). Accordingly, a higher Prx2 sensitivity to hyperoxidation has been reported for both recombinant and cell lysate native protein (52, 53).
It is noteworthy to mention that small structural changes in Prxs cause profound alterations in kinetics. We found that the mutation of the resolving cysteine in Prx1 decreased the rate constant of the reaction with urate hydroperoxide by 10-fold. Native Prxs are in equilibrium between fully folded and locally unfolded forms. The fully folded form is the conformational transition that first reacts with hydrogen peroxide. A previous study showed that single mutation of the resolving cysteine favors the locally unfolded conformation and decreases the catalytic performance of Prx (54).
Peroxiredoxin 2 is the third most abundant protein in red blood cells and is important to maintain erythrocyte redox homeostasis (55). Erythrocyte Prx2 is highly sensitive to increases in hydrogen peroxide produced by neutrophils and has been proposed as a real-time marker of systemic neutrophil activation (56). In this study we found that urate hydroperoxide oxidizes erythrocyte Prx2 to the same extent as hydrogen peroxide (Fig. 7). Because uric acid is oxidized by neutrophils in plasma (19), the oxidation of erythrocytic Prx2 may also indicate the presence of urate hydroperoxide.
Interestingly, part of the oxidized Prx2 homodimer was released from erythrocytes. This effect was not provoked by cellular lysis, once no hemoglobin was detected in supernatant fractions. The efflux of intracellular 2-Cys Prx was evidenced in embryonic kidney (HEK) and monocytic cells and apparently involves redox-dependent signaling mechanisms (57). In addition, human and mouse macrophages release oxidized Prx2 and Prx1 after inflammatory stimuli (58) and in atherosclerosis (59). Our results indicate the erythrocytes also release Prx2 upon oxidative insults.
In summary, this study shows that Prx1 and Prx2 might reduce urate hydroperoxide physiologically. Peroxiredoxins are emerging as key intermediates in redox signaling mainly by transferring their oxidizing equivalents to other redox-sensitive proteins (46, 47), modulating cell response and function. Because urate hydroperoxide is formed in inflammatory sites, the oxidation of Prxs by this oxidant may be a key event in the progression of inflammation.
Experimental procedures
Urate hydroperoxide synthesis and purification
Urate hydroperoxide was synthesized as described previously (23). A urate stock solution (20 mm) was prepared in 40 mm NaOH, and riboflavin (500 μm) was prepared in phosphate buffer (20 mm, pH 6.0). The reaction was carried out in a total volume of 4 ml in phosphate buffer (20 mm, pH 6.0) under UVA (365 nm) irradiation. The final concentration of urate and riboflavin was 1.5 and 0.1 mm, respectively. The UVA light source was equipped with six UVA lamps, 15 milliwatts and 2.2 milliwatts/cm2 (GE Healthcare, Novatecnica Campinas, Brasil). The reaction was performed with continuous mixing at a controlled temperature (20 °C). All solutions were stirred with Chelex (Sigma) for at least 1 h to remove any trace metal ions. The products generated by photo-oxidation were separated in a Shimadzu HPLC system (Tokyo, Japan) with two pumps LC-6AD, manual injector CTO-10A, UV detector UV SPD-20A, system controller CBM-20A connected with a computer with LC solution software. The stationary phase was a preparative TSK-Gel amide-80 column (21.5 mm × 30 cm, 10-μm particle size; Tosoh Bioscience, Tokyo, Japan). The mobile phase was 10 mm ammonium acetate, pH 6.8 (solvent A), and acetonitrile (solvent B). The separation was performed in an isocratic mode using 60% solvent B for 30 min with flow rate of 4.0 ml/min. Immediately before injection, the reaction was diluted (40% reaction and 60% acetonitrile), and 7 ml was injected into the HPLC system. Approximately 4 ml of urate hydroperoxide were collected from HPLC and exposed to inert gas to evaporate acetonitrile. To guarantee the maximal removal of the organic solvent, a system equipped with a kitasato flask connected to a vacuum bomb was used. The remaining acetonitrile was quantified by gas chromatography and showed a maximum of 0.07% (data not shown). Control samples were always performed in the presence of mobile phase submitted to acetonitrile evaporation.
Urate hydroperoxide and hydrogen peroxide measurement
Concentration of stock solutions of H2O2 were determined spectrophotometrically at 240 nm (ϵ240 nm = 43.6 m−1 cm−1). The concentration of urate hydroperoxide was measured by its absorbance at 308 nm (ϵ308 nm = 6,540 m−1 cm−1). The concentration of urate hydroperoxide determined by UV absorbance was always confirmed by ferrous oxidation xylenol orange (FOX) reaction as described previously (23, 60).
Peroxiredoxins expression and purification
For expression of recombinant proteins, the plasmids pET17b (wild type and C83S/C173S hPrx1) (61, 62) and pET28a (hPrx2) (63) were placed in a bucket of electroporation along with the Escherichia coli BL21(DE3). The bucket was subjected to a pulse of voltage in the Gene Pulser Electroporation System II (Bio-Rad), set at 2.5 kV and 25 microfarads of capacitance. After the voltage pulse, the cells were suspended in 1 ml of LB medium and left under agitation at 37 °C for 1 h. After this time, the cells were plated in ampicillin selective agar LB medium and incubated overnight at 37 °C. The vector positive bacteria were selected by adding ampicillin to the medium and left overnight at 37 °C. At OD600 nm = 0.6, the medium was incubated with 1 mm isopropyl 1-thio-β-d-galactopyranoside for 3 h under agitation. After gene induction, cells were pelleted by centrifugation and suspended in buffer A (25 mm Tris-HCl, pH 8.8, 1 mm EDTA, and 2 mm DTT for Prx1 and 50 mm Tris-HCl, pH 8.8, 100 mm NaCl, 10 mm imidazole, and glycerol 10% for Prx2) containing 0.1 mm PMSF. The cells were then subjected to 20-s sonication cycles (40 s rests) in a total time of 5 min, in a Branson Sonifier 450 Digital (Branson Ultrasonics Corp., Danbury, CT). The homogenate was centrifuged at 15,000 rpm for 45 min at 4 °C, and the supernatant was collected for protein purification.
The purification of wild-type and C83S/C173S mutant Prx1 was performed in accordance with the method previously described (62) with minor modifications. The proteins were separated in an anionic exchange Mono Q column (GE Healthcare) coupled to the FPLC (AKTA, GE Healthcare, General Electric Co., Chalfont St. Giles, UK) with the automatic collector Frac-900. The mobile phase gradient ranged from 0 to 500 mm NaCl. Histidine-tagged Prx2 was purified using a HisTrap HP cobalt column (GE Healthcare) and a peristaltic pump P1 (GE Healthcare, General Electric Co., Chalfont St. Giles, UK). The coupling buffer contained 50 mm Tris-HCl, pH 8.8, 100 mm NaCl, and 10 mm imidazole and the elution buffer 50 mm Tris-HCl, pH 8.8, 100 mm NaCl, and imidazole gradient 10–500 mm. The collected fractions were separated in a SDS-PAGE to evaluate protein purity degree. The fractions with higher purity degree were reunited and concentrated with an Aminco Ultra 10-kDa (Millipore Corp.). For His tag removal, the factor Xa (Promega) protease was used in the recommended reaction buffer (20 mm Tris-HCl, pH 7.4, and 0.1 m NaCl) at 4 °C overnight. Protein concentration was determined by the Bradford assay (64).
Protein thiol reduction and quantification
The proteins were treated with DTT (3-fold excess/thiol) in 50 mm sodium phosphate buffer, pH 7.4, 150 mm NaCl and 100 μm diethylenetriaminepentaacetic acid (DTPA) for 2 h at 37 °C. The excess of DTT was filtered in an Aminco Ultra 10-kDa (Merck Millipore, Darmstadt, Germany). Protein solutions were stocked in oxygen-free atmosphere. To quantify the free thiol groups, 5 μm samples were incubated with 10 μl of DTNB 10 mm, 2 μl of SDS, and 20% glycine buffer (100 mm, pH 8.5) to a final volume of 120 μl for 15 min. The yellow product, 2-nitro-5-thiobenzoato, was monitored at 412 nm (ϵ412 nm = 14,150 m−1 cm−1) (65). The proteins were used only if thiol contents were between 3 and 4 thiols/protein in WTPrx1, 1 and 2 thiols/protein in C83S/C173S Prx1, and 2 and 3 thiols/protein in Prx2.
Oxidation of Prx1 and Prx2 by urate hydroperoxide
Prx1 (2 μm, ∼3.7 μmol of SH·μmol of protein−1) and Prx2 (2 μm, ∼2.3 μmol of SH·μmol of protein−1) were incubated with increasing concentrations of urate hydroperoxide (2, 5, 10, 20, 50, and 100 μm) at room temperature for 5 min in 50 mm sodium phosphate buffer, pH 7.4. Buffer solution contained 100 μm DTPA and was previously treated with 10 μg/ml catalase to remove any trace of hydrogen peroxide (35). After 10 min, 30 mm NEM was added to block any remaining thiols. 2-Cys Prxs ran as monomer or disulfide bond dimer in non-reducing SDS-PAGE.
Kinetics of the oxidation of WTPrx1, Prx1C83S/C173S, and Prx2 by urate hydroperoxide and hydrogen peroxide
Oxidation of 2-Cys Prx enzymes were followed by intrinsic fluorescence changes (28, 31, 48, 49). Pre-reduced proteins (5 μm WTPrx1 ∼3.5 μmol of SH·μmol of protein−1; 5 μm Prx1C83S/C173S ∼1.5 μmol of SH·μmol of protein−1; and 2 μm Prx2 ∼2.5 μmol of SH·μmol of protein−1) were mixed with increasing concentrations of urate hydroperoxide or hydrogen peroxide in a stopped-flow instrument (Applied Photophysics SX18MV, Leatherhead, UK), excitation λ280 nm, emission above λ330 nm. The reactions were performed at 21 °C in 50 mm sodium phosphate buffer, pH 7.4, containing 100 μm DTPA. Buffer solution was previously treated with 10 μg/ml catalase to remove any trace hydrogen peroxide (35). An excess of urate hydroperoxide was used to follow a pseudo-first-order condition. Observed rate constants (kobs) for fluorescence decrease and increase were determined by fitting data to single exponential equations. The fittings were set from 2 to 20 ms for Prx2 and 2 to 200 ms for Prx1 in the case of the initial and rapid fluorescence decrease or from 5 to 25 s for Prx2 and from 0.05 to 0.6 s for Prx1 in the case of the − slow fluorescence returning. Because the rapid fluorescence decay in Prx1C83S/C173S was followed by a second slower decay, the kobs for this enzyme was better fitted with single exponential plus straight line equations.
The values of kobs obtained from the decreasing fluorescence were plotted against urate hydroperoxide concentrations, and the corresponding second-order rate constants were determined from the slope of these linear fittings. The plot of urate hydroperoxide concentration versus the kobs from the increase in fluorescence intensity was better fitted using a hyperbolic equation.
For the reaction between Prx1 and hydrogen peroxide, sub-stoichiometric concentrations of hydrogen peroxide were used to calculate the initial rates. The decay in protein fluorescence was monitored over time. Assuming that the initial fluorescence (V) corresponded to the total amount of reduced protein (PrxSH), we divided the fluorescence (V) by protein concentration (5 μm). To fit protein concentration versus time, less than 10% of the protein consumption was taken, allowing a proper initial rate calculation. The initial rates were plotted against hydrogen peroxide concentrations to obtain the second-order rate constant.
Competition kinetics
Competition kinetic was carried out to independently determine the rate constant for the reaction between Prx1 and hydrogen peroxide (30, 66). Briefly, a sub-stoichiometric concentration of hydrogen peroxide (4 μm) was incubated with horseradish peroxidase (HRP, 8 μm) in the absence or presence of Prx1 (2, 4, 6, 8, and 12 μm) in 50 mm phosphate buffer, pH 7.4, with 100 μm DTPA, at 22 °C. Compound I was monitored at 398 nm, and the kPrx1 was determined as shown in Equation 1.
| (Eq. 1) |
The fraction of inhibition (F) was calculated to each concentration of Prx1, and kHRP used was 1.7 × 10⁷ m−1 s−1 (66). The (F/1 − F)kHRP[HRP] was plotted versus Prx1 concentration and the second-order rate constant was calculate from the slope.
Kinetics simulations
The kinetic simulations were performed with Gepasi 3.30 software (67). The fluorescence data for the reactions of Prx2 (2 μm) with urate hydroperoxide (10, 15, 20, and 33 μm), Prx1 (5 μm) with urate hydroperoxide (37.5, 50, 60, and 70 μm), and Prx1 (5 μm) with hydrogen peroxide (2.5 μm) were loaded to GEPASI and modeled using a proper function describing two distinct kinetic models of either three (A + B ↔ C → D → E) or two (A + B → C → D) steps. Rate constants and other output factors were allowed to float within a broad range. The goodness of the fittings was determined by χ2.
Conversion of fluorescence to concentration was done by the sum (F) of the individual fluorescence contributions of all species involved in the reaction. For this purpose, the following equation was used: F = a × A + c × C + d × D + e × E for Model 1 and F = a × A + d × D + e × E for Model 2, where A, C, D, and E are concentrations of PrxSH, PrxSHOOU, PrxSOH, and PrxSSPrx, respectively; and a, c, d, and e are the respective proportionality constants, i.e. scaling factors that govern each species contribution to fluorescence. The proportionality constants a and e were determined by relating concentration to initial and final fluorescence respectively, assuming that only the reduced PrxSH and the disulfide species PrxSSPrx were present. The proportionality constants c and d were determined by fitting the data on GEPASI and allowing them to vary along with rate constants.
Recovering of Prx thiols after oxidation by urate hydroperoxide
Prx1 (2 μm, ∼3.5 μmol of SH × μmol of protein−1) and Prx2 (2 μm, ∼2.3 μmol of SH × μmol of protein−1) were incubated in 50 mm sodium phosphate buffer, pH 7.4, with 220 μm urate hydroperoxide at room temperature for 10 min. Then, a 3-fold excess of DTT/thiol was incubated for 2 h at 37 °C. Excess of DTT was removed by an Aminco Ultra 10-kDa (Merck Millipore, Darmstadt, Germany). The free thiols were quantified by the DTNB assay as above.
Analysis of Prx hyperoxidation
Prx1 (5 μm, 3.2 μmol of SH·μmol of protein−1) and Prx2 (5 μm, 2.0 μmol of SH·μmol of protein−1) were incubated with 0.2 or 2 mm hydrogen peroxide or 0.025–0.8 mm urate hydroperoxide in 50 mm sodium phosphate buffer, pH 7.4, for 5 min at room temperature. Samples were analyzed by non-reducing 12% SDS-polyacrylamide gel. Proteins were transferred to a polyvinylidene difluoride (PVDF) membrane (Bio-Rad) and probed with an antibody to Prx-SO2/3 (ab16951, 1:2000, Abcam, Cambridge, UK). An HRP-conjugated secondary antibody (PI2000, Vector Laboratories) was used to detect the chemiluminescence; bands were visualized by exposure to photographic film (GE Healthcare). The relative densitometry was assessed using the ImageJ software.
Oxidation of Prx2 from human erythrocytes
Blood from healthy volunteers was drawn into vacutainers containing EDTA. After plasma removal, erythrocytes were washed three times with ice-cold phosphate-buffered saline (PBS; 10 mm phosphate in 137 mm NaCl and 2.7 mm KCl, pH 7.4). The number of erythrocytes was determined using a Neubauer chamber. Erythrocytes (1 × 10⁷) were incubated with 200 μm hydrogen peroxide or urate hydroperoxide in 100 μl of PBS plus 5 mm glucose at 37 °C for 10 min. Control samples were always incubated with acetonitrile evaporated mobile phase (MP) as for urate hydroperoxide. Cells were lysed in ice-cold RIPA buffer (10 mm Tris, pH 7.5, 150 mm NaCl, 1% Nonidet P-40, 0,1% SDS, 1% sodium deoxycholate, 5 mm EDTA, 5 mm EGTA, 25 mm NaF, 1 mm Na3VO4) containing 30 mm NEM (68) and protease inhibitor mixture as instructed by manufacturer's recommendations (Roche Applied Science). Samples were analyzed by non-reducing 12% SDS-polyacrylamide gel. Proteins were transferred to a polyvinylidene difluoride (PVDF) membrane (Bio-Rad) and probed with an antibody to Prx2 (ab50862, 1:2000, Abcam, Cambridge, UK). An HRP-conjugated secondary anti-mouse antibody (PI2000, Vector Laboratories) was used to detected the chemiluminescence; bands were visualized by exposure to photographic film (GE Healthcare). The relative densitometry was assessed using the ImageJ software.
The hemolytic capacity of hydrogen peroxide and urate hydroperoxide was evaluated by absorbance intensity at the maximum absorption of hemoglobin λ = 405 nm. The absorbance intensity was compared with a sample containing 0.1% SDS, a positive control for erythrocyte lysis.
Author contributions
L. A. C. C. and F. C. M. conceived the study and wrote the manuscript. L. A. C. C. performed all experiments; D R. T. and F. C. M. contributed with kinetics experiments and simulation data analyses; J. C. T. Jr. contributed with simulation data analyses. S. V. A. and L. E. S. N. helped with recombinant proteins expression and purification. T. S. F. contributed with experiments in human erythrocytes. O. A., L. E. S. N., J. C. T. Jr., D R. T., F. C. M., and L. A. C. C. discussed all results and led the investigation.
Supplementary Material
Acknowledgments
We thank Dr. Gerardo Ferrer-Sueta and Dr. Madia Trujillo for scientific discussion on Prx catalytic mechanisms; Dr. Mauricio da Silva Baptista for the UV generator device; Dr. Christine C. Winterbourn and Dr. Moran Behar for the kind donation of the Prx2 and Prx1 plasmids; Dr. Paul Pace for helping with Prx expression protocols, and MSc. Alexandre L.B. Baccaro for assistance in acetonitrile quantification and removal.
This work was supported in part by Fundação de Amparo a Pesquisa do Estado de São Paulo, CEPID Redoxoma 2013/07937-8, Young Researcher 2011/18106-4, and Conselho Nacional de Pesquisa Tecnológica (CNPq) 472105/2012-4. The authors declare that they have no conflicts of interest with the contents of this article.
This article contains supplemental Figs. S1–S2 and Tables S1–S3.
- MPO
- myeloperoxidase
- LPO
- lactoperoxidase
- ANOVA
- analysis of variance
- Prx
- peroxiredoxin
- DTNB
- 5,5′-dithiobis(nitrobenzoic acid)
- DTPA
- diethylenetriaminepentaacetic acid
- NEM
- N-ethylmaleimide
- MP
- mobile phase.
References
- 1. Simic M. G., and Jovanovic S. V. (1989) Antioxidation mechanisms of uric acid. J. Am. Chem. Soc. 111, 5778–5782 [Google Scholar]
- 2. Oda M., Satta Y., Takenaka O., and Takahata N. (2002) Loss of urate oxidase activity in hominoids and its evolutionary implications. Mol. Biol. Evol. 19, 640–653 [DOI] [PubMed] [Google Scholar]
- 3. Ames B. N., Cathcart R., Schwiers E., and Hochstein P. (1981) Uric acid provides an antioxidant defense in humans against oxidant- and radical-caused aging and cancer: a hypothesis. Proc. Natl. Acad. Sci. U.S.A. 78, 6858–6862 [DOI] [PMC free article] [PubMed] [Google Scholar]
- 4. Becker B. F. (1993) Towards the physiological function of uric acid. Free Radic. Biol. Med. 14, 615–631 [DOI] [PubMed] [Google Scholar]
- 5. Domazou A. S., Zhu H., and Koppenol W. H. (2012) Fast repair of protein radicals by urate. Free Radic. Biol. Med. 52, 1929–1936 [DOI] [PubMed] [Google Scholar]
- 6. Johnson R. J., and Rideout B. A. (2004) Uric acid and diet–insights into the epidemic of cardiovascular disease. N. Engl. J. Med. 350, 1071–1073 [DOI] [PubMed] [Google Scholar]
- 7. Khosla U. M., Zharikov S., Finch J. L., Nakagawa T., Roncal C., Mu W., Krotova K., Block E. R., Prabhakar S., and Johnson R. J. (2005) Hyperuricemia induces endothelial dysfunction. Kidney Int. 67, 1739–1742 [DOI] [PubMed] [Google Scholar]
- 8. Nakagawa T., Kang D. H., Feig D., Sanchez-Lozada L. G., Srinivas T. R., Sautin Y., Ejaz A. A., Segal M., and Johnson R. J. (2006) Unearthing uric acid: an ancient factor with recently found significance in renal and cardiovascular disease. Kidney Int. 69, 1722–1725 [DOI] [PubMed] [Google Scholar]
- 9. Alderman M. H. (2007) Podagra, uric acid, and cardiovascular disease. Circulation 116, 880–883 [DOI] [PubMed] [Google Scholar]
- 10. Lotufo P. A., Baena C. P., Santos I. S., and Bensenor I. M. (2016) Serum uric acid and prehypertension among adults free of cardiovascular diseases and diabetes: baseline of the Brazilian Longitudinal Study of Adult Health (ELSA-Brasil). Angiology 67, 180–186 [DOI] [PubMed] [Google Scholar]
- 11. Sautin Y. Y., Nakagawa T., Zharikov S., and Johnson R. J. (2007) Adverse effects of the classic antioxidant uric acid in adipocytes: NADPH oxidase-mediated oxidative/nitrosative stress. Am. J. Physiol. Cell Physiol. 293, C584–C596 [DOI] [PubMed] [Google Scholar]
- 12. Santos C. X., Anjos E. I., and Augusto O. (1999) Uric acid oxidation by peroxynitrite: multiple reactions, free radical formation, and amplification of lipid oxidation. Arch. Biochem. Biophys. 372, 285–294 [DOI] [PubMed] [Google Scholar]
- 13. Filipe P., Haigle J., Freitas J., Fernandes A., Mazière J. C., Mazière C., Santus R., and Morlière P. (2002) Anti- and pro-oxidant effects of urate in copper-induced low-density lipoprotein oxidation. Eur. J. Biochem. 269, 5474–5483 [DOI] [PubMed] [Google Scholar]
- 14. Aruoma O. I., and Halliwell B. (1989) Inactivation of α1-antiproteinase by hydroxyl radicals. The effect of uric acid. FEBS Lett. 244, 76–80 [DOI] [PubMed] [Google Scholar]
- 15. Kittridge K. J., and Willson R. L. (1984) Uric-acid substantially enhances the free radical-induced inactivation of alcohol-dehydrogenase. FEBS Lett. 170, 162–164 [DOI] [PubMed] [Google Scholar]
- 16. Sautin Y. Y., and Johnson R. J. (2008) Uric acid: the oxidant-antioxidant paradox. Nucleosides Nucleotides Nucleic Acids 27, 608–619 [DOI] [PMC free article] [PubMed] [Google Scholar]
- 17. Schroder K., Zhou R., and Tschopp J. (2010) The NLRP3 inflammasome: a sensor for metabolic danger? Science 327, 296–300 [DOI] [PubMed] [Google Scholar]
- 18. Baldwin W., McRae S., Marek G., Wymer D., Pannu V., Baylis C., Johnson R. J., and Sautin Y. Y. (2011) Hyperuricemia as a mediator of the proinflammatory endocrine imbalance in the adipose tissue in a murine model of the metabolic syndrome. Diabetes 60, 1258–1269 [DOI] [PMC free article] [PubMed] [Google Scholar]
- 19. Meotti F. C., Jameson G. N., Turner R., Harwood D. T., Stockwell S., Rees M. D., Thomas S. R., and Kettle A. J. (2011) Urate as a physiological substrate for myeloperoxidase: implications for hyperuricemia and inflammation. J. Biol. Chem. 286, 12901–12911 [DOI] [PMC free article] [PubMed] [Google Scholar]
- 20. Seidel A., Parker H., Turner R., Dickerhof N., Khalilova I. S., Wilbanks S. M., Kettle A. J., and Jameson G. N. (2014) Uric acid and thiocyanate as competing substrates of lactoperoxidase. J. Biol. Chem. 289, 21937–21949 [DOI] [PMC free article] [PubMed] [Google Scholar]
- 21. Ihalin R., Loimaranta V., and Tenovuo J. (2006) Origin, structure, and biological activities of peroxidases in human saliva. Arch. Biochem. Biophys. 445, 261–268 [DOI] [PubMed] [Google Scholar]
- 22. Klebanoff S. J. (1991) Peroxidases in Chemistry and Biology in Myeloperoxidase: Occurrence and Biological Function (Everse J., Everse K. E., and Grisham M. B., eds) pp, 1–35, CRC Press, Boca Raton, FL [Google Scholar]
- 23. Patrício E. S., Prado F. M., da Silva R. P., Carvalho L. A., Prates M. V., Dadamos T., Bertotti M., Di Mascio P., Kettle A. J., and Meotti F. C. (2015) Chemical characterization of urate hydroperoxide, a pro-oxidant intermediate generated by urate oxidation in inflammatory and photoinduced processes. Chem. Res. Toxicol. 28, 1556–1566 [DOI] [PubMed] [Google Scholar]
- 24. Peskin A. V., Low F. M., Paton L. N., Maghzal G. J., Hampton M. B., and Winterbourn C. C. (2007) The high reactivity of peroxiredoxin 2 with H(2)O(2) is not reflected in its reaction with other oxidants and thiol reagents. J. Biol. Chem. 282, 11885–11892 [DOI] [PubMed] [Google Scholar]
- 25. Cox A. G., Peskin A. V., Paton L. N., Winterbourn C. C., and Hampton M. B. (2009) Redox potential and peroxide reactivity of human peroxiredoxin 3. Biochemistry 48, 6495–6501 [DOI] [PubMed] [Google Scholar]
- 26. Manta B., Hugo M., Ortiz C., Ferrer-Sueta G., Trujillo M., and Denicola A. (2009) The peroxidase and peroxynitrite reductase activity of human erythrocyte peroxiredoxin 2. Arch. Biochem. Biophys. 484, 146–154 [DOI] [PubMed] [Google Scholar]
- 27. Rhee S. G. (2016) Overview on Peroxiredoxin. Mol. Cells 39, 1–5 [DOI] [PMC free article] [PubMed] [Google Scholar]
- 28. Trujillo M., Clippe A., Manta B., Ferrer-Sueta G., Smeets A., Declercq J. P., Knoops B., and Radi R. (2007) Pre-steady state kinetic characterization of human peroxiredoxin 5: taking advantage of Trp84 fluorescence increase upon oxidation. Arch. Biochem. Biophys. 467, 95–106 [DOI] [PubMed] [Google Scholar]
- 29. Trujillo M., Ferrer-Sueta G., and Radi R. (2008) Kinetic studies on peroxynitrite reduction by peroxiredoxins. Methods Enzymol. 441, 173–196 [DOI] [PubMed] [Google Scholar]
- 30. Ogusucu R., Rettori D., Munhoz D. C., Netto L. E., and Augusto O. (2007) Reactions of yeast thioredoxin peroxidases I and II with hydrogen peroxide and peroxynitrite: rate constants by competitive kinetics. Free Radic. Biol. Med. 42, 326–334 [DOI] [PubMed] [Google Scholar]
- 31. Tairum C. A., Santos M. C., Breyer C. A., Geyer R. R., Nieves C. J., Portillo-Ledesma S., Ferrer-Sueta G., Toledo J. C. Jr, Toyama M. H., Augusto O., Netto L. E., and de Oliveira M. A. (2016) Catalytic Thr or Ser residue modulates structural switches in 2-Cys peroxiredoxin by distinct mechanisms. Sci. Rep. 6, 33133. [DOI] [PMC free article] [PubMed] [Google Scholar]
- 32. Rhee S. G., Woo H. A., Kil I. S., and Bae S. H. (2012) Peroxiredoxin functions as a peroxidase and a regulator and sensor of local peroxides. J. Biol. Chem. 287, 4403–4410 [DOI] [PMC free article] [PubMed] [Google Scholar]
- 33. Wood Z. A., Poole L. B., Hantgan R. R., and Karplus P. A. (2002) Dimers to doughnuts: redox-sensitive oligomerization of 2-cysteine peroxiredoxins. Biochemistry 41, 5493–5504 [DOI] [PubMed] [Google Scholar]
- 34. Hall A., Karplus P. A., and Poole L. B. (2009) Typical 2-Cys peroxiredoxins–structures, mechanisms and functions. FEBS J. 276, 2469–2477 [DOI] [PMC free article] [PubMed] [Google Scholar]
- 35. Peskin A. V., Dickerhof N., Poynton R. A., Paton L. N., Pace P. E., Hampton M. B., and Winterbourn C. C. (2013) Hyperoxidation of peroxiredoxins 2 and 3: rate constants for the reactions of the sulfenic acid of the peroxidatic cysteine. J. Biol. Chem. 288, 14170–14177 [DOI] [PMC free article] [PubMed] [Google Scholar]
- 36. Karplus P. A. (2015) A primer on peroxiredoxin biochemistry. Free Radic. Biol. Med. 80, 183–190 [DOI] [PMC free article] [PubMed] [Google Scholar]
- 37. Hanschmann E. M., Lönn M. E., Schütte L. D., Funke M., Godoy J. R., Eitner S., Hudemann C., and Lillig C. H. (2010) Both thioredoxin 2 and glutaredoxin 2 contribute to the reduction of the mitochondrial 2-Cys peroxiredoxin Prx3. J. Biol. Chem. 285, 40699–40705 [DOI] [PMC free article] [PubMed] [Google Scholar]
- 38. Peskin A. V., Pace P. E., Behring J. B., Paton L. N., Soethoudt M., Bachschmid M. M., and Winterbourn C. C. (2016) Glutathionylation of the active site cysteines of peroxiredoxin 2 and recycling by glutaredoxin. J. Biol. Chem. 291, 3053–3062 [DOI] [PMC free article] [PubMed] [Google Scholar]
- 39. Woo H. A., Jeong W., Chang T. S., Park K. J., Park S. J., Yang J. S., and Rhee S. G. (2005) Reduction of cysteine sulfinic acid by sulfiredoxin is specific to 2-cys peroxiredoxins. J. Biol. Chem. 280, 3125–3128 [DOI] [PubMed] [Google Scholar]
- 40. Jeong W., Park S. J., Chang T. S., Lee D. Y., and Rhee S. G. (2006) Molecular mechanism of the reduction of cysteine sulfinic acid of peroxiredoxin to cysteine by mammalian sulfiredoxin. J. Biol. Chem. 281, 14400–14407 [DOI] [PubMed] [Google Scholar]
- 41. Lee W., Choi K. S., Riddell J., Ip C., Ghosh D., Park J. H., and Park Y. M. (2007) Human peroxiredoxin 1 and 2 are not duplicate proteins: the unique presence of CYS83 in Prx1 underscores the structural and functional differences between Prx1 and Prx2. J. Biol. Chem. 282, 22011–22022 [DOI] [PubMed] [Google Scholar]
- 42. Neumann C. A., Krause D. S., Carman C. V., Das S., Dubey D. P., Abraham J. L., Bronson R. T., Fujiwara Y., Orkin S. H., and Van Etten R. A. (2003) Essential role for the peroxiredoxin Prdx1 in erythrocyte antioxidant defence and tumour suppression. Nature 424, 561–565 [DOI] [PubMed] [Google Scholar]
- 43. Lee T. H., Kim S. U., Yu S. L., Kim S. H., Park D. S., Moon H. B., Dho S. H., Kwon K. S., Kwon H. J., Han Y. H., Jeong S., Kang S. W., Shin H. S., Lee K. K., Rhee S. G., and Yu D. Y. (2003) Peroxiredoxin II is essential for sustaining life span of erythrocytes in mice. Blood 101, 5033–5038 [DOI] [PubMed] [Google Scholar]
- 44. Wood Z. A., Poole L. B., and Karplus P. A. (2003) Peroxiredoxin evolution and the regulation of hydrogen peroxide signaling. Science 300, 650–653 [DOI] [PubMed] [Google Scholar]
- 45. Winterbourn C. C., and Hampton M. B. (2015) Redox biology: signaling via a peroxiredoxin sensor. Nat. Chem. Biol. 11, 5–6 [DOI] [PubMed] [Google Scholar]
- 46. Sobotta M. C., Liou W., Stöcker S., Talwar D., Oehler M., Ruppert T., Scharf A. N., and Dick T. P. (2015) Peroxiredoxin-2 and STAT3 form a redox relay for H2O2 signaling. Nat. Chem. Biol. 11, 64–70 [DOI] [PubMed] [Google Scholar]
- 47. Jarvis R. M., Hughes S. M., and Ledgerwood E. C. (2012) Peroxiredoxin 1 functions as a signal peroxidase to receive, transduce, and transmit peroxide signals in mammalian cells. Free Radic. Biol. Med. 53, 1522–1530 [DOI] [PubMed] [Google Scholar]
- 48. Winterbourn C. C., and Peskin A. V. (2016) Kinetic approaches to measuring peroxiredoxin reactivity. Mol. Cells 39, 26–30 [DOI] [PMC free article] [PubMed] [Google Scholar]
- 49. Parsonage D., Nelson K. J., Ferrer-Sueta G., Alley S., Karplus P. A., Furdui C. M., and Poole L. B. (2015) Dissecting peroxiredoxin catalysis: separating binding, peroxidation, and resolution for a bacterial AhpC. Biochemistry 54, 1567–1575 [DOI] [PMC free article] [PubMed] [Google Scholar]
- 50. König J., Lotte K., Plessow R., Brockhinke A., Baier M., and Dietz K. J. (2003) Reaction mechanism of plant 2-Cys peroxiredoxin. Role of the C terminus and the quaternary structure. J. Biol. Chem. 278, 24409–24420 [DOI] [PubMed] [Google Scholar]
- 51. Haynes A. C., Qian J., Reisz J. A., Furdui C. M., and Lowther W. T. (2013) Molecular basis for the resistance of human mitochondrial 2-cys peroxiredoxin 3 to hyperoxidation. J. Biol. Chem. 288, 29714–29723 [DOI] [PMC free article] [PubMed] [Google Scholar]
- 52. Seo J. H., Lim J. C., Lee D. Y., Kim K. S., Piszczek G., Nam H. W., Kim Y. S., Ahn T., Yun C. H., Kim K., Chock P. B., and Chae H. Z. (2009) Novel protective mechanism against irreversible hyperoxidation of peroxiredoxin: Nα-terminal acetylation of human peroxiredoxin II. J. Biol. Chem. 284, 13455–13465 [DOI] [PMC free article] [PubMed] [Google Scholar]
- 53. Cox A. G., Pearson A. G., Pullar J. M., Jönsson T. J., Lowther W. T., Winterbourn C. C., and Hampton M. B. (2009) Mitochondrial peroxiredoxin 3 is more resilient to hyperoxidation than cytoplasmic peroxiredoxins. Biochem. J. 421, 51–58 [DOI] [PMC free article] [PubMed] [Google Scholar]
- 54. Perkins A., Nelson K. J., Williams J. R., Parsonage D., Poole L. B., and Karplus P. A. (2013) The sensitive balance between the fully folded and locally unfolded conformations of a model peroxiredoxin. Biochemistry 52, 8708–8721 [DOI] [PMC free article] [PubMed] [Google Scholar]
- 55. Low F. M., Hampton M. B., and Winterbourn C. C. (2008) Peroxiredoxin 2 and peroxide metabolism in the erythrocyte. Antioxid. Redox Signal. 10, 1621–1630 [DOI] [PubMed] [Google Scholar]
- 56. Bayer S. B., Maghzal G., Stocker R., Hampton M. B., and Winterbourn C. C. (2013) Neutrophil-mediated oxidation of erythrocyte peroxiredoxin 2 as a potential marker of oxidative stress in inflammation. FASEB J. 27, 3315–3322 [DOI] [PubMed] [Google Scholar]
- 57. Mullen L., Hanschmann E. M., Lillig C. H., Herzenberg L. A., and Ghezzi P. (2015) Cysteine oxidation targets peroxiredoxins 1 and 2 for exosomal release through a novel mechanism of redox-dependent secretion. Mol. Med. 21, 98–108 [DOI] [PMC free article] [PubMed] [Google Scholar]
- 58. Salzano S., Checconi P., Hanschmann E. M., Lillig C. H., Bowler L. D., Chan P., Vaudry D., Mengozzi M., Coppo L., Sacre S., Atkuri K. R., Sahaf B., Herzenberg L. A., Herzenberg L. A., Mullen L., and Ghezzi P. (2014) Linkage of inflammation and oxidative stress via release of glutathionylated peroxiredoxin-2, which acts as a danger signal. Proc. Natl. Acad. Sci. U.S.A. 111, 12157–12162 [DOI] [PMC free article] [PubMed] [Google Scholar]
- 59. Madrigal-Matute J., Fernandez-Garcia C. E., Blanco-Colio L. M., Burillo E., Fortuño A., Martinez-Pinna R., Llamas-Granda P., Beloqui O., Egido J., Zalba G., and Martin-Ventura J. L. (2015) Thioredoxin-1/peroxiredoxin-1 as sensors of oxidative stress mediated by NADPH oxidase activity in atherosclerosis. Free. Radic. Biol. Med. 86, 352–361 [DOI] [PubMed] [Google Scholar]
- 60. Woodward J. J. (1994) The effects of thiol reduction and oxidation on the inhibition of NMDA-stimulated neurotransmitter release by ethanol. Neuropharmacology 33, 635–640 [DOI] [PubMed] [Google Scholar]
- 61. Kang S. W., Chae H. Z., Seo M. S., Kim K., Baines I. C., and Rhee S. G. (1998) Mammalian peroxiredoxin isoforms can reduce hydrogen peroxide generated in response to growth factors and tumor necrosis factor-α. J. Biol. Chem. 273, 6297–6302 [DOI] [PubMed] [Google Scholar]
- 62. Engelman R., Weisman-Shomer P., Ziv T., Xu J., Arnér E. S., and Benhar M. (2013) Multilevel regulation of 2-Cys peroxiredoxin reaction cycle by S-nitrosylation. J. Biol. Chem. 288, 11312–11324 [DOI] [PMC free article] [PubMed] [Google Scholar]
- 63. Nagy P., Karton A., Betz A., Peskin A. V., Pace P., O'Reilly R. J., Hampton M. B., Radom L., and Winterbourn C. C. (2011) Model for the exceptional reactivity of peroxiredoxins 2 and 3 with hydrogen peroxide: a kinetic and computational study. J. Biol. Chem. 286, 18048–18055 [DOI] [PMC free article] [PubMed] [Google Scholar]
- 64. Bradford M. M. (1976) A rapid and sensitive method for the quantification of microgram quantities of protein utilizing the principle of protein-dye binding. Anal. Biochem. 72, 248–254 [DOI] [PubMed] [Google Scholar]
- 65. Riddles P. W., Blakeley R. L., and Zerner B. (1979) Ellman's reagent: 5,5′-dithiobis(2-nitrobenzoic acid)–a reexamination. Anal. Biochem. 94, 75–81 [DOI] [PubMed] [Google Scholar]
- 66. Toledo J. C. Jr., Audi R., Ogusucu R., Monteiro G., Netto L. E., and Augusto O. (2011) Horseradish peroxidase compound I as a tool to investigate reactive protein-cysteine residues: from quantification to kinetics. Free Radic. Biol. Med. 50, 1032–1038 [DOI] [PubMed] [Google Scholar]
- 67. Mendes P. (1997) Biochemistry by numbers: simulation of biochemical pathways with Gepasi 3. Trends Biochem. Sci. 22, 361–363 [DOI] [PubMed] [Google Scholar]
- 68. Low F. M., Hampton M. B., Peskin A. V., and Winterbourn C. C. (2007) Peroxiredoxin 2 functions as a noncatalytic scavenger of low-level hydrogen peroxide in the erythrocyte. Blood 109, 2611–2617 [DOI] [PubMed] [Google Scholar]
Associated Data
This section collects any data citations, data availability statements, or supplementary materials included in this article.