

Abstract
Scap is a polytopic protein of endoplasmic reticulum (ER) membranes that transports sterol regulatory element-binding proteins to the Golgi complex for proteolytic activation. Cholesterol accumulation in ER membranes prevents Scap transport and decreases cholesterol synthesis. Previously, we provided evidence that cholesterol inhibition is initiated when cholesterol binds to loop 1 of Scap, which projects into the ER lumen. Within cells, this binding causes loop 1 to dissociate from loop 7, another luminal Scap loop. However, we have been unable to demonstrate this dissociation when we added cholesterol to isolated complexes of loops 1 and 7. We therefore speculated that the dissociation requires a conformational change in the intervening polytopic sequence separating loops 1 and 7. Here we demonstrate such a change using a protease protection assay in sealed membrane vesicles. In the absence of cholesterol, trypsin or proteinase K cleaved cytosolic loop 4, generating a protected fragment that we visualized with a monoclonal antibody against loop 1. When cholesterol was added to these membranes, cleavage in loop 4 was abolished. Because loop 4 is part of the so-called sterol-sensing domain separating loops 1 and 7, these results support the hypothesis that cholesterol binding to loop 1 alters the conformation of the sterol-sensing domain. They also suggest that this conformational change helps transmit the cholesterol signal from loop 1 to loop 7, thereby allowing separation of the loops and facilitating the feedback inhibition of cholesterol synthesis. These insights suggest a new structural model for cholesterol-mediated regulation of Scap activity.
Keywords: cholesterol regulation, cholesterol-binding protein, conformational change, membrane lipid, membrane protein
Introduction
A membrane protein called Scap controls cholesterol homeostasis in animal cells. Scap facilitates the proteolytic activation of sterol regulatory element-binding proteins (SREBPs),6 transcription factors that activate the genes encoding all of the enzymes required for synthesis of cholesterol and unsaturated fatty acids and their uptake from circulating plasma LDL (2). Scap is also the cholesterol sensor that turns off SREBP processing when cellular cholesterol levels are too high. Our laboratory has made recent progress in understanding the mechanism for this cholesterol regulation through a delineation of the conformational changes cholesterol produces when it binds to Scap (1, 3).
Scap is a polytopic membrane protein with eight transmembrane helices that is synthesized on endoplasmic reticulum (ER) membranes (4). The carboxyl-terminal domain of Scap projects into the cytosol, where it binds to the cytosolic regulatory domain of SREBPs (5). Like Scap, SREBPs are synthesized on ER-bound ribosomes. Immediately after their synthesis, SREBPs bind to Scap. When ER cholesterol levels are low, Scap serves as the binding site for coat protein complex II (COPII) proteins that incorporate the Scap/SREBP complex into COPII-coated vesicles that move to the Golgi (6). There the SREBPs are processed proteolytically to release their active transcription factor domains, which enter the nucleus, where they activate transcription of the lipid biosynthetic genes.
When ER cholesterol levels rise above a sharp threshold of 5% of ER membrane lipids, the cholesterol binds to Scap, causing a conformational change that has two consequences: it allows Scap to bind to Insig proteins, which anchor the Scap-SREBP complex in the ER (7), and it obscures the binding site for COPII proteins (6). As a result, the Scap-SREBP complex fails to reach the Golgi, and transcription of the lipid biosynthetic genes declines. The cholesterol-induced conformational change in Scap can be monitored by a change in the digestion pattern of Scap when sealed ER vesicles are treated with trypsin (1, 8).
Fig. 1A shows a diagram of the membrane domain of hamster Scap (4). It is comprised of eight transmembrane (TM) segments connected by three loops that are less than 15 amino acids in size and four larger loops—loops 1, 4, 6, and 7. The portion of Scap between the end of luminal loop 1 and the beginning of cytosolic loop 6 is designated the sterol-sensing domain (9).
Figure 1.

Two protease-protected fragments of hamster Scap. A, membrane topology of Scap. Shown in purple is a protease-protected fragment recognized by the monoclonal antibody IgG-7G5 (anti-loop 1). The potential trypsin cleavage sites at lysine and arginine in this fragment (K and R) are highlighted in white. Shown in green is a previously described protease-protected fragment recognized by monoclonal IgG-9D5 (anti-loop 7) (1). Trypsin cleavage sites that generate this fragment (R) are highlighted. The N-linked glycosylation site (residue 263) is highlighted in blue. The MELADL sequence in loop 6 that directs Scap to COPII-coated vesicles is highlighted in red. Two mutant residues (Y234A and Y640S) that prevent binding of loop 1 to loop 7 are highlighted in yellow. B, amino acid sequence of the cytosolic N terminus, loop 2, and loop 4 of hamster Scap. Arginine and lysine residues (potential trypsin cleavage sites) are shown in red. Arrows denote the sterol-inhibitable sites of trypsin or proteinase K cleavage.
Previously, we provided evidence that loop 1 and loop 7 bind to each other in cholesterol-depleted ER membranes (8, 10). Hereafter, we designate this conformation the closed state of Scap. When cholesterol builds up in the membrane, it binds to loop 1 and causes loop 1 to dissociate from loop 7, creating a different conformation, which we designate the open state of Scap. The switch from closed to open states is accompanied by a change in the conformation of cytosolic loop 6, which contains the hexapeptide (MELADL) that binds COPII proteins. Because of this conformational change, COPII proteins can no longer bind to the MELADL sequence (6).
The conformational change in loop 6 is detected by treating sealed ER membrane vesicles with trypsin, which cleaves only the cytosolic loops. This step is followed by SDS-PAGE and blotting with a monoclonal antibody against luminal loop 7, which is protected from trypsin cleavage in the impermeable vesicles (1). When cholesterol-depleted membranes are digested with trypsin, cleavage occurs at arginine 496 in loop 6 and a cluster of arginines at 747–750, generating a protected peptide of 251–254 amino acids that is detected by blotting with IgG-9D5, a monoclonal antibody that we designate anti-loop 7 (Fig. 1A). When the membranes are enriched with cholesterol, arginine 505 in loop 6 is exposed. Trypsin cleavage at this residue generates a protected peptide that is ∼10 amino acids shorter (1). This change in the conformation of loop 6 is coordinated with the dissociation of loop 1 from loop 7, which is caused by binding of cholesterol to loop 1 (8, 11). The change from the closed to the open state induces the binding of Insig to Scap, an event that appears to stabilize the open state.
In this study, we sought to detect other conformational changes in Scap that are induced during the switch from the closed to the open state. Using a recently produced monoclonal antibody directed to an epitope in lumenal loop 1 (10), we explored new regions of Scap that are differentially protected from protease digestion in the absence and presence of cholesterol. The results allow us to propose a new structural model for the basis for cholesterol-mediated regulation of Scap activity.
Results
The experiments described in this paper were made possible by the recent production of a monoclonal antibody directed against luminal loop 1 of Scap, hereafter designated anti-loop 1 (Fig. 1A). We digested sealed ER membrane vesicles with trypsin and also with proteinase K. Instead of probing the SDS-PAGE gels with anti-loop 7 as in previous experiments, we probed with anti-loop 1. When sealed ER vesicles are digested proteolytically with a membrane-impermeable protease, the loop 1 epitope remains protected because it is located in the lumen. Fig. 1B shows the arginines and lysines in the cytoplasmic portions of Scap (N terminus, loop 2, and loop 4) whose cleavage might produce a tryptic fragment containing protected loop 1.
To determine whether trypsin cleavage would generate a protected loop 1 fragment, we incubated CHO-K1 cells in the absence or presence of cholesterol, prepared membrane vesicles, and treated them with varying amounts of trypsin (Fig. 2A). After stopping trypsin digestion, the membranes were treated with PNGase F to remove any effects of glycosylation on the electrophoretic mobility of the protected fragments. The membranes were then subjected to SDS-PAGE and immunoblotted with anti-loop 1. When the cells were incubated in the absence of cholesterol, we observed two protected fragments migrating with apparent molecular masses of 42 kDa and 40 kDa, respectively. We labeled these as bands L6 and L4 (Fig. 2A). When cells were treated with cholesterol, band L4 was greatly diminished, whereas L6 tended to increase. At the highest added amount of trypsin (10 μg), densitometry analysis of the immunoblot (Fig. 2A, lanes 11 and 12) showed that band L4 decreased by 71%, whereas band L6 increased by 46%. Fig. 2B shows a similar experiment in which a less specific protease (proteinase K) was used in place of trypsin. Again, we observed L6 and L4. Cholesterol caused band L4 to disappear without consistently changing the amount of band L6. At the highest added amount of proteinase K (30 μg), densitometry analysis of the immunoblot (Fig. 2B, lanes 11 and 12) showed that band L4 decreased by 96%, whereas band L6 increased by 54%. These experiments suggest that cholesterol causes a conformational change in Scap that sequesters a cytoplasmically disposed arginine or lysine, leading to a reduction in band L4. The appearance of band L4 varied between experiments, ranging from a sharp single band to a diffuse doublet. In all experiments, cholesterol reduced the amount of band L4.
Figure 2.
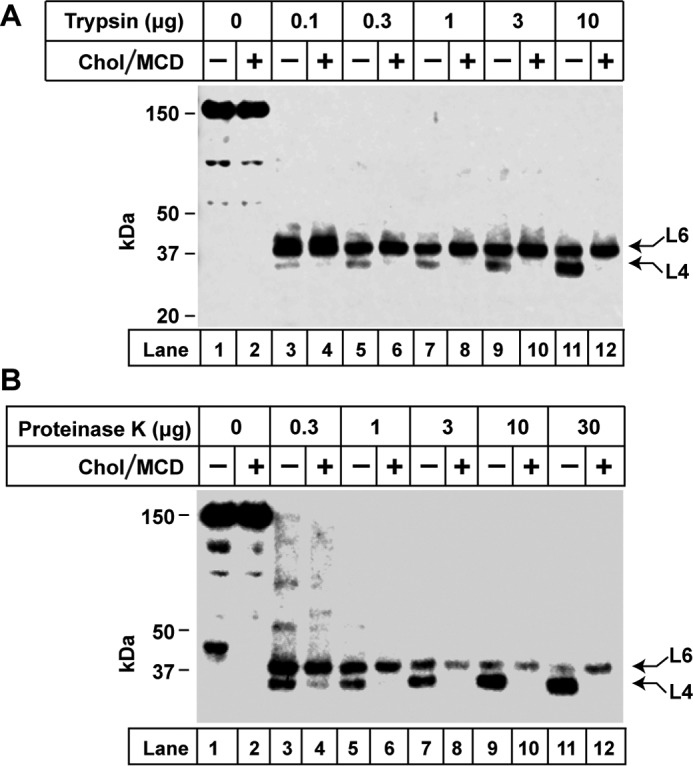
Altered trypsin and proteinase K digestion of hamster Scap after treatment of intact cells with cholesterol. A and B, on day 0, CHO-K1 cells were set up for experiments in medium A containing 5% FCS at a density of 5 × 10⁵ cells/100-mm dish. On day 2, cells were switched to medium A containing 5% LPDS, 50 μm compactin, 50 μm sodium mevalonate, and 1% (w/v) HPCD. After incubation for 1 h at 37 °C, each monolayer was washed twice with PBS at room temperature and then incubated for 4 h at 37 °C with medium A containing 5% LPDS, 50 μm compactin, and 50 μm mevalonate without (−) or with (+) 50 μm cholesterol-MCD complexes. Cells were then harvested and fractionated, and membranes (100 μg/reaction) were subjected to proteolysis with the indicated amounts of either trypsin (A) or proteinase K (B) as described under “Experimental Procedures.” Reactions (70 μl each) were stopped by addition of 40 μg of PMSF and then treated with PNGase F. All samples were heated at 95 °C for 10 min and subjected to 4–12% SDS-PAGE, followed by immunoblot analysis with 5 μg/ml monoclonal IgG-7G5. Arrows denote two protease-protected fragments, L6 and L4 (see Fig. 3). Chol, cholesterol.
To identify the loops in which trypsin cleavage produces bands L4 and L6, we first created a set of size standards. For this purpose, we transfected Scap-deficient CHO-K1 cells with plasmids encoding truncated fragments of Scap that terminate in cytosolic loops 2, 4, or 6 (Fig. 3A). Membrane extracts were subjected to SDS-PAGE and blotted with anti-loop 1 (Fig. 3B). We also prepared membranes from wild-type CHO cells incubated in the absence or presence of cholesterol. We treated the membranes with trypsin, performed SDS-PAGE, immunoblotted with anti-loop 1, and compared the migration of the trypsin-resistant fragments with the migration of the size standards (Fig. 3B). The results show that band L4 corresponds to cleavage within loop 4. Band L6 corresponds to cleavage within loop 6.
Figure 3.
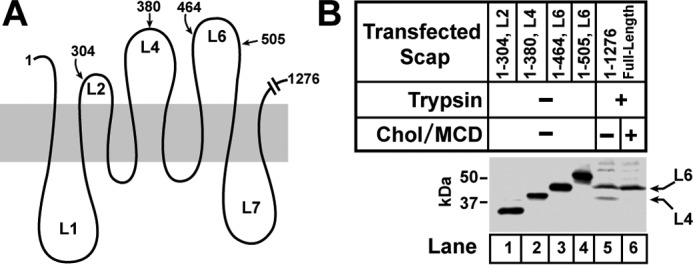
Identifying the cytosol-facing loops that contain the trypsin cleavage sites in hamster Scap. A, schematic of Scap showing approximate locations of amino acids in cytosol-facing loops of Scap where truncations were made. B, on day 0, Scap-deficient SRD-13A cells were set up for experiments at a density of 5 × 10⁵ cells/100-mm dish as described under “Experimental Procedures.” On day 2, cells were transfected with full-length pTK-Scap (2 μg) or the indicated truncated versions of pCMV-Scap (2 μg). Xtremegene HP was used as the transfection reagent according to the instructions of the manufacturer. On day 3, cells were washed twice with PBS and switched to medium A containing 5% LPDS, 50 μm compactin, 50 μm sodium mevalonate, and 1% (w/v) HPCD. After 1 h, each monolayer was washed twice with PBS at room temperature. Cells transfected with the indicated truncated versions of Scap (lanes 1–4) were harvested and fractionated immediately. Cells transfected with full-length Scap (lanes 5 and 6) were incubated at 37 °C for 4 h in medium A containing 5% LPDS, 50 μm compactin, and 50 μm mevalonate without (−) or with (+) 50 μm cholesterol-MCD complexes and then harvested and fractionated. Membranes from cells transfected with full-length Scap were subjected to proteolysis by trypsin as described under “Experimental Procedures.” Trypsinization reactions (70 μl each) were stopped by addition of 40 μg of PMSF, and these samples, along with the membranes from cells transfected with truncated Scaps, were subjected to 15% SDS-PAGE, followed by immunoblot analysis with 5 μg/ml monoclonal IgG-7G5. The arrows in B denote the two trypsin-resistant fragments, L6 and L4, described in Fig. 2. Chol, cholesterol.
To pinpoint the residues in loop 4 required for cholesterol-regulated trypsin cleavage, we prepared plasmids expressing mutant Scap with glutamine substituted for each of the four basic residues within this loop. As shown in Fig. 4A, band L4 was abolished when we simultaneously substituted a pair of closely spaced basic residues (lysine 378 and arginine 380) (lane 5) but not when we substituted lysine 366 (lane 3) or lysine 394 (lane 7). Fig. 4B shows that abolition of cleavage in loop 4 required replacement of both of the closely spaced basic residues. Replacement of lysine 378 or arginine 380 alone had no effect. It is noteworthy that none of these substitutions affected the ability of Scap to mediate the proteolytic processing of SREBP-2, and they did not affect sterol-mediated inhibition of this process (Fig. 4, A and B, bottom panels). These data confirm that the cholesterol-regulated cleavage site lies in loop 4 and suggest that cholesterol binding to Scap alters the conformation of the protein so that cleavage in loop 4 is no longer detectable.
Figure 4.

Identifying the specific cleavage site in cytosolic loop 4 that generates the trypsin-resistant fragment in hamster Scap. A and B, on day 0, Scap-deficient SRD-13A cells were set up for experiments at a density of 5 × 10⁵ cells/100-mm dish as described under “Experimental Procedures.” On day 2, cells were transfected with pTK-HSV-BP2 (2 μg), pTK-Insig1-Myc (1.5 μg), and either wild-type or mutant versions of pTK-Scap (2 μg) as indicated. Xtremegene HP was used as the transfection reagent. On day 3, cells were washed twice with PBS, and switched to medium A containing 5% LPDS, 50 μm compactin, 50 μm sodium mevalonate, and 1% (w/v) HPCD. After 1 h, each monolayer was washed twice with PBS at room temperature and then incubated at 37 °C for 4 h in medium A containing 5% LPDS, 50 μm compactin, and 50 μm mevalonate without (−) or with (+) 50 μm cholesterol-MCD complexes. Cells were then harvested and fractionated. Top panels, membranes were subjected to proteolysis by trypsin as described under “Experimental Procedures.” Reactions (70 μl each) were stopped by addition of 40 μg of PMSF and subjected to 15% SDS-PAGE, followed by immunoblot analysis with 5 μg/ml monoclonal IgG-7G5. Bottom panels, nuclear extracts were subjected to 8% SDS-PAGE, followed by immunoblot analysis with 0.2 μg/ml monoclonal anti-HSV antibody to visualize SREBP-2 activation. Chol, cholesterol.
Fig. 5 shows that the sterol structural requirements for elimination of cleavage in loop 4 coincide with the requirements for inhibition of SREBP-2 processing (12). Thus, cholesterol and desmosterol, which bind Scap, inhibit both processes, whereas epicholesterol and lanosterol, which do not bind Scap, do not inhibit either process. We next compared the effects of cholesterol and 25-hydroxycholesterol (25-HC). Although 25-HC does not bind Scap, this oxysterol eliminated cleavage in loop 4 in a manner similar to cholesterol (Fig. 6A, lanes 2 and 3) Previous studies showed that both cholesterol and 25-HC cause a conformational change in loop 6 of Scap that is dependent on Insigs (1), but they do it by different means (6, 12, 13). Cholesterol binds to Scap and causes Scap to bind to Insig proteins. On the other hand, 25-HC binds to Insigs, thereby causing Insigs to bind to Scap. If the disappearance of band L4 is caused by cholesterol binding to Scap, then we predict that cholesterol would continue to cause this change in Insig-deficient cells. On the other hand, 25-HC should lose its effect.
Figure 5.
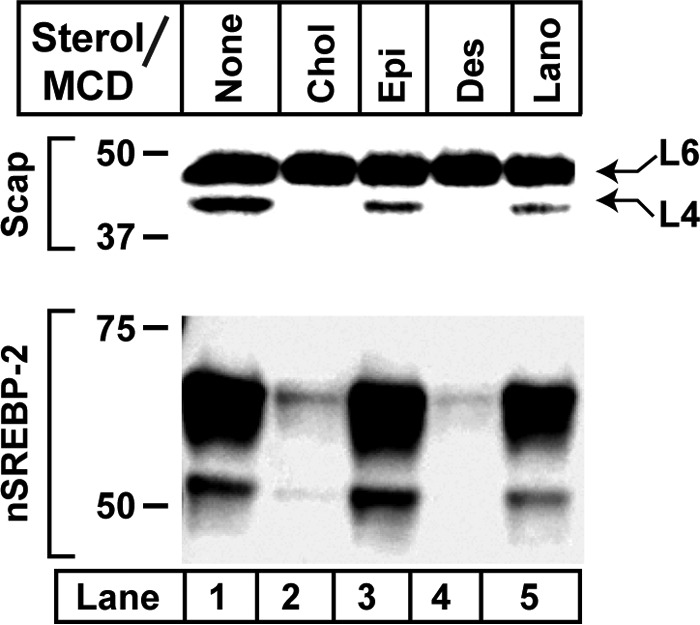
Sterol specificity of altered proteinase K digestion of hamster Scap. On day 0, CHO-K1 cells were set up for experiments in medium A containing 5% FCS at a density of 5 × 10⁵ cells/100-mm dish. On day 2, cells were switched to medium A containing 5% LPDS, 50 μm compactin, 50 μm sodium mevalonate, and 1% (w/v) HPCD. After 1 h, each monolayer was washed twice with PBS at room temperature and then incubated at 37 °C for 4 h in medium A containing 5% LPDS, 50 μm compactin, 50 μm mevalonate, and 50 μm of the indicated sterol-MCD complex. Cells were then harvested and fractionated. Top panel, membrane fractions were subjected to proteolysis by proteinase K as described under “Experimental Procedures.” Reactions (70 μl each) were stopped by addition of 40 μg PMSF and subjected to 15% SDS-PAGE, followed by immunoblot analysis with 5 μg/ml monoclonal IgG-7G5. Bottom panel, nuclear extracts were subjected to 8% SDS-PAGE, followed by immunoblot analysis with 2.5 μg/ml monoclonal IgG-7D4 to visualize SREBP-2 activation. Chol, cholesterol; Epi, epicholesterol; Des, desmosterol; Lano, lanosterol.
Figure 6.

Requirement of Insig proteins for altered proteinase K digestion of hamster Scap after treatment of intact cells with 25-HC but not with cholesterol. A and B, on day 0, CHO-K1 cells and Insig1/Insig2-deficient SRD-15 cells were set up for experiments at densities of 5 × 10⁵ cells/100-mm dish and 7 × 10⁵ cells/100-mm dish, respectively, as described under “Experimental Procedures.” On day 2, cells were switched to medium A containing 5% LPDS, 50 μm compactin, 50 μm sodium mevalonate, and 1% (w/v) HPCD. After 1 h, each monolayer was washed twice with PBS at room temperature and then incubated at 37 °C for 4 h in medium A containing 5% LPDS, 50 μm compactin, 50 μm mevalonate, and either 50 μm cholesterol/MCD complexes or 1 μg/ml 25-HC in ethanol as indicated. Cells were then harvested and fractionated. Top panels, membrane fractions were subjected to proteolysis by proteinase K as described under “Experimental Procedures.” Reactions (70 μl each) were stopped by addition of 40 μg of PMSF and subjected to 15% SDS-PAGE, followed by immunoblot analysis with 5 μg/ml monoclonal IgG-7G5. Bottom panels, nuclear extracts were subjected to 8% SDS-PAGE followed by immunoblot analysis with 2.5 μg/ml monoclonal IgG-7D4 to visualize SREBP-2 activation. Chol, cholesterol.
To test this hypothesis, we compared the effects of cholesterol and 25-HC in SRD-15 cells, a line of mutant CHO cells that fails to produce Insigs (14). In SRD-15 cells, cholesterol retained its ability to eliminate band L4 (Fig. 6A, lane 5), but 25-HC was no longer effective (lane 6). Fig. 6A, bottom panel, shows that cholesterol and 25-HC inhibit SREBP-2 processing in CHO-K1 cells (lanes 1–3), but neither sterol had this effect in the Insig-deficient SRD-15 cells (lanes 4–6). Fig. 6B presents a repeat of the experiment of Fig. 6A, performed with different cells on a different day.
The experiment shown in Fig. 7 was performed to demonstrate the coordination between the cholesterol-induced change in loop 4 cleavage, as demonstrated in this paper, and the previously demonstrated cholesterol-induced change in loop 6 (1). As described under “Introduction,” we can detect the conformational change in loop 6 by treating sealed vesicles with trypsin and probing SDS-PAGE gels with anti-loop 7 (Fig. 1A). In cholesterol-deprived cells, arginine 505 in loop 6 is protected from tryptic cleavage. As a result, the anti-loop 7 blot reveals a fragment of 251–254 amino acids corresponding to cleavage at arginine 496 and the arginine 747–750 cluster (Fig. 1A). When the membrane is enriched in cholesterol, arginine 505 is exposed to trypsin. Blotting with anti-loop 7 now reveals a fragment that is ∼10 amino acids shorter (1).
Figure 7.
Mutations that constitutively render Scap in its cholesterol-bound conformation alter trypsin digestion of hamster Scap. On day 0, Scap-deficient SRD-13A cells were set up for experiments at a density of 5 × 10⁵ cells/100-mm dish as described under “Experimental Procedures.” On day 2, cells were transfected with 1 μg/dish of either wild-type or mutant versions of pCMV-Scap. FuGENE 6 was used as the transfection reagent according to the instructions of the manufacturer. On day 3, cells were washed twice with PBS and switched to medium A containing 5% LPDS, 50 μm compactin, 50 μm sodium mevalonate, and 1% (w/v) HPCD. After 1 h, each monolayer was washed twice with PBS at room temperature and then incubated at 37 °C for 4 h in medium A containing 5% LPDS, 50 μm compactin, and 50 μm sodium mevalonate without or with 50 μm cholesterol-MCD complexes. Cells were then harvested and fractionated, and membranes (100 μg/reaction) were subjected to proteolysis by trypsin as described under “Experimental Procedures.” Reactions (70 μl each) were stopped by addition of 40 μg of PMSF, treated with PNGase F, and subjected to 4–12% SDS-PAGE, followed by immunoblot analysis with either 5 μg/ml monoclonal IgG-7G5 (top panel) or 10 μg/ml monoclonal IgG-9D5 (bottom panel). Chol, cholesterol.
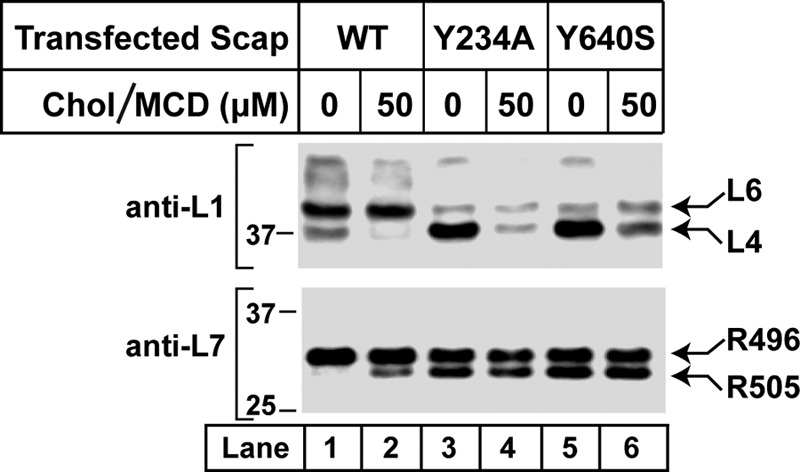
In the experiment shown in Fig. 7, we transfected Scap-deficient SRD-13A cells with a plasmid encoding wild-type Scap, treated sealed membrane vesicles with trypsin, performed SDS-PAGE, and blotted with anti-loop 1 (top panel) or anti-loop 7 (bottom panel). When the cells were deprived of cholesterol, tryptic digestion revealed cleavage in loop 4 (Fig. 7, top panel, lane 1) and no cleavage at R505 (Fig. 7, bottom panel, lane 1). When the cells were treated with cholesterol, the loop 4 cleavage band disappeared, and the R505 cleavage band appeared (Fig. 7, lane 2). We also transfected the SRD-13A cells with plasmids encoding mutant forms of Scap that have substitutions in loop 1 or loop 7. The substitutions are tyrosine 234-to-alanine in loop 1 (designated Y234A) and tyrosine 640-to-serine in loop 7 (Y640S). Both of these mutations prevent the binding of loop 1 to loop 7, and they both prevent transport of the Scap-SREBP complex to the Golgi in cholesterol-deprived cells (8, 11). Of note, the Y234A mutation in loop 1 does not prevent cholesterol binding (11). Fig. 7 shows that the two mutant proteins behave normally with respect to cleavage in loop 4 (top panel). They show intense cleavage in the absence of cholesterol and a large reduction when cholesterol is present. The result with loop 6 is entirely different. Both mutant proteins show cleavage at Arg-505 even in the absence of cholesterol, and there is no further increase when cholesterol is present (Fig. 7, bottom panel, lanes 3–6).
Discussion
Fig. 8 shows a working model for the conformational change in Scap that is induced by the binding of cholesterol. The model, which integrates the current data with previous data generated by our laboratory, explains how information about the cholesterol content of the ER membrane is transmitted from the cholesterol binding site of Scap in luminal loop 1 to the COPII binding site in cytosolic loop 6 on the other side of the ER membrane through its sterol-sensing domain (TM 2–6). The model postulates that, in the absence of cholesterol, Scap exists in a conformation in which loop 1 is bound to loop 7 (Fig. 8A). This binding was suggested initially by experiments in which we transfected cells with a plasmid encoding Scap with a termination codon in loop 6 to produce a fragment designated Scap(TM1–6) (8). Simultaneously, we transfected a plasmid encoding the remainder of Scap, which begins in loop 6 and continues to the carboxyl terminus designated Scap(TM7-end). These two fragments bound to each other, as revealed by co-immunoprecipitation. Moreover, they reconstituted the ability to transport SREBP-2 to the Golgi. Addition of cholesterol to cells partially but reproducibly reduced the co-immunoprecipitation between the two fragments. The conclusion that the interaction between these two fragments is mediated by an interaction between loops 1 and 7 was supported by scanning mutagenesis, which revealed that the Y234A mutation in loop 1 and the Y640S mutation in loop 7 abolished the co-immunoprecipitation between Scap(TM1–6) and Scap(TM7-end) (8). Unable to bind to each other, the two fragments lost the ability to transport SREBP-2 to the Golgi. Based on these data, we hypothesized that Scap transport could occur only when loop 1 binds to loop 7 to create the closed conformation shown in Fig. 8A. We postulate that cholesterol binding to loop 1 causes loop 1 to dissociate from loop 7, mimicking the effect of the Y234A and Y640S mutations and preventing Scap/SREBP transport.
Figure 8.

Model for cholesterol-mediated conformational changes in Scap. A, when ER membrane cholesterol is low, loop 1 and loop 7 exist in a bound, closed conformation, generating the two indicated trypsin cleavage sites (closed arrows). B, when ER cholesterol is high, loop 1 and loop 7 exist in an unbound, open conformation, generating a different trypsin cleavage site (open arrow). Yellow ovals denote cholesterol. Circles denote arginine residues cleaved by trypsin to generate fragments recognized by anti-loop 1 (purple) or anti-loop 7 (green). The red bar denotes the MELADL sequence that targets Scap to COPII-coated vesicles.
In a subsequent study, we used co-transfection to demonstrate direct binding of loop 1 to loop 7 (10). For this purpose, we produced plasmids encoding the two loops as isolated segments. When expressed alone, loop 1 remained bound to membranes and was not secreted. When we co-expressed loop 7, it formed a complex with loop 1 that was secreted into the culture medium as a soluble protein. The loop 1-loop 7 complex bound cholesterol in a similar fashion as full-length Scap, but cholesterol binding did not cause dissociation (10). We concluded that dissociation of loop 1 from loop 7 might require a conformational change in the protein segment that separates these two loops. To identify such a conformational change, we designed a protease protection assay in which a recently generated monoclonal antibody to loop 1 was employed to visualize the predicted conformational change occurring in the intervening sequence between loops 1 and 7.
When we depleted cells of cholesterol and digested sealed membrane vesicles with trypsin or proteinase K, immunoblots of SDS-PAGE gels with anti-L1 revealed two bands that corresponded in migration to cleavage in cytosolic loops 4 and 6 (Figs. 2 and 3). When we replaced two arginines in loop 4, trypsin no longer created band L4, confirming that cleavage occurred in this loop (Fig. 4). When cells were incubated with cholesterol and then subjected to the trypsin digestion procedure, band L4 disappeared (Fig. 2A). A similar loss of band L4 was seen when proteinase K was used in place of trypsin (Fig. 2B).
The loss of band L4 upon cholesterol addition indicates that cholesterol caused a conformational change in the region that encompasses loops 1 and 4. The simplest explanation is that the conformation of loop 4 is altered and the pair of arginines is no longer accessible to the protease. This change is illustrated in Fig. 8B, which shows a sequestered arginine in loop 4 when Scap is in the open conformation. Two observations argue against this simple explanation. First, cholesterol addition also abolished band L4 when proteinase K was used in place of trypsin. Proteinase K is a nonspecific protease, and the loss of cleavage would indicate that the entirety of loop 4 had been sequestered in some fashion. Second, if digestion in loop 4 was blocked by cholesterol, then we should have observed an increase in band L6. In some experiments we observed such an increase, but most of the time we did not.
We cannot exclude an alternate explanation for the cholesterol-induced disappearance of band L4. It is possible that cholesterol causes a reorientation of loop 1 so that the L1 epitope translocates to the cytosolic surface, where it is destroyed by trypsin or proteinase K. We noted previously that loop 1 has three stretches of hydrophobic residues that vary from 10 to 15 amino acids in length (11). These are too short to form traditional membrane-spanning helices. Nevertheless, these segments may penetrate into the membrane. Indeed, when we used transfection to produce loop 1 as an isolated protein, we found that loop 1 was membrane-bound and required detergents for solubilization (10, 11). It is possible that cholesterol causes a conformational change in loop 1 that allows one or more of these hydrophobic segments to span across the ER membrane, exposing a portion of loop 1 to the cytosol, where it is susceptible to proteolytic cleavage. We detect the loss of band L4 by blotting with anti-loop 1. This monoclonal antibody was prepared by immunizing mice with a fragment of loop 1 of hamster Scap extending from residue 46 to residue 269 (10). We do not know the precise location of the epitope within this region. We are currently attempting to define the epitope more precisely so that we can determine whether it translocates to the cytosolic surface when cholesterol binds to loop 1.
A precedent for lipid-induced inversion of transmembrane helices is found in the work of Dowhan and co-workers (15–17) with the lactose permease (LacY) of Escherichia coli. In elegant studies with LacY reconstituted into proteoliposomes, they demonstrated that addition of phosphatidyl ethanolamine to the proteoliposomes causes a previously periplasmic segment of LacY to become transmembrane, a change that alters the orientation of nearby transmembrane helices. The change in topology is attributable to the ability of a neutral lipid such as phosphatidyl ethanolamine to dilute the negative phospholipids that predominate on the cytosolic surfaces of bacterial membranes. Inasmuch as cholesterol is a neutral lipid, it might induce a topological rearrangement of loop 1 of Scap by a mechanism similar to LacY.
The experiment of Fig. 7 has implications for the transmembrane coupling between cholesterol binding to lumenal loop 1 and the conformational change on the other side of the membrane in loop 6. In this experiment, we performed tryptic digests on Scaps with point mutations in loop 1 or loop 7 that prevent the loops from binding to each other, even in the absence of cholesterol. In the cholesterol-depleted state, loop 1 in both mutants assumes its normal cholesterol-free conformation, as indicated by the appearance of band L4. In sharp contrast, loop 6 assumes the cholesterol-bound conformation, as indicated by the presence of band Arg-505. When cholesterol is present, loop 1 undergoes its normal conformational change, as indicated by the disappearance of band L4. However, this change is decoupled from any change in loop 6, as indicated by the observation that band Arg-505 is not altered by cholesterol. These data indicate that the important functional effect of cholesterol binding is to cause dissociation of loop 7 from loop 1. The conformational change in loop 1 is necessary to cause this dissociation. When dissociation is created by another means, such as the two point mutations, loop 6 assumes the configuration that precludes COPII binding, even when loop 1 is in its cholesterol-free conformation.
The model in Fig. 8 implies that the binding between loops 1 and 7 is intramolecular, i.e. both loops are in the same Scap molecule. It is also possible that loop 1 from one Scap molecule binds to loop 7 on an adjacent Scap. Such intermolecular binding might promote the formation of large Scap complexes that would provide an opportunity to bind multiple COPII complexes, thereby facilitating clustering of the Scap-SREBP complex into COPII-coated vesicles. We are currently designing experiments to test this hypothesis.
Experimental procedures
Reagents
We obtained peptide N-glycosidase F (PNGase F) and proteinase K from New England Biolabs, Inc. (Ipswich, MA); trypsin (type 1 from bovine pancreas), fetal bovine serum (FCS), and PMSF from Sigma; all sterols from Steraloids, Inc. (Newport, RI); methyl-β-cyclodextrin (randomly methylated) (MCD) and 2-hydroxypropyl-β-cyclodextrin (HPCD) from Cyclodextrin Technologies Development, Inc. (Gainesville, FL); the QuikChange II XL site-directed mutagenesis kit from Stratagene (Santa Clara, CA); Xtremegene HP DNA transfection reagent from Roche Applied Science; FuGENE 6 transfection reagent from Promega (Madison, WI); and protease inhibitor cocktail set III and N-acetyl-l-leucyl-l-leucyl-l-norleucinal (ALLN) from Calbiochem. Solutions of compactin and sodium mevalonate were prepared as described previously (18). Newborn calf lipoprotein-deficient serum (LPDS) (density > 1.215 g/ml) was prepared by ultracentrifugation as described previously (19). Stock solutions of various sterol-MCD complexes were prepared at a final concentration of 2.5 mm and a sterol/MCD molar ratio of 1:12 (lanosterol) or 1:10 (all other sterols) as described previously (1).
Antibodies
Monoclonal HSV tag antibody was obtained from Novagen (Madison, WI). Monoclonal antibody IgG-7D4 against hamster SREBP-2 (amino acids 32–350) (20), monoclonal antibody IgG-9D5 against hamster Scap (amino acids 540–707) (5), and monoclonal antibody IgG-7G5 against hamster Scap (amino acids 46–269) (10) are described in the indicated references.
Plasmids
The following recombinant expression plasmids have been described previously: pCMV-Scap, encoding hamster Scap under control of the CMV promoter (5); pTK-Scap, encoding hamster Scap under control of the thymidine kinase (TK) promoter (21); pTK-HSV-BP2, encoding HSV-tagged human SREBP-2 under control of the TK promoter (21); and pTK-Insig1-Myc, encoding human Insig-1 followed by six tandem copies of the c-Myc epitope tag under control of the TK promoter (22). Point mutations and deletions in the above Scap plasmids were produced by site-directed mutagenesis, and mutations were verified by sequencing the coding region of all plasmids.
Cell culture
Hamster CHO-K1 cells were grown in a monolayer at 37 °C and 8–9% CO2 in medium A (a 1:1 mixture of Ham's F-12 and Dulbecco's modified Eagle's medium supplemented with 100 units/ml penicillin and 100 μg/ml streptomycin sulfate) containing 5% FCS. SRD-13A cells, a Scap-deficient cell line derived from CHO-7 cells (23), were grown in medium A supplemented with 5% FCS, 1 mm sodium mevalonate, 20 μm sodium oleate, and 5 μg/ml cholesterol. SRD-15 cells, an Insig-1/Insig-2-deficient cell line derived from CHO-7 cells, were maintained in medium A supplemented with 5% LPDS, 10 μm SR-12813 (a 1,1-bisphosphonate ester that accelerates degradation of HMG-CoA reductase), and 1 μg/ml 25-HC (14). The protocols for cell treatment and transfecting cDNAs into cells are described in the figure legends. Stock solutions were made up in ethanol (cholesterol and 25-HC) or DMSO (SR-12813); the final concentration of ethanol or DMSO in all culture media was <1%.
Cell fractionation
Cell pellets were resuspended in 0.5 ml of buffer A (10 mm Hepes-KOH (pH 7.4), 10 mm KCl, 1.5 mm MgCl2, 1 mm sodium EDTA, 1 mm sodium EGTA, and 250 mm sucrose) with a protease inhibitor cocktail (1:100 dilution of protease inhibitor cocktail set III, 20 μg/ml ALLN, and 200 μg/ml PMSF), passed through a 22.5-gauge needle 30 times, and centrifuged at 1000 × g for 5 min at 4 °C. The 1000 × g supernatant was centrifuged at 20,000 × g for 10 min at 4 °C. This 20,000 × g pellet was designated as “membranes.” The pellet from the initial 1000 × g centrifugation step was resuspended in 100 μl of buffer B (20 mm Hepes-KOH (pH 7.6), 2.5% (v/v) glycerol, 0.42 m NaCl, 1.5 mm MgCl2, 1 mm sodium EDTA, and 1 mm sodium EGTA) with a protease inhibitor cocktail, placed on a rotator at 4 °C for 1 h, and centrifuged at 20,000 × g for 30 min at 4 °C. This 20,000 × g supernatant was designated as the “nuclear extract.” Protein concentration in nuclear extracts and membranes was measured using the BCA Kit (Pierce).
Protease cleavage assay
Each reaction, in a total volume of either 70 or 80 μl of buffer A, contained 100–200 μg of membranes and 1 μg of proteinase K or 2 μg of trypsin as indicated. After incubation for 1 h in a water bath at 37 °C, proteolysis was stopped by addition of 40 μg of PMSF (20 mg/ml stock solution in ethanol). In some experiments, the proteolysed membranes were further treated with PNGase F according to the instructions of the manufacturer. The processed membranes were prepared for immunoblot analysis by addition of 1% (w/v) SDS, followed by heating at 95 °C for 10 min.
Immunoblot analysis
Nuclear extracts and membranes (20 μg protein/lane) were subjected to 8% SDS-PAGE, and protease-treated membranes (20–40 μg protein/lane) were subjected to 4–12% or 15% SDS-PAGE. After electrophoresis, the proteins were transferred to either Hybond C-Extra nitrocellulose filters (Amersham Biosciences) or Transblot Turbo midsize nitrocellulose filters (Bio-Rad) and incubated at 4 °C for 16 h with primary antibodies as indicated in the figure legends. Bound antibodies were visualized by chemiluminescence (SuperSignal West Pico chemiluminescent substrate, Thermo Scientific, Waltham, MA) using a 1:5000 dilution of anti-mouse IgG (Jackson ImmunoResearch Laboratories, Inc., West Grove, PA) conjugated to horseradish peroxidase. The filters were either exposed to Blue X-ray film (Phoenix Research Products, Pleasanton, CA) for 1–30 s (nuclear extracts and membranes) or 3 min (protease-treated samples) or scanned using an Odyssey FC Imager (Dual-Mode Imaging System, Lincoln, NE; 2-min integration time) and analyzed using Image Studio version 5.0 (LI-COR, Lincoln, NE).
Reproducibility
All experiments shown in Figs. 2–7 were repeated with similar results on three or more different days.
Author contributions
Y. G. and Y. Z. designed, performed, and analyzed the experiments. M. S. B., J. L. G., and A. R. designed the research, analyzed the data, and wrote the paper. All authors reviewed the results and approved the final version of the paper.
Acknowledgments
We thank Lisa Beatty, Shomanike Head, Ijeoma Dukes, and Lucie Batte for invaluable help with tissue culture and Daphne Rye for excellent technical assistance.
This work was supported by National Institutes of Health Grant HL20948 (to J. L. G. and M. S. B.), Robert A. Welch Foundation Grant I-1793 (to A. R.), and American Heart Association Grant 12SDG12040267 (to A. R.). The authors declare that they have no conflicts of interest with the contents of this article. The content is solely the responsibility of the authors and does not necessarily represent the official views of the National Institutes of Health.
- SREBP
- sterol regulatory element-binding protein
- ER
- endoplasmic reticulum
- COPII
- coat protein complex II
- TM
- transmembrane
- 25-HC
- 25-hydroxycholesterol
- PNGase F
- peptide-N-glycosidase
- MCD
- methyl-β-cyclodextrin
- HPCD
- 2-hydroxypropyl-β-cyclodextrin
- LPDS
- lipoprotein-deficient serum
- TK
- thymidine kinase
- ALLN
- N-acetyl-l-leucyl-l-leucyl-l-norleucinal.
References
- 1. Brown A. J., Sun L., Feramisco J. D., Brown M. S., and Goldstein J. L. (2002) Cholesterol addition to ER membranes alters conformation of SCAP, the SREBP escort protein that regulates cholesterol metabolism. Mol. Cell 10, 237–245 [DOI] [PubMed] [Google Scholar]
- 2. Brown M. S., and Goldstein J. L. (2009) Cholesterol feedback: from Schoenheimer's bottle to Scap's MELADL. J. Lipid Res. 50, S15–S27 [DOI] [PMC free article] [PubMed] [Google Scholar]
- 3. Radhakrishnan A., Sun L.-P., Kwon H. J., Brown M. S., and Goldstein J. L. (2004) Direct binding of cholesterol to the purified membrane region of SCAP: mechanism for a sterol-sensing domain. Mol. Cell 15, 259–268 [DOI] [PubMed] [Google Scholar]
- 4. Nohturfft A., Brown M. S., and Goldstein J. L. (1998) Topology of SREBP cleavage-activating protein, a polytopic membrane protein with a sterol-sensing domain. J. Biol. Chem. 273, 17243–17250 [DOI] [PubMed] [Google Scholar]
- 5. Sakai J., Nohturfft A., Cheng D., Ho Y. K., Brown M. S., and Goldstein J. L. (1997) Identification of complexes between the COOH-terminal domains of sterol regulatory element-binding proteins (SREBPs) and SREBP cleavage-activating protein (SCAP). J. Biol. Chem. 272, 20213–20221 [DOI] [PubMed] [Google Scholar]
- 6. Sun L.-P., Seemann J., Brown M. S., and Goldstein J. L. (2007) Sterol-regulated transport of SREBPs from endoplasmic reticulum to Golgi: Insig renders sorting signal in Scap inaccessible to COPII proteins. Proc. Natl. Acad. Sci. U.S.A. 104, 6519–6526 [DOI] [PMC free article] [PubMed] [Google Scholar]
- 7. Radhakrishnan A., Goldstein J. L., McDonald J. G., and Brown M. S. (2008) Switch-like control of SREBP-2 transport triggered by small changes in ER cholesterol: a delicate balance. Cell Metab. 8, 512–521 [DOI] [PMC free article] [PubMed] [Google Scholar]
- 8. Zhang Y., Motamed M., Seemann J., Brown M. S., and Goldstein J. L. (2013) Point mutation in luminal loop 7 of Scap blocks interaction with loop 1 and abolishes movement to Golgi. J. Biol. Chem. 288, 14059–14067 [DOI] [PMC free article] [PubMed] [Google Scholar]
- 9. Goldstein J. L., DeBose-Boyd R. A., and Brown M. S. (2006) Protein sensors for membrane sterols. Cell 124, 35–46 [DOI] [PubMed] [Google Scholar]
- 10. Zhang Y., Lee K. M., Kinch L. N., Clark L., Grishin N. V., Rosenbaum D. M., Brown M. S., Goldstein J. L., and Radhakrishnan A. (2016) Direct demonstration that loop 1 of Scap binds to loop 7, a crucial event in cholesterol homeostasis. J. Biol. Chem. 291, 12888–12896 [DOI] [PMC free article] [PubMed] [Google Scholar]
- 11. Motamed M., Zhang Y., Wang M. L., Seemann J., Kwon H. J., Goldstein J. L., and Brown M. S. (2011) Identification of luminal loop 1 of Scap protein as the sterol sensor that maintains cholesterol homeostasis. J. Biol. Chem. 286, 18002–18012 [DOI] [PMC free article] [PubMed] [Google Scholar]
- 12. Radhakrishnan A., Ikeda Y., Kwon H. J., Brown M. S., and Goldstein J. L. (2007) Sterol-regulated transport of SREBPs from endoplasmic reticulum to Golgi: oxysterols block transport by binding to Insig. Proc. Natl. Acad. Sci. U.S.A. 104, 6511–6518 [DOI] [PMC free article] [PubMed] [Google Scholar]
- 13. Adams C. M., Reitz J., De Brabander J. K., Feramisco J. D., Li L., Brown M. S., and Goldstein J. L. (2004) Cholesterol and 25-hydroxycholesterol inhibit activation of SREBPs by different mechanisms, both involving SCAP and Insigs. J. Biol. Chem. 279, 52772–52780 [DOI] [PubMed] [Google Scholar]
- 14. Lee P. C., Sever N., and Debose-Boyd R. A. (2005) Isolation of sterol-resistant Chinese hamster ovary cells with genetic deficiencies in both Insig-1 and Insig-2. J. Biol. Chem. 280, 25242–25249 [DOI] [PubMed] [Google Scholar]
- 15. Vitrac H., Bogdanov M., and Dowhan W. (2013) In vitro reconstitution of lipid-dependent dual topology and postassembly topological switching of a membrane protein. Proc. Natl. Acad. Sci. U.S.A. 110, 9338–9343 [DOI] [PMC free article] [PubMed] [Google Scholar]
- 16. Bogdanov M., Dowhan W., and Vitrac H. (2014) Lipids and topological rules governing membrane protein assembly. Biochim. Biophys. Acta 1843, 1475–1488 [DOI] [PMC free article] [PubMed] [Google Scholar]
- 17. Vitrac H., MacLean D. M., Jayaraman V., Bogdanov M., and Dowhan W. (2015) Dynamic membrane protein topological switching upon changes in phospholipid environment. Proc. Natl. Acad. Sci. U.S.A. 112, 13874–13879 [DOI] [PMC free article] [PubMed] [Google Scholar]
- 18. Brown M. S., Faust J. R., Goldstein J. L., Kaneko I., and Endo A. (1978) Induction of 3-hydroxy-3-methylglutaryl coenzyme A reductase activity in human fibroblasts incubated with compactin (ML-236B), a competitive inhibitor of the reductase. J. Biol. Chem. 253, 1121–1128 [PubMed] [Google Scholar]
- 19. Goldstein J. L., Basu S. K., and Brown M. S. (1983) Receptor-mediated endocytosis of low density lipoprotein in cultured cells. Methods Enzymol. 98, 241–260 [DOI] [PubMed] [Google Scholar]
- 20. Yang J., Brown M. S., Ho Y. K., and Goldstein J. L. (1995) Three different rearrangements in a single intron truncate sterol regulatory element binding protein-2 and produce sterol-resistant phenotype in three cell lines. J. Biol. Chem. 270, 12152–12161 [DOI] [PubMed] [Google Scholar]
- 21. Feramisco J. D., Radhakrishnan A., Ikeda Y., Reitz J., Brown M. S., and Goldstein J. L. (2005) Intramembrane aspartic acid in SCAP protein governs cholesterol-induced conformational change. Proc. Natl. Acad. Sci. U.S.A. 102, 3242–3247 [DOI] [PMC free article] [PubMed] [Google Scholar]
- 22. Gong Y., Lee J. N., Lee P. C., Goldstein J. L., Brown M. S., and Ye J. (2006) Sterol-regulated ubiquitination and degradation of Insig-1 creates a convergent mechanism for feedback control of cholesterol synthesis and uptake. Cell Metab. 3, 15–24 [DOI] [PubMed] [Google Scholar]
- 23. Rawson R. B., Debose-Boyd R. A., Goldstein J. L., and Brown M. S. (1999) Failure to cleave sterol regulatory element-binding proteins (SREBPs) causes cholesterol auxotrophy in Chinese hamster ovary cells with genetic absence of SREBP cleavage-activating protein. J. Biol. Chem. 274, 28549–28556 [DOI] [PubMed] [Google Scholar]