

Abstract
The kinase interaction motif (KIM) family of protein-tyrosine phosphatases (PTPs) includes hematopoietic protein-tyrosine phosphatase (HePTP), striatal-enriched protein-tyrosine phosphatase (STEP), and protein-tyrosine phosphatase receptor type R (PTPRR). KIM-PTPs bind and dephosphorylate mitogen-activated protein kinases (MAPKs) and thereby critically modulate cell proliferation and differentiation. PTP activity can readily be diminished by reactive oxygen species (ROS), e.g. H2O2, which oxidize the catalytically indispensable active-site cysteine. This initial oxidation generates an unstable sulfenic acid intermediate that is quickly converted into either a sulfinic/sulfonic acid (catalytically dead and irreversible inactivation) or a stable sulfenamide or disulfide bond intermediate (reversible inactivation). Critically, our understanding of ROS-mediated PTP oxidation is not yet sufficient to predict the molecular responses of PTPs to oxidative stress. However, identifying distinct responses will enable novel routes for PTP-selective drug design, important for managing diseases such as cancer and Alzheimer's disease. Therefore, we performed a detailed biochemical and molecular study of all KIM-PTP family members to determine their H2O2 oxidation profiles and identify their reversible inactivation mechanism(s). We show that despite having nearly identical 3D structures and sequences, each KIM-PTP family member has a unique oxidation profile. Furthermore, we also show that whereas STEP and PTPRR stabilize their reversibly oxidized state by forming an intramolecular disulfide bond, HePTP uses an unexpected mechanism, namely, formation of a reversible intermolecular disulfide bond. In summary, despite being closely related, KIM-PTPs significantly differ in oxidation profiles. These findings highlight that oxidation protection is critical when analyzing PTPs, for example, in drug screening.
Keywords: biophysics, enzyme inactivation, nuclear magnetic resonance (NMR), oxidation-reduction (redox), tyrosine-protein phosphatase (tyrosine phosphatase)
Introduction
The kinase interaction motif (KIM)3 family of non-receptor protein-tyrosine phosphatases (PTP) includes hematopoietic protein-tyrosine phosphatase (HePTP, PTPN7), striatal-enriched protein-tyrosine phosphatase (STEP, PTPN5), and protein-tyrosine phosphatase receptor type R (PTPRR, PTPSL, PTPBR7). These PTPs negatively regulate cell activation and proliferation through their ability to bind and subsequently dephosphorylate and inactivate the MAP kinases (MAPK) p38 and Erk2 (1–4). Consequently, HePTP overexpression is associated with the preleukemic disorder myelodysplastic syndrome, as well as acute myelogenous leukemia (5), whereas STEP overexpression is associated with Alzheimer's disease (6). Multiple efforts to identify potent, specific inhibitors of HePTP and STEP are ongoing (7, 8).
Reactive oxygen species (ROS), such as hydrogen peroxide (H2O2), are products of normal cellular metabolism and are generated by mitochondria, membrane, and cytoplasmic enzymes, such as NADPH oxidase and 5-lipoxygenase. One of the primary classes of cellular enzymes that are reversibly regulated by ROS are PTPs (9). This is because the catalytic cysteine residues of PTPs are thiolate ions (Cys-S-) at neutral pH, making them particularly sensitive to oxidation by various oxidants, including H2O2 (10). As a consequence, ROS can affect PTP signaling by directly inhibiting their activity. For example, ROS induces enhanced insulin signaling by inhibiting PTP1B and TC45 (11, 12). Similarly, ROS terminates phosphatidylinositol 3-kinase (PI3K) signaling via inhibition of PTEN (13). ROS also inhibits KIM-PTPs, which leads to the activation of MAPK pathways (14). Thus, efforts to ”trap“ the inactive oxidized state of KIM-PTPs, which would prevent them from returning to their enzymatically active state, provides an attractive route for PTP inhibition and, as a consequence, an approach for developing therapeutics against cancer and Alzheimer's disease (15).
The exposure of PTPs to oxidants results in the formation of the highly reactive sulfenic acid (Cys-SOH; k1; Fig. 1) (16). This intermediate is unstable and rapidly converts to either a sulfenamide bond, as identified in PTP1B (17, 18) and PTPα (19), or an intramolecular disulfide bond, as identified in Lyp (20), SHP1 and SHP2 (21), among others (22, 23) (k3, Fig. 1). Although slow, both modifications are reversible (k4; Fig. 1). In contrast, extended exposure to oxidizing agents results in the formation of sulfinic (Cys-SO2H) and sulfonic (Cys-SO3H) acid species, both of which are irreversible; thus, these modifications permanently inactivate PTPs (10, 16) (k2, Fig. 1). In cells, the reversible oxidation state of the active site cysteine of PTPs is controlled by cellular redox buffers as well as protein reductases, which function to prevent the formation of these irreversible modifications (24).
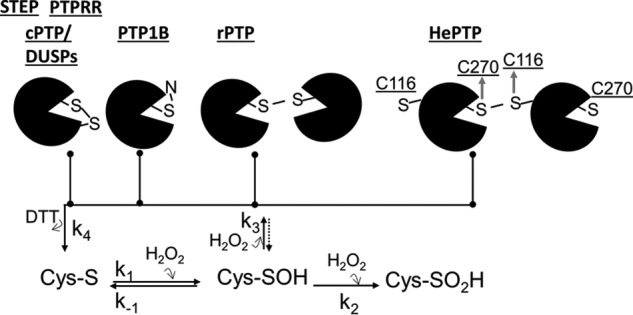
Figure 1.
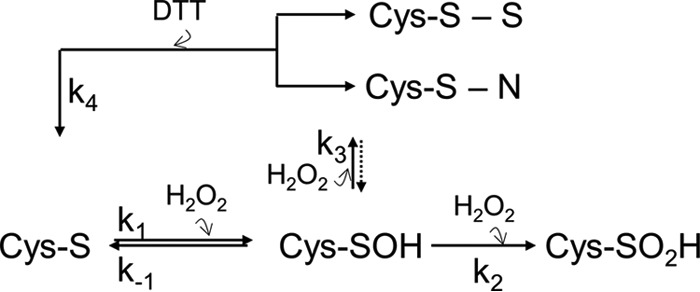
General redox regulation scheme for PTPs. In the presence of H2O2, the thiolate ion of the PTP catalytic cysteine is reversibly oxidized to sulfenic acid (k1). Due to its instability, sulfenic acid quickly converts into: 1) the thiolate ion (k−1), 2) one of two irreversibly oxidized states, sulfinic acid (k2) or sulfonic acid (not shown), or 3) one of two reversibly oxidized states, a disulfide or a sulfenamide (k3). The latter can both be reduced and reactivated by reducing agents such as DTT (k4).
PTP1B, which forms a sulfenamide bond upon ROS exposure, is the canonical PTP that has been used to understand how classical PTPs are reversibly oxidized in cells (25). However, recent studies have shown that many PTPs and dual specificity phosphatases (DUSPs; DUSPs use a cysteine-based catalytic mechanism identical to that of PTPs) rarely form sulfenamide intermediates, but instead form intramolecular disulfide bonds to protect against irreversible oxidation (20, 22, 23). To understand how the family of KIM-PTPs are regulated by ROS, we investigated their oxidation by H2O2 and their reactivation by dithiothreitol (DTT). Our results show that STEP and PTPRR are stabilized by an intramolecular disulfide bond upon oxidation, similar to other cytoplasmic PTPs and DUSPs. However, both STEP and PTPRR are slowly reactivated by DTT compared with other PTPs. We also used kinetic assays, iodoacetamide labeling, nuclear magnetic resonance (NMR) spectroscopy, and mass spectrometry (MS) to show that HePTP uses a novel mechanism, namely the formation of an intermolecular disulfide bond, to prevent its irreversible oxidation, which leads to the reversible dimerization of HePTP.
Results
HePTP, STEP, and PTPRR are reversibly oxidized by H2O2
We used the catalytic domains of HePTP (residues 44–339), STEP (residues 244–539), and PTPRR (residues 361–655) to determine the H2O2-mediated oxidation and subsequent thiol-mediated regeneration of KIM-PTP activities. To determine the sensitivity of the KIM-PTPs to H2O2-mediated oxidation, each KIM-PTP was incubated with a range of H2O2 concentrations for 15 min and, after a 10-min incubation with buffer, their activities were measured. As expected, all KIM-PTPs are sensitive to H2O2-mediated oxidation (Fig. 2), with their steady-state activity decreasing with increasing H2O2 concentrations. However, they are not uniformly sensitive. Rather, STEP was the most and PTPRR the least sensitive to H2O2-mediated oxidation. Specifically, H2O2 concentrations of ∼60, 100, and 150 μm resulted in a 50% reduction of activity by STEP, HePTP, and PTPRR, respectively, whereas concentrations of ≥320, 400, and 500 μm fully abolished their activities (Fig. 2, A, C, and E). The oxidation was also time-dependent. Namely, longer incubation times reduced the concentrations of H2O2 needed to inhibit STEP, HePTP, and PTPRR by 50 and 100%: 16/80, 32/320, and 20/100 μm, respectively (60 min; supplemental Fig. S1).
Figure 2.
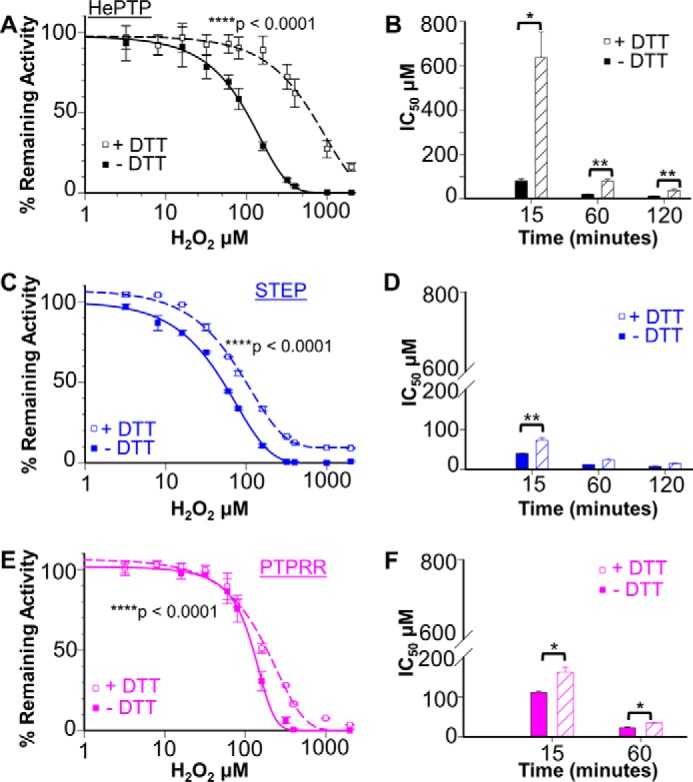
Inhibition and reversibility of the steady-state activity of HePTP, STEP, and PTPRR. 5 μm HePTP (A), STEP (C), and PTPRR (E) were incubated with 0–2000 μm H2O2 for 15 min at room temperature; the incubations were then continued for 10 min either without (closed symbols) or with (open symbols) 10 mm DTT (±S.E., n = 6–12; two-way ANOVA test, ****, p < 0.0001). IC50 values for H2O2-mediated inhibition of HePTP (B), STEP (D), and PTPRR (F) at different incubation times (15, 60, and 120 min) either without (filled bars) and with (hatched bars) 10 mm DTT during the second incubation step (±S.E., n = 6–12; paired t test, *, p < 0.05 or **, p < 0.001).
We then asked if the observed H2O2-mediated oxidation of the KIM-PTPs was reversible (also known as thiol-dependent recovery, oxidation reversibility, or reactivation). In these experiments, the KIM-PTPs were oxidized as described above with the exception that 10 mm DTT was present during the 10-min incubation step prior to the activity measurements. The results show that the extent of reactivation was not uniform, but instead was specific to each KIM-PTP. The reactivation also varied with both H2O2 concentration and time. Namely, the measured IC50 values for H2O2-mediated inhibition increased by ∼4- (HePTP), 2- (STEP), and 1.5-fold (PTPRR) in the presence of DTT (60 min; Fig. 2, B, D, and F, and supplemental Fig. S1).
The full kinetic profiles of the H2O2-mediated inactivation and DTT-mediated reactivation of the KIM PTPs
Next we carried out a series of time-dependent oxidation and reactivation experiments to obtain the full kinetic oxidation profiles of HePTP, STEP, and PTPRR (Fig. 1). First, we determined the reactivity of KIM-PTPs toward oxidation (k1). In these experiments, the KIM-PTPs were incubated with different concentrations of H2O2 (25, 50, 100, 250, and 500 μm) for varying amounts of time (0–900 s; Fig. 3, A–C). The reactions were quenched by diluting into a buffer with catalase and the resulting activities were measured using pNPP as a substrate. The data show that the measured rates of H2O2-mediated inactivation varied linearly with H2O2 concentration, with second-order rate constants (k1) of 8.8 ± 0.7, 13.0 ± 0.5, and 17.8 ± 0.8 m−1 s−1 for HePTP, PTPRR, and STEP, respectively (Fig. 3, A–C, inset, and Table 1). These values are comparable with those obtained for other PTPs, including VHR (17.9 m−1 s−1) (26), PTP1B (9.1 m−1 s−1) (27), and MKP3 (9.6 m−1 s−1).
Figure 3.

Oxidation and reactivation rate constants for HePTP, STEP, and PTPRR. A–C, time dependence of HePTP (A), STEP (B), and PTPRR (C) inactivation by H2O2. H2O2 concentrations are shown in different colors. The data were fit to a single exponential; insets show the concentration dependence of inactivation used to define the second-order rate constant k1. D and E, time-dependent reactivation of KIM-PTPs by DTT using stopped-flow kinetics: D, HePTP at DTT concentrations of 2.5, 5, 10, 20, 30, and 40 mm (curve for 2.5 mm is shown). E, STEP at identical DTT concentrations (curve for 10 mm DTT shown). The insets yield the second-order rate constants k4. F–H, time-dependent irreversible inactivation of KIM-PTPs by high H2O2 concentrations: HePTP (F), STEP (G), and PTPRR (H). Experiments were performed as described in A–C, with the exception that higher concentrations of H2O2 were used. The insets show the concentration dependence of the inactivation used to define the second-order rate constant k2. ±S.E., n = 3.
Table 1.
Rate constants of oxidation, reactivation, and irreversible oxidation of HePTP, STEP, and PTPRR
| PTPs | k1 | k2 | k4 |
|---|---|---|---|
| m−1s−1 | |||
| HePTP | 8.8 ± 0.7 | 5.2 ± 0.6 | 0.8 ± 0.1 |
| HePTP(C116S) | 7.2 ± 0.4a | ||
| STEP | 18 ± 0.8b | 29.4 ± 1.3b | 0.073 ± 0.006b |
| PTPRR | 13 ± 0.5b,c | 5.8 ± 0.9c | NDd |
| PTPRR(C501S) | 5.1 ± 0.3a | ||
a See also Fig. S2.
b Statistical difference between HePTP and STEP or PTPRR. Unpaired t test, p ≤ 0.008.
c Statistical difference between STEP and PTPRR. Unpaired t test, p ≤ 0.02.
d ND, not determined.
Next, we determined the rates of reactivation (k4) by DTT (k4; Fig. 1). In these experiments, HePTP, STEP, and PTPRR were oxidized by incubating with 500 μm H2O2 for 10 min. They were then rapidly mixed with varying concentrations of DTT (2.5 to 40 mm) and the pNPP substrate. The resulting rate constants (kobs) were then plotted as a function of the DTT concentration to obtain the reactivation rates (k4; Fig. 3, D and E). The determined k4 values were 0.8 ± 0.1 and 0.073 ± 0.006 m−1 s−1 for HePTP and STEP, respectively (Fig. 3, D and E, inset, Table 1); the reactivation rate for PTPRR could not be confidently determined. Taken together, the data show that STEP has a very slow DTT-mediated reactivation rate, whereas that of HePTP is similar to those obtained for other PTPs, including MKP3 (1–2 m−1 s−1), SHP1 (0.64 m−1 s−1), and SHP2 (0.46 m−1 s−1).
Finally, we determined the irreversible inhibition rates (k2) for the KIM-PTPs. In these experiments, the KIM-PTPs were incubated with high concentrations of H2O2 (1000–5000 μm; Fig. 3, F–H). The observed rate constants (kobs) for each concentration were then plotted as function of the H2O2 concentration to obtain the irreversible oxidation rate (k2). This resulted in k2 values of 5.2 ± 0.6, 5.8 ± 0.9, and 29.4 ± 1.3 m−1 s−1 for HePTP, PTPRR, and STEP, respectively (Fig. 3, F–H, inset, Table 1, supplemental Fig. S2). Together, these data show that despite having highly similar 3D structures and sequences, each KIM-PTP family member has a very unique oxidation profile.
STEP and PTPRR use intramolecular disulfide bonds to stabilize their reversible oxidized states
In PTP1B, the reversible oxidation of the active site cysteine, Cys215, results in the formation of a sulfenamide bond with Ser216 (17, 18). In contrast, the reversible oxidation of other PTPs (e.g. Lyp (20), Cdc25B (22), and PTEN (23)) results in the formation of a disulfide bond between the active site cysteine and a second cysteine known as the “backdoor cysteine” (BC) (28). Notably, PTP1B also contains a BC. Similarly, the residue C-terminal to the catalytic cysteine in PTPN22, CDC25B, and PTEN is also a serine. Why a particular mechanism (sulfenamide formation versus disulfide bond formation) is preferred by distinct PTPs is currently unknown. It is also unknown if additional molecular mechanisms exist that stabilize a reversible oxidized state of cytosolic PTPs.
The KIM-PTPs also contain both BCs (HePTP(Cys183), STEP(Cys384), PTPRR(Cys501)) and serine residues immediately C-terminal to their catalytic cysteines (HePTP(Ser271), STEP(Ser473), PTPRR(Ser589)). To determine whether STEP and PTPRR use an intramolecular disulfide bond between their active site cysteines (STEP(Cys472) and PTPRR(Cys588)) and their BCs to protect against irreversible oxidation, we generated variants of both proteins in which the BC were mutated to Ser, STEP(C384S), and PTPRR(C501S), and measured their ability to be reactivated by DTT. Circular dichroism (CD) spectropolarimetry showed that the secondary structure and stability of both STEP(C384S) and PTPRR(C501S) were unaffected by the mutations (supplemental Fig. S3, A and B). However, the catalytic activities of STEP(C384S) and PTPRR(C501S) were reduced 4- and 8-fold, respectively, when compared with their wt counterparts (supplemental Fig. S3, C and D; supplemental Table S1; to compensate for the reduced activity of STEP(C384S) and PTPRR(C501S), increased protein concentrations were used for all experiments). We then measured the H2O2-mediated inactivation and subsequent reactivation by DTT of both variants. Although STEP(C384S) is more resistant and PTPRR(C501S) is more sensitive to H2O2-mediated oxidation (Fig. 4, A and C), neither is capable of being reactivated by DTT (Fig. 4, B and D); i.e. oxidized STEP(C384S) and PTPRR(C501S) proceed directly to an irreversible oxidation state. This differs significantly from their wt counterparts, which both exhibit ∼5–7-fold more reactivation than the variants, respectively (Fig. 4, B and D). Together, these data demonstrate that BCs stabilize the reversible oxidation state of STEP and PTPRR.
Figure 4.
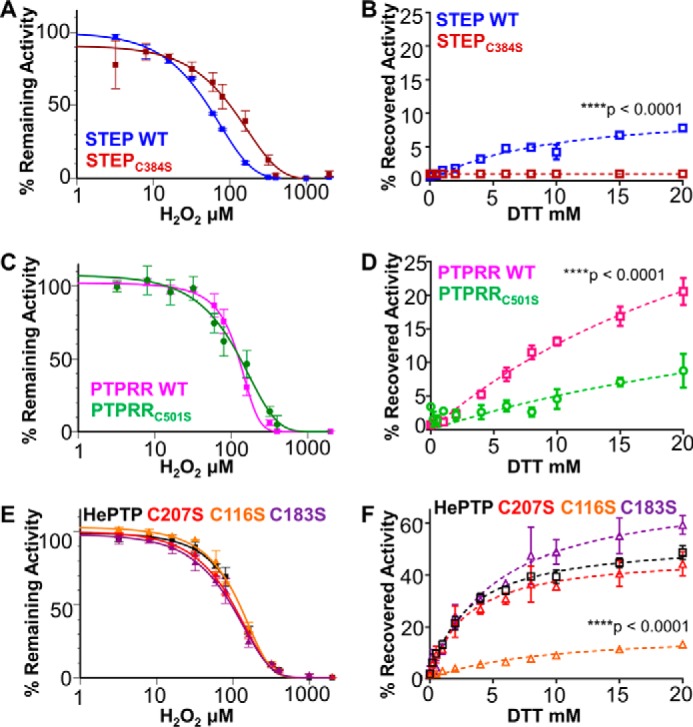
STEP and PTPRR form intramolecular disulfides, whereas HePTP does not. A, C, and E, inactivation of KIM-PTPs and BC and cysteine variants. 20 μm STEP and STEP(C384S) (BC) (A), PTPRR and PTPRR(C501S) (BC) (C), and HePTP, HePTP(C116S), HePTP(C183S) (BC), and HePTP(C207S) (E) were incubated with 0–2000 μm H2O2 for 15 min at room temperature and the resulting activities at steady-state measured. B, D, and F, steady-state reversibility of KIM-PTPs and their variants. 20 μm STEP (B), PTPRR (D), and HePTP (F) were incubated with 500 μm H2O2 for 15 min at room temperature; the samples were then incubated with varying concentrations of DTT (0–20 mm) for 15 min and their activities were measured to determine the recovered activities (described under “Experimental procedures”). ±S.E., n = 4. Two-way ANOVA test, with ****, p < 0.0001.
To further confirm that STEP(Cys384) and PTPRR(Cys501) are the BC residues that form disulfide bonds with their catalytic cysteines, we used LC/MS (mass spectrometry) in combination with iodoacetamide (IAM) labeling (29, 30). For this experiment, the individual proteins were incubated for 10 min with H2O2, to allow for disulfide bond formation, or incubated without H2O2. Samples were then treated with IAM to protect the free cysteine thiols. This was followed by tryptic digestion (in the absence of reducing agent to preserve existing disulfide bond(s)), after which the samples were analyzed using MS. As a control, a second set of samples was prepared identically with the exception that after digestion, the sample were incubated with both DTT (to reduce any disulfide bonds) and IAM (to label the now free cysteines previously protected by disulfide bonds); these control samples are expected to have MS profiles identical to the untreated samples.
As predicted by the BC variant experiments, both disulfide-linked peptides were observed in the oxidized samples, which correspond to tryptic fragments with monoisotopic masses MH4+ and MH5+ of 1315.8737/1052.8972 and 572.2944/458.0387 for STEP and PTPRR, respectively (Fig. 5, A and B; supplemental Fig. S3E; Table 2). The peptides were not present in untreated samples (no H2O2). They were also not present when the oxidized samples were subsequently treated with DTT (Fig. 5, A and B; supplemental Fig. S3F; Table 2). This shows that the presence of these disulfide-linked peptides is strictly dependent on H2O2-mediated oxidation. To confirm that the observed disulfide-linked peptides were generated intra-molecularly, we used nuclear magnetic resonance (NMR) spectroscopy. First, we collected a 2D [1H,15N]TROSY NMR spectrum for STEP and PTPRR, which are of high quality for 35-kDa proteins. We then oxidized both proteins using various concentrations of H2O2 for 10 min (the reaction was quenched using catalase). Only small chemical shift perturbations (CSPs) or minimal line broadening were observed for both PTPRR and STEP in oxidized versus non-oxidized samples. Mapping these CSPs on the primary sequence and structure of STEP (the sequence-specific backbone assignment is only available for STEP (31) and not for PTPRR), showed that all CSPs are, as expected, in or around the active site (supplemental Fig. S4, A–D). Together, the kinetic, MS, and NMR data confirmed that the mechanism used by both STEP and PTPRR for reversible oxidation is intramolecular disulfide bond formation between their catalytic and backdoor cysteines.
Figure 5.
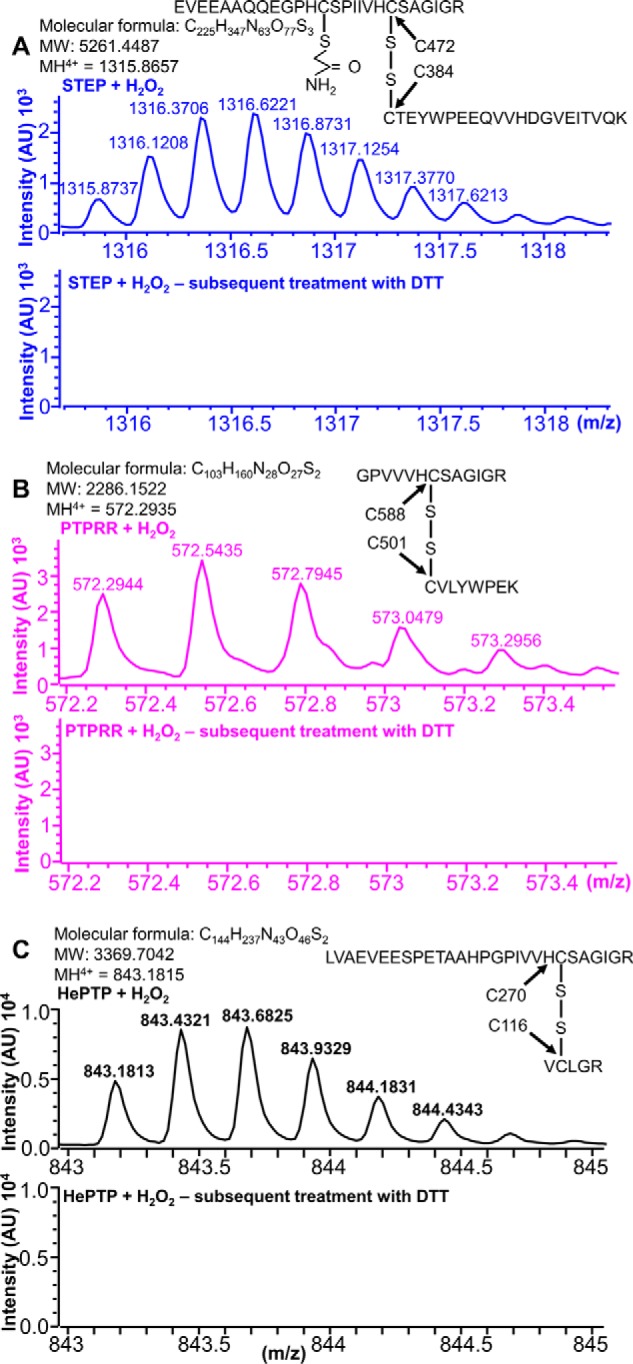
Identification of the disulfide-linked peptides in oxidized HePTP, STEP, and PTPRR using LC-MS. A–C, STEP, PTPRR, and HePTP treated with H2O2 (top) or treated with H2O2 and subsequently incubated with 10 mm DTT and 55 mm IAM (bottom). Mass errors at MH4+ were 6.0, 5.2, and −0.2 ppm for STEP, PTPRR, and HePTP, respectively.
Table 2.
Monoisotopic masses of disulfide-linked peptides of HePTP, STEP, and PTPRR detected using LC-MS
| PTPs | MH4+ | Mass difference | MH5+ | Mass difference |
|---|---|---|---|---|
| ppm | ppm | |||
| HePTP | 843.1815 | −0.2 | 674.7472 | 5.0 |
| STEP | 1315.8737 | 6.0 | 1052.8973 | 3.0 |
| PTPRR | 572.2944 | 5.2 | 458.0387 | 1.6 |
HePTP does not stabilize its reversibly oxidized state by forming a disulfide bond with its BC
To identify the mechanism used by HePTP to stabilize its reversibly oxidized state, we generated a BC residue-deficient variant (HePTP(C183S)) and measured its ability to be reactivated. CD studies showed that the secondary structure and stability of HePTP(C183S) were unaffected by the mutation (supplemental Fig. S5A). However, the catalytic activity of HePTP(C183S) was reduced 7-fold when compared with wt (supplemental Fig. S5B; supplemental Table S1; to compensate for the reduced activity of HePTP(C183S), increased protein concentrations were used for all experiments). We then measured the H2O2-mediated inactivation and subsequent reactivation by DTT of HePTP(C183S). Unexpectedly, and unlike STEP(C384S) and PTPRR(C501S), the H2O2-mediated inhibition of HePTP(C183S) is fully reversible, reaching levels virtually identical to that observed for wt HePTP (Fig. 4, E and F). Thus, these data show that the HePTP BC (Cys183) is dispensable for HePTP reversible oxidation.
To identify if an alternative cysteine is responsible for stabilizing the reversibly oxidized state of HePTP, we examined two surface exposed cysteines: Cys116 and Cys207. Unlike Cys183, Cys116 and Cys207 are distal from the active site, ∼20 Å away from Cys270. We then measured the H2O2-mediated inactivation and subsequent reactivation by DTT of HePTP(C207S) and HePTP(C116S). Unlike HePTP(C183S), the enzymatic activity of both HePTP(C116S) and HePTP(C207S) is essentially identical to that of HePTP (supplemental Table S1; supplemental Fig. S5B). They are also equally susceptible to H2O2-mediated inactivation (Fig. 4E). However, only HePTP(C207S) is reactivated by DTT; HePTP(C116S) is not (Fig. 4F). This demonstrates that Cys116 is required to stabilize the reversible oxidized state of HePTP.
HePTP uses an intermolecular disulfide bond to stabilize its reversible oxidized state
To confirm that a disulfide bond is formed between the HePTP active site Cys270 and surface-exposed Cys116, we used LC/MS in combination with IAM labeling. Samples were prepared as described for STEP and PTPRR. Briefly, the proteins were incubated for 10 min with or without H2O2, treated with IAM to protect the free cysteine thiols, digested using trypsin, and the resulting peptides analyzed using LC/MS. The H2O2-treated samples contained a tryptic peptide that corresponded to the disulfide-linked peptide between Cys270 and Cys116 (monoisotopic masses of 843.1813, MH4+, and 674.7472, MH5+; Fig. 5C; supplemental Fig. S5C). Furthermore, this peptide was not detected in the untreated HePTP sample. It was also not observed in the oxidized sample that was subsequently treated with DTT prior to LC/MS measurements (supplemental Fig. S5D). The latter result confirms that the H2O2-oxidized Cys116-Cys270 disulfide bond is reversible, as it was reduced by DTT (Fig. 5C; supplemental Fig. S5C; Table 2). We then repeated the LC/MS experiments using HePTP(C270S) and HePTP(C116S). In contrast to the WT protein, no linker peptide was identified in the LC-MS spectra of either HePTP(C270S) or HePTP(C116S) variant. This confirms that the reversible disulfide bond is formed between HePTP residues Cys116 and Cys270. Last, at high H2O2 concentrations (500 μm), in which HePTP is 100% inhibited and has only a 50% likelihood of reactivation, it is possible to identify both the reversible Cys270-Cys116 linker peptide as well as the irreversible sulfinic and sulfonic acid forms of Cys270 (supplemental Fig. S6).
Because Cys116 is more than 20 Å away from Cys270, the formation of this reversible disulfide bond must be intermolecular and not intramolecular. To test this, we used size exclusion chromatography (SEC), non-reducing SDS-PAGE, and NMR spectroscopy (2D [1H,15N]TROSY). The samples were prepared by incubating HePTP with either (a) increasing concentrations of H2O2 for a single length of time or (b) a single concentration of H2O2 but different lengths of time. SEC analysis of both samples clearly showed monomeric, dimeric, and at higher concentrations or later time points, oligomeric species (Fig. 6A; supplemental Fig. S7). This result was mirrored in the non-reducing SDS-PAGE (Fig. 6B). These analyses confirmed that dimer and oligomer formation is dependent on both oxidant concentration and time (supplemental Fig. S7). In the NMR analysis, three events were observed: 1) small CSPs; 2) an overall uniform decrease in peak intensity, most likely due to dimerization/multimerization as seen in SEC; and 3) the appearance of additional high-intensity peaks in the center of the spectrum, typical for peaks found in flexible, loop-like regions (Fig. 7, left panels; supplemental Fig. S8). The appearance of these new peaks correlated with the CD data that showed a time-dependent reduction of α-helical content upon H2O2 addition (supplemental Fig. S9A). Cys116 is in a mixed helical/loop region in HePTP and thus it is most likely that this region partially unfolds to allow the disulfide bond between Cys116 and Cys270 to form. Correspondingly, oxidized HePTP has two transition temperatures in its CD melting curve (supplemental Fig. S9B). In contrast, oxidized HePTP(C116S) exhibits only a single transition, similar to oxidized STEP and PTPRR (supplemental Fig. S9, C–E). Thus, it is likely that the first observed transition in the oxidized HePTP CD melting experiment reflects the unfolding of the Cys116 region and the second transition corresponds to the complete unfolding of oxidized HePTP. The observed CSPs belong to residues about the active site as well as near Cys116, in agreement with the LC/MS data that show the reversible disulfide bond occurs between Cys270 and Cys116. Moreover, these data further confirm that the observed disulfide is intermolecular, as an intramolecular disulfide bond between these residues would require much larger structural changes and, as a consequence, lead to extensive CSPs throughout HePTP. Last, we repeated the NMR experiments to test for reversibility by adding DTT to the samples after a 10-min incubation with H2O2. Indeed, the spectra regained some peak intensity as well as the number of high-intensity peaks was reduced, further supporting the reversible nature of this transition, confirmed also by the non-reducing SDS-PAGE results (Figs. 6B and 7, right panels; supplemental Fig. S10).
Figure 6.
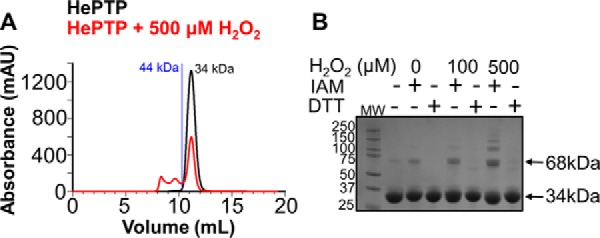
Size exclusion chromatography and non-reducing SDS-PAGE of oxidized HePTP. A, HePTP (34 kDa) was incubated in the absence (black) or presence of 500 μm (red) H2O2 for 10 min (120 units/ml of catalase was used to quench the reaction); blue line corresponds to 44-kDa standard. B, HePTP was incubated in the presence of 0, 100, and 500 μm H2O2 for 10 min (60 units/ml of catalase was used to quench the reaction). 10 mm IAM or 10 mm DTT were used to either stabilize the free cysteines or reduce the disulfide bonds, respectively.
Figure 7.
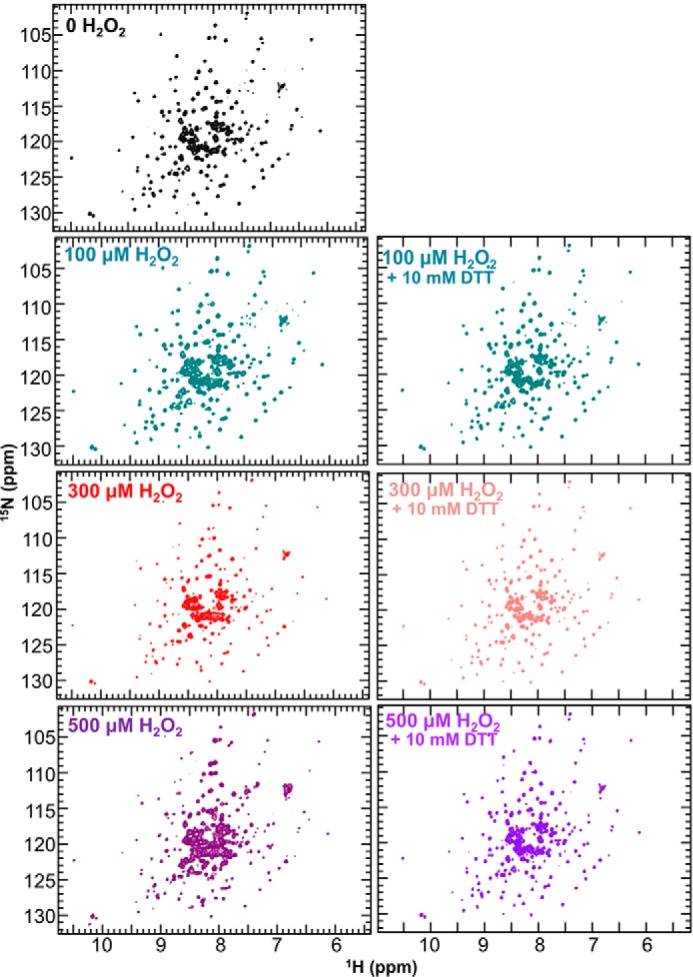
2D [2H,15N]TROSY NMR data of HePTP in presence of H2O2. Left, [2H,15N]TROSY spectra of 2H,15N-labeled 97 μm HePTP (black) in the presence of 100 (dark cyan), 300 (red), and 500 μm (purple) H2O2. Right, 2H,15N-labeled 97 μm HePTP in the presence of 100 μm (dark cyan), 300 μm (light pink), and 500 μm (light purple) H2O2 after addition of 10 mm DTT.
Discussion
107 human genes encode PTPs (32), which are classified as tyrosine-specific non-receptor PTPs, receptor PTPs, and DUSPs (33). It has become apparent that most PTPs are readily oxidized and thus are temporarily or permanently inhibited by ROS (10, 34, 35). Detailed kinetic oxidation profiles of several PTPs have been reported that show wide variations in oxidation kinetics as well as the use of distinct molecular mechanisms to stabilize the reversible oxidized state (36). Here we expand on these results by studying the oxidation profile of the KIM-PTP family, which includes HePTP, STEP, and PTPRR. Overall, the reported rates of reversible oxidation (k1, Fig. 1) for non-receptor PTPs are between 8 and 160 m−1 s−1: 1) PTP1B 9.1 m−1 s−1 (26), 17 m−1 s−1 (27), and 42.8 m−1 s−1 (37); 2) SHP2 8.8 m−1 s−1 and SHP1 9.4 m−1 s−1 (21); and 3) Cdc25B 164 m−1 s−1 (38). Here, we show that HePTP (8.8 m−1 s−1), STEP (18 m−1 s−1), and PTPRR (13 m−1 s−1) have comparable rates. However, whereas all KIM-PTP family members are susceptible to oxidation, their kinetic profiles vary significantly. The reactivation rate of HePTP using DTT as a reducing agent (0.8 m−1 s−1) is similar to SHP2 (0.84 m−1 s−1), SHP1 (0.33 m−1 s−1) (21), Cdc25B (0.5 m−1 s−1) (38), and PTP1B (0.33 m−1 s−1) (27). However, the DTT-mediated reactivation rates are much slower for STEP (0.073 m−1 s−1) and PTPRR (not determined), which show that STEP and PTPRR are comparatively slowly reactivated upon oxidation; in fact, they are the lowest reactivation rates thus far reported for any PTP when DTT is used as a reducing agent. One possibility for the slow reactivation of STEP and PTPRR by DTT might be that STEP and PTPRR are more rapidly reactivated by reductases such as glutaredoxin or thioredoxin, as it was previously observed for PTP1B and Cdc25B (27, 38).
Previous studies have demonstrated that PTPs use distinct molecular mechanisms to stabilize their reversible oxidation state (9, 22, 26). Here, we show that STEP and PTPRR use an intramolecular disulfide bond. Although this was the second mechanism discovered, multiple studies, including this one, have revealed that this is the mechanism most commonly used by PTPs to stabilize their reversible oxidation state. However, our data also unexpectedly show that HePTP uses a distinct mechanism. Namely, it forms an intermolecular disulfide bond between its active site cysteine (Cys270) and a surface-exposed cysteine residue (Cys116). This intermolecular disulfide bond leads to dimerization and oligomerization (Fig. 8). This mechanism is novel and has so far not been described for any other PTP. Previously, the most closely related mechanism was intermolecular disulfide bond formation for receptor type PTPs, including RPTPα (39, 40) and RPTPϵ, as well as that of non-receptor PTPϵ (41), RPTPμ, LAR, and CD45 (42). However, in these cases, the active site cysteine forms a disulfide bond with an active site cysteine of another molecule forming dimerization between PTP domains, specifically their D2 domains.
Figure 8.
Reversible oxidation mechanisms of PTPs.
In summary, although having closely related sequences, structures, and functions, the family of KIM-PTPs have significantly different oxidation profiles. Moreover, once oxidized, STEP and PTPRR are only very slowly reactivated by DTT. These data are important as they highlight that oxidation protection is critical when analyzing these PTPs for drug screening. Furthermore, HePTP is a cytoplasmic protein-tyrosine phosphatase that forms an intermolecular dimer between the active site cysteine and a surface cysteine to stabilize its intermediate oxidized state. In conclusion, regulation of HePTP by oxidative stress affects it conformation and activity, whereas for STEP and PTPRR it only affects their activity.
Experimental procedures
Expression and purification of KIM-PTPs
DNA coding the human HePTP, STEP, and PTPRR catalytic domains (residues 44–339, 244–539, and 361–655, respectively) were subcloned into RP1B as previously described (43). Site-directed mutagenesis was used to create all variants (Agilent Genomics). For protein expression, plasmid DNAs were transformed into Escherichia coli BL21(DE3) RIL cells (Agilent). Cells were grown in Luria broth in the presence of selective antibiotics at 37 °C to an A600 of ∼0.8, and expression was induced by the addition of 1 mm isopropyl thio-β-d-galactoside. Induction proceeded overnight at 18 °C prior to harvesting by centrifugation at 7,647 × g (15 min, 4 °C). Cell pellets were stored at −80 °C until purification. For NMR measurements, expression of uniformly 2H,15N- or 2H,15N,13C-labeled KIM-PTPs was facilitated by growing cells in D2O-based M9 minimal media containing 1 g/liter of 15NH4Cl and/or 4 g/liter of d-[2H,13C]glucose (CIL or Isotec) as the sole nitrogen and carbon sources, respectively. Multiple rounds (25, 50, 75, 90, and 100%) of D2O adaptation was necessary for high-yield expression (44).
Cell pellets were resuspended in Lysis buffer (50 mm Tris-HCl, pH 8.0, 500 mm NaCl, 5 mm imidazole, 0.1% Triton X-100) and lysed using high pressure homogenization (Avestin C3 EmulsiFlex). The lysate was cleared by centrifugation (40,905 × g, 45 min, 4 °C). The supernatant was filtered and loaded onto a nickel-nitrilotriacetic acid column equilibrated in Buffer A (50 mm Tris-HCl, pH 8.0, 500 mm NaCl, 5 mm imidazole). Protein was eluted in Buffer B (50 mm Tris-HCl, pH 8.0, 500 mm NaCl, 300 mm imidazole). The pooled eluted protein was incubated with tobacco etch virus overnight at 4 °C in dialysis buffer (10 mm Tris-HCl, pH 8.0, 100 mm NaCl). The next day, a ”subtraction“ His tag purification was performed to remove tobacco etch virus and the cleaved His tag. Final purification was achieved using SEC (Superdex 75 26/60, GE Healthcare) equilibrated in Analysis Buffer (10 mm Tris-HCl, pH 7.8, 100 mm NaCl for HePTP; 50 mm Hepes, pH 7.3, 150 mm NaCl for STEP and 50 mm Hepes, pH 7.5, 150 mm NaCl for PTPRR). All experiments were performed in Analysis Buffer.
Determination of PTPase catalytic rates using pNPP as a substrate
The PTPase activities HePTP(44–339) and variants (0.3 μm), STEP(344–539) and C384S (0.2 μm), PTPRR(361–655) and C501S (0.15 μm) were assayed at 30 °C for 30 min in reaction mixtures containing a range of pNPP concentrations (0, 50, 100, 250, 500, 750, 1000, 2000, 3000, 4000, 6000, and 8000 μm). The reaction was stopped with 100 μl of 1 m NaOH and the pNPP absorbance was measured at 405 nm using a microplate spectrophotometer (BioTek). The PTPase rates were calculated using the molar extinction coefficient of pNPP of 18,000 m−1 cm−1. The hydrolysis of pNPP by PTPs is typically pH-dependent, with the maximal activity occurring at acidic pH values, typically between 5.5 and 7.0. To identify the pH values at which the KIM-PTPs are maximally active, we measured the pNPP hydrolysis rates of HePTP, STEP, and PTPRR over a broad range of pH values. Because the susceptibility of oxidation increases with increasing pH (45), all oxidation experiments for HePTP, STEP, and PTPRR were analyzed at pH values where they were both active and maximally susceptible to oxidation, namely, pH 7.8, 7.3, and 7.5, respectively.
KIM-PTP inactivation by H2O2 and subsequent reactivation by DTT
To measure the susceptibility of the KIM-PTPs to oxidation, HePTP(44–339), STEP(344–539), and PTPRR(361–655) and variants (20 μm) were incubated with different concentrations of H2O2 (0, 3.2, 8, 16, 32, 60, 80, 160, 320, 400, 1000, and 2000 μm) for 15, 60, and 120 min at room temperature. 5 μl of each reaction was then incubated in buffer (75/80 μl) for 10 min at room temperature. pNPP (2666 μm; 20 μl for HePTP and 2000 μm; 15 μl for STEP and PTPRR) was then added and the reaction was incubated at 30 °C for 15 min. To determine the ability of DTT to reverse the H2O2-mediated oxidation, identical experiments were performed with the exception that after incubation with H2O2, 5 μl of each reaction was incubated with buffer containing 10 mm DTT prior to activity measurements. The IC50 values for H2O2-mediated KIM-PTP inhibition were determined by identifying the concentration of H2O2 that resulted in a 50% loss of activity.
Fast-kinetics of PTPs
To analyze the oxidation rate of HePTP(44–339) and C116S, STEP(344–539) and PTPRR(361–655) and C501S, 5 μm were incubated with H2O2 at different concentrations (0, 25, 50, 100, 250, 500, 1000, 2000, 3000, 4000, and 5000 μm) at different times, 10, 20, 50, 75, 100, 125, 150, 175, 200, 250, 300, 400, 500, 700, and 900 s at room temperature. 5 μl from this reaction was taken and transferred to buffer in the presence of 15 units/ml of catalase. After, 2000 μm pNPP was added and the reaction was incubated at 30 °C for 15 min. The inhibition was calculated in percentage considering the point without H2O2 as 100% for each point and plotted as a function of time to extract the kobs, using a single exponential decay equation, y = ae−kobst, then, the kobs for each H2O2 concentration was plotted as a function of H2O2 concentration to extract the oxidation rate from linear fit, y = y0 + ax. To extract the reversible rate constant, H2O2 concentrations from 25 to 500 μm (observed from steady-state stationary experiment) were used, and to extract the irreversible rate constant, H2O2 concentrations from 1000 to 5000 μm (observed from steady state stationary experiment) were used. The observed rate constants (kobs) for each H2O2 curve were then plotted as function of H2O2 concentration to obtain the reversible oxidation rate (k1) and irreversible oxidation state (k2).
To analyze the reversibility step of oxidation, 5 μm HePTP(44–339), STEP(344–539), and PTPRR(361–655) were incubated with 500 μm H2O2 for 10 min in syringe 1, then in 4000 μm pNPP with DTT (2.5, 5, 10, 20, 30, or 40 mm) in syringe 2, and the sample from both syringes were mixed using the air pressure. The concentrations after mixing were 2.5 μm for PTPs, 250 μm for H2O2, 2000 μm for pNPP and 1.25, 2.5, 5, 10, 15, or 20 mm for DTT. The experiment was performed using a fast-kinetics accessory attached to a Horiba FluoroMax-4 Spectrofluorimeter with dead time of 10 ms, and parameter setting of A405 nm, slit width 3 nm, temperature 30 °C. The observed constant was extracted using single exponential, y = y0 + a(1 − e−bx), and then plotted as a function of DTT concentration to get the reversibility constant, y = y0 + k4x.
Reactivation experiments
HePTP(44–339), STEP(344–539), PTPRR(361–655), and variants (20 μm) were incubated with or without 500 μm H2O2 for 15 min at room temperature. 5 μl of these reactions were then incubated with 2000 μm pNPP in the presence (0, 0.2, 0.5, 1, 2, 4, 6, 8, and 10 mm) or absence of DTT for 15 min at 30 °C. The resulting inhibition rates and the recovered activities were determined by normalizing to the samples without H2O2.
Secondary structure and stability analysis by circular dichroism
CD spectra were analyzed with 2.5 μm HePTP, HePTP(C116S), and HePTP(C183S) and STEP and PTPRR without or with 500 μm H2O2 at 25 °C with wavelength scan 260–190 nm, data pitch 0.5 nm, scanning mode continuous, scanning speed 50 nm/min, and 1-nm bandwidth with 3 accumulations. Before spectra, STEP and PTPRR were dialyzed overnight against buffer 10 mm Tris-HCl, pH 7.5, for PTPRR and at pH 7.3 for STEP and 100 mm NaCl. To acquire Tm for each protein in the presence or absence of 500 μm H2O2, the spectra were collected with a wavelength scan at 220 nm and temperature scan from 10 to 90 °C, with data pitch 1 °C, temperature slope of 1 °C/min, bandwidth 1 nm. Tm values were extracted using a two-state transition of a monomer from folded to unfolded state equations, assuming that the heat capacity of folded and unfolded are equal or correcting it as linear changes in ellipticity as a function of temperature (46). The CD measurements were performed on a J-815 CD spectropolarimeter (Jasco).
SEC analysis of HePTP
HePTP(44–339) was incubated with 0, 100, 300, 500, or 1000 μm H2O2 for 10 min at room temperature. HePTP was also incubated with 500 μm H2O2 for varying times (5, 10, 15, 20, and 30 min). In all cases, the reaction was stopped by the addition of 120 units/ml of catalase. 500 μl of oxidized HePTP was applied to a Superdex S75 10/300 GL SEC (GE Healthcare). An SEC standard curve (Bio-Rad) was applied to the same column/buffer as reference.
Non-reducing SDS-PAGE of HePTP
HePTP(44–339) (1.7 mg) was incubated with 0, 100, or 500 μm H2O2 for 10 min at room temperature. The reaction was stopped by addition of 60 units/ml of catalase. The reactions were then incubated with IAM (10 mm) in the dark or 10 mm DTT. After 30 min, the samples were mixed with sample buffer with or without DTT and SDS-PAGE was performed.
Sample preparation for mass spectrometry
1-ml (50 μm) samples of HePTP (WT, HePTP(C116S), HePTP(C270S)), STEP (WT, STEP(C384S)), and PTPRR(WT and PTPRR(C501S)) were incubated with (treated) or without (untreated) H2O2 (500 μm for 10 min) after which the reaction was stopped by addition of catalase (30 units/ml). The reactions were then incubated with IAM (2 mm) in the dark. After 30 min, 8 m urea was added to each sample and further incubated for 10 min. Each sample was then diluted 8-fold with 50 mm NH4HCO3, pH 8.3, resulting in a final concentration of 0.212 μg of protein and 1 m urea. Trypsin (1:25) was then added to digest 100 μg of protein at 37 °C, for ∼15 h. This produced the (i) untreated and (ii) treated samples; after desalting 100 μl using a C18 tips (Thermo Scientific), samples (i) and (ii) were analyzed by mass spectrometry. 300 μl of the remaining (not used for MS) untreated and treated samples were then incubated with 10 mm DTT and 55 mm IAM to produce the (iii) untreated followed by incubation with DTT and IAM and (iv) treated followed by incubated with DTT and IAM samples. After desalting samples (iii) and (iv) using C18 tips, they were immediately analyzed by mass spectroscopy.
Protein digest LC-MS
Samples (i–iv) were separated on the Agilent 1260 HPLC system using a Waters Symmetry separation column, C18, particle size 3.5 μm, 2.1 × 100 mm. The HPLC system was coupled to an Agilent 6530 Q-TOF mass spectrometer, using the following buffer systems: (A) 2% acetonitrile, 0.1% formic acid in water; (B) 90% acetonitrile, 0.1% formic acid in water. Peptides were eluted at a 0.25 ml/min flow rate with the following gradients: 5% B for 5 min, gradient to 45% B over 24.5 min, gradient to 95% B in 2 min, 95% B for 2 min, gradient from 95 to 5% B in 4 min, 5% B for 10 min. The effluent from the HPLC column was directly introduced into the mass spectrometer. The Agilent 6530 instrument was operated with an electrospray ion source in the positive ionization mode, mass range 100–3200 m/z, and 1 spectra/s acquisition rate. Data were collected in both centroid and profile formats. Instrument control was through Agilent Mass Hunter LC-MS 6500 Q-TOF series software (version B.05.01). Data analysis was carried out with MassHunter Qualitative Analysis (version B.06.00) with BioConfirm software. Mass error were calculated using the following equation.
| (Eq. 1) |
NMR spectroscopy
NMR data were collected using Bruker Avance II 500 and Avance IIIHD 850 MHz NMR spectrometer equipped with TCI HCN Z-gradient cryoprobes at 298 K. NMR measurements of HePTP, STEP, and PTPRR were recorded using 2H,15N-labeled protein at a final concentration of ∼0.1 mm, in Analysis Buffer and 90% H2O, 10% D2O. The previously published sequence-specific backbone assignment of HePTP (BMRB 15680 (47)) was verified using 2H,15N,13C-labeled HePTP (0.5 mm) and 2D [1H,15N]TROSY, 3D TROSY-HNCA, 3D TROSY-HN(CO)CA, and 3D TROSY-HNCACB experiments. All NMR data were processed using NMRpipe (48) and analyzed using CcpNMR (49).
NMR analysis in the presence of H2O2
[2H,15N]HePTP, STEP, or PTPRR (0.1 mm) were incubated with different concentrations of H2O2 (0, 32, 100, 175, 300, and 500 μm for HePTP; 0, 80, and 250 μm for STEP and 0 and 1000 μm for PTPRR) for 10 min. The reaction was stopped upon addition of catalase (60 units/ml) and a 2D [1H,15N]TROSY spectra was recorded. 10 mm DTT was added to the oxidized HePTP samples to test reversibility. Chemical shift perturbations (Δδ) of PTPs in the absence and presence of H2O2 or in the absence and presence of DTT were calculated using Equation 2.
| (Eq. 2) |
Statistical analysis
Graphs were plotted in Sigma Plot 12.5 or GraphPad Prism 6. For all kinetics data, the statistical analysis was performed using the unpaired or paired t test (Sigma Plot 12.5), with significance of p < 0.05 or a two-way ANOVA analysis using Prism GraphPad 6. All rate constants were analyzed using Sigma Plot version 12.5.
Author contributions
L. E. S. F. M., R. P., and W. P. conceived the project, designed the experiments, undertook experiments, and wrote the manuscript. L. E. S. F. M. and T-L. S. performed the experiments and together with R. P. and W. P. analyzed the data. All authors reviewed the results and approved the final version of the manuscript.
Supplementary Material
This work was supported by American Diabetes Association Pathway to Stop Diabetes Grant 1-14-ACN-31, National Institutes of Health Grant R01NS091336, a Brazil Initiative Brown University grant (to W. P.), and National Institutes of Health Grant R01GM098482 (to R. P). The authors declare that they have no conflicts of interest with the contents of this article. The content is solely the responsibility of the authors and does not necessarily represent the official views of the National Institutes of Health.
This article contains Table S1 and Figs. S1–S10.
- KIM
- kinase interaction motif
- HePTP
- hematopoietic protein-tyrosine phosphatase
- STEP
- striatal-enriched protein-tyrosine phosphatase
- PTPRR
- protein-tyrosine phosphatase receptor type R
- ROS
- reactive oxygen species
- PTEN
- phosphatase and tensin homolog deleted on chromosome 10
- DSP
- dual specificity phosphatase
- pNPP
- p-nitrophenyl phosphate
- BC
- backdoor cysteine
- IAM
- iodoacetamide
- CSP
- chemical shift perturbation
- SEC
- size exclusion chromatography
- ANOVA
- analysis of variance.
References
- 1. Francis D. M., Różycki B., Koveal D., Hummer G., Page R., and Peti W. (2011) Structural basis of p38alpha regulation by hematopoietic tyrosine phosphatase. Nat. Chem. Biol. 7, 916–924 [DOI] [PMC free article] [PubMed] [Google Scholar]
- 2. Francis D. M., Kumar G. S., Koveal D., Tortajada A., Page R., and Peti W. (2013) The differential regulation of p38α by the neuronal kinase interaction motif protein tyrosine phosphatases, a detailed molecular study. Structure 21, 1612–1623 [DOI] [PMC free article] [PubMed] [Google Scholar]
- 3. Francis D. M., Koveal D., Tortajada A., Page R., and Peti W. (2014) Interaction of kinase-interaction-motif protein tyrosine phosphatases with the mitogen-activated protein kinase ERK2. PloS One 9, e91934. [DOI] [PMC free article] [PubMed] [Google Scholar]
- 4. Muñoz J. J., Tárrega C., Blanco-Aparicio C., and Pulido R. (2003) Differential interaction of the tyrosine phosphatases PTP-SL, STEP and HePTP with the mitogen-activated protein kinases ERK1/2 and p38α is determined by a kinase specificity sequence and influenced by reducing agents. Biochem. J. 372, 193–201 [DOI] [PMC free article] [PubMed] [Google Scholar]
- 5. Zanke B., Squire J., Griesser H., Henry M., Suzuki H., Patterson B., Minden M., and Mak T. W. (1994) A hematopoietic protein tyrosine phosphatase (HePTP) gene that is amplified and overexpressed in myeloid malignancies maps to chromosome 1q32.1. Leukemia 8, 236–244 [PubMed] [Google Scholar]
- 6. Xu J., Kurup P., Nairn A. C., and Lombroso P. J. (2012) Striatal-enriched protein tyrosine phosphatase in Alzheimer's disease. Adv. Pharmacol. 64, 303–325 [DOI] [PMC free article] [PubMed] [Google Scholar]
- 7. Sergienko E., Xu J., Liu W. H., Dahl R., Critton D. A., Su Y., Brown B. T., Chan X., Yang L., Bobkova E. V., Vasile S., Yuan H., Rascon J., Colayco S., Sidique S., et al. (2012) Inhibition of hematopoietic protein tyrosine phosphatase augments and prolongs ERK1/2 and p38 activation. ACS Chem. Biol. 7, 367–377 [DOI] [PMC free article] [PubMed] [Google Scholar]
- 8. Xu J., Chatterjee M., Baguley T. D., Brouillette J., Kurup P., Ghosh D., Kanyo J., Zhang Y., Seyb K., Ononenyi C., Foscue E., Anderson G. M., Gresack J., Cuny G. D., Glicksman M. A., et al. (2014) Inhibitor of the tyrosine phosphatase STEP reverses cognitive deficits in a mouse model of Alzheimer's disease. PLoS Biol. 12, e1001923. [DOI] [PMC free article] [PubMed] [Google Scholar]
- 9. Meng T. C., Fukada T., and Tonks N. K. (2002) Reversible oxidation and inactivation of protein tyrosine phosphatases in vivo. Mol. Cell 9, 387–399 [DOI] [PubMed] [Google Scholar]
- 10. Tanner J. J., Parsons Z. D., Cummings A. H., Zhou H., and Gates K. S. (2011) Redox regulation of protein tyrosine phosphatases: structural and chemical aspects. Antioxid. Redox Signal. 15, 77–97 [DOI] [PubMed] [Google Scholar]
- 11. Mahadev K., Zilbering A., Zhu L., and Goldstein B. J. (2001) Insulin-stimulated hydrogen peroxide reversibly inhibits protein-tyrosine phosphatase 1b in vivo and enhances the early insulin action cascade. J. Biol. Chem. 276, 21938–21942 [DOI] [PubMed] [Google Scholar]
- 12. Meng T. C., Buckley D. A., Galic S., Tiganis T., and Tonks N. K. (2004) Regulation of insulin signaling through reversible oxidation of the protein-tyrosine phosphatases TC45 and PTP1B. J. Biol. Chem. 279, 37716–37725 [DOI] [PubMed] [Google Scholar]
- 13. Loh K., Deng H., Fukushima A., Cai X., Boivin B., Galic S., Bruce C., Shields B. J., Skiba B., Ooms L. M., Stepto N., Wu B., Mitchell C. A., Tonks N. K., Watt M. J., et al. (2009) Reactive oxygen species enhance insulin sensitivity. Cell Metab. 10, 260–272 [DOI] [PMC free article] [PubMed] [Google Scholar]
- 14. Lee K., and Esselman W. J. (2002) Inhibition of PTPs by H2O2 regulates the activation of distinct MAPK pathways. Free Radic. Biol. Med. 33, 1121–1132 [DOI] [PubMed] [Google Scholar]
- 15. Haque A., Andersen J. N., Salmeen A., Barford D., and Tonks N. K. (2011) Conformation-sensing antibodies stabilize the oxidized form of PTP1B and inhibit its phosphatase activity. Cell 147, 185–198 [DOI] [PMC free article] [PubMed] [Google Scholar]
- 16. Claiborne A., Mallett T. C., Yeh J. I., Luba J., and Parsonage D. (2001) Structural, redox, and mechanistic parameters for cysteine-sulfenic acid function in catalysis and regulation. Adv. Protein Chem. 58, 215–276 [DOI] [PubMed] [Google Scholar]
- 17. Salmeen A., Andersen J. N., Myers M. P., Meng T. C., Hinks J. A., Tonks N. K., and Barford D. (2003) Redox regulation of protein tyrosine phosphatase 1B involves a sulphenyl-amide intermediate. Nature 423, 769–773 [DOI] [PubMed] [Google Scholar]
- 18. van Montfort R. L., Congreve M., Tisi D., Carr R., and Jhoti H. (2003) Oxidation state of the active-site cysteine in protein tyrosine phosphatase 1B. Nature 423, 773–777 [DOI] [PubMed] [Google Scholar]
- 19. Yang J., Groen A., Lemeer S., Jans A., Slijper M., Roe S. M., den Hertog J., and Barford D. (2007) Reversible oxidation of the membrane distal domain of receptor PTPα is mediated by a cyclic sulfenamide. Biochemistry 46, 709–719 [DOI] [PubMed] [Google Scholar]
- 20. Tsai S. J., Sen U., Zhao L., Greenleaf W. B., Dasgupta J., Fiorillo E., Orrú V., Bottini N., and Chen X. S. (2009) Crystal structure of the human lymphoid tyrosine phosphatase catalytic domain: insights into redox regulation. Biochemistry 48, 4838–4845 [DOI] [PMC free article] [PubMed] [Google Scholar]
- 21. Chen C. Y., Willard D., and Rudolph J. (2009) Redox regulation of SH2-domain-containing protein tyrosine phosphatases by two backdoor cysteines. Biochemistry 48, 1399–1409 [DOI] [PubMed] [Google Scholar]
- 22. Buhrman G., Parker B., Sohn J., Rudolph J., and Mattos C. (2005) Structural mechanism of oxidative regulation of the phosphatase Cdc25B via an intramolecular disulfide bond. Biochemistry 44, 5307–5316 [DOI] [PubMed] [Google Scholar]
- 23. Lee C. U., Hahne G., Hanske J., Bange T., Bier D., Rademacher C., Hennig S., and Grossmann T. N. (2015) Redox modulation of PTEN phosphatase activity by hydrogen peroxide and bisperoxidovanadium complexes. Angew. Chem. Int. Ed. Engl. 54, 13796–13800 [DOI] [PMC free article] [PubMed] [Google Scholar]
- 24. Lo Conte M., and Carroll K. S. (2013) The redox biochemistry of protein sulfenylation and sulfinylation. J. Biol. Chem. 288, 26480–26488 [DOI] [PMC free article] [PubMed] [Google Scholar]
- 25. Tonks N. K. (2005) Redox redux: revisiting PTPs and the control of cell signaling. Cell 121, 667–670 [DOI] [PubMed] [Google Scholar]
- 26. Denu J. M., and Tanner K. G. (1998) Specific and reversible inactivation of protein tyrosine phosphatases by hydrogen peroxide: evidence for a sulfenic acid intermediate and implications for redox regulation. Biochemistry 37, 5633–5642 [DOI] [PubMed] [Google Scholar]
- 27. Parsons Z. D., and Gates K. S. (2013) Thiol-dependent recovery of catalytic activity from oxidized protein tyrosine phosphatases. Biochemistry 52, 6412–6423 [DOI] [PMC free article] [PubMed] [Google Scholar]
- 28. Critton D. A., Tautz L., and Page R. (2011) Visualizing active-site dynamics in single crystals of HePTP: opening of the WPD loop involves coordinated movement of the E loop. J. Mol. Biol. 405, 619–629 [DOI] [PMC free article] [PubMed] [Google Scholar]
- 29. Roeser J., Bischoff R., Bruins A. P., and Permentier H. P. (2010) Oxidative protein labeling in mass-spectrometry-based proteomics. Anal. Bioanal. Chem. 397, 3441–3455 [DOI] [PMC free article] [PubMed] [Google Scholar]
- 30. Sechi S., and Chait B. T. (1998) Modification of cysteine residues by alkylation: a tool in peptide mapping and protein identification. Anal. Chem. 70, 5150–5158 [DOI] [PubMed] [Google Scholar]
- 31. Francis D. M., Page R., and Peti W. (2014) Sequence-specific backbone 1H, 13C and 15N assignments of the 34 kDa catalytic domain of PTPN5 (STEP). Biomol. NMR Assign 8, 185–188 [DOI] [PubMed] [Google Scholar]
- 32. Alonso A., Sasin J., Bottini N., Friedberg I., Friedberg I., Osterman A., Godzik A., Hunter T., Dixon J., and Mustelin T. (2004) Protein tyrosine phosphatases in the human genome. Cell 117, 699–711 [DOI] [PubMed] [Google Scholar]
- 33. Chiarugi P., and Buricchi F. (2007) Protein tyrosine phosphorylation and reversible oxidation: two cross-talking posttranslation modifications. Antioxid. Redox Signal. 9, 1–24 [DOI] [PubMed] [Google Scholar]
- 34. Ross S. H., Lindsay Y., Safrany S. T., Lorenzo O., Villa F., Toth R., Clague M. J., Downes C. P., and Leslie N. R. (2007) Differential redox regulation within the PTP superfamily. Cell Signal. 19, 1521–1530 [DOI] [PubMed] [Google Scholar]
- 35. Karisch R., Fernandez M., Taylor P., Virtanen C., St-Germain J. R., Jin L. L., Harris I. S., Mori J., Mak T. W., Senis Y. A., Östman A., Moran M. F., and Neel B. G. (2011) Global proteomic assessment of the classical protein-tyrosine phosphatome and “Redoxome”. Cell 146, 826–840 [DOI] [PMC free article] [PubMed] [Google Scholar]
- 36. Brito P. M., and Antunes F. (2014) Estimation of kinetic parameters related to biochemical interactions between hydrogen peroxide and signal transduction proteins. Front. Chem. 2, 82. [DOI] [PMC free article] [PubMed] [Google Scholar]
- 37. Barrett W. C., DeGnore J. P., Keng Y. F., Zhang Z. Y., Yim M. B., and Chock P. B. (1999) Roles of superoxide radical anion in signal transduction mediated by reversible regulation of protein-tyrosine phosphatase 1B. J. Biol. Chem. 274, 34543–34546 [DOI] [PubMed] [Google Scholar]
- 38. Sohn J., and Rudolph J. (2003) Catalytic and chemical competence of regulation of cdc25 phosphatase by oxidation/reduction. Biochemistry 42, 10060–10070 [DOI] [PubMed] [Google Scholar]
- 39. Blanchetot C., Tertoolen L. G., and den Hertog J. (2002) Regulation of receptor protein-tyrosine phosphatase α by oxidative stress. EMBO J. 21, 493–503 [DOI] [PMC free article] [PubMed] [Google Scholar]
- 40. van der Wijk T., Overvoorde J., and den Hertog J. (2004) H2O2-induced intermolecular disulfide bond formation between receptor protein-tyrosine phosphatases. J. Biol. Chem. 279, 44355–44361 [DOI] [PubMed] [Google Scholar]
- 41. Toledano-Katchalski H., Tiran Z., Sines T., Shani G., Granot-Attas S., den Hertog J., and Elson A. (2003) Dimerization in vivo and inhibition of the nonreceptor form of protein tyrosine phosphatase ϵ. Mol. Cell. Biol. 23, 5460–5471 [DOI] [PMC free article] [PubMed] [Google Scholar]
- 42. Groen A., Overvoorde J., van der Wijk T., and den Hertog J. (2008) Redox regulation of dimerization of the receptor protein-tyrosine phosphatases RPTPα, LAR, RPTPμ and CD45. FEBS J. 275, 2597–2604 [DOI] [PubMed] [Google Scholar]
- 43. Peti W., and Page R. (2007) Strategies to maximize heterologous protein expression in Escherichia coli with minimal cost. Protein Expr. Purif. 51, 1–10 [DOI] [PubMed] [Google Scholar]
- 44. Peti W., and Page R. (2016) NMR Spectroscopy to study MAP kinase binding to MAP kinase phosphatases. Methods Mol. Biol. 1447, 181–196 [DOI] [PubMed] [Google Scholar]
- 45. Groen A., Lemeer S., van der Wijk T., Overvoorde J., Heck A. J., Ostman A., Barford D., Slijper M., and den Hertog J. (2005) Differential oxidation of protein-tyrosine phosphatases. J. Biol. Chem. 280, 10298–10304 [DOI] [PubMed] [Google Scholar]
- 46. Greenfield N. J. (2006) Using circular dichroism collected as a function of temperature to determine the thermodynamics of protein unfolding and binding interactions. Nat. Protoc. 1, 2527–2535 [DOI] [PMC free article] [PubMed] [Google Scholar]
- 47. Jeeves M., McClelland D. M., Barr A. J., and Overduin M. (2008) Sequence-specific 1H, 13C and 15N backbone resonance assignments of the 34 kDa catalytic domain of human PTPN7. Biomol. NMR Assign. 2, 101–103 [DOI] [PubMed] [Google Scholar]
- 48. Delaglio F., Grzesiek S., Vuister G. W., Zhu G., Pfeifer J., and Bax A. (1995) NMRPipe: a multidimensional spectral processing system based on UNIX pipes. J. Biomol. NMR 6, 277–293 [DOI] [PubMed] [Google Scholar]
- 49. Vranken W. F., Boucher W., Stevens T. J., Fogh R. H., Pajon A., Llinas M., Ulrich E. L., Markley J. L., Ionides J., and Laue E. D. (2005) The CCPN data model for NMR spectroscopy: development of a software pipeline. Proteins 59, 687–696 [DOI] [PubMed] [Google Scholar]
Associated Data
This section collects any data citations, data availability statements, or supplementary materials included in this article.