

Abstract
Background
The electrocardiographically measured QT interval (QT) is heritable and its prolongation is an established risk factor for several cardiovascular diseases. Yet, most QT genetic studies have been performed in European ancestral populations, possibly reducing their global relevance.
Objective
To leverage diversity and improve biologic insight, we fine-mapped 16 of the 35 previously identified QT loci (46%) in populations of African American (n=12,410) and Hispanic/Latino (n=14,837) ancestry.
Methods and Results
The 16 fine-mapped QT loci included on the Illumina Metabochip represented 21 independent signals, of which 16 (76%) were significantly (P-value≤9.1×10⁻⁵) associated with QT after inverse-variance weighted transethnic meta-analysis of racial/ethnic-specific multiple linear regression analyses adjusted for heart rate and clinical covariates. Through sequential conditional analysis we also identified three trans-ethnic novel SNPs at ATP1B1, SCN5A-SCN10A, and KCNQ1 and three Hispanic/Latino-specific novel SNPs at NOS1AP and SCN5A-SCN10A (two novel SNPs) with evidence of associations with QT independent of previous identified GWAS lead SNPs. Linkage disequilibrium patterns helped to narrow the region likely to contain the functional variants at several loci, including NOS1AP, USP50-TRPM7, and PRKCA, although intervals surrounding SLC35F1-PLN and CNOT1 remained broad in size (>100 kb). Finally, bioinformatics-based functional characterization suggested a regulatory function in cardiac tissues for the majority of independent signals that generalized and the novel SNPs.
Conclusion
Our findings suggest that a majority of identified SNPs implicate gene regulatory dysfunction in QT prolongation, that the same loci influence variation in QT across global populations, and that additional, novel, population-specific QT signals exist.
Keywords: Genetic epidemiology, minority health, QT interval, fine-mapping, electrocardiography
INTRODUCTION
The role of QT interval (QT) prolongation in the etiology of ventricular arrhythmias that predispose to sudden cardiac death (SCD), a leading cause of mortality,1 was recognized as early as 1957 upon the identification of a congenital long QT syndrome. Sixty years later, population-based research has demonstrated the potential for studies of QT prolongation to enhance mechanistic understanding of SCD3–5 as well as coronary heart disease6 and stroke.7 Drug-induced QT prolongation also has attracted regulatory scrutiny as the most common cause of the withdrawal or restricted marketing of pharmaceuticals.4, 5 Yet, identification of populations at increased risk of SCD following innate or acquired QT prolongation remains difficult, necessitating a better understanding of underlying molecular mechanisms.8
Genome-wide association studies (GWAS) have identified 35 QT loci,9–18 predominantly in large (n~100,000) populations of European descent,9–15 providing new insights into mechanisms underlying ventricular conduction.19 QT GWAS in Indian Asian,15 East Asian,16, 17 and African American populations have been performed, but identified fewer loci than GWAS in European descent populations, likely reflecting smaller sample sizes (n=2,994–12, lower genotyping array coverage,15,17,18or imputation to suboptimal reference panels. The global relevance of previously identified QT loci and whether population-specific SNP influencing QT exist therefore remain largely unknown. Further, several populations not yet included in QT GWAS, including Hispanics/Latinos, trace their recent origins to Europe, Africa, and the Americas,20 presenting exceptional yet underutilized opportunities for fine-mapping, particularly when combined with data from African Americans. Here, we extend our previous QT fine-mapping study of n=8,644 African American participants and 11 QT loci densely genotyped on the Illumina Metabochip array21 by including n=3,766 additional African American and n=14,837 Hispanic/Latinos participants and evaluating four additional loci.
MATERIALS AND METHODS
Study Populations
The Population Architecture Using Genomics and Epidemiology (PAGE) consortium is a National Human Genome Research Institute (NHGRI)-funded effort examining the epidemiologic architecture of genetic variants associated with human diseases and traits across diverse populations. Six PAGE studies,22 in addition to the Multi-Ethnic Study of Atherosclerosis, contributed data to this study (Online Material and Methods). For all populations, race/ethnicity was defined by self-report; ancestral outliers were identified principal components analysis and excluded. All procedures performed in studies of human participants were approval by local institutional review boards.
Genotype platforms
The Metabochip is a custom Illumina iSELECT array designed to support large scale follow up of cardiovascular and metabolic loci, including QT.23 Sixteen QT loci (46% of QT loci identified as of October, 2016) were represented on the Metabochip (Table 1, Online Supplement). Index SNPs, i.e. locus-specific SNPs with the lowest P-value reported by previous GWAS, that were not directly genotyped on the Metabochip were, when possible, represented by SNPs in high linkage disequilibrium (LD; r2 ≥ 0.80) with the index SNP in the ancestral population in which the association was first reported.
Table 1.
Association results examining evidence of generalization for trans-ethnic lead SNPs at 21 independent signals at 16 QT loci to n=12,410 African Americans and n=14,837 Hispanic/Latinos.
| Genome-wide Significant Published Index | ||||||||||||||||||||
|---|---|---|---|---|---|---|---|---|---|---|---|---|---|---|---|---|---|---|---|---|
| SNPs | Trans-Ethnic Population | African Americans | Hispanic/Latino | |||||||||||||||||
| Locus | Ind · Signal | Index SNPc | A1/A2 | Race/Ethnicity | Beta | SE | CAF | Lead SNP | A1/A2 | Beta | SE | P-value | Beta | SE | P-value | CAF | Beta | SE | P-value | CAF |
| RNF207 | 1 | rs846111 | C/G | EA | 1.73 | 0.13 | 0.28 | rs846111 | C/G | 1.73 | 0.29 | 1.4×10⁻⁹ | 0.39 | 0.62 | 0.54 | 0.056 | 2.09 | 0.32 | 8.4×10⁻¹¹ | 0.17 |
| NOS1AP | 1 | rs12143842 | T/C | EA | 3.50 | 0.11 | 0.24 | rs12143842 | T/C | 2.86 | 0.23 | 1.1×10⁻³⁵ | 2.40 | 0.37 | 6.9×10⁻¹¹ | 0.12 | 3.15 | 0.29 | 6.3×10⁻²⁷ | 0.22 |
| rs2880058 | G/A | EA | 0.19d | 0.06d | 0.32 | |||||||||||||||
| rs1572498a | G/T | EA | 4.90 | 1.0 | 0.39 | |||||||||||||||
| rs10494365 | NA | AS | NA | NA | 0.39 | |||||||||||||||
| 2 | rs4657178 | G/T | EA | 2.19 | 0.26 | 0.33 | rs12123267 | T/C | 1.89 | 0.19 | 1.9×10⁻²³ | 1.60 | 0.27 | 2.0×10⁻⁹ | 0.30 | 2.18 | 0.27 | 4.8×10⁻¹⁶ | 0.28 | |
| rs12029454 | A/G | EA | 3.00 | 0.18 | 0.15 | |||||||||||||||
| rs10800352a | N/A | AS | 1.71 | NR | NR | |||||||||||||||
| 3 | rs16857031 | G/C | EA | 3.32 | 0.35 | 0.14 | rs885148 | T/C | 1.29 | 0.21 | 6.6×10⁻¹⁰ | 1.26 | 0.37 | 8.1×10⁻⁴ | 0.14 | 1.30 | 0.25 | 2.1×10⁻⁷ | 0.46 | |
| ATP1B1 | 1 | rs10919071 | A/G | EA | 2.05 | 0.29 | 0.87 | rs72706963 | C/T | 2.46 | 0.29 | 2.7×10⁻¹⁷ | 2.03 | 0.78 | 9.0×10⁻³ | 0.97 | 2.53 | 0.31 | 7.2×10⁻¹⁶ | 0.82 |
| rs10919070 | C/A | EA | 1.68 | 0.14 | 0.13 | |||||||||||||||
| 2 | rs12061601a | C/T | AA | 1.89 | 0.30 | 0.29 | rs12061601 | C/T | 2.01 | 0.22 | 3.4×10⁻¹⁹ | 1.91 | 0.28 | 8.4×10⁻¹² | 0.26 | 2.19 | 0.38 | 5.8×10⁻⁹ | 0.12 | |
| SCN5A-SCN10A | 1 | rs6793245 | A/G | EA | 1.12 | 0.10 | 0.32 | rs62241188 | G/C | 1.64 | 0.30 | 3.2×10⁻⁸ | 0.87 | 0.54 | 0.11 | 0.05 | 1.96 | 0.35 | 2.8×10⁻⁸ | 0.13 |
| rs12053903 | C/T | EA | 1.40 | 0.18 | 0.34 | |||||||||||||||
| rs11129795 | A/G | EA | 1.27 | 0.23 | 0.23 | |||||||||||||||
| SLC35F1-PLN | 1 | rs11153730 | T/C | EA | 1.65 | 0.10 | 0.50 | rs763254 | T/C | 1.58 | 0.20 | 2.1×10⁻¹⁵ | 1.12 | 0.28 | 7.3×10⁻⁵ | 0.75 | 2.03 | 0.28 | 4.6×10⁻¹³ | 0.74 |
| rs11970286 | T/C | EA | 1.64 | 0.20 | 0.44 | |||||||||||||||
| rs11756438 | A/C | EA | 1.58 | 0.18 | 0.47 | |||||||||||||||
| 2 | rs12210810 | C/G | EA | 3.13 | 0.43 | 0.06 | rs3901856 | G/A | 0.90 | 0.25 | 2.9×10⁻⁴ | 0.28 | 0.35 | 0.41 | 0.15 | 1.55 | 0.36 | 1.4×10⁻⁵ | 0.13 | |
| CAV1 | 1 | rs9920 | C/T | EA | 0.79 | 0.14 | 0.09 | rs6978354 | A/G | 0.67 | 0.19 | 3.1×10⁻⁴ | 0.71 | 0.28 | 0.012 | 0.47 | 0.64 | 0.25 | 9.3×10⁻³ | 0.48 |
| KCNH2 | 1 | rs2968863 | T/C | EA | 1.35 | 0.23 | 0.29 | rs2968863 | T/C | 1.74 | 0.29 | 2.9×10⁻⁹ | 1.40 | 0.56 | 0.012 | 0.046 | 1.86 | 0.34 | 5.9×10⁻⁸ | 0.14 |
| rs2968864 | C/T | EA | 1.40 | 0.35 | 0.25 | |||||||||||||||
| rs2072413 | T/C | EA | −1.68 | 0.11 | 0.27 | |||||||||||||||
| 2 | rs4725982 | T/C | EA | 1.60 | 0.35 | 0.22 | rs3815459 | T/C | 1.09 | 0.20 | 3.7×10⁻⁸ | 0.88 | 0.30 | 3.9×10⁻⁵ | 0.31 | 1.24 | 0.26 | 1.8×10⁻⁶ | 0.35 | |
| KCNQ1 | 1 | rs12296050 | T/C | EA | 1.93 | 0.12 | 0.19 | rs12296050 | T/C | 1.13 | 0.18 | 1.9×10⁻¹⁰ | 0.94 | 0.25 | 1.3×10⁻⁴ | 0.48 | 1.33 | 0.26 | 1.8×10⁻⁷ | 0.35 |
| rs12576239 | T/C | EA | 2.10 | 0.35 | 0.13 | |||||||||||||||
| ATP2A2 | 1 | rs3026445 | C/T | EA | 0.62 | 0.09 | 0.36 | rs4630352 | A/G | 0.52 | 0.17 | 0.0028 | 0.43 | 0.25 | 0.086 | 0.59 | 0.61 | 0.24 | 0.012 | 0.43 |
| USP50-TRP | 1 | rs3105593 | T/C | EA | 0.66 | 0.10 | 0.45 | rs3109882 | A/G | 0.82 | 0.18 | 2.9×10⁻⁶ | 0.96 | 0.25 | 1.2×10⁻⁴ | 0.38 | 0.69 | 0.25 | 5.6×10⁻³ | 0.47 |
| M7LITAF | 1 | rs735951 | A/G | EA | 1.15 | 0.10 | 0.46 | rs735951 | A/G | 1.33 | 0.17 | 1.5×10⁻¹⁴ | 0.85 | 0.25 | 5.7×10⁻⁴ | 0.44 | 1.80 | 0.24 | 1.3×10⁻¹³ | 0.41 |
| rs8049607 | T/C | EA | 1.25 | 0.22 | 0.46 | |||||||||||||||
| CNOT1 | 1 | rs246196 | C/T | EA | 1.73 | 0.11 | 0.26 | rs9926577 | T/C | 1.99 | 0.21 | 2.7×10⁻²¹ | 1.46 | 0.32 | 1.5×10⁻⁵ | 0.84 | 2.32 | 0.27 | 4.8×10⁻¹⁸ | 0.66 |
| rs37060b | A/G | EA | 1.66 | 0.23 | 0.74 | |||||||||||||||
| rs37062 | G/A | EA | 2.10 | 0.35 | 0.24 | |||||||||||||||
| LIG3 | 1 | rs2074518 | T/C | EA | 1.23 | 0.18 | 0.46 | rs2074518 | T/C | 0.71 | 0.20 | 3.4×10⁻⁴ | 0.73 | 0.32 | 0.024 | 0.17 | 0.71 | 0.25 | 4.8×10⁻³ | 0.38 |
| rs1052536 | C/T | EA | 0.98 | 0.10 | 0.53 | |||||||||||||||
| PRKCA | 1 | rs9892651 | C/T | EA | 0.74 | 0.10 | 0.43 | rs56152251 | A/G | 1.00 | 0.17 | 8.5×10⁻⁹ | 0.67 | 0.24 | 3.4×10⁻⁴ | 0.48 | 1.34 | 0.25 | 6.3×10⁻⁸ | 0.45 |
| KCNJ2 | 1 | rs1396515a | C/G | EA | 0.98 | 0.09 | 0.52 | rs189495613 | T/C | 0.72 | 0.18 | 5.1×10⁻⁵ | 0.49 | 0.24 | 3.4×10⁻⁴ | 0.57 | 0.99 | 0.26 | 1.6×10⁻⁴ | 0.69 |
| rs17779747 | T/G | EA | 1.16 | 0.21 | 0.35 | |||||||||||||||
| KCNE1 | 1 | rs1805128 | T/C | EA | 7.42 | 0.85 | 0.01 | N/ab | ||||||||||||
Proxy substituted.
No SNPs with minor allele frequency >0.01. Ind, independent.
If SNP reported by multiple studies, effect from largest study reported. A1/A2, coded/non-coded allele. AA, African American. AS, East Asian ancestry. CAF, coded allele frequency. EA, European ancestry.
Rank transformation applied. SE, standard error.
Statistical Analysis
To interpret fine-mapping results, LD was calculated in 500 Kb sliding windows using PLINK24 and African American, Hispanic/Latino, and trans-ethnic (i.e. combined African American and Hispanic/Latino) data, the latter in proportion to racial/ethnic-specific (i.e. each race/ethnicity separately) sample sizes. Metabochip LD and allele frequency information for a European population was provided for 2,143 Malmö Diet and Cancer Study control participants.25
Racial/ethnic-stratified linear regression (ARIC, EAGLE BioVU, CARDIA, CHS, MESA, and WHI; implemented in PLINK24) or a weighted version of generalized estimating equations (HCHS/SOL; implemented in SUGEN)26 were used to evaluate the association between QT and a maximum of 7,239 SNPs (racial/ethnic-specific minor allele frequency (MAF) ≥0.01) from 16 previously identified QT loci assuming an additive genetic model and including age, sex, study center/region, ancestry principal components, and heart rate as covariates. Racial/ethnic-stratified and trans-ethnic estimates were combined via inverse variance meta-analysis using METAL.27
Generalization
We first evaluated whether loci identified in European populations generalized to African American and Hispanic/Latino populations by identifying all common and low-frequency (MAF≥1%) index SNPs and all SNPs correlated with the index SNPs (r2≥0.20) using Malmö Diet and Cancer Study LD estimates; these are the only SNPs evaluated for generalization. For loci with multiple index SNPs, SNPs with r2 <0.20 were considered independent signals. The generalization significance criterion was defined as αa=9.1×10⁻⁵, calculated using the number of tag SNPs in African Americans (r2≥0.80; determined using African American LD patterns) that captured all SNPs that were correlated with the index SNPs (r2≥0.20; determined using Malmö Diet and Cancer Study LD patterns). Index SNPs rs10919070 (ATP1B1), rs11756438 (SLC35F1-PLN), rs2072413 (KCNH2), rs7122937 (KCNQ1), rs2074238 (KCNQ1) did not pass quality control and no proxy was available for rs2968864 (KCNH2). For KCNJ2, all SNPs correlated with the index SNPs either did not pass quality control or had MAF<0.01.
Novel SNP Identification
To identify novel SNPs, we selected all SNPs at the 16 QT loci that were uncorrelated with the index SNPs (r2≤0.20 in the Malmö Diet and Cancer Study), which potentially represent genetic associations not previously reported for QT. Sequential conditional analyses were then performed adjusting for significant lead SNPs, i.e. the most significant trans-ethnic or racial/ethnic SNP at each locus, until no significant SNPs remained. If a statistically significant SNP was identified, defined as 0.05 divided by the number of SNPs in African Americans with MAF ≥ 0.01 that were uncorrelated with the index SNPs (n=6,082; αb=8.22×10⁻⁶), the SNP was identified as novel and added to the adjustment set.
Bioinformatics Categorization of QT loci
Functional annotation was performed for all significant lead SNPs, novel SNPs, and correlated SNP (r2≥0.80; identified in the appropriate 1000 Genomes reference populations) in relevant cardiac tissues. Specifically, using HaploRegV2 (http://www.broadinstitute.org/mammals/haploreg/haploreg.php), all SNPs in each LD block were characterized with putative functional roles including: conservation; promoter and/or enhancer epigenetic markers, derived from the Roadmap Epigenomics Project and ENCODE; DNAse hypersensitive sites; and transcription factor binding motifs.
RESULTS
Participants were drawn from seven studies (Online Supplement), which contributed 12,410 African American and 14,837 Hispanic/Latino participants (Table S1). The majority of participants were female (71%) and the mean age ranged from 39–73 years. Estimates of mean QT and heart rate were generally consistent across studies (weighted mean=408 ms), but were expectedly lower in EAGLE BioVu given exclusion criteria (Online Supplement).
We examined a maximum of 7,239 SNPs at 16 previously identified QT loci represented on the Metabochip. In African Americans, the number of SNPs at each locus ranged from 421,195 (mean number of SNPs per locus=451, Table S2). Among Hispanic/Latinos, the number of SNPs per locus was slightly lower and ranged from 33–97 (mean number of SNPs per locus=361).
Generalization
A total of 39 QT index SNPs across 21 independent signals were identified, with the NOS1AP, ATP1B1, SLC35F1-PLN, and KCNH2 loci harboring multiple independent signals (Table 1). Sixteen (76%) independent signals generalized to the trans-ethnic population, encompassing 12 QT loci (Table 1, Table S3, S4). Among these 16 independent signals, six lead SNPs were identical to previously reported index SNPs [rs846111 (RNF207), rs12143842 (NOS1AP), rs2968863 (KCNH2), rs12296050 (KCNQ1), rs735951 (LITAF), and rs2074518 (LIG3)], six lead SNPs were equivalent to previously reported index SNPs (i.e. P-values within ~1 order of magnitude), and four lead SNPs had P-values at least two orders of magnitude farther from the null than index SNP P-values (Table S3). For example, the SCN5A-SCN10A index SNPs P-values were approximately five times lower in magnitude (index SNP P-value range: 0.0015–0.024, Table S3) than the trans-ethnic lead SNP P-value of 3.2×10⁻⁸ (Table 1). Effect sizes also were consistently lower among African Americans than Hispanic/Latinos.
The trans-ethnic lead SNP was also identical to the racial/ethnic-specific lead SNP for 11 of the 16 independent signals in African Americans and 10 of the 16 independent signals in Hispanic/Latinos (Table S5) and effect sizes were again consistently of smaller magnitude in African Americans. For the remaining independent signals, P-values for the racial/ethnic-specific lead SNPs were equivalent to (i.e. within approximately one order of magnitude) the trans-ethnic lead SNP, with the exception of one lead SNP in African Americans (RNF207) and two lead SNPs in Hispanic/Latinos (NOS1AP independent signal 3 and KCNH2 independent signal 1) (Table S3).
Among the five independent signals that did not generalize to the trans-ethnic population (SLC35F1-PLNindependent signal 2, CAV1 ATP2A2, LIG3, and KCNE1), effect estimates for all but KCNE1 were directionally consistent with effects estimated in European ancestral populations, but of considerably smaller magnitude, particularly among African Americans (Table S4). For the KCNE1 independent signal, no SNPs with MAF>1% were identified, although rs1805128, the KCNE1 index SNP, was significant in Hispanic/Latinos (MAF=0.0053; P-value = 1.4×10⁻⁷) (Table S3).
Finally, varied generalization success was observed for racial/ethnic-specific analyses. For example, only five independent signals generalized to African Americans, whereas 15 independent signals generalized to Hispanic/Latinos. Other notable observations include the consistently lower estimated effects in African Americans compared to Hispanic/Latinos (Table S3).
Locus Refinement
We then examined the degree to which LD patterns assisted with the narrowing of independent signals that generalized (Table S6; Figures 1–4, Figures S1–S8). On average, African American LD patterns were associated with the fewest number of SNPs correlated with the lead SNP and the smallest interval size. However, trans-ethnic LD patterns produced slightly smaller interval sizes when restricted to independent signals that generalized to African Americans and Hispanic/Latinos separately.
Figure 1.
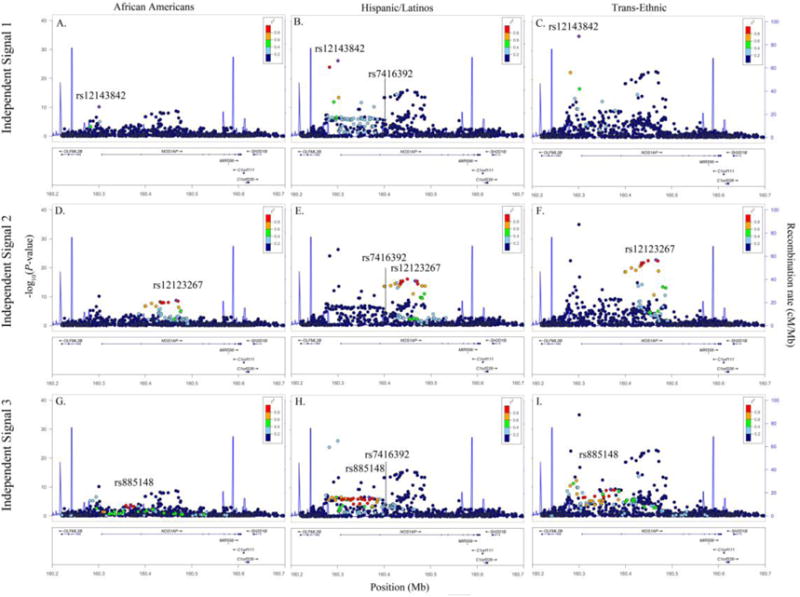
Racial/ethnic-specific and trans-ethnic regional association plots for NOS1AP independent signals 1 (panels A–C), 2 (panels D–F), and 3 (panels G–I). Population-specific log10P-values (left y axis) are plotted against the SNP genomic position (NCBI build 36, x axis); the estimated recombination rate from the 1000 Genomes project is shown in blue on the right y axis. Lead SNPs are denoted with a purple diamond. SNPs are colored to reflect population-specific r2 with the lead SNP. Novel SNPs are denoted by vertical lines and stars.
Figure 4.
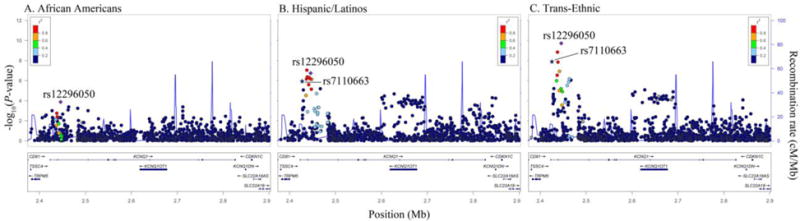
Racial/ethnic-specific and trans-ethnic regional association plots for KCNQ1. Population-specific log10P-values (left y axis) are plotted against the SNP genomic position (NCBI build 36, x axis); the estimated recombination rate from the 1000 Genomes project is shown in blue on the right y axis. Lead SNPs are denoted with a purple diamond. SNPs are colored to reflect population-specific r2 with the lead SNP. Novel SNPs are denoted by vertical lines and stars.
Novel Signals
We identified three trans-ethnic novel SNPs at ATP1B1, SCN5A-SCN10A, and KCNQ1 and three Hispanic/Latino-specific novel SNPs at NOS1AP and SCN5A-SCN10A (two SNPs) (Tables 2, 3, Figures 1–4). Notably, the three SCN5A-SCN10A novel SNPs were uncorrelated when examining African American (r2<0.038), European (r2<0.052), and Hispanic/Latino (r2<0.095) LD patterns. Effect estimates for novel Hispanic/Latino SNPs (beta range:−1.17,−2.34) also were almost twice as large as effects estimated in African Americans (beta range:−0.62, −1.22, Table 2).
TABLE 2.
Novel SNPs at three previously identified QT loci in n=12,410 African Americans and n=14,837 Hispanic/Latinos.
| Trans-Ethnic Population | African Americans | Hispanic/Latinos | |||||||||||
|---|---|---|---|---|---|---|---|---|---|---|---|---|---|
| Locus | Lead SNP | Beta | SE | P-value | CA | Beta | SE | P-value | CAF | Beta | SE | P-value | CAF |
| ATP1B1 | rs1138486 | −1.79 | 0.25 | 2.0×10⁻¹² | T | −1.12 | 0.34 | 9.9×10⁻⁴ | 0.16 | −2.34 | 0.38 | 1.0×10⁻⁹ | 0.15 |
| SCN5A-SCN10A | rs6801957 | −0.97 | 0.21 | 3.7×10⁻⁶ | A | −0.62 | 0.34 | 0.073 | 0.16 | −1.17 | 0.26 | 8.5×10⁻⁶ | 0.38 |
| KCNQ1 | rs7110663 | −1.49 | 0.25 | 6.5×10⁻¹¹ | T | −1.22 | 0.29 | 2.6×10⁻⁵ | 0.34 | −1.92 | 0.37 | 1.8×10⁻⁷ | 0.33 |
CA, coded allele. CAF, coded allele frequency. SE, standard error
TABLE 3.
Novel SNPs at two previously identified QT loci in n=14,837 Hispanic/Latinos.
| Locus | Lead SNP | Beta | SE | P-value | CA | Coded Allele Frequency
|
|||
|---|---|---|---|---|---|---|---|---|---|
| EUa | AFb | HLc | ASNd | ||||||
| NOS1AP | rs7416392 | −1.76 | 0.38 | 5.0×10⁻⁶ | T | 0.32 | 0.57 | 0.42 | 0.50 |
| SCN5A-SCN10A | rs6764249 | 1.70 | 0.31 | 3.8×10⁻⁸ | G | 0.15 | 0.22 | 0.24 | 0.35 |
| SCN5A-SCN10A | rs1805124 | 1.35 | 0.29 | 4.3×10⁻⁶ | G | 0.21 | 0.29 | 0.22 | 0.10 |
Calculated in the Malmö Diet and Cancer Study.
Calculated in the Atherosclerosis Risk in Communities Study.
Calculated in the Hispanic Community Health Study/Study of Latinos.
Calcuated in the 1000 Genomes ASN population. AF, African American. ASN, East Asian. CA, coded allele. EU, European, HL, Hispanic/Latino. SE, standard error
Bioinformatics Characterization
Bioinformatics characterization identified three nonsynonymous coding SNPs, for which in silico prediction algorithms indicated that the amino acid changes were tolerated (Tables S7, S8). With the exception of four SNPs in Hispanic/Latinos and two SNPs in African Americans, all independent signals contained at least one SNP with evidence for a regulatory function in one or more relevant tissues.
DISCUSSION
Here we conducted the largest and most racially/ethnically diverse fine-mapping study of QT to-date. We demonstrated allelic heterogeneity through the identification of multiple independent signals, refined the location of previously known QT loci by reducing the number of potential causal variants for future interrogation, and identified racial/ethnic-specific signals. These efforts enhance our understanding of the genetic architecture of QT in previously underrepresented populations.
One notable observation was our success generalizing QT loci trans-ethnically, suggesting that previously identified independent signals are relevant across global populations. However, we had different degrees of success generalizing QT loci to each population separately. Although we increased our sample size approximately 50%,21 we still only generalized a handful (~24%) of independent signals to African Americans, for whom effect sizes were consistently of smaller magnitude when compared to Hispanic/Latinos or European populations. In contrast, 71% of independent signals successfully generalized to Hispanic/Latinos, despite approximately equivalent effective sample sizes between the two study populations. These distinctions may reflect greater average European ancestry in Hispanic/Latinos compared to African Americans28 and a higher proportion of shared functional variants. The LD structure in Hispanic/Latino and European ancestral populations also may be more similar to each other than to African populations, thus enabling the detection of functional variants. In addition, the Metabochip was developed using an early release of the 1000 Genomes Project and therefore incompletely captured African-specific variation,23 despite low LD and high genetic heterogeneity that make African populations ideal for fine-mapping.29
The need to further expand fine-mapping efforts is underscored by findings for NOS1AP independent signal 1 that harbors rs12143842. Rs12143842 is the most commonly reported QT index SNP identified to-date and also was identified by our trans-ethnic and racial/ethnic-specific meta-analyses. Yet, functional studies of NOS1AP identified rs7539120, not rs12143842, as the functional variant,19 although rs7539120 was not genotyped on the Metabochip. Inconsistencies between prior GWAS and NOS1AP functional studies likely reflect both the HapMap2 platform to which the majority of prior GWAS were imputed, which did not include rs7539120, and the decreased imputation accuracy for rs7539120 compared to rs12143842 that lowered estimated effects for rs7539120 in contrast to rs12143842. Interestingly, rs12143842 and rs7539120 are weakly correlated in the 1000 Genomes Americans of African Ancestry in SW USA (ASW) population (r2=0.16), but moderately correlated in the European (EUR, r2=0.54) and Admixed American (AMR, r2=0.38) populations. These findings suggest that fine-mapping in African American populations, enabled by denser genotyping or high quality imputation, may have negated the targeted saturation sequencing of NOS1AP in European ancestral populations that was required to pinpoint the causal variant.
We also reported varied success in narrowing intervals surrounding previously identified GWAS index SNPs. For several loci, including RNF207, NOS1AP, ATP1B1, SCN5A-SCN10A, and KCNQ1, we identified a limited number of SNPs for future interrogation. Indeed, recent functional studies have identified RNF207 as an important regulator of cardiac excitation, although few studies have been performed to pinpoint the exact causal SNPs. RNF207 also was the only locus for which bioinformatics characterization identified a nonsynonymous SNP, rs846111, although in silico prediction suggested that the amino acid change was tolerated. Yet, trans-ethnic and racial/ethnic-specific LD patterns did not identify any SNPs in high LD with rs846111. Additional work examining a denser panel of SNPs at this locus is likely warranted.
Despite success for several independent signals, substantial narrowing of intervals was not achieved for other independent signals, including CNOT1 and SLC35F1-PLN independent signal 1, possibly reflecting LD block size and the extent of LD differences with the causal variant between ancestral populations. Expansion of fine-mapping efforts to include other global populations may offer improved locus refinement. For example, wide variation in the number of SNPs correlated with SLC35F1-PLN index SNP rs11153730 in 1000 Genomes populations was observed, ranging from 61 in the Han Chinese in Beijing to 134 in the ASW population. Future studies should evaluate the extent to which East Asian populations can be used to further narrow the SCL35F1-PLN locus.
There are several limitations of the present study. First, although the Metabochip included dense genotyping of 16 QT loci, the majority of recently discovered QT loci were excluded. Second, it is possible that the causative variants were not included on the Metabochip, necessitating future sequencing studies or studies for which high imputation accuracy is possible, both of which are outside the scope of the current effort. Finally, the implications of conducting a QT GWAS in predominantly female populations shouldering higher burdens of QT-prolonging risk factors than the original discovery populations, e.g. obesity and diabetes, also deserves examination, including the degree to which variation in known QT correlates modify reported genetic associations and underlying pathways.31,32
In conclusion, our findings suggest that the same genes influence variation in QT across ancestral populations and that additional, novel and possibly population-specific signals exist, which together implicate gene regulatory dysfunction. Additional characterization of QT loci through whole-genome sequencing or large-scale genotyping combined with imputation panels that capture population genetic content may further illuminate the genetic and molecular mechanisms underlying QT.
Supplementary Material
Figure 2.
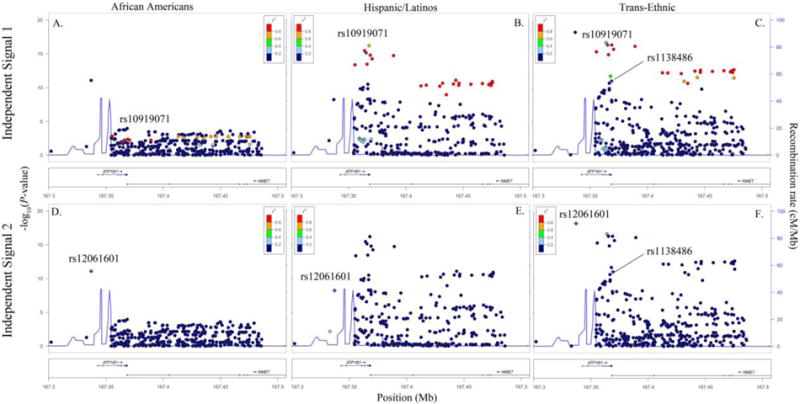
Racial/ethnic-specific and trans-ethnic regional association plots for ATP1B1 independent signals 1 (panels A–C) and 2 (panels D–F). Population-specific log10P-values (left y axis) are plotted against the SNP genomic position (NCBI build 36, x axis); the estimated recombination rate from the 1000 Genomes project is shown in blue on the right y axis. Lead SNPs are denoted with a purple diamond. SNPs are colored to reflect population-specific r2 with the lead SNP. Novel SNPs are denoted by vertical lines and stars.
Figure 3.
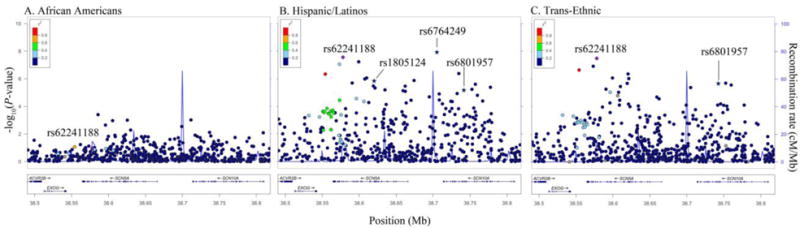
Racial/ethnic-specific and trans-ethnic regional association plots for SCN5A/SCN10A. Population-specific log10P-values (left y axis) are plotted against the SNP genomic position (NCBI build 36, x axis); the estimated recombination rate from the 1000 Genomes project is shown in blue on the right y axis. Lead SNPs are denoted with a purple diamond. SNPs are colored to reflect population-specific r2 with the lead SNP. Novel SNPs are denoted by vertical lines and stars.
Acknowledgments
PAGE is funded by the NHGRI through U01HG004803, U01HG004798, U01HG004802, U01HG004790, and U01HG004801. EAGLE/BioVU was supported by UL1 RR024975 and UL1 TR000445-06. The WHI is funded by contracts HHSN268201100046C, HHSN268201100001C, HHSN268201100002C, HHSN268201100003C, HHSN268201100004C, and HHSN271201100004C. ARIC is supported by HHSN268201100005C, HHSN268201100006C, HHSN268201100007C, HHSN268201100008C, HHSN268201100009C, HHSN268201100010C, HHSN268201100011C, and HHSN268201100012C. CHS was supported by HHSN268201200036C, HHSN268200800007C, N01HC55222, N01HC85079, N01HC85080, N01HC85081, N01HC85082, N01HC85083, N01HC85086, U01HL080295, R01HL087652, R01HL105756, R01HL103612, R01HL120393, UL1TR000124 and DK063491. NS was supported by HL111089, HL116747, and the Laughlin Family Endowment. The HCHS/SOL was supported by N01-HC65233, N01-HC65234, N01-HC65235, N01-HC65236, and N01-HC65237. CARDIA was supported by HHSN268201300025C, HHSN268201300026C, HHSN268201300027C, HHSN268201300028C, HHSN268201300029C, and HHSN268200900041C. MESA was supported by N01-HC-95159, N01-HC-95160, N01-HC-95161, N01-HC-95162, N01-HC-95163, N01-HC-95164, N01-HC-95165, N01-HC-95166, N01-HC-95167, N01-HC-95168, N01-HC-95169, UL1-TR-001079, UL1-TR-000040, N02-HL-64278, R01HL98077, N02-HL-64278, HL071205, UL1TR000124, DK063491, RD831697, and P50ES015915.
Footnotes
Publisher's Disclaimer: This is a PDF file of an unedited manuscript that has been accepted for publication. As a service to our customers we are providing this early version of the manuscript. The manuscript will undergo copyediting, typesetting, and review of the resulting proof before it is published in its final citable form. Please note that during the production process errors may be discovered which could affect the content, and all legal disclaimers that apply to the journal pertain.
We have no conflicts to disclose.
References
- 1.Stecker EC, Reinier K, Marijon E, Narayanan K, Teodorescu C, Uy-Evanado A, Gunson K, Jui J, Chugh SS. Public health burden of sudden cardiac death in the United States. Circulation Arrhythmia and electrophysiology. 2014;7:212–217. doi: 10.1161/CIRCEP.113.001034. [DOI] [PMC free article] [PubMed] [Google Scholar]
- 2.Jervell A, Lange-Nielsen F. Congenital deaf-mutism, functional heart disease with prolongation of the Q-T interval and sudden death. American heart journal. 1957;54:59–68. doi: 10.1016/0002-8703(57)90079-0. [DOI] [PubMed] [Google Scholar]
- 3.Chugh SS, Reinier K, Teodorescu C, Evanado A, Kehr E, Al Samara M, Mariani R, Gunson K, Jui J. Epidemiology of sudden cardiac death: clinical and research implications. Progress in cardiovascular diseases. 2008;51:213–228. doi: 10.1016/j.pcad.2008.06.003. [DOI] [PMC free article] [PubMed] [Google Scholar]
- 4.Moss AJ. The QT interval and torsade de pointes. Drug Saf. 1999;21(Suppl 1):5–10. doi: 10.2165/00002018-199921001-00002. discussion 81–17. [DOI] [PubMed] [Google Scholar]
- 5.Roden DM. Drug-induced prolongation of the QT interval. N Engl J Med. 2004;350:1013–1022. doi: 10.1056/NEJMra032426. [DOI] [PubMed] [Google Scholar]
- 6.Dekker JM, Crow RS, Hannan PJ, Schouten EG, Folsom AR. Heart rate-corrected QT interval prolongation predicts risk of coronary heart disease in black and white middle-aged men and women: the ARIC study. J Am Coll Cardiol. 2004;43:565–571. doi: 10.1016/j.jacc.2003.09.040. [DOI] [PubMed] [Google Scholar]
- 7.Soliman EZ, Howard G, Cushman M, Kissela B, Kleindorfer D, Le A, Judd S, McClure LA, Howard VJ. Prolongation of QTc and risk of stroke: The REGARDS (REasons forGeographic and Racial Differences in Stroke) study. Journal of the American College of Cardiology. 2012;59:1460–1467. doi: 10.1016/j.jacc.2012.01.025. [DOI] [PMC free article] [PubMed] [Google Scholar]
- 8.Marsman RF, Tan HL, Bezzina CR. Genetics of sudden cardiac death caused by ventricular arrhythmias. Nature reviews Cardiology. 2014;11:96–111. doi: 10.1038/nrcardio.2013.186. [DOI] [PubMed] [Google Scholar]
- 9.Newton-Cheh C, Eijgelsheim M, Rice KM, et al. Common variants at ten loci influence QT interval duration in the QTGEN Study. Nature genetics. 2009;41:399–406. doi: 10.1038/ng.364. [DOI] [PMC free article] [PubMed] [Google Scholar]
- 10.Nolte IM, Wallace C, Newhouse SJ, et al. Common genetic variation near the phospholamban gene is associated with cardiac repolarisation: meta-analysis of three genome-wide association studies. PloS one. 2009;4:e6138. doi: 10.1371/journal.pone.0006138. [DOI] [PMC free article] [PubMed] [Google Scholar]
- 11.Pfeufer A, Sanna S, Arking DE, et al. Common variants at ten loci modulate the QT interval duration in the QTSCD Study. Nature genetics. 2009;41:407–414. doi: 10.1038/ng.362. [DOI] [PMC free article] [PubMed] [Google Scholar]
- 12.Arking DE, Pulit SL, Crotti L, et al. Genetic association study of QT interval highlights role for calcium signaling pathways in myocardial repolarization. Nature genetics. 2014;46:826–836. doi: 10.1038/ng.3014. [DOI] [PMC free article] [PubMed] [Google Scholar]
- 13.Arking DE, Pfeufer A, Post W, et al. A common genetic variant in the NOS1 regulator NOS1AP modulates cardiac repolarization. Nature genetics. 2006;38:644–651. doi: 10.1038/ng1790. [DOI] [PubMed] [Google Scholar]
- 14.Marroni F, Pfeufer A, Aulchenko YS, et al. A genome-wide association scan of RR and QT interval duration in 3 European genetically isolated populations: the EUROSPAN project. Circulation Cardiovascular genetics. 2009;2:322–328. doi: 10.1161/CIRCGENETICS.108.833806. [DOI] [PMC free article] [PubMed] [Google Scholar]
- 15.Chambers JC, Zhao J, Terracciano CM, et al. Genetic variation in SCN10A influences cardiac conduction. Nature genetics. 2010;42:149–152. doi: 10.1038/ng.516. [DOI] [PubMed] [Google Scholar]
- 16.Sano M, Kamitsuji S, Kamatani N, Hong KW, Han BG, Kim Y, Kim JW, Aizawa Y, Fukuda K, Japan Pharmacogenomics Data Science C Genome-wide association study of electrocardiographic parameters identifies a new association for PR interval and confirms previously reported associations. Human molecular genetics. 2014;23:6668–6676. doi: 10.1093/hmg/ddu375. [DOI] [PubMed] [Google Scholar]
- 17.Kim JW, Hong KW, Go MJ, Kim SS, Tabara Y, Kita Y, Tanigawa T, Cho YS, Han BG, Oh B. A common variant in SLC8A1 is associated with the duration of the electrocardiographic QT interval. American journal of human genetics. 2012;91:180–184. doi: 10.1016/j.ajhg.2012.05.019. [DOI] [PMC free article] [PubMed] [Google Scholar]
- 18.Smith JG, Avery CL, Evans DS, et al. Impact of ancestry and common genetic variants on QT interval in African Americans. Circulation Cardiovascular genetics. 2012;5:647–655. doi: 10.1161/CIRCGENETICS.112.962787. [DOI] [PMC free article] [PubMed] [Google Scholar]
- 19.Kapoor A, Sekar RB, Hansen NF, et al. An enhancer polymorphism at the cardiomyocyte intercalated disc protein NOS1AP locus is a major regulator of the QT interval. American journal of human genetics. 2014;94:854–869. doi: 10.1016/j.ajhg.2014.05.001. [DOI] [PMC free article] [PubMed] [Google Scholar]
- 20.Manichaikul A, Palmas W, Rodriguez CJ, et al. Population structure of Hispanics in the United States: the multi-ethnic study of atherosclerosis. PLoS genetics. 2012;8:e1002640. doi: 10.1371/journal.pgen.1002640. [DOI] [PMC free article] [PubMed] [Google Scholar]
- 21.Avery CL, Sethupathy P, Buyske S, et al. Fine-Mapping and Initial Characterization of QT Interval Loci in African Americans. PLoS genetics. 2012;8:e1002870. doi: 10.1371/journal.pgen.1002870. [DOI] [PMC free article] [PubMed] [Google Scholar]
- 22.Matise TC, Ambite JL, Buyske S, et al. The Next PAGE in understanding complex traits: design for the analysis of Population Architecture Using Genetics and Epidemiology (PAGE) Study. Am J Epidemiol. 2011;174:849–859. doi: 10.1093/aje/kwr160. [DOI] [PMC free article] [PubMed] [Google Scholar]
- 23.Voight BF, Kang HM, Ding J, et al. The metabochip, a custom genotyping array for genetic studies of metabolic, cardiovascular, and anthropometric traits. PLoS genetics. 2012;8:e1002793. doi: 10.1371/journal.pgen.1002793. [DOI] [PMC free article] [PubMed] [Google Scholar]
- 24.Purcell S, Neale B, Todd-Brown K, Thomas L, Ferreira MA, Bender D, Maller J, Sklar P, de Bakker PI, Daly MJ, Sham PC. PLINK: a tool set for whole-genome association and population-based linkage analyses. American journal of human genetics. 2007;81:559–575. doi: 10.1086/519795. [DOI] [PMC free article] [PubMed] [Google Scholar]
- 25.Berglund G, Elmstahl S, Janzon L, Larsson SA. The Malmo Diet and Cancer Study. Design and feasibility. Journal of internal medicine. 1993;233:45–51. doi: 10.1111/j.1365-2796.1993.tb00647.x. [DOI] [PubMed] [Google Scholar]
- 26.Lin DY, Tao R, Kalsbeek WD, Zeng D, Gonzalez F, 2nd, Fernandez-Rhodes L, Graff M, Koch GG, North KE, Heiss G. Genetic association analysis under complex survey sampling: the Hispanic Community Health Study/Study of Latinos. American journal of human genetics. 2014;95:675–688. doi: 10.1016/j.ajhg.2014.11.005. [DOI] [PMC free article] [PubMed] [Google Scholar]
- 27.Willer CJ, Li Y, Abecasis GR. METAL: fast and efficient meta-analysis of genomewide association scans. Bioinformatics. 2010;26:2190–2191. doi: 10.1093/bioinformatics/btq340. [DOI] [PMC free article] [PubMed] [Google Scholar]
- 28.Stephens JC, Schneider JA, Tanguay DA, et al. Haplotype variation and linkage disequilibrium in 313 human genes. Science. 2001;293:489–493. doi: 10.1126/science.1059431. [DOI] [PubMed] [Google Scholar]
- 29.Asimit JL, Hatzikotoulas K, McCarthy M, Morris AP, Zeggini E. Trans-ethnic study design approaches for fine-mapping. European journal of human genetics. 2016 doi: 10.1038/ejhg.2016.1. in press. [DOI] [PMC free article] [PubMed] [Google Scholar]
- 30.Roder K, Werdich AA, Li W, Liu M, Kim TY, Organ-Darling LE, Moshal KS, Hwang JM, Lu Y, Choi BR, MacRae CA, Koren G. RING finger protein RNF207, a novel regulator of cardiac excitation. The Journal of biological chemistry. 2014;289:33730–33740. doi: 10.1074/jbc.M114.592295. [DOI] [PMC free article] [PubMed] [Google Scholar]
- 31.el-Gamal A, Gallagher D, Nawras A, Gandhi P, Gomez J, Allison DB, Steinberg JS, Shumacher D, Blank R, Heymsfield SB. Effects of obesity on QT, RR, and QTc intervals. The American journal of cardiology. 1995;75:956–959. doi: 10.1016/s0002-9149(99)80700-0. [DOI] [PubMed] [Google Scholar]
- 32.Whitsel EA, Boyko EJ, Rautaharju PM, Raghunathan TE, Lin D, Pearce RM, Weinmann SA, Siscovick DS. Electrocardiographic QT interval prolongation and risk of primary cardiac arrest in diabetic patients. Diabetes care. 2005;28:2045–2047. doi: 10.2337/diacare.28.8.2045. [DOI] [PubMed] [Google Scholar]
Associated Data
This section collects any data citations, data availability statements, or supplementary materials included in this article.