Significance
Cerebral cavernous malformations (CCMs) are common vascular anomalies of the central nervous system that can lead to seizures, focal neurological deficits, and brain hemorrhage. Clinical options are limited mainly to treatment of symptoms or surgical resection, and targeted pharmacological therapy is lacking. Here we undertake a high-throughput screen and identify fluvastatin and zoledronate, two drugs already approved for clinical use for other indications, which act synergistically to reverse outcomes of CCM3 loss. Used in combination, fluvastatin and zoledronate effectively attenuate neural and vascular deficits in mouse models of CCM in vivo, significantly reducing formation of lesions and extending longevity. Our studies suggest that combined therapy targeting the mevalonate pathway might have therapeutic effects in CCM disease.
Keywords: cerebral cavernous malformations, fluvastatin, zoledronic acid, mevalonate pathway, high-throughput screen
Abstract
Cerebral cavernous malformations (CCMs) are common vascular anomalies that develop in the central nervous system and, more rarely, the retina. The lesions can cause headache, seizures, focal neurological deficits, and hemorrhagic stroke. Symptomatic lesions are treated according to their presentation; however, targeted pharmacological therapies that improve the outcome of CCM disease are currently lacking. We performed a high-throughput screen to identify Food and Drug Administration-approved drugs or other bioactive compounds that could effectively suppress hyperproliferation of mouse brain primary astrocytes deficient for CCM3. We demonstrate that fluvastatin, an inhibitor of 3-hydroxy-3-methyl-glutaryl (HMG)-CoA reductase and the N-bisphosphonate zoledronic acid monohydrate, an inhibitor of protein prenylation, act synergistically to reverse outcomes of CCM3 loss in cultured mouse primary astrocytes and in Drosophila glial cells in vivo. Further, the two drugs effectively attenuate neural and vascular deficits in chronic and acute mouse models of CCM3 loss in vivo, significantly reducing lesion burden and extending longevity. Sustained inhibition of the mevalonate pathway represents a potential pharmacological treatment option and suggests advantages of combination therapy for CCM disease.
Cerebral cavernous malformations (CCMs) are common vascular malformations that develop in the brain, spinal cord, and, more rarely, the retina (1, 2). The lesions consist of dilated sinusoidal channels lined with a single layer of endothelium devoid of vessel wall elements. CCM disease is often asymptomatic, but on occasion the lesions rupture leading to hemorrhagic stroke. Other common symptoms are headache, seizures, and focal neurological deficits. Treatment options include observation of asymptomatic lesions, antiepileptic medication, and surgical excision of lesions in patients with symptomatic or repetitive hemorrhages or intractable seizures; however pharmacological therapies that improve outcome are lacking. CCM disease is usually sporadic, although 20% of patients carry loss-of-function mutations in one of three genes: CCM1 (also known as “KRIT1”), CCM2, and CCM3 (also known as “PDCD10”) (3), which encode structurally unrelated cytoplasmic proteins with critical roles in endothelial cells (4) and, uniquely for CCM3, in neurons and astrocytes as well (5, 6). CCM3 loss in neural progenitors results in hyperproliferation/activation of brain astrocytes and enhanced activity of RhoA in vivo and increased proliferation and survival of primary astrocytes in vitro (5, 6). We took advantage of these well-defined cellular phenotypes of CCM3 loss to explore potential pharmacological treatment options for CCM. High-throughput screening of available drugs identified fluvastatin, a 3-hydroxy-3-methyl-glutaryl (HMG)-CoA reductase inhibitor as a top candidate. In combination with the N-bisphosphonate zoledronic acid monohydrate (zoledronate), fluvastatin effectively reversed the effects of CCM3 loss in primary astrocytes and in Drosophila glial cells in vivo. Moreover, combined treatment with fluvastatin and zoledronate in vivo prevented neural and vascular defects and reduced lesion burden while extending lifespan in chronic and acute mouse models of CCM3. Our results suggest that combined therapy with fluvastatin and zoledronate might have therapeutic effects in CCM.
Results
Identification of Therapeutic Candidates for CCM Disease by High-Throughput Screening.
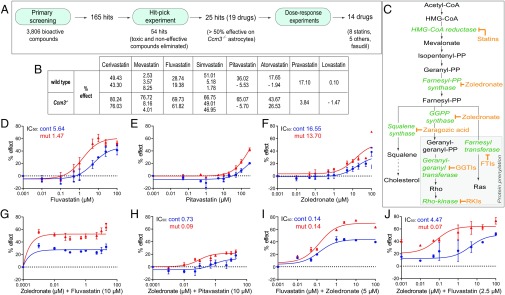
To identify available medicines effective for treatment of CCM, we used high-throughput screening to search for drugs that reverse the marked increase in proliferation of CCM3-deficient (Ccm3−/−) primary astrocytes isolated from hGfap/Ccm3 conditional knockout (cKO) neonatal mice (5). We screened 3,806 bioactive compounds [kinase and phosphatase inhibitor sets and Food and Drug Administration (FDA)-approved drugs] using the collections at the Yale Center for Molecular Discovery (Fig. 1A and SI Materials and Methods). We identified 165 “screen-active” candidates that inhibited proliferation more than 2 SDs from the median; 54 remained for further evaluation after hit-picking, which eliminated ineffective (<50% effect) and toxic compounds. The remaining 25 hits (19 drugs because of duplications) included five statins (cerivastatin, mevastatin, fluvastatin, simvastatin, and pitavastatin), five antineoplastic drugs, six antibiotics, and three others, amounting to a hit rate of 0.657% (Fig. 1A and Table S1). Thus, statins (Fig. 1 B and C) represented a major drug group capable of affecting aberrant proliferation of Ccm3−/− astrocytes.
Fig. 1.
The fluvastatin and zoledronate combination reverses aberrant proliferation of Ccm3−/− astrocytes. (A) Flowchart of the primary screening, hit-pick, and dose–response experiments. (B) Percent (%) effect of statins on proliferation of wild-type and Ccm3−/− astrocytes in primary screening. Some statins were present in duplicate or triplicate, as indicated by the multiple % effect values provided. (C) The mevalonate pathway and its branches. Statins and zoledronate respectively inhibit HMG-CoA reductase and farnesyl pyrophosphate and geranyl-geranyl pyrophosphate synthases. Additional inhibitors are indicated. (D–H) Dose–response curves for serial dilutions (0.001–100 μM or 0.0001–100 μM) of fluvastatin, pitavastatin, and zoledronate alone or in combination. Fluvastatin (D) is effective without toxic effect on wild-type cells. Pitavastatin (E) is mildly effective only at high concentrations; zoledronate (F) has no effect. (G and H) Zoledronate is more effective in combination with fluvastatin (G) than in combination with pitavastatin (H). (I and J) Dose–response curves for dilutions (0.001–100 μM) of fluvastatin and zoledronate. Zoledronate lowers the IC50 of fluvastatin from 1.47 to 0.14 μM (D and I); conversely, fluvastatin lowers the IC50 of zoledronate from 13.7 to 0.07 μM (F and J). IC50 values for each drug and each genotype are indicated. Results are averages of at least three paired independent experiments.
Table S1.
Effect of other drugs on proliferation of astrocytes (primary screening)
| % effect | ||
| Drugs and bioactive compounds | Wild type | Ccm3−/− |
| Antineoplastic | ||
| Salinomycin | 45.01 | 66.17 |
| Vinblastine sulfate | 30.20 | 65.57 |
| Mitoxanthrone hydrochloride | 33.90 | 62.19 |
| 39.40 | 57.83 | |
| Dasatinib | 45.30 | 57.39 |
| Trichlormethine hydrochloride | 43.49 | 53 |
| Antifungal | ||
| Phenylmercuric acetate | 26.28 | 86.1 |
| 43.61 | 83.74 | |
| Thiram | −17.20 | 74.14 |
| −16.79 | 68.35 | |
| Ciclopirox olamine | 15.23 | 53.85 |
| Antibacterial | ||
| Proflavine hemisulfate | 21.09 | 73.47 |
| Pyrithione zinc | 15.57 | 65.91 |
| −3.73 | 60.65 | |
| Anthelmintic | ||
| Tetramizole hydrochloride | 19.51 | 65.85 |
| Others | ||
| Bay 11-7082 | 54.68 | 77.72 |
| Methylene blue | 10.05 | 76.72 |
| Patulin | 7.59 | 72.29 |
Percent (%) effect of other drugs retained after the hit-pick phase on the proliferation of wild-type and Ccm3−/− primary astrocytes.
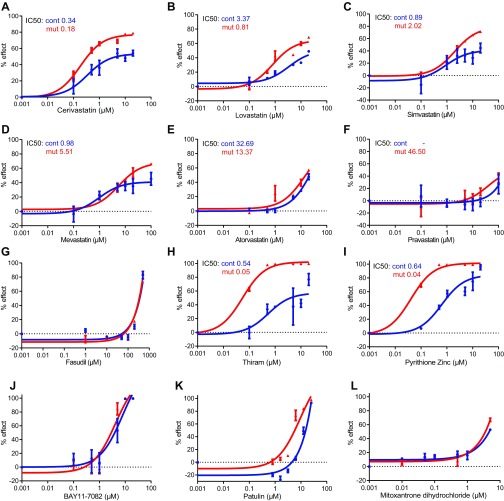
Next, we performed dose–response studies for the above hits and for atorvastatin, pravastatin, and lovastatin (which were not positive in primary screening), and the Rho kinase inhibitor fasudil hydrochloride (fasudil), despite its being approved only in Japan and China, but not in the United States or Europe, because it was shown to be effective in CCM mouse models (7, 8). Fluvastatin, cerivastatin, lovastatin, and simvastatin (Fig. 1D and Fig. S1 A–C) reversed aberrant proliferation of Ccm3−/− astrocytes, without apparent toxic effect on wild-type cells, whereas pitavastatin, mevastatin, atorvastatin, and pravastatin (Fig. 1E and Fig. S1 D–F) were only mildly effective at very high concentrations; fasudil (Fig. S1G) showed no effect. Other compounds were either unsuitable for CCM (the fungicide thiram and pyrithione zinc, used in the treatment of seborrheic dermatitis) or ineffective (BAY11-7082, patulin, and mitoxantrone hydrochloride) (Fig. S1 H–L and Table S1). They were excluded from follow-up studies, together with cerivastatin (withdrawn from the market by the FDA); simvastatin [ineffective in CCM mouse models (9–11)]; mevastatin (never marketed); and atorvastatin, pravastatin, and fasudil (all ineffective in our screen). The rather inefficient “super-statin” pitavastatin (Fig. 1E) was retained for further experiments as a control against fluvastatin and lovastatin, the remaining candidates after the dose–response studies.
Fig. S1.
Dose–response curves for statins, the ROCK inhibitor fasudil, and additional candidate drugs. (A–G) Dose–response curves for serial dilutions of additional statins (0.001–100 μM) (A–F) and the ROCK inhibitor fasudil (0.001 μM to 1 mM) (G). Cerivastatin (A), lovastatin (B), and simvastatin (C) are effective on Ccm3−/− astrocytes without toxic effect on wild-type cells. Mevastatin (D), atorvastatin (E), and pravastatin (F) are mildly effective only at very high concentrations on Ccm3−/− astrocytes, and fasudil (G) has no effect. (H–L) Dose–response curves for serial dilutions (0.001–100 μM, or to 10 μM) of other drugs identified after primary screening and hit-pick experiments. Thiram (a fungicide) (H) and pyrithione zinc (used to treat seborrheic dermatitis) (I) are unsuitable for CCM treatment. BAY11-7082 (J), patulin (K), and mitoxantrone hydrochloride (L) are not effective. IC50 values for each drug tested and each genotype are indicated. Results are averages of three paired independent experiments.
The N-Bisphosphonate Zoledronic Acid Monohydrate Potentiates the Efficacy of Fluvastatin.
Statins competitively inhibit HMG-CoA reductase and hence reduce cholesterol biosynthesis (Fig. 1C). In addition, they affect other processes that depend on the mevalonate pathway, including protein prenylation, a posttranslational modification of G proteins (12) such as RhoA, which is activated upon CCM protein loss (4). Statins normally are effective only at high doses; hence, we searched for FDA-approved drugs that could act synergistically to increase fluvastatin (or lovastatin) efficacy. Nitrogenous (N) bisphosphonates block protein prenylation by inhibiting the farnesyl pyrophosphate and geranyl-geranyl pyrophosphate synthases (Fig. 1C) and have synergistic effects with statins on cell lines (13) and in vivo (14). We therefore used primary astrocytes to investigate zoledronic acid monohydrate (zoledronate; not included in the primary screening), which is standard of care for patients with bone disease (15, 16) and may have antiangiogenic properties (17).
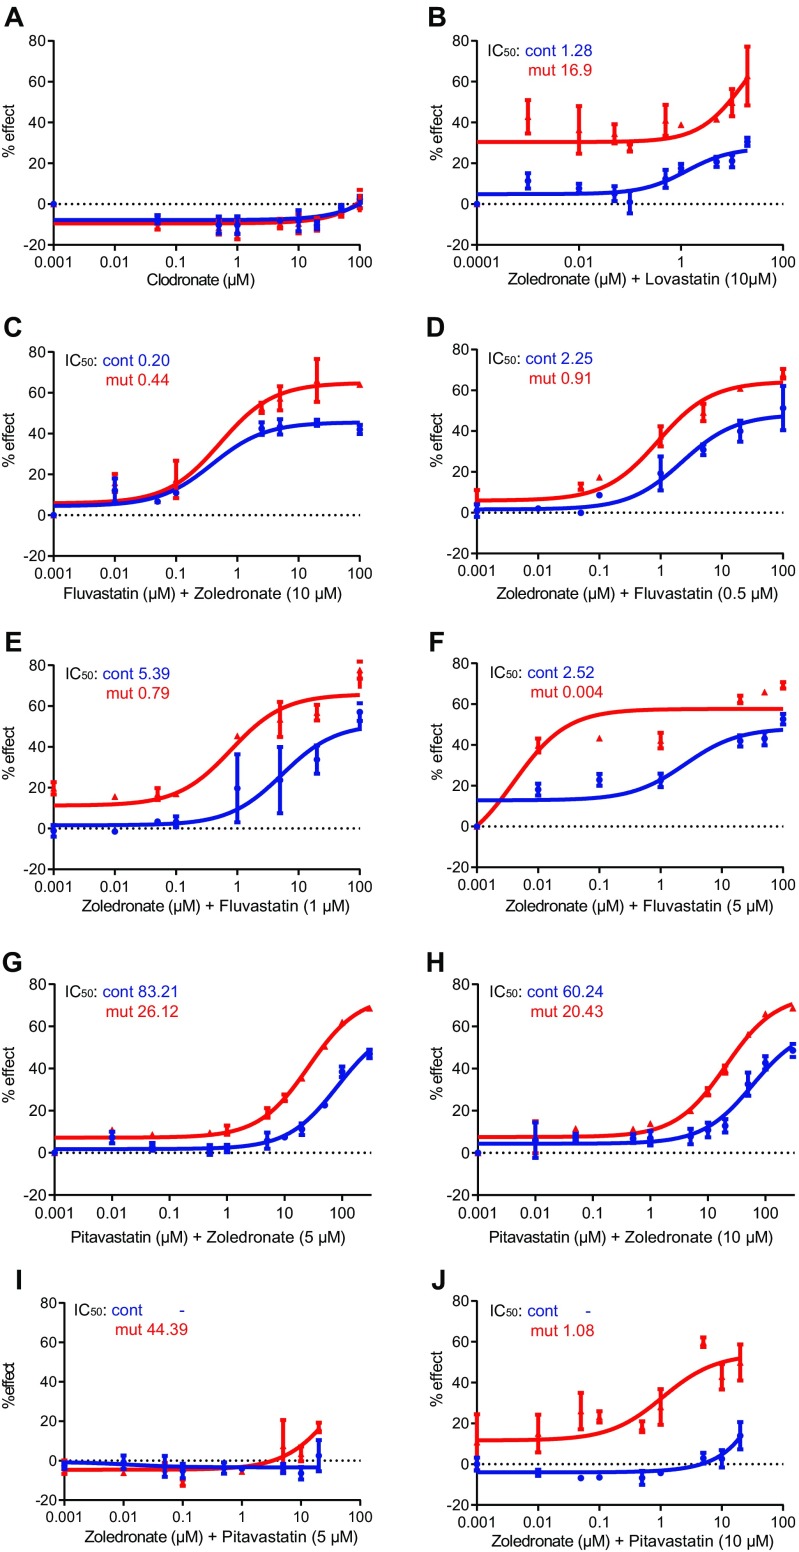
Zoledronate affected the proliferation of Ccm3−/− astrocytes at high concentrations, albeit not as efficiently as statins, whereas the nonnitrogenous bisphosphonate clodronic acid (clodronate) (18) had no effect (Fig. 1F and Fig. S2A). Therefore, we tested the efficacy of zoledronate in combination with lovastatin, fluvastatin, or pitavastatin at the dose (10 µM) used in the screen. Dose–response studies indicated that zoledronate was more effective with fluvastatin than with either pitavastatin or lovastatin (Fig. 1 G and H and Fig. S2B). Because 10 µM fluvastatin was very potent, we titrated zoledronate and fluvastatin to identify optimal concentrations. Dose–response studies for zoledronate with fluvastatin (Fig. 1 I and J and Fig. S2 C–F) or pitavastatin (control) (Fig. S2 G–J) indicated that the zoledronate-fluvastatin combination was synergistic and effective. In Ccm3−/− astrocytes, 5 µM zoledronate effectively lowered the IC50 of fluvastatin from 1.47 to 0.14 µM (Fig. 1 D and I), and, conversely, 2.5 µM fluvastatin effectively lowered the IC50 of zoledronate from 13.7 to 0.07 µM (Fig. 1 F and J). In fact, fluvastatin at an even lower concentration (1 or 0.5 µM) effectively reduced the IC50 of zoledronate from 13.7 to 0.79 µM or 0.91 µM, respectively (Fig. S2 D and E).
Fig. S2.
Dose–response curves for clodronate and for the N-biphosphonate zoledronate in combination with lovastatin, fluvastatin, or pitavastatin. (A) Dose–response curves for the nonnitrogenous bisphosphonate clodronic acid (clodronate) at serial dilutions (0.001–100 μM). (B–J) Dose–response curves for zoledronate in combination with lovastatin (B), fluvastatin (C–F), or pitavastatin (G–J) at various relative concentrations (as indicated). The fluvastatin/zoledronate combination is the most effective (C–F). IC50 values for each drug tested and each genotype are indicated in each graph. Results are averages of at least three paired independent experiments.
Combined Treatment with Fluvastatin and Zoledronate Reverses the Effects of CCM3 Loss in Vitro.
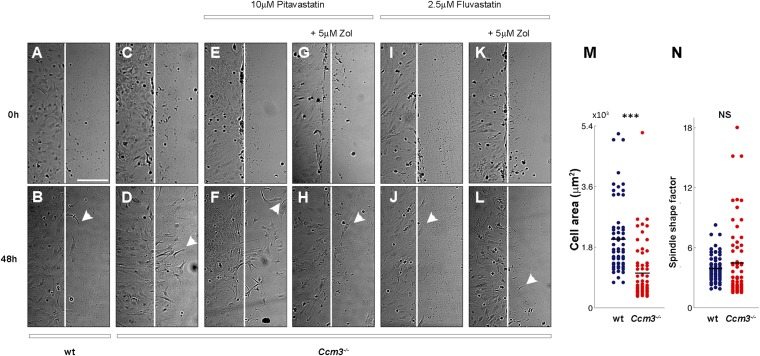
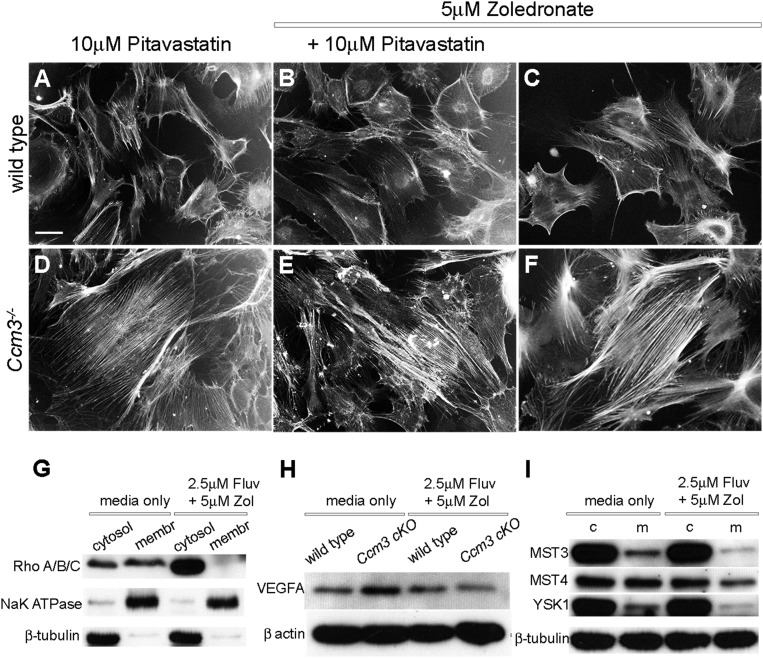
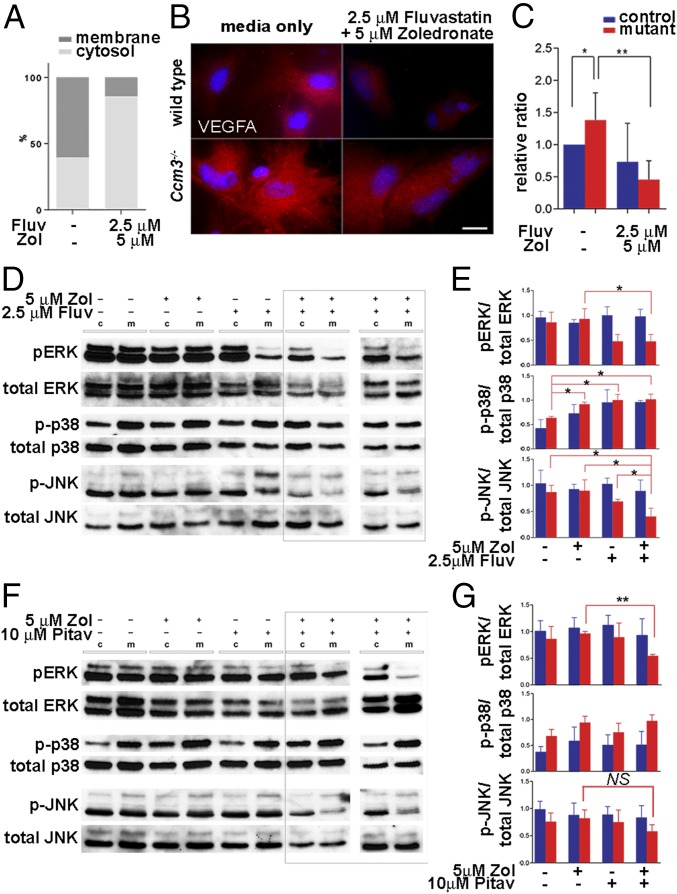
We then investigated the effect of combined treatment on additional outcomes of CCM3 loss. Ccm3−/− primary astrocytes migrate faster than wild-type astrocytes on grooved substrata (Fig. 2 A–C and Fig. S3) and in the classic scratch assay (Fig. 2D and Fig. S3). Combined treatment effectively attenuated migration in both assays without an obvious effect on wild-type cells (Fig. 2 D and E and Fig. S3). Moreover, treatment with fluvastatin (but not pitavastatin) and zoledronate suppressed actin stress fibers, an indicator of RhoA activation that is characteristic of Ccm3−/− astrocytes (Fig. 2 F–V and Fig. S4 A–F), resulting in diminished RhoA association with the membrane (Fig. 3A and Fig. S4G). Finally, activated astrocytes express VEGFA (19), and indeed Ccm3−/− astrocytes expressed high levels of VEGFA, which was significantly reduced by drug treatment (Fig. 3 B and C and Fig. S4H). Therefore, low-dose fluvastatin and zoledronate reduced the aberrant proliferation and the increased migration, stress fiber formation, and VEGFA expression associated with CCM3 loss in primary astrocytes.
Fig. 2.
Combined treatment with fluvastatin and zoledronate reduces several cellular phenotypes of Ccm3−/− primary astrocytes. (A and B) Collective migration of wild-type and Ccm3−/− astrocytes on grooved substrata. (A) Expansion of monolayers over a period of 48 h. The dashed and curved solid lines indicate boundaries at t = 0 and t = 48 h, respectively. Red arrows indicate the results of particle image velocity (PIV) analysis and describe the velocity of particles representing individual cells in the images. Arrow length corresponds to speed, and arrow direction indicates direction of movement. (B) Quantitative PIV analysis of collective cell migration. Horizontal dashed lines indicate averaged speed values; vertical dashed lines indicate the boundary of monolayers at t = 0. **P < 0.001; Wilcoxon signed-rank test. (C) Speed of migration of individual wild-type and Ccm3−/− astrocytes on grooved substrata (n = 60). Horizontal lines represent averaged values for each group. ***P < 0.0005; Wilcoxon signed-rank test. (D) Classical scratch assay. Quantification of the effective distance migrated in the 48 h after scratching. Drugs were added 24 h before scratching. Each assay was performed in triplicate on freshly isolated primary astrocytes growing in monolayers and was repeated three times on independent preparations of wild-type and Ccm3−/− astrocytes. Results are representative of three paired independent experiments. *P < 0.05, **P < 0.005. (E) Speed of individual cell migration on grooved substrata (n = 40) cultured for 72 h in medium supplemented with vehicle or with fluvastatin (2.5 μM) and zoledronate (5 μM). Drug treatment suppresses the increased migration speed of Ccm3−/− astrocytes without impacting migration of wild-type counterparts. ***P < 0.0005. (F–Q) Representative images of wild-type (F–K) and Ccm3−/− (L–Q) primary astrocytic cultures stained with phalloidin to reveal F-actin fibers. Ccm3−/− astrocytes form stress fibers (L). Combined treatment reverses stress fiber formation (P). Primary astrocytes were cultured for 72 h in normal medium (F, I, and L) or in medium supplemented with zoledronate (G, H, M, N, and O), fluvastatin (K and Q), or both (J and P). F and I are duplicates. Results are representative of three paired independent experiments. (R–V) Quantitative analysis of phalloidin intensity density in primary astrocytic cultures. (R–U) Representative images of Ccm3−/− cultures stained with phalloidin. (V) Mean density of phalloidin intensity. Error bars represent SEM. **P < 0.005. Results are averages of three paired independent experiments.
Fig. S3.
Combined treatment with fluvastatin and zoledronate suppresses the increased migration of Ccm3−/− astrocytes. (A–L) Classical scratch assay. Representative images of astrocytic cell monolayers from wild-type (wt) (A and B) and Ccm3 cKO (C–L) littermates subjected to scratch assay at t = 0 and grown for 48 h in normal medium (A–D) or medium supplemented with drug combinations as indicated (E–L). Vertical lines mark the scratch in each plate at t = 0 (A–L). Arrowheads indicate the locations of cells that have migrated farthest from the scratch front (B, D, F, H, J, and L). Results are representative of three paired independent experiments. (Scale bar in A, applies to A–L: 20 μm.) (M and N) Migration of individual Ccm3−/− astrocytes on grooved substrata. Cell area (M) and spindle-shape factor (N) of individual wild-type (wt) and Ccm3−/− astrocytes (n = 60). Solid lines represent averaged values for each group. ***P < 0.0005, Wilcoxon signed-rank test; NS, not significant.
Fig. S4.
Effects of drug treatment combinations on cellular phenotypes associated with CCM3 loss. (A–F) Wild-type (A–C) or Ccm3−/− (D–F) astrocytes were cultured for 72 h in medium supplemented with pitavastatin and/or zoledronate at the concentrations indicated. This drug combination has no effect on stress fibers. Results are representative of three paired independent experiments. [Scale bar in A (applies to all): 50 μm.] (G) Western blot analyses of cell lysates from Ccm3−/− astrocytes fractionated into cytosolic (cytosol) and membrane (membr) fractions demonstrate that treatment with fluvastatin and zoledronate reduces levels of membrane-associated (activated) RhoA/B/C. Results are representative of three paired independent experiments. (H) Western blot analyses of cell lysates from wild-type and Ccm3−/− astrocytes cultured in normal medium or medium supplemented with fluvastatin and zoledronate as indicated. Results are representative of three paired independent experiments. (I) Western blot analyses of cell lysates from wild-type (control, c) and Ccm3−/− (mutant, m) astrocytes demonstrate that treatment with the fluvastatin and zoledronate combination does not affect the expression of the known CCM3 interactors MST3/STK24, MST4/MASK/STK26, and YSK1/SOK1/STK25. Results are representative of three paired independent experiments.
Fig. 3.
Mechanistic effects of fluvastatin and zoledronate in primary astrocytes. (A) In Ccm3−/− astrocytes, RhoA preferentially accumulates in the membrane fraction indicating increased activation; combined treatment results in RhoA enrichment in the cytosolic fraction (P = 0.0026). Results are averages of three independent experiments. (B and C) Ccm3−/− astrocytes express increased VEGFA protein. (B) Immunofluorescence analysis indicates increased levels of VEGFA in Ccm3−/− astrocytes, which are significantly reduced by drug treatment. (C) Western blot analyses of cell lysates from astrocytes cultured in normal medium or in medium supplemented with drugs. Quantitative analysis indicates significant up-regulation VEGFA in Ccm3−/− astrocytes compared with wild-type astrocytes (*P = 0.0256). The drugs result in significant reduction of VEGFA in Ccm3−/− astrocytes (**P = 0.0073). Results are averages of three paired independent experiments. (D–G) Western blot (D and F) and quantitative analyses (E and G) of lysates of wild-type (control, c) and Ccm3−/− (mutant, m) astrocytes. Fluvastatin/zoledronate (D and E) inhibit activation of JNK1 and ERK1/2, but not p38, in Ccm3−/− astrocytes. Pitavastatin/zoledronate (F and G) inhibit phosphorylation of ERK1/2 but not JNK1 (P = 0.1082). Two independent experiments are shown for each combination (indicated by the rectangles in D and F). Results are averages of three paired independent experiments. *P < 0.05; **P < 0.005.
Fluvastatin with Zoledronate Treatment Modulates the JNK Pathway.
The drugs had no clear effect on known CCM3 interactors [the kinases MST3/STK24, MST4/MASK/STK26, or YSK1/SOK1/STK25 (20)], indicating that these are not likely to mediate drug action (Fig. S4I). However, fluvastatin alone or together with zoledronate inhibited both JNK1 and ERK1/2 phosphorylation, whereas the pitavastatin-zoledronate combination affected only ERK1/2 (Fig. 3 D–G), suggesting that fluvastatin and zoledronate specifically modulated the JNK pathway.
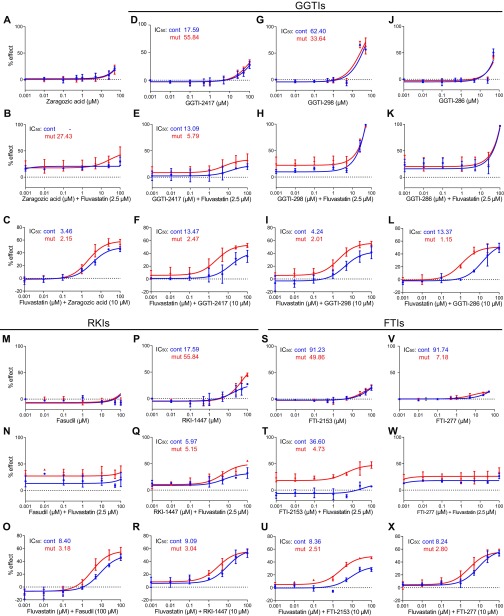
To dissect further the mechanism underlying the marked effect of zoledronate on the IC50 of fluvastatin, we tested inhibitors of mevalonate pathway branches (Fig. 1C). Zaragozic acid, an inhibitor of squalene synthase, had no effect (Fig. S5 A–C). Inhibitors of geranyl-geranyl transferase (GGTIs; namely, GGTI-298, -2417, and -286) (Fig. S5 D–L), Rho kinase (RKIs; RKI-1447 and fasudil) (Fig. S5 M–R), and farnesyl transferase (FTIs, namely, FTI-277, and -2153) (Fig. S5 S–X) each affected the IC50 of fluvastatin, but none did so as effectively as zoledronate (1–2 μM vs. 0.1–0.2 μM) (Fig. 1I and Fig. S5), suggesting that sustained inhibition of the main trunk of the pathway (by fluvastatin and zoledronate) is more potent than inhibition of the main trunk (by fluvastatin) and of one of its branches (by GGTIs, RKIs, or FTIs), possibly because of compensatory alternative feedback mechanisms in the latter case.
Fig. S5.
Effects of various mevalonate pathway inhibitors on the action of fluvastatin. (A–X). Dose–response curves for various inhibitors of the mevalonate pathway. (A–C) Zaragozic acid (squalene synthase inhibitor). (D–L) GGTIs: GGTI-298 (G–I), GGTI-2417 (D–F), and GGTI-286 (J–L). (M–R) Rho kinase inhibitor RKI-1447 and fasudil. (S–X) FTIs: FTI-277, FTI-2153 alone (A, D, G, J, M, P, S, and V) or in combination with fluvastatin (B, C, E, F, H, I, K, L, N, O, Q, R, T, U, W, and X) at various relative concentrations (as indicated). The IC50 values for each drug tested and each genotype are indicated in each graph. Results are averages of three paired independent experiments.
Combined Treatment Reverses Cell-Autonomous and Non–Cell-Autonomous Effects of Astrocytic CCM3 Loss in Flies and Mice in Vivo.
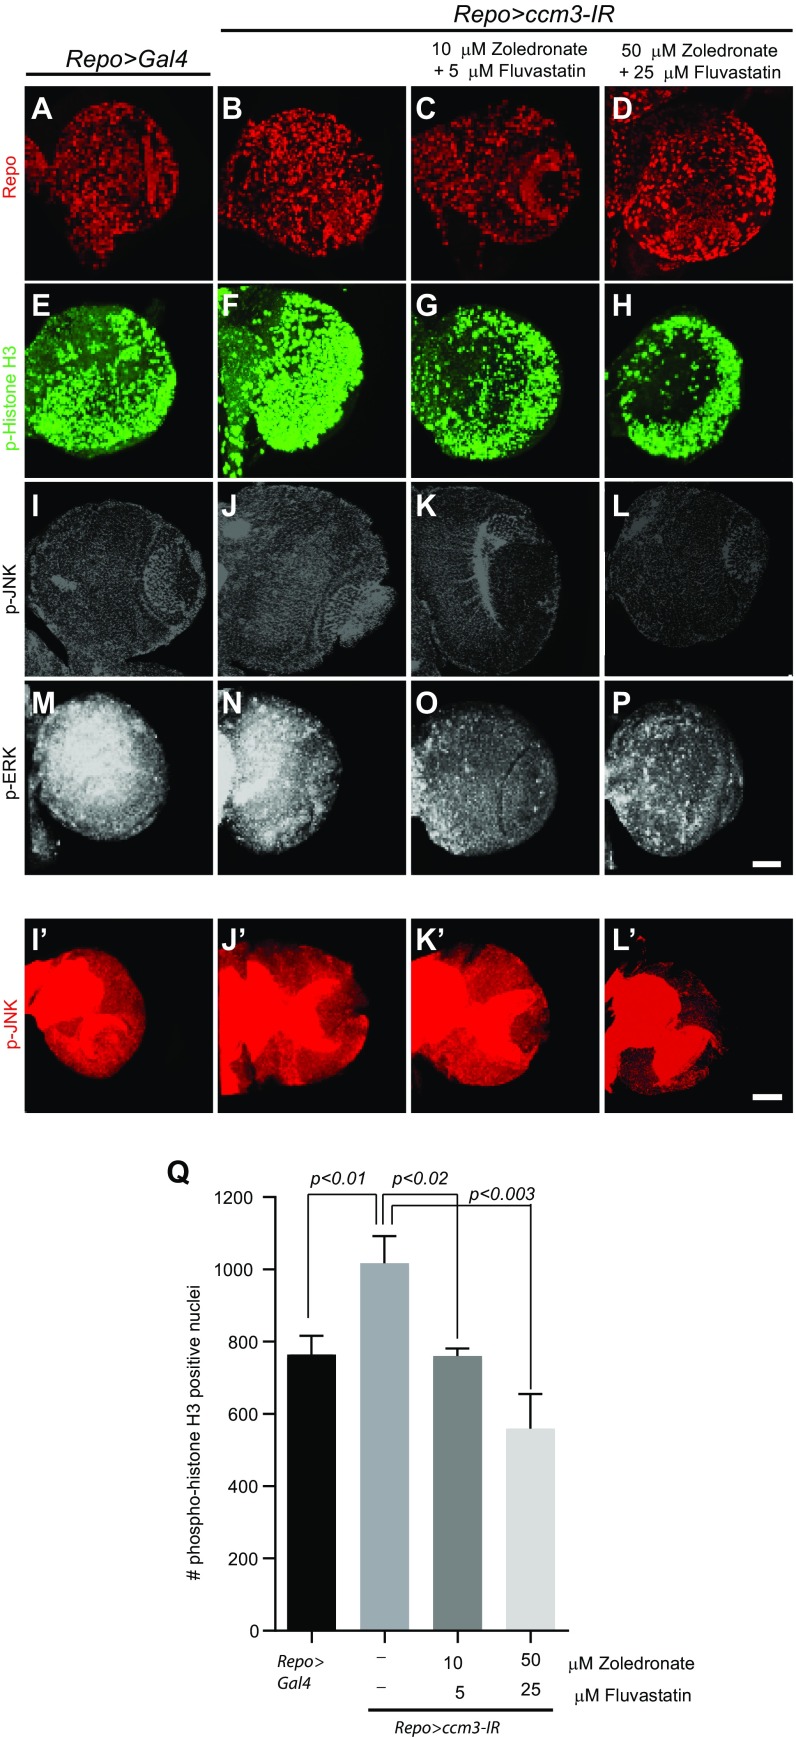
Having established drug efficacy in primary astrocytes, we next assessed their effects in model organisms. In Drosophila, a genetically tractable model, the drugs attenuated glial cell proliferation in a dose-dependent manner following RNAi targeting CG5073, the single ortholog of Ccm3 (21), and also inhibited the JNK and ERK pathways (Fig. S6), suggesting that Drosophila may be useful for rapidly testing candidate compounds.
Fig. S6.
Fluvastatin and zoledronate treatment reverses the effects of CCM3 knockdown in Drosophila. (A–L′) Knockdown of ccm3, the single ortholog of Ccm3 in Drosophila. (A, B, E, and F) Expression of ccm3-IR with Repo-Gal4 results in increased proliferation in wandering third-instar larval brain. Immunofluorescent staining with phospho-histone H3 (p-Histone H3). (C, D, G, and H) The zoledronate and fluvastatin combination results in a significant reduction of dividing glial cells. (I–P) Dose-dependent reduction of p-ERK (M–P) and, to a lesser extent, p-JNK (I–L) staining following treatment with the fluvastatin and zoledronate combination (as indicated). [Scale bars (applies to all): 50 μm.] Images are either single optical sections (I–L) or 3D projections of identical Z sections (A–H, M–P, and I′–L′). All images were acquired at identical confocal settings. Results are representative of three paired independent experiments. (Q) Quantification of phospho-histone H3–positive cells (n = 3 for each condition). Phospho-histone H3 was quantified in Repo-positive glial cells.
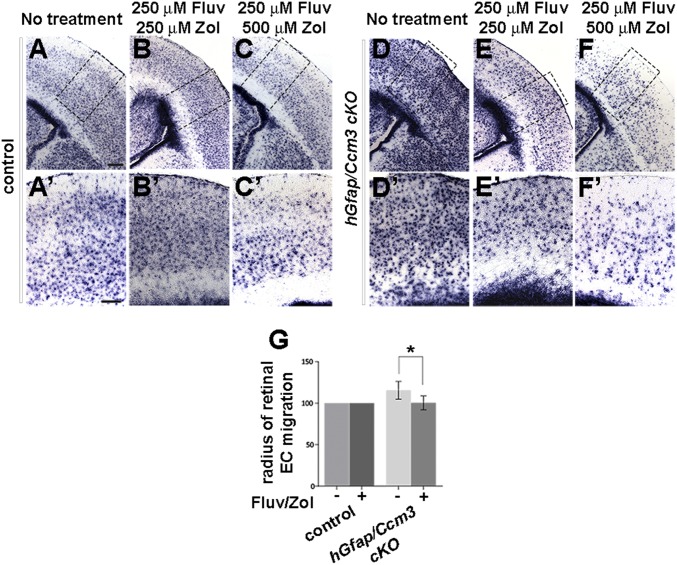
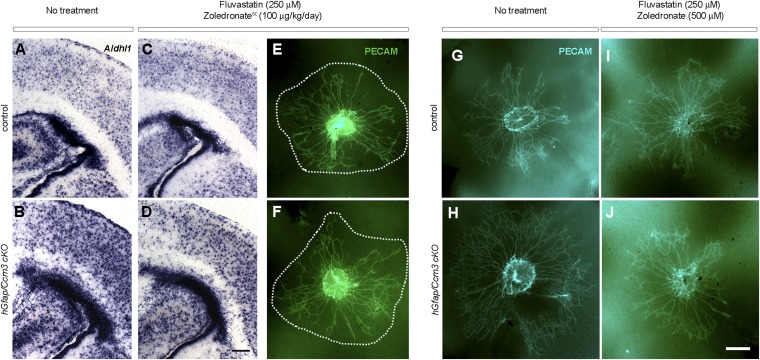
Next, we investigated the effects of combined treatment using two mouse models of CCM3 loss. In the first model, hGfap/Ccm3 cKO mice, the constitutive loss of CCM3 leads to hyperproliferation and activation of astrocytes and disrupts the development of the retinal vasculature (5, 6), which forms on a template of astrocytes emerging from the optic nerve (22). Fluvastatin (250 μM; 30 mg⋅kg−1⋅d−1) and zoledronate (500 μM; 40 mg⋅kg−1⋅d−1) were administered in drinking water to pregnant dams or lactating females for 4–7 d at doses previously used in animal studies and within the range recommended for humans (23–25). In some experiments, zoledronate (100 μg⋅kg−1⋅d−1) was injected s.c. instead. Neonates were analyzed at P2. The drugs abrogated the increased proliferation of Ccm3−/− astrocytes in a dose-dependent manner, as assessed by the reduced levels of Aldh1L1, a specific marker of astrocytes (Fig. 4 A–F′ and Fig. S7 A–D) (26). Retinal endothelial cell migration onto Ccm3−/− astrocytes is increased at P2, as compared with P1 (5), and was considerably reduced by drug treatment (Fig. 4G and Fig. S7 E–J), which therefore reversed cell-autonomous (in astrocytes) as well as non–cell-autonomous (in retina) effects of astrocytic CCM3 loss. Finally, both delivery routes for zoledronate were effective (Fig. S7), and treatment of control littermates with the drug combination had no obvious adverse effects in vivo.
Fig. 4.
Combined treatment with fluvastatin and zoledronate reverses outcomes of chronic astrocytic CCM3 loss in vivo. (A–F′) The drugs reverse astrocyte hyperproliferation in hGfap/Ccm3 cKO brain. Representative images of coronal sections from neonates following treatment of pregnant dams or nursing females as indicated. The sections were processed for in situ hybridization with Aldh1L1, a marker of astrocytes. (A′–F′) Higher-magnification images of the boxed areas in A–F. (Scale bars: 0.2 mm in A–F and 0.05 mm in A′–F′.) Results are representative of eight paired independent observations. (G) Quantification of the radius of endothelial cell migration in flattened retinae dissected from P2 pups. The drugs decelerate migration in hGfap/Ccm3 cKO retinae. n = 9 pairs of untreated and treated retinae; *P < 0.05.
Fig. S7.
Combined treatment with fluvastatin and zoledronate reverses astrocytic and retinal vascular defects in hGfap/Ccm3 cKO mice. (A–D) Representative images of coronal brain sections from wild-type control (A and C) and hGfap/Ccm3 cKO (B and D) neonates following treatment with 250 μM fluvastatin (in drinking water) and 100 μg⋅kg−1⋅d−1 zoledronate (administered by s.c. injections). The sections were processed for in situ hybridization with AldhL1, a marker of astrocytes. (E–J) Immunofluorescence images of flattened retinae dissected from wild-type control (E, G, and I) or hGfap/Ccm3 cKO (F, H, and J) littermates at P2 treated with 250 μM fluvastatin (in drinking water) and 100 μg kg−1⋅d−1 zoledronate (s.c.) (E and F), or 250 μM fluvastatin (in drinking water) and 500 μM zoledronate (in drinking water) stained with PECAM, an antibody specific to endothelial cells. Note that both delivery routes for zoledronate are effective. [Scale bars: 200 μm in D (applies to A–D) and in J (applies to E–J).]
Combined Treatment Reverses Outcomes of Endothelial CCM3 Loss in Vivo and Extends Longevity.
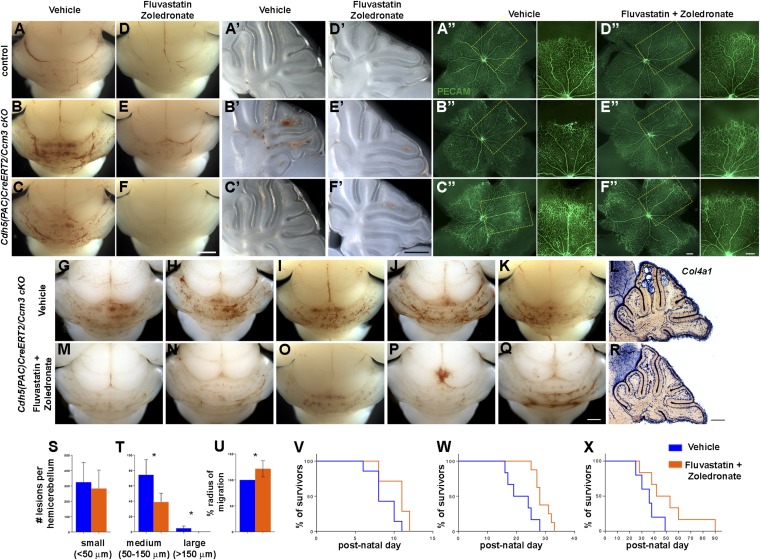
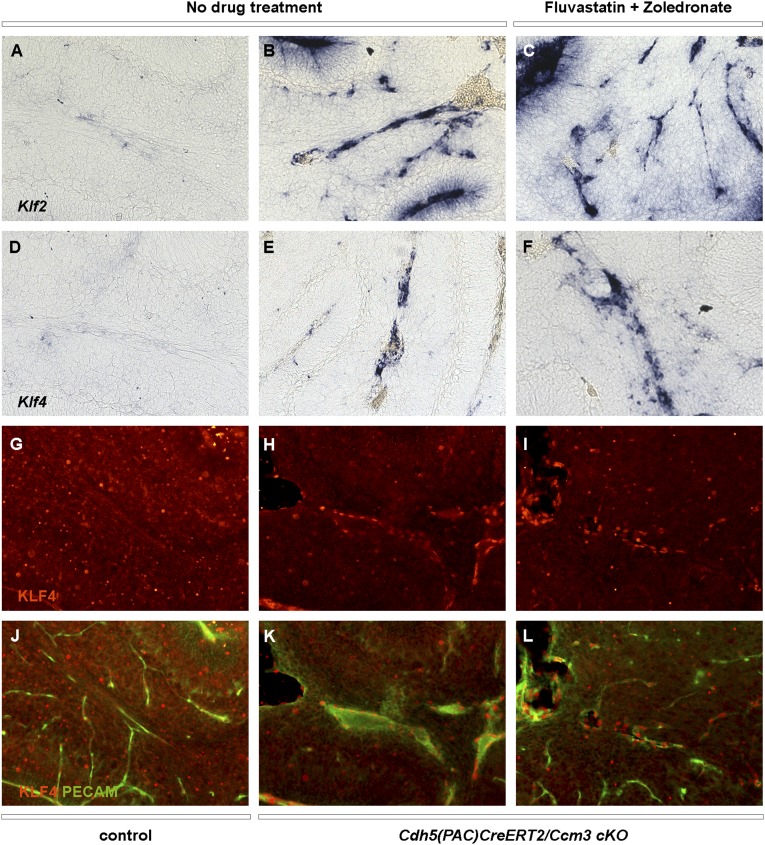
We next tested the effects of combined treatment in an endothelial cell-specific, acute model of CCM3 disease. We used inducible Cdh5(PAC)CreERT2/Ccm3 cKO mice, which develop vascular malformations in the cerebellum and retina (27) that respond to pharmacological manipulation (28). Newborn pups were induced with tamoxifen and then were injected daily with fluvastatin [15 mg⋅kg−1⋅d−1 intragastrically (i.g.)] and zoledronate (100 μg⋅kg−1⋅d−1 i.p.) starting at P2. Brains and retinae were analyzed at P6. Drug treatment significantly reduced cerebellar lesion burden (Fig. 5 A–F′ and G–T) and, moreover, partially rescued retinal blood vessel dilation and vascular malformations at the periphery of the retinal vascular network (Fig. 5 A′′–F′′ and U). Previous work showed that KLF2/4 are up-regulated following CCM loss in endothelial cells (29–33). KLF2/4 signals were increased in the cerebellum of cKO mice, but the drugs did not reverse this effect (Fig. S8). Finally, sustained drug treatment significantly prolonged the survival of cKO mice induced with a full dose of tamoxifen at P1 or P6 (Fig. 5 V and W) and even extended the longevity of mice induced with a low dose of tamoxifen at P6 to generate a subacute CCM model (Fig. 5X). In conclusion, combined treatment with fluvastatin and zoledronate reversed phenotypes in mice with CCM3 loss in vivo, suggesting a potential pharmacological therapy of CCM disease that warrants further investigation. Remarkably, although the drugs were initially identified and validated in astrocytes and in a chronic model of neural CCM3 loss in vivo, they also were effective in an acute model of endothelial CCM3 loss, demonstrating efficacy in more than one cell type.
Fig. 5.
Combined treatment with fluvastatin and zoledronate reverses outcomes of acute endothelial CCM3 loss in vivo. (A–U) The drugs decrease lesion burden (A–F′ and G–T) and reverse retinal vascular defects (A′′–F′′ and U) in Cdh5(PAC)CreERT2/Ccm3 cKO mice. (A–K and M–Q) Whole-mount brains (A–F), corresponding sagittal sections through the cerebellum (A′–F′), and corresponding flattened retinae (A′′–F′′ ) from mice induced with tamoxifen at P1, injected daily with vehicle (A–C and G–K) or fluvastatin and zoledronate (D–F and M–Q), and analyzed at P6. (A–A′′ and D–D′′: wild-type control; B–C′′, E–F′′, G–K, and M–Q: cKO.) Pups received daily injections of vehicle (A–C) or fluvastatin (i.g. 15 mg⋅kg−1⋅d−1) and zoledronate (i.p. 100 μg⋅kg−1⋅d−1) (D–F) starting at P2. Vascular malformations of varying severity (B, B′, C, and C′) are significantly reduced in number following drug treatment (E, E′, F, and F′). (A′′–F′′) Representative images of flattened retinae isolated from wild-type and cKO littermates immunostained with PECAM (endothelial cells). Higher-magnification images of the boxed areas in A′′–F′′ are shown at the right. Acute loss of CCM3 in endothelial cells results in lesioned areas with irregular vasculature (B′′ and C′′) not seen in wild-type retina (A′′). Drug treatment prevents abnormal development of retinal vasculature in cKO pups (E′′ and F”) without obvious effects on wild-type pups (D′′). (L and R) Lesions on serial sagittal sections of hemicerebellum were processed with in situ hybridization for Col4a1 to reveal the vasculature. (S and T) Lesions were classified in three groups, according to their diameter: small (<50 μm), medium (50–150 μm), and large (>150 μm) and were quantified (n = 4 pairs). Graphs indicate the number of small (S) and medium or large (T) lesions per hemicerebellum of vehicle- or drug-treated pups (n = 4 pairs). (S) Small, vehicle: 324.3 ± 63.78; drugs: 283.5 ± 59.97 (not significant). (T) Medium, vehicle: 74.25 ± 9.961; drugs: 38.75 ± 5.793 (*P = 0.0216); large, vehicle: 4.5 ± 1.555; drugs: 0.0 ± 0.0 (*P = 0.0275). See SI Materials and Methods for details. (U) Average radius of endothelial cell migration in flattened retinae of cKO neonates treated with vehicle or drugs (n = 6 pairs of untreated and treated retinae; *P = 0.0069, t test). (V–X) Kaplan–Meier survival curves. cKO neonates were induced with 35 mg/kg (V and W) or 10 mg/kg (X) tamoxifen at P1 (V) or P6 (W and X); treatment started 24 h after induction and continued to endpoint. Increase in lifespan in treated (P1: full dose: n = 7, P = 0.0334; P6: full dose: n = 8, P = 0.0071; low dose: n = 6, P = 0.0734; log-rank test) compared with untreated mice (P1, n = 7; P6, full dose, n = 6; low dose; n = 5). [Scale bars: 1 mm in F (applies to A–F) and Q (applies to G–K and M–Q); 0.5 mm in F′ (applies to A′–F′) and R (applies to L and R); 200 μm in F′′ (applies to A′′–F′′ low and high magnification.]
Fig. S8.
The fluvastatin and zoledronate combination has no effect on KLF2/4 expression in Cdh5(PAC)CreERT2/Ccm3 cKO mice. (A–F) In situ hybridization with Klf2 (A–C) or Klf4 (D–F) on cerebellar sections of control (A and D) or Cdh5(PAC)CreERT2/Ccm3 cKO (B, C, E, and F) mice treated with vehicle (no drug treatment; A, B, D, and E) or with fluvastatin and zoledronate combination (C and F). (G–L) Immunofluorescence with KLF4 (G–I) or KLF4 and PECAM (J–L) on cerebellar sections of control (G and J) or Cdh5(PAC)CreERT2/Ccm3 cKO (H, I, K, and L) mice treated with vehicle (no drug treatment; G, H, J, and K) or fluvastatin and zoledronate combination (I and L).
SI Materials and Methods
Study Design.
The objective of the study was to identify available drugs and bioactive compounds that might be effective for the treatment of CCM disease, using high-throughput screening. The study further sought to address how treatment efficacy could be enhanced and to define the underlying molecular mechanisms. Finally, the treatment was tested in vivo in Drosophila and in two different and well-characterized mouse models of CCM disease. All in vitro experiments were repeated in at least three independent cultures. For in vivo studies, animals were randomized into groups. All experimental and control animals were littermates, and no samples or animals were excluded from analysis. Sample sizes were estimated based on our preliminary findings for rescue of the CCM phenotype and previous reports. Sample sizes were based on preliminary visual analysis of the hindbrains of P6 animals from which lesion numbers and sizes can be directly assessed and showed that differences between genotypes would allow statistical interpretation with relatively small n values. The migration assay and all quantifications (lesion size and migration distance) in vivo were performed in a blinded fashion. All figures are representative of at least three paired independent experiments unless otherwise noted.
Animals.
Mice were maintained in compliance with National Institutes of Health guidelines and as approved by the Yale University Institutional Animal Care and Use Committee. Ccm3lox mutants were reported previously (5, 6). hGfap-Cre mice were purchased from the Jackson Laboratory (no. 004600). Cdh5(PAC)CreERT2 mice were a gift from Ralph Adams, Max Planck Institute for Molecular Biomedicine, Munich, Germany (40). To generate Cdh5(PAC)CreERT2/Ccm3 cKO mice (inducible endothelial cell-specific cKO), the Ccm3lox mutants were bred with Cdh5(PAC)CreERT2 mice. Tamoxifen (T5648; Sigma) was dissolved in corn oil at 10 mg/mL and diluted in 50 μL corn oil before a single intragastric administration at 35 mg/kg body weight at P1. For survival experiments, tamoxifen was delivered at P1 or P6 by a single i.g. injection at full (35 mg/kg body weight) or low (10 mg/kg body weight) dose. All mice were maintained in mixed genetic background (C57BL6, 129, and FVB), backcrossing more than 10 times. Breeding pairs between 2 and 6 months of age were used to generate the CCM mouse model. Male and female animals were used in equal numbers for all experiments.
Cultures of Primary Astrocytes.
Primary astrocytes from wild-type and hGfap/Ccm3 cKO littermates at P1 were isolated as previously described (5). Briefly, after genotyping, the neocortex was dissected free of meninges in sterile, ice-cold DMEM/F12 containing 20% FBS, minced with forceps, and forced through a 40-μm nylon mesh (no. 35230; Becton-Dickinson). The filtrate then was passed through a 10-μm nylon mesh (part number CMN0010; Small Parts), and cells were plated onto poly-l-ornithine (15 μg/mL; no. P4638; Sigma) and laminin (4 μg/mL; no. 23017-015; Invitrogen)-coated T-75 tissue culture flasks in DMEM/F12 containing 20% FBS, 100 U/mL penicillin, and 100 μg/mL streptomycin. These culturing conditions were used in all experiments. A highly enriched (as assessed by GFAP immunofluorescence) confluent monolayer of primary astrocytes was obtained within 7–10 d of seeding.
Drug Screen.
The primary screening was performed at the Yale Center for Molecular Discovery. Optimal seeding density of primary astrocytes was determined experimentally. Ccm3−/− astrocytes show increased proliferation (5), thus necessitating different initial seeding densities: 3 ×10³ wild-type cells per well vs. 1.5 × 10³ Ccm3−/− cells per well in uncoated 384-well plates, resulting in equal cell numbers at the time of compound addition, 24 h post seeding. Libraries of 3,806 bioactive compounds, including FDA-approved drugs and 160 kinase and phosphatase inhibitors (Enzo Life Sciences, MicroSource Gen-Plus, MicroSource Pharmac, and ChemBridge) were screened (ycmd.yale.edu/piloting-synthetic-and-natural-products-collections). Compounds were first dissolved in 10% DMSO at 10 mM and added to the cells 24 h after seeding at a final concentration of 10 μM. Control wells contained 10% DMSO. After 96 h, cell viability was quantified using the Cell Titer Glo Luminescent Cell Viability Assay (no. G7573; Promega). “Screen-active” candidate molecules with an effect 2 SDs from the median were used for follow-up evaluation. Compounds deprioritized from further investigation were frequent hitters based on reactive groups or behavior in assays and false positives. Toxicity of each compound was calculated as the percent effect relative to the mean of negative control wells (µc–) set as 0% effect and the mean of positive control wells (µc+) set as 100% effect, using the following formula: percent effect = 100 − {[(sample − µc+)/(µc– − µc+)]*100}. Thresholds were determined based on median and SDs of signals from all compound wells. Compounds displaying significant activity were selected as hits. Dose–response studies were performed on screen-active candidate molecules to assess reproducibility and to exclude those exhibiting assay interference or toxicity. Six different concentrations were selected spanning a range encompassing the IC50. Three independent experiments were performed. Drugs and inhibitors used were: cerivastatin (SML0005; Sigma), lovastatin (1530; Tocris), fluvastatin (344075; Calbiochem/EMD Chemicals), simvastatin (567021; Calbiochem/EMD Chemicals), mevastatin (26538076; Sigma), atorvastatin (PZ0001; Sigma), pravastatin (P4498; Sigma), pitavastatin (s1759; Selleckchem), fasudil (F-4660; LC Laboratories), zoledronate (L0223; Sigma), clodronate (D4434; Sigma); thiram (45689; Sigma), pyrithione zinc (H6377; Sigma), BAY11-7082 (196870; EMD Millipore), patulin (P1639; Sigma), mitoxantrone dihydrochloride (M6545; Sigma), zaragozic acid (17452; Cayman Chemical Company), GGTI-298 (G5169; Sigma), GGTI-286 (SML1186; Sigma), FTI-277 (F9803; Sigma), RKI-1447, GGTI-2417, and FTI-2153 (S.M.S.).
Scratch-Induced Migration Assay.
The scratch-induced migration assay was performed as previously described (37). Wild-type and Ccm3−/− astrocytes were plated in 48-well plates. Compounds were added when cells reached confluence, and the monolayer was scratched 24 h later. The scratched area was photographed after 48 h using a Zeiss Axiovert microscope, divided into 10 equal bins, and the longest migration distance was measured in each bin. Three independent experiments were performed; graphs in Fig. 2D show the average value of the 10 measurements.
Time-Lapse Microscopy of Live Cells and Quantitative Analysis of Cell Morphology and Migration.
We quantified migration speeds and shapes of individual cells with 1D fibrillar surfaces replicating the brain tissue ECM and time-lapse microscopy as previously described (39). Cells were cultured on poly-l-ornithine– and laminin-coated nanofabricated grooved surfaces, and their movements were recorded over a period of 72 h. Averages of cell populations were calculated from at least 40 cells. To investigate collective cell migration, we created a cell monolayer with a stencil that had a rectangular 2 × 5 mm hole on precoated substrata, seeded cells in the hole at high density (1 × 10⁶ cells in 50 μL of medium), and performed PIV analysis to quantify this collective cell migration as previously described (41).
Western Blot Analyses.
Western blot analyses were performed by standard methods. Antibodies used were JNK1 (1:1,000) (no. 3708; Cell Signaling); phospho-SAPK/JNK (1:1,000) (no. 4668; Cell Signaling); p44/42 MAPK (ERK1/2) (1:1,000) (no. 4695; Cell Signaling); phospho-p44/42 MAPK (ERK1/2) (1:3,000) (no. 4377; Cell Signaling); p38 MAPK (1:500) (no. 9212; Cell Signaling); phospho-p38 MAPK (1:200) (no. 9215; Cell Signaling); Rho (A, B, C) (1:200) (no. 05-778; Millipore); MST3 (1:500) (no. 611057; BD Transduction Laboratories); MST4 (1:500) (no. 3822; Cell Signaling); YSK1 (1:500) (no. sc6865; Santa Cruz); VEGF (1:50) (no. sc152; Santa Cruz); Na-K-ATPase (1:400) (no. ab7671; Abcam); and β-tubulin (1:500) (Santa Cruz; no. sc-9104). Image J was used for quantification of bands.
Protein Fractionation of Astrocytes.
Procedures were performed as described previously (42). Compounds were added the day after plating. Cells were collected after 72 h in 400 μL of ice-cold cytosol extraction buffer [150 mM NaCl, 50 mM Hepes (pH 7.4), 25 μg/mL Digitonin; no. D141 (Sigma)]. After centrifugation, the supernatant was collected as the cytosolic fraction, and the pellet was resuspended in 400 μL of ice-cold membrane extraction buffer [150 mM NaCl, 50 mM Hepes (pH 7.4), 1% Nonidet P-40], incubated on ice for 30 min, and centrifuged. The supernatant was collected as the membrane fraction.
In Situ Hybridization.
Mouse brains were extracted following intracardiac perfusion with 4% paraformaldehyde at P2 or P6. In situ hybridization was performed as previously described (6). RNA probes complementary to mouse AldhL1 (forward primer: 5′-agtaccataaacccaacggatg-3′; reverse primer: 5′-tagcgatgtacatgtggtcctc-3′), Klf2 (forward primer: 5′-acgtgttggacttcatcctctc-3′; reverse primer: 5′-aaagggtctgtgacctgtgtg-3′), Klf4 (forward primer: 5′-tatcctttccaactcgctaacc-3′; reverse primer: 5′-gtcacacttctggcactgaaag-3′), and collagen 4a1 (forward primer: 5′-aagggacaaaagggagaaagag-3′; reverse primer: 5′-tgtccaacttcacctgtcaaac-3′) were prepared and labeled with digoxigenin-11-UTP.
Immunostaining.
Immunostaining of primary astrocytes was performed by standard methods using anti-VEGF antibody (1:50) (no. sc152; Santa Cruz) and secondary antibodies (Jackson ImmunoResearch Laboratories). For F-actin staining, primary astrocytes were stained with Alexa Fluor 555-conjugated phalloidin (1:100) (no. A34055; Life Technologies) for 1 h at room temperature. To quantify the intensity of phalloidin staining, we segmented cells manually with the tool created by Matlab (MathWorks) and read the intensity values of phalloidin-stained images. The phalloidin intensity density representing the degree of cytoskeleton formation was calculated by dividing the summation of phalloidin intensity values by the spreading area of the corresponding segmented cell.
Analysis of Lesion Burden in Cerebellum.
For quantification, one half of the cerebellum was sectioned at 100 μm and then was subjected to in situ hybridization with Col4a1 to visualize the vasculature. Lesions were counted and classified in three groups according to the diameter of cavernae: small (20–50 μm), medium (50–150 μm), and large (>150 μm).
Drug Administration in Mice.
Fluvastatin and zoledronate were dissolved in DMSO or water, respectively, diluted in drinking water and were supplied to hGfap/Ccm3 cKO females starting at day 15–17 of gestation until pups were harvested at P2. Water consumption was monitored and recorded daily. For s.c. injections, zoledronate was diluted in water. For Cdh5(PAC)CreERT2:Ccm3 cKO mice, fluvastatin (15 mg⋅kg−1⋅d−1) and zoledronate (100 μg⋅kg−1⋅d−1) were diluted in corn oil or water for i.g. or i.p. administration, respectively. Treatment was initiated at P2 and continued daily until P5 or P7. For survival experiments, administration of fluvastatin (i.p. 15 mg⋅kg−1⋅d−1) and zoledronate (i.p. 100 μg/kg three times per week) was initiated at P7 and continued to endpoint. cKO mice treated in parallel with vehicle only (DMSO in water or corn oil) served as controls.
Fly Genetics and Drug Screen.
ccm3 RNAi lines were obtained from the Vienna Drosophila Resource Center. Oregon R or yw flies were used as wild-type controls. Drug screens were performed based on previously published protocols and were set up as follows: groups of 50 female virgins (Repo > gal4, eGFP) were mated with 25 ccm3-IR or yw (control) males. After 48 h, six females and three males were transferred to drug- and fly food-containing vials prepared as follows: Drug (fluvastatin + zoledronate) stocks (in DMSO) were dissolved to the required final concentration in 1.5 mL water and were added to vials containing 500 mg of Drosophila medium (Carolina Biological Supply) to reconstitute the fly food. DMSO was used for control treatment. Fleischmann's Active Dry Yeast was sprinkled on the food, and duplicate crosses with six female and three male flies were added to each vial. Flies were transferred to fresh food vials (with drugs) every 2 d. Wandering third-instar larval brains were dissected and stained using anti-pJNK (Calbiochem), anti-pERK (Abcam), and anti–phospho-histone H3 (Millipore). Brains were imaged using a Leica laser-scanning confocal microscope. For quantification of phospho-histone H3–positive nuclei, brains were imaged as stacks spaced at 1.5 µm and used to generate 3D projections with IMARIS software for quantification of nuclei.
Statistical Analysis.
All graphs report mean ± SEM and are compared using an unpaired two-tailed Student’s t test, one-way ANOVA, or Wilcoxon signed-rank test when appropriate. P values were two-tailed, and values <0.05 were considered to indicate statistical significance. The mean and SEM are shown in the bar graphs. Survival was estimated by Kaplan–Meier curves and compared using the log-rank test. For lesion analysis and for retina migration assay, variance between groups was found to be statistically insignificant when compared using one-way ANOVA (F-test). Statistical analyses were carried out using GraphPad Prism software (version7).
Discussion
Here, we report a potential combination therapy for CCM disease compatible with human administration. We demonstrate that fluvastatin (identified in an unbiased in vitro screen) and zoledronate, two FDA-approved drugs, reduce the severity of outcomes associated with CCM3 loss in primary astrocytes and reverse the effects of ccm3 silencing in Drosophila glial cells in vivo. The drugs further reverse neural and vascular phenotypes in chronic and acute preclinical mouse models of CCM3 and significantly reduce lesion burden while extending longevity, suggesting that they are efficient in different cellular contexts. Importantly, both drugs cross the blood–brain barrier (https://www.drugbank.ca/), as also indicated by the results in this study. Our findings suggest that a two-step inhibition of the main trunk of the mevalonate pathway potently attenuates the effects of CCM3 loss and warrants studies to evaluate fluvastatin and zoledronate as a potential combined therapeutic intervention. Notably, familial CCM3 disease is associated with earliest onset and most severe prognosis, and its clinical phenotype is exceptionally aggressive (34). Our unbiased screen identified statins as the major candidate drug group for consideration in the context of CCM disease. Statins are well-studied and widely prescribed medicines. Fluvastatin, the first HMG-CoA reductase inhibitor to be synthetically prepared, has a short half-life with no active metabolites. In the clinical setting, it is used to treat dyslipidemias and as secondary prevention of cardiovascular disease. Exploring statins in the clinical population as therapy for CCM has proponents (35), despite potential pathological outcomes associated with inhibition of prenylation (36). The results of a clinical trial to assess the effects of simvastatin on barrier permeability in CCM1 patients are pending (ClinicalTrials.gov identifier: NCT01764451). Zoledronate, an inhibitor of farnesyl-pyrophosphate and geranyl-geranyl-pyrophosphate synthases, is approved to treat and prevent glucocorticoid-induced osteoporosis, hypercalcemia of malignancy, and multiple myeloma and bone metastases from solid tumors.
To date, various agents have been tested in preclinical models of CCM, including fasudil, which reduced lesion burden in Ccm1 and Ccm2 heterozygous mice (8), and simvastatin, which stabilized the endothelium of the latter (9) but failed to reduce lesion burden in mice lacking endothelial CCM2 (10), in contrast to cholecalciferol (vitamin D3) and tempol (a scavenger of superoxide) (10). Moreover, fasudil (but not simvastatin) reduced lesion burden and improved survival in sensitized Ccm1 (but not Ccm2) heterozygous mice (11). The nonsteroidal antiinflammatory drug sulindac sulfide constrained vascular lesions in Cdh5(PAC)CreERT2/Ccm3 cKO mice lacking endothelial CCM3 (28). Combined treatment with fluvastatin and zoledronate appears to have effects comparable to sulindac sulfide on survival; both approaches also reduced lesion burden, although slight differences in analyses preclude direct comparisons. Because endothelial gain of MEKK3 was suggested in CCM1 disease (33), future studies will likely test inhibitors of this cascade. In conclusion, fluvastatin/zoledronate combination therapy, which effectively inhibits the mevalonate pathway, warrants further evaluation as a pharmacological intervention in familial and potentially in sporadic CCM disease.
Materials and Methods
Animals.
Mice were maintained in compliance with National Institutes of Health guidelines. Protocols were approved by the Yale University Institutional Animal Care and Use Committee. Details on mouse strains and drug administration are provided in SI Materials and Methods.
Cultures of Primary Astrocytes and Drug Screen.
Primary astrocytes from wild-type and hGfap/Ccm3 cKO littermates at P1 were isolated as previously described (5). The primary screening was performed at the Yale Center for Molecular Discovery.
The scratch-induced migration assay (37), analysis of retinal malformations (38), time-lapse microscopy (39), and lesion burden were performed as previously described. Details are provided in SI Materials and Methods.
Antibodies.
The full list of antibodies used is reported in SI Materials and Methods.
Acknowledgments
We thank Ralph Adams for sharing the Cdh5(PAC)CreERT2 mice and Anne Eichmann for facilitating their transfer. This work was supported by NIH Grant NS046521 (to M.G.) and the Yale Program on Neurogenetics.
Footnotes
The authors declare no conflict of interest.
This article is a PNAS Direct Submission.
This article contains supporting information online at www.pnas.org/lookup/suppl/doi:10.1073/pnas.1702942114/-/DCSupplemental.
References
- 1.Russell DS, Rubenstein LJ. Pathology of Tumors of the Nervous System. Williams and Wilkins; Baltimore: 1989. [Google Scholar]
- 2.Louvi A, Gunel M. In: Genetics of Cerebral Cavernous Malformations. Youmans and Winn Neurological Surgery. 7th Ed. Winn HR, editor. Elsevier; Philadelphia: 2017. pp. 3547–3553. [Google Scholar]
- 3.Riant F, Bergametti F, Ayrignac X, Boulday G, Tournier-Lasserve E. Recent insights into cerebral cavernous malformations: The molecular genetics of CCM. FEBS J. 2010;277:1070–1075. doi: 10.1111/j.1742-4658.2009.07535.x. [DOI] [PubMed] [Google Scholar]
- 4.Draheim KM, Fisher OS, Boggon TJ, Calderwood DA. Cerebral cavernous malformation proteins at a glance. J Cell Sci. 2014;127:701–707. doi: 10.1242/jcs.138388. [DOI] [PMC free article] [PubMed] [Google Scholar]
- 5.Louvi A, et al. Loss of cerebral cavernous malformation 3 (Ccm3) in neuroglia leads to CCM and vascular pathology. Proc Natl Acad Sci USA. 2011;108:3737–3742. doi: 10.1073/pnas.1012617108. [DOI] [PMC free article] [PubMed] [Google Scholar]
- 6.Louvi A, Nishimura S, Günel M. Ccm3, a gene associated with cerebral cavernous malformations, is required for neuronal migration. Development. 2014;141:1404–1415. doi: 10.1242/dev.093526. [DOI] [PMC free article] [PubMed] [Google Scholar]
- 7.Stockton RA, Shenkar R, Awad IA, Ginsberg MH. Cerebral cavernous malformations proteins inhibit Rho kinase to stabilize vascular integrity. J Exp Med. 2010;207:881–896. doi: 10.1084/jem.20091258. [DOI] [PMC free article] [PubMed] [Google Scholar]
- 8.McDonald DA, et al. Fasudil decreases lesion burden in a murine model of cerebral cavernous malformation disease. Stroke. 2012;43:571–574. doi: 10.1161/STROKEAHA.111.625467. [DOI] [PMC free article] [PubMed] [Google Scholar]
- 9.Whitehead KJ, et al. The cerebral cavernous malformation signaling pathway promotes vascular integrity via Rho GTPases. Nat Med. 2009;15:177–184. doi: 10.1038/nm.1911. [DOI] [PMC free article] [PubMed] [Google Scholar]
- 10.Gibson CC, et al. Strategy for identifying repurposed drugs for the treatment of cerebral cavernous malformation. Circulation. 2015;131:289–299. doi: 10.1161/CIRCULATIONAHA.114.010403. [DOI] [PMC free article] [PubMed] [Google Scholar]
- 11.Shenkar R, et al. RhoA kinase inhibition with fasudil versus simvastatin in murine models of cerebral cavernous malformations. Stroke. 2017;48:187–194. doi: 10.1161/STROKEAHA.116.015013. [DOI] [PMC free article] [PubMed] [Google Scholar]
- 12.Zhang FL, Casey PJ. Protein prenylation: Molecular mechanisms and functional consequences. Annu Rev Biochem. 1996;65:241–269. doi: 10.1146/annurev.bi.65.070196.001325. [DOI] [PubMed] [Google Scholar]
- 13.Elsayed M, et al. Synergistic antiproliferative effects of zoledronic acid and fluvastatin on human pancreatic cancer cell lines: An in vitro study. Biol Pharm Bull. 2016;39:1238–1246. doi: 10.1248/bpb.b15-00746. [DOI] [PubMed] [Google Scholar]
- 14.Varela I, et al. Combined treatment with statins and aminobisphosphonates extends longevity in a mouse model of human premature aging. Nat Med. 2008;14:767–772. doi: 10.1038/nm1786. [DOI] [PubMed] [Google Scholar]
- 15.Yuasa T, Kimura S, Ashihara E, Habuchi T, Maekawa T. Zoledronic acid - a multiplicity of anti-cancer action. Curr Med Chem. 2007;14:2126–2135. doi: 10.2174/092986707781389600. [DOI] [PubMed] [Google Scholar]
- 16.Caraglia M, et al. Zoledronic acid: An unending tale for an antiresorptive agent. Expert Opin Pharmacother. 2010;11:141–154. doi: 10.1517/14656560903485664. [DOI] [PubMed] [Google Scholar]
- 17.Walter C, Pabst A, Ziebart T, Klein M, Al-Nawas B. Bisphosphonates affect migration ability and cell viability of HUVEC, fibroblasts and osteoblasts in vitro. Oral Dis. 2011;17:194–199. doi: 10.1111/j.1601-0825.2010.01720.x. [DOI] [PubMed] [Google Scholar]
- 18.McLeod NM, Moutasim KA, Brennan PA, Thomas G, Jenei V. In vitro effect of bisphosphonates on oral keratinocytes and fibroblasts. J Oral Maxillofac Surg. 2014;72:503–509. doi: 10.1016/j.joms.2013.08.007. [DOI] [PubMed] [Google Scholar]
- 19.Argaw AT, et al. IL-1beta regulates blood-brain barrier permeability via reactivation of the hypoxia-angiogenesis program. J Immunol. 2006;177:5574–5584. doi: 10.4049/jimmunol.177.8.5574. [DOI] [PubMed] [Google Scholar]
- 20.Goudreault M, et al. A PP2A phosphatase high density interaction network identifies a novel striatin-interacting phosphatase and kinase complex linked to the cerebral cavernous malformation 3 (CCM3) protein. Mol Cell Proteomics. 2009;8:157–171. doi: 10.1074/mcp.M800266-MCP200. [DOI] [PMC free article] [PubMed] [Google Scholar]
- 21.Song Y, Eng M, Ghabrial AS. Focal defects in single-celled tubes mutant for Cerebral cavernous malformation 3, GCKIII, or NSF2. Dev Cell. 2013;25:507–519. doi: 10.1016/j.devcel.2013.05.002. [DOI] [PMC free article] [PubMed] [Google Scholar]
- 22.Fruttiger M. Development of the retinal vasculature. Angiogenesis. 2007;10:77–88. doi: 10.1007/s10456-007-9065-1. [DOI] [PubMed] [Google Scholar]
- 23.Vintonenko N, et al. Transcriptome analysis and in vivo activity of fluvastatin versus zoledronic acid in a murine breast cancer metastasis model. Mol Pharmacol. 2012;82:521–528. doi: 10.1124/mol.111.077248. [DOI] [PubMed] [Google Scholar]
- 24.Hayashidani S, et al. Fluvastatin, a 3-hydroxy-3-methylglutaryl coenzyme a reductase inhibitor, attenuates left ventricular remodeling and failure after experimental myocardial infarction. Circulation. 2002;105:868–873. doi: 10.1161/hc0702.104164. [DOI] [PubMed] [Google Scholar]
- 25.Zadelaar S, et al. Mouse models for atherosclerosis and pharmaceutical modifiers. Arterioscler Thromb Vasc Biol. 2007;27:1706–1721. doi: 10.1161/ATVBAHA.107.142570. [DOI] [PubMed] [Google Scholar]
- 26.Cahoy JD, et al. A transcriptome database for astrocytes, neurons, and oligodendrocytes: A new resource for understanding brain development and function. J Neurosci. 2008;28:264–278. doi: 10.1523/JNEUROSCI.4178-07.2008. [DOI] [PMC free article] [PubMed] [Google Scholar]
- 27.Boulday G, et al. Developmental timing of CCM2 loss influences cerebral cavernous malformations in mice. J Exp Med. 2011;208:1835–1847. doi: 10.1084/jem.20110571. [DOI] [PMC free article] [PubMed] [Google Scholar]
- 28.Bravi L, et al. Sulindac metabolites decrease cerebrovascular malformations in CCM3-knockout mice. Proc Natl Acad Sci USA. 2015;112:8421–8426. doi: 10.1073/pnas.1501352112. [DOI] [PMC free article] [PubMed] [Google Scholar]
- 29.Maddaluno L, et al. EndMT contributes to the onset and progression of cerebral cavernous malformations. Nature. 2013;498:492–496. doi: 10.1038/nature12207. [DOI] [PubMed] [Google Scholar]
- 30.Renz M, et al. Regulation of β1 integrin-Klf2-mediated angiogenesis by CCM proteins. Dev Cell. 2015;32:181–190. doi: 10.1016/j.devcel.2014.12.016. [DOI] [PubMed] [Google Scholar]
- 31.Zhou Z, et al. The cerebral cavernous malformation pathway controls cardiac development via regulation of endocardial MEKK3 signaling and KLF expression. Dev Cell. 2015;32:168–180. doi: 10.1016/j.devcel.2014.12.009. [DOI] [PMC free article] [PubMed] [Google Scholar]
- 32.Cuttano R, et al. KLF4 is a key determinant in the development and progression of cerebral cavernous malformations. EMBO Mol Med. 2016;8:6–24. doi: 10.15252/emmm.201505433. [DOI] [PMC free article] [PubMed] [Google Scholar]
- 33.Zhou Z, et al. Cerebral cavernous malformations arise from endothelial gain of MEKK3-KLF2/4 signalling. Nature. 2016;532:122–126. doi: 10.1038/nature17178. [DOI] [PMC free article] [PubMed] [Google Scholar]
- 34.Shenkar R, et al. Exceptional aggressiveness of cerebral cavernous malformation disease associated with PDCD10 mutations. Genetics Med. 2015;17:188–196. doi: 10.1038/gim.2014.97. [DOI] [PMC free article] [PubMed] [Google Scholar]
- 35.Li DY, Whitehead KJ. Evaluating strategies for the treatment of cerebral cavernous malformations. Stroke. 2010;41(10) Suppl:S92–S94. doi: 10.1161/STROKEAHA.110.594929. [DOI] [PMC free article] [PubMed] [Google Scholar]
- 36.Eisa-Beygi S, Wen XY, Macdonald RL. A call for rigorous study of statins in resolution of cerebral cavernous malformation pathology. Stroke. 2014;45:1859–1861. doi: 10.1161/STROKEAHA.114.005132. [DOI] [PubMed] [Google Scholar]
- 37.Etienne-Manneville S. In vitro assay of primary astrocyte migration as a tool to study Rho GTPase function in cell polarization. Methods Enzymol. 2006;406:565–578. doi: 10.1016/S0076-6879(06)06044-7. [DOI] [PubMed] [Google Scholar]
- 38.Tual-Chalot S, Allinson KR, Fruttiger M, Arthur HM. Whole mount immunofluorescent staining of the neonatal mouse retina to investigate angiogenesis in vivo. J Vis Exp. 2013;77:e50546. doi: 10.3791/50546. [DOI] [PMC free article] [PubMed] [Google Scholar]
- 39.Smith CL, et al. Migration phenotype of brain-cancer cells predicts patient outcomes. Cell Reports. 2016;15:2616–2624. doi: 10.1016/j.celrep.2016.05.042. [DOI] [PMC free article] [PubMed] [Google Scholar]
- 40.Wang Y, et al. Ephrin-B2 controls VEGF-induced angiogenesis and lymphangiogenesis. Nature. 2010;465:483–486. doi: 10.1038/nature09002. [DOI] [PubMed] [Google Scholar]
- 41.Poujade M, et al. Collective migration of an epithelial monolayer in response to a model wound. Proc Natl Acad Sci USA. 2007;104:15988–15993. doi: 10.1073/pnas.0705062104. [DOI] [PMC free article] [PubMed] [Google Scholar]
- 42.Holden P, Horton WA. Crude subcellular fractionation of cultured mammalian cell lines. BMC Res Notes. 2009;2:243. doi: 10.1186/1756-0500-2-243. [DOI] [PMC free article] [PubMed] [Google Scholar]


