

Significance
The myelination of axons is essential for neuronal wiring and normal nervous system functions. In the peripheral nervous system, Schwann cells (SCs) form myelin sheaths around axons during nerve development. Such myelination is compromised in a number of diseases. Hence, identification and understanding of the key pathways regulating SC development and myelinogenesis are essential for therapeutic progress. Here we uncover two separate roles of the cellular signaling node mTORC1 (mechanistic target of rapamycin complex 1) for regulating the development of SCs and subsequently the growth of myelin sheaths. Moreover, we demonstrate that defective SCs possess a remarkable plasticity to remyelinate axons via mTORC1. Thus, manipulating mTORC1 activity in diseased SCs could be therapeutically beneficial.
Keywords: myelination, mammalian target of rapamycin, axon, peripheral nerve, neuropathy
Abstract
The myelination of axons in peripheral nerves requires precisely coordinated proliferation and differentiation of Schwann cells (SCs). We found that the activity of the mechanistic target of rapamycin complex 1 (mTORC1), a key signaling hub for the regulation of cellular growth and proliferation, is progressively extinguished as SCs differentiate during nerve development. To study the effects of different levels of sustained mTORC1 hyperactivity in the SC lineage, we disrupted negative regulators of mTORC1, including TSC2 or TSC1, in developing SCs of mutant mice. Surprisingly, the phenotypes ranged from arrested myelination in nerve development to focal hypermyelination in adulthood, depending on the level and timing of mTORC1 hyperactivity. For example, mice lacking TSC2 in developing SCs displayed hyperproliferation of undifferentiated SCs incompatible with normal myelination. However, these defects and myelination could be rescued by pharmacological mTORC1 inhibition. The subsequent reconstitution of SC mTORC1 hyperactivity in adult animals resulted in focal hypermyelination. Together our data suggest a model in which high mTORC1 activity promotes proliferation of immature SCs and antagonizes SC differentiation during nerve development. Down-regulation of mTORC1 activity is required for terminal SC differentiation and subsequent initiation of myelination. In distinction to this developmental role, excessive SC mTORC1 activity stimulates myelin growth, even overgrowth, in adulthood. Thus, our work delineates two distinct functions of mTORC1 in the SC lineage essential for proper nerve development and myelination. Moreover, our studies show that SCs retain their plasticity to myelinate and remodel myelin via mTORC1 throughout life.
The formation of myelin sheaths from expanding glial plasma membranes around axons requires biosynthesis of extraordinary amounts of myelin proteins and lipids. This is critical for the rapid conduction of action potentials. In the peripheral nervous system (PNS), myelin is produced by differentiated Schwann cells (SCs). During postnatal nerve development SC precursors first grow and proliferate, and then mature to promyelinating and fully differentiated SCs competent to myelinate axons (1). Defective myelination is responsible for the morbidity in a number of hereditary and acquired neuropathies, such as Charcot-Marie-Tooth disease and diabetic neuropathy (2, 3). Very little is known about the regenerative properties of SCs in these conditions, and this knowledge is necessary for developing efficient repair strategies for myelin damage.
The mTOR (mechanistic target of rapamycin) pathway lies downstream of growth-factor-stimulated phosphatidylinositol 3′ kinase (PI3K)/AKT signaling, and has recently emerged as crucial regulator of myelination (4, 5). mTOR is a serine/threonine protein kinase and a major signaling hub for the control of cellular growth, proliferation, autophagy, as well as energy and lipid metabolism (6, 7). mTOR dysregulation is implicated in various pathological conditions, including diseases of aging, such as those involving metabolic and cardiovascular conditions, cancer, and neurodegeneration (6–8). Inactivation of the mTOR core kinase in developing SCs suppresses the radial and longitudinal growth of SCs, resulting in hypomyelination (4). The mTOR kinase is found within two distinct multiprotein complexes, mTORC1 and mTORC2, which differ in their regulation, downstream targets, and sensitivity to the allosteric mTOR inhibitor rapamycin (6, 7). Perinatal SC lineage-specific ablation of raptor, an essential component of the mTORC1 complex, causes hypomyelination in mice (5). In contrast, analogous inactivation of rictor, a critical component of the mTORC2 complex, has no apparent effect on nerve development (5). Further support for this positive regulatory role of mTORC1 in myelination comes from studies of mice with SC-specific excision of PTEN (phosphatase and tensin homolog), which manifest focal hypermyelination along with increased PI3K/AKT and mTORC1 signaling (9). A comparable phenotype and increased mTORC1 signaling are also present in mice with expression of constitutively active AKT in SCs (10). Collectively, these data suggest that mTORC1 signaling in developing SCs promotes myelin formation.
Tuberous sclerosis protein 1 (TSC1; or hamartin) and TSC2 (or tuberin) form a complex that negatively regulates mTORC1 signaling (6, 7) (Fig. 1A). TSC2, a GTPase activating protein (GAP), primarily mediates this inhibition through stimulation of the GTPase activity of Rheb, a small G protein that acts as an mTORC1 activator when bound to GTP (7, 11). TSC1 has no GAP function, but stabilizes TSC2 and further increases Rheb GTPase activity (12). Thus, the elimination of TSC1 vs. TSC2 is expected to promote different levels of Rheb-GTP loading and as a consequence different levels of abnormal mTORC1 activation. In fact, genetic deletion of TSC2 in astrocyte glia leads to more pronounced mTORC1 hyperactivity than ablation of TSC1 in vivo (13). Accordingly, patients carrying mutations resulting in TSC2 inactivation tend to have more severe disease manifestations secondary to accentuated mTORC1 hyperactivity compared with individuals with TSC1 inactivation (both leading to the multisystem disorder “Tuberous Sclerosis Complex”) (14).
Fig. 1.

mTORC1 activity decreases in developing SCs. (A) Model for mTORC1 regulation by the TSC1/2 complex via Rheb GTP-loading. The illustration additionally depicts regulation of protein synthesis and cell proliferation by the mTORC1 downstream substrates p70-S6K, S6 ribosomal protein, and the translation inhibitor 4E-BP1. These substrates are phosphorylated (P) at the indicated sites reflecting mTORC1 activation. The activity of AKT is controlled by two phosphorylation sites regulated by mTORC2 and p70-S6K (the latter representing negative feedback inhibition by mTORC1). The activity of mTORC2 is promoted by the TSC1/2 complex. (B) Western blots of sciatic nerve lysates from mice at different postnatal ages, probed with the indicated antibodies, show progressive down-regulation of markers for mTORC1 activity (p70 S6 kinase, ribosomal protein S6, eukaryotic initiation factor 4E-BP1), inversely correlated with the expression of key structural myelin proteins (myelin basic protein: MBP, myelin protein P0, myelin associated glycoprotein: MAG). In contrast, protein levels of TSC2, TSC1, and the mTOR core kinase remain constant during postnatal development, whereas the levels of the glycolysis enzyme GAPDH decrease. (C) Immunofluorescence of longitudinal frozen sciatic nerve sections (confocal z-series projections) from C57BL/6J mice using the indicated markers shows markedly reduced p-S6(Ser240/244) signals in SCs at P28 vs. P3. For better visualization of the staining intensity differences, the left column shows monochrome p-S6(Ser240/244) signals only. Inset in Upper portion depicts p-S6+/S100+ SCs at higher magnification. (Scale bars, 100 µm; Inset, 30 µm.)
In this study we sought to elucidate the role of enhanced mTORC1 signaling in PNS myelination by engineering mutant mice with different levels of sustained mTORC1 hyperactivity in the SC lineage. This hyperactivity opposes the physiological decline in mTORC1 activity that is normally observed in SC development. Surprisingly, strong induction of mTORC1 activity in developing SCs lacking TSC2 resulted in arrested SC differentiation and dramatically reduced myelination. In contrast, mice lacking TSC1 in developing SCs had more moderate increases in mTORC1 activity, leading to only minor nerve developmental defects. However, these mice eventually developed severe focal hypermyelination in adulthood that resembled the abnormalities found in mice with SC-specific ablation of PTEN (9). Remarkably, the nerve developmental abnormalities in TSC2-deficient nerves were reversible by rapamycin administration, even in aged mice in which severe deficits had already developed. The subsequent withdrawal of rapamycin from these animals resulted in focal hypermyelination. These data indicate that down-regulation of mTORC1 activity in the developing SC is required for normal nerve myelination. If mTORC1 activity remains drastically up-regulated during this critical developmental period, then SCs arrest in a promyelinating stage that is prohibitive for myelination. In contrast, milder elevation of mTORC1 activity is permissive for SC maturation and myelination, but sustained mTORC1 elevation in differentiated SCs manifests later in adulthood as focal hypermyelination.
Results
Decrease of mTORC1 Activity in Developing SCs.
To elucidate the role of mTORC1 signaling in SC myelination, we first studied the site-specific phosphorylation of a number of downstream mTORC1 substrates, including p70 S6 kinase, S6 ribosomal protein, and 4E-BP1, during nerve development (Fig. 1). Together, these modifications are known to broadly promote mRNA translation, cell growth, proliferation, and lipid biosynthesis (6, 7, 15). Western blotting and immunofluorescence of mouse sciatic nerves showed decreasing levels of phosphorylation of these substrates in developing SCs from postnatal days 1–28 (P1–P28) (Fig. 1 B and C). These changes were inversely correlated with the expression of several key myelin proteins and the SC marker S100. The moderation of mTORC1 activity in developing SCs correlates well with the decrease in SC protein translation, growth, and proliferation that occurs during nerve development in the first postnatal weeks (16–18).
Deletion of TSC2 in the SC Lineage Results in Dysmyelination.
The decrease in mTORC1 activity accompanying SC differentiation led us to study the effects of sustained mTORC1 activity on SC development and myelination. We first generated mice with deletion of TSC2 in the SC lineage, which should result in robust de-repression of mTORC1 signaling. Floxed TSC2 mice (19) were cross-bred to P0Cre transgenic mice (20) to obtain TSC2fl/fl; P0Cre mice (designated TSC2-SCKO mice). P0Cre transgenic mice express Cre-recombinase in developing SCs starting at around E13.5 (20). Postnatal TSC2-SCKO mice showed a severe neurological phenotype characterized by ataxia, hind-limb paresis, and tremor starting around P14. Western blotting of sciatic nerve lysates from TSC2-SCKO mice revealed progressively decreasing levels of TSC2, and subsequently TSC1 (Figs. 2A and 3A). One-month-old TSC2-SCKO mice displayed significant impairment in the accelerated rotarod test that worsened with age (Fig. 2B). Motor nerve electrophysiology revealed a complete conduction block in 2-mo-old TSC2-SCKO mutants (Fig. 2C). Gross anatomical inspection at P21 showed that sciatic nerves from mutants appeared translucent compared with littermate control nerves, indicative of severe dysmyelination (Fig. 2D).
Fig. 2.

Arrest of myelination in TSC2-SCKO mice. (A) Western blots of sciatic nerve lysates from control and TSC2-SCKO mice (three mice per group), probed with the indicated antibodies, showing decreases in TSC2 and TSC1 from P14 to P28. (B) Accelerated rotarod analysis of 1- and 2-mo-old control and TSC2-SCKO mice. Note significantly reduced rotarod performance of 1-mo-old TSC2-SCKO mice, whereas the mutants were not able to sustain themselves on the rotarod apparatus at 2 mo of age. n = 3–7 mice per genotype at each age. P < 0.05 for each point comparison between control and TSC2-SCKO at one and 2 mo of age. (C) Representative traces of sciatic nerve compound muscle action potentials recorded from a foot muscle after proximal stimulation in 2-mo-old mice showing complete conduction block in TSC2-SCKO mutants. (D) Compared with control sciatic nerves, TSC2-SCKO nerves appear translucent at age P21. (E–H) Light (E and F) and electron microscopy (G and H) of sciatic nerves from control and TSC2-SCKO mice at age P28 reveal dysmyelination in the mutant. (Scale bars, 10 µm in E and F; 2 µm in G and H.) (I) Quantification of myelinated axons in sciatic nerves from control and TSC2-SCKO mice at the indicated postnatal time-points. Note drastic reductions in myelinated fiber numbers in mutant mice. n = 3–6 mice per genotype at each age. (J) Electron microscopy of SC body (*) from TSC2-SCKO mouse at age P28 in association with its amyelinated axon (#). Note large size of mutant SC cytoplasm with accumulations of mitochondria (green arrows depict examples), RER (blue arrows in Inset), and a variety of vesicular particles. Red arrow depicts SC nucleus. (Scale bar, 1 µm.)
Fig. 3.

Abnormalities in key signaling pathways in TSC2-SCKO mutants. (A) Western blots of sciatic nerve lysates from 7-mo-old control and TSC2-SCKO mice (three mice per group), probed with the indicated antibodies, showing marked up-regulation of mTORC1 activity markers, and down-regulation of AKT signaling. (B) Representative immunofluorescence of longitudinal frozen sciatic nerve sections (confocal z-series projections) from control and TSC2-SCKO mice (age P28) showing elevated p-S6 (marker of mTORC1 activity) in S100+ SCs in the mutants. (Scale bars, 30 µm; Insets, 10 µm.) (C) Western blotting analysis of the rate of new protein synthesis in sciatic nerves from 6-wk-old control and TSC2-SCKO mice intraperitoneally injected with the aminoacyl-tRNA analog puromycin. Puromycin incorporation was detected with anti-puromycin antibody, and GAPDH was used as loading control. Note the dramatically increased rate of newly generated proteins with puromycin incorporation in the TSC2-SCKO nerve compared with control samples. (D) Western blots of sciatic nerve lysates from P14 control and TSC2-SCKO mice (three mice per group) probed with the indicated antibodies. Note the decreased levels of the cleaved mature form of SREBP2 and downstream cholesterol-synthesis enzyme HMGCR in the mutant. (E) Analysis of sciatic nerve lipid extracts from 7-mo-old control and TSC2-SCKO mice (n = 3 mice per genotype) showing decreased levels of cholesterol in the mutant samples but no significant changes in the relative levels of triglycerides (TG) and free fatty acids (FFA).
We next used light and electron microscopy to examine structural nerve development. Morphometric analyses of transverse sections of sciatic nerves from TSC2-SCKO mice at various postnatal stages showed a dramatic reduction in nascent myelinated fibers, so that most axons remained unmyelinated (Fig. 2 E–I). Individual large diameter amyelinated axons were typically engaged by one—or sometimes more than one—mutant SC at P21 and P28 (Fig. 2H and Fig. S1A). In parallel, larger axons frequently remained in bundles, with small diameter fibers indicating additional axon sorting defects (Fig. S1 B and C). In such abnormal bundles, extending SC processes often did not properly engulf groups of axons of mixed caliber, so that no glial cytoplasm between individual axons was observed (Fig. S1B), or axons appeared partially “naked” (Fig. S1C). Incomplete engulfment was also noted for large caliber axons at P28 (Fig. S1D). Importantly, TSC2-deficient SC cytoplasm appeared enlarged and was filled with accumulations of widened rough endoplasmic reticulum (RER), normal and abnormal appearing mitochondria, and a variety of vesicular or electron-dense particles, including material resembling myelin fragments (Fig. 2J and Fig. S1 D–F). Overall, these data show that TSC2 deletion in the SC lineage causes several defects in nerve development and myelination.
Fig. S1.

Ultrastructural abnormalities during TSC2-SCKO nerve development. Electron microscopy of transverse sciatic nerve sections from TSC2-SCKO mice at P28 (A, C, and D) and P21 (B, E, and F). (A) Note abnormal association of large-caliber amyelinated axon (red arrow) with inflated SC bodies (green arrows). (B and C) Ultrastructure of abnormal small-caliber axon bundles. Note lack of SC cytoplasm between individual axons (B), incomplete engulfment of axons (C, red arrow), presence of larger caliber axons (C, blue arrow), as well as abnormally dilated SC RER (C, green arrow). (D) Incomplete engulfment of large caliber axon with partially exposed axon area (arrow). (E and F) Presence of spirally enwrapped or electron dense membranous structures reminiscent of myelin fragments (red arrows) in the cytoplasm of mutant SCs. (Scale bars: 500 nm in B, C, E, and F; 2 µm in A and D).
TSC2-SCKO Nerves Show Multiple mTOR-Dependent Signaling Abnormalities.
We next studied the molecular consequences of TSC2 loss in the SC lineage on mTOR signaling, and whether other interconnected pathways implicated in myelination are dysregulated. As expected, Western blotting of sciatic nerves from adult TSC2-SCKO mice demonstrated greatly increased phosphorylation of key mTORC1 effectors, indicating constitutive mTORC1 activation (Fig. 3A). These changes occurred in parallel to a marked decrease in total p70 S6K levels and an increase in total 4E-BP1 levels, presumably secondary to adaptation to the sustained mTORC1 hyperactivity (Fig. 3A). Less accentuated alterations of these signaling components were noted in perinatal nerves (Fig. S2 A and B). Immunolabeling on longitudinal sciatic nerve sections showed markedly increased numbers of p-S6+/S100+ cell bodies, confirming that the mTORC1 induction occurs in the SC lineage (Fig. 3B). The role of these mTORC1 substrates as key regulators of protein translation, along with swollen RER and copious amounts of ribosomes in TSC2-deficient glia, encouraged us to assess protein translation. Using in vivo surface sensing of translation (SUnSET) (21), we found dramatically increased puromycin incorporation into newly synthesized peptides in TSC2-SCKO nerves (Fig. 3C); this was associated with increases in the cap-binding subunit eIF4E of the eIF4F complex that mediates translation initiation, as well as the eIF2α subunit of the ternary complex of the protein synthesis machinery in TSC2-SCKO nerves (Fig. S2C).
Fig. S2.

Signaling abnormalities in TSC2-SCKO mutants. (A and B) Western blots of sciatic nerve lysates from control and TSC2-SCKO mice at P28 (A, three mice per genotype) and P3 (B, pooled samples using four to six mice per genotype) probed with the indicated antibodies demonstrating increased phosphorylation of mTORC1 effectors p70 S6K, S6rp, and 4E-BP1 at P28, but less-accentuated increases of these markers at P3. (C) Western blots of sciatic nerve lysates from control and TSC2-SCKO mice (three mice per group) at age P28 probed with the indicated antibodies showing increased levels of eIF4E and eIF2α in the mutant, consistent with elevated protein synthesis machinery. (D) Western blots of sciatic nerve lysates from control and TSC2-SCKO mice at P28 (three mice per genotype) probed with the indicated antibodies showing decreased phosphorylation of AKT by PDK1 and mTORC2 in the mutant. (E) Western blots of sciatic nerve lysates from 7-mo-old control and TSC2-SCKO mice (three mice per genotype) showing decreased AKT-dependent phosphorylation of the mTOR core kinase in the mutant. (F) Western blots of sciatic nerve lysates from 7-mo-old control and TSC2-SCKO mice (three mice per genotype) showing no substantial differences in Erk1/2 phosphorylation. (G) Western blots of sciatic nerve lysates from control and TSC2-SCKO mice (three mice per group) at age P14 probed with the indicated antibodies showing no differences in the protein levels the precursor and cleaved mature form of SREBP1. Note slight decrease in the levels of the downstream enzyme fatty acid synthase (FASN) in the mutant.
Furthermore, we found dramatic losses of total and phosphorylated AKT (phosphorylated at Thr308 by PDK1), consistent with the model that chronic and excessive mTORC1/p70-S6K activity inhibits PI3K/AKT signaling (22, 23) (Figs. 1A and 3A, and Fig. S2D). We also observed decreases in p-AKT(Ser473) (phosphorylated by mTORC2), consistent with the fact that TSC disruption leads to abolished mTORC2 activity (6, 24) (Figs. 1A and 3A, and Fig. S2D). In agreement with reduced AKT activity, the AKT-dependent phosphorylation of the mTOR core kinase was also diminished (Fig. S2E). Finally, we did not detect any substantial alterations in the levels of total or p-ERK1/2 (Thr202/Tyr204) in TSC2-SCKO nerves even though mTORC1/p70-S6K signaling often negatively regulates this MAPK pathway (15) (Fig. S2F).
The formation of myelin requires synthesis of large quantities of lipids, especially cholesterol (25). In SCs, this function is largely regulated by mTORC1 via the transcription factors sterol regulatory element-binding proteins 1 and 2 (SREBP1 and SREBP2) (5). Surprisingly, despite the well-documented activation of SREBPs by mTORC1 (26, 27), we found that active (cleaved) SREBP2, which predominantly regulates cholesterol synthesis, was decreased in TSC2-SCKO nerves (Fig. 3D). In agreement, expression of the rate-limiting cholesterol synthesis enzyme 3-hydroxy-3-methylgluraryl-CoA reductase (HMGCR), which is regulated by SREBP2, was also decreased (Fig. 3D). In contrast, levels of SREBP1 and its downstream target FASN, which regulates fatty acid and triglyceride synthesis, were much less affected by TSC2-deficiency (Fig. S2G). Consistent with these data on SREBP proteins, TSC2-SCKO nerves contained low amounts of cholesterol, but normal levels of triglycerides and fatty acids (Fig. 3E).
Together, these results demonstrate that abnormal SC lineage function in TSC2-SCKO mice is associated with uncontrolled mTORC1 activity resulting in dramatically increased rates of protein synthesis, whereas PI3K/AKT signaling and cholesterol biosynthesis are reduced.
Loss of Cell Cycle Control in TSC2-Deficient SC Precursors.
At early stages of nerve development, SC precursors proliferate vigorously to generate adequate cell numbers for correct association with axons (1, 18). Later, a precisely controlled exit of immature SCs from the cell cycle is required for their subsequent differentiation and myelination of axons (1, 28). To determine whether deficits in cell cycle exit accompany the block of myelination in TSC2-SCKO mutant nerves, we first quantified glial nuclei during nerve development (Fig. 4A). We found progressively increasing glial hyperplasia in TSC2-SCKO nerves that reached a maximum of ∼fourfold by P14. Additionally, immunolabeled teased fiber preparations showed that individual axon segments from TSC2-SCKO nerves at P28 were associated with ∼10-fold increased numbers of SOX10+ glia (Fig. 4B). We also found increased numbers of Ki67+ and phospho-Histone H3+ glia in P21 TSC2-SCKO nerves (Fig. 4C), indicating elevated cell cycling and mitotic events. Concurrent induction of glial apoptosis is also present in TSC2-SCKO nerves, as noted by the increase in cleaved-caspase 3+ glia (Fig. 4C), demonstrating that the excessive proliferation is somewhat antagonized by increased cell death.
Fig. 4.

Proliferative defects in TSC2-SCKO nerves. (A) Quantification of glial nuclei in sciatic nerve semithin cross-sections from control and TSC2-SCKO mice at the indicated postnatal ages reveals progressively increasing numbers of developing SCs in the mutant nerves. n = 3 mice per genotype at each age. (B, Left) Fluorescence microscopy analysis of immunostained teased fiber preparations from tibial nerves of P28 control and TSC2-SCKO mice using the indicated markers. Note increased numbers of SOX10+ SCs (arrows) associated with axon segments in TSC2-SCKO nerves compared with control. (Scale bars, 10 µm.) (Right) Quantification of SOX10+ SCs along TUJ1+ axons (n = 3 mice per genotype). (C) Quantitative immunofluorescence of longitudinal sciatic nerve sections (confocal z-series projections) from control and TSC2-SCKO mice at ages P14 (c-Casp3) and P21 (Ki67, p-H3) to demonstrate increased cell cycling (Top; arrows depict Ki67+ cells) and mitotic events (Middle; arrows depict p-H3+ cells), and induction of SC apoptosis (Bottom; arrows depcit c-Casp3+ cells) in the mutant (n = 3 mice per genotype at each age). (Scale bars, 50 µm.) (D, Upper) Schematic illustrating cyclin expression during cell cycle, and checkpoint control by the restriction (R) point. (Lower) Western blots of sciatic nerve lysates from control and TSC2-SCKO mice at age P7 (three mice per group), probed with the indicated antibodies, demonstrating that TSC2-deficient SCs bear elevated levels of cyclin B1 (marker for M-phase) and D1 (marker for G1/S-phase). (E) Western blots of sciatic nerve lysates from control and TSC2-SCKO mice at age P7 (three mice per group) probed with the indicated antibodies, demonstrating hyperphosphorylation and thus inactivation of Rb in the mutant allowing uncontrolled passage through the G1 restriction (R) point of the cell cycle.
Further evidence for abnormal regulation of cell division came from Western blotting of P7 nerve lysates with cell cycle stage markers, showing elevated levels of cyclin B1 (M-phase) and cyclin D1 (G1/S-phase) in TSC2-SCKO preparations (Fig. 4D). To explore the underlying molecular mechanisms, we considered that mTORC1 and TSC2 can independently regulate the abundance of cyclin-dependent kinase (CDK) inhibitor p27Kip1 (29–32). We found decreased p27Kip1 protein levels and, as a result, markedly elevated CDK2 levels (33) in TSC2-SCKO nerves (Fig. 4E). These changes were associated with dramatically increased CDK-dependent phosphorylation of the retinoblastoma tumor suppressor protein Rb at Ser807/811 (Fig. 4E), indicating inactivation of Rb and thus largely uncontrolled passage through the G1 restriction (R) point of the cell cycle (33). Together, these findings provide a molecular underpinning for the aberrant, prolonged glial proliferative phase in TSC2-SCKO mice.
TSC2-Deficient SC Glia Are Developmentally Arrested at the Promyelination Stage.
The defective cell cycle exit in TSC2-deficient glia argues that impairment in SC differentiation is responsible for the dysmyelination. To investigate where SC differentiation is stalled in TSC2-SCKO mice, we examined expression of SC differentiation markers at several postnatal time points using immunofluorescence. Consistent with the glial hyperproliferation, S100 and SOX10 immunoreactivities in TSC-SCKO nerves at P7 were increased (Fig. S3). Although SOX10 immunoreactivity declined from P7 to 21 in control nerves, most TSC2-deficient SC glia continued to express abundant SOX10 at P21, suggesting delayed SC maturation (Fig. S3B). In fact, we found strongly increased expression of OCT6, SOX2, and JUN (Fig. 5 A and B), transcription factors whose persistent expression negatively regulates the transition from promyelinating to myelinating SCs (1). In contrast, the expression of Egr2, an important regulator of myelination (1), was drastically decreased in P21 TSC2-SCKO nerves (Fig. 5A). Consistent with the role of Egr2 in regulating myelin genes, we found a near absence of key myelin proteins in TSC2-SCKO nerve lysates (Fig. 5C). Thus, the timely developmental down-regulation of negative regulators of myelination fails to occur in SCs lacking TSC2, resulting in their accumulation at the promyelinating stage.
Fig. S3.

Abnormal expression of S100 and SOX10 in TSC2-ablated SCs. (A) Confocal immunofluorescence (z-series projections) of longitudinal frozen sciatic nerve sections from control and TSC2-SCKO mice at age P7 demonstrating increased S100 immunoreactivity in the mutant sample. (Scale bars, 25 µm.) (B) Quantitative immunofluorescence analysis of longitudinal frozen sciatic nerve sections (confocal z-series projections) from control and TSC2-SCKO mice at the indicated ages demonstrating significantly increased proportions of SOX10+ SCs in the mutant (n = 3 mice per genotype). (Scale bars, 25 µm.)
Fig. 5.
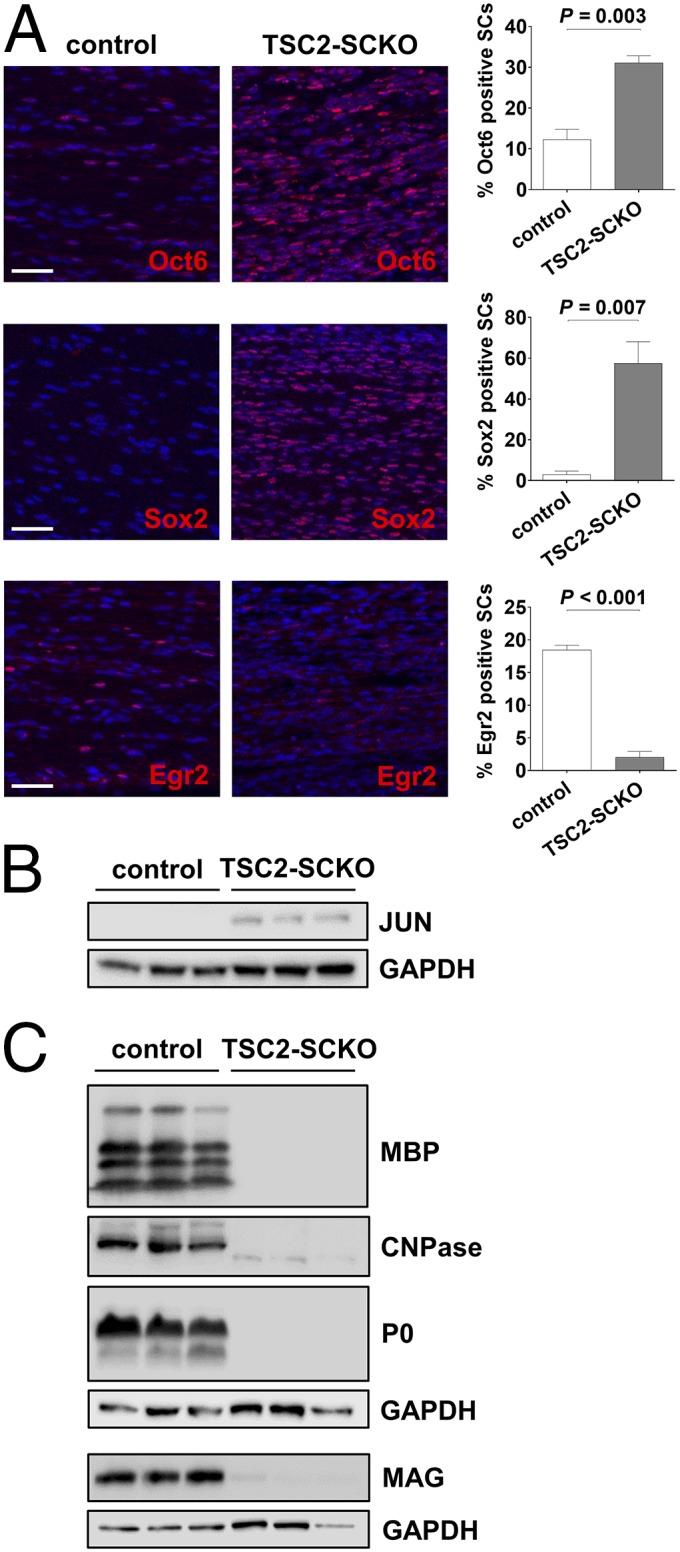
Defective terminal differentiation of TSC2-deficient SC glia. (A) Quantitative immunofluorescence analysis of longitudinal sciatic nerve sections (confocal z-series projections) from P21 control and TSC2-SCKO mice demonstrating significantly increased numbers of OCT6+ and SOX2+ SCs, and dramatically decreased numbers of EGR2+ SCs in the mutant (n = 3 mice per genotype). (Scale bars, 50 µm.) (B) Western blots of sciatic nerve lysates from control and TSC2-SCKO mice at age P21 (three mice per group) probed with the indicated antibodies demonstrating elevated levels of JUN in the mutant. (C) Western blot analysis of sciatic nerve lysates from 7-mo-old control and TSC2-SCKO mice (three mice per group) probed with the indicated antibodies indicating near absence of structural myelin proteins (MBP, CNPase, P0, MAG) in mutant nerves.
Dysmyelination in TSC2-SCKO Mice Is Reversible upon Rapamycin Treatment.
Constitutive activation of mTORC1 is the primary molecular defect caused by loss of TSC2 in the SC lineage. We therefore sought to test whether defective nerve development in TSC2-SCKO mice could be rescued by suppressing mTORC1 activity via rapamycin treatment. Strikingly, 3 d of rapamycin treatment in 1-mo-old TSC2-SCKO mutants was sufficient to restore rotarod sensorimotor performance to control levels (Fig. 6A). Morphological analysis of sciatic nerves revealed that myelination was induced by this treatment, with a significant increase in the number of myelinated fibers (Fig. S4 A–C). Nerve morphology further improved after 10 d of rapamycin administration (Fig. 6 B–G and Fig. S4 D and E). The dramatic improvements in myelination, as well as in Remak bundle formation, were associated with reduced accumulation of cytoplasmic organelles and vesicles in SCs.
Fig. 6.

Dysmyelination in TSC2-SCKO mice is reversed by rapamycin treatment. (A) Accelerated rotarod analysis in control and TSC2-SCKO mice after 3 d of rapamycin or vehicle treatment (daily intraperitoneal administration starting at 1 mo of age). Note the significantly improved sensorimotor rotarod performance of rapamycin-treated TSC2-SCKO mice compared with vehicle-treated TSC2-SCKO mutants (P < 0.05 for all trials; n = 3–4 mice per group). Rapamycin treatment had no impact on rotarod performance of control mice. (B–G) Electron microscopy of transverse sections of sciatic nerves from TSC2-SCKO mice treated with vehicle (B, D, and F) or rapamycin (C, E, and G) for 10 d (daily intraperitoneal administration starting at 1 mo of age). Note drastic increase in the number of myelinated fibers in the rapamycin-treated mouse (C, E, and G), reduced SC hypertrophy (E and G), and rescue of Remak bundle structure (G). (Scale bars, 2 µm in B and C; 1 µm in D–G). (H) Western blot analysis of sciatic nerve lysates from 7-mo-old control and untreated or rapamycin-treated TSC2-SCKO mice (4-wk-long daily intraperitoneal rapamycin treatment regimen) probed with the indicated antibodies (lysates from three mice per group shown). Note normalization of p-S6rp and p-4E-BP1 signals in TSC2-SCKO nerves after rapamycin treatment. Note recovery of AKT signaling and reexpression of structural myelin proteins MBP, P0, and CNPase following rapamycin administration. (I and J) Representative semithin light microscopy of sciatic nerve transverse sections from 7-mo-old untreated and rapamycin-treated TSC2-SCKO mice. Note improved myelination in TSC2-SCKO nerve after 4-wk-long daily intraperitoneal rapamycin treatment regime. (Scale bars, 10 µm.) (K and L) Quantification of SC nuclei (K) and myelinated axons (L) in sciatic nerve semithin cross-sections from 7-mo-old control and untreated or rapamycin-treated (4 wk) TSC2-SCKO mice. Note reduction of SC numbers and increase in myelinated axons to near control levels in TSC2-SCKO nerves after rapamycin treatment. n = 3–4 mice per group.
Fig. S4.

Effects of rapamycin treatment in TSC2-SCKO mice. (A, B, D, and E) Semithin light microscopy of transverse sections of sciatic nerves from TSC2-SCKO mice that were treated with vehicle or rapamycin for 3 d (A and B) or 10 d (D and E) with treatment starting at 1 mo of age. Note increase in the number of thinly myelinated fibers in the rapamycin-treated mutants. (Scale bars, 30 µm.) (C) Quantification of myelinated axons in sciatic nerve semithin cross-sections from control and TSC2-SCKO mice treated with vehicle or rapamycin for 3 d with treatment starting at 1 mo of age. Note increase in the number of thinly myelinated axons in TSC2-SCKO nerves after short rapamycin treatment. n = 4 mice per group. (F, Left) Scatter plot showing sciatic nerve g-ratios of individual myelinated fibers as a function of axon diameter. Note increased g-ratios especially in large caliber axons in rapamycin-treated mutants compared with control mice. (Right) Cumulative g-ratio analysis of sciatic nerves from 7-mo-old control and rapamycin-treated TSC2-SCKO mice shows overall hypomyelination (increased cumulative g-ratio) in the mutant. n = 3 mice per group. (G and H) Representative electron microscopy of sciatic nerve transverse section from 7-mo-old TSC2-SCKO mouse after 4 wk of daily rapamycin treatment. Note formation of thin myelin sheaths on most large caliber axons (G), and grossly normal Remak bundle structure (H). (Scale bars, 1 µm.)
We next asked whether the pathological changes in TSC2-SCKO nerves could be similarly corrected in aged mice in which the axons have been dysmyelinated/nonmyelinated for many months. A 4-wk-long daily rapamycin treatment regimen in 6-mo-old TSC2-SCKO mutants resulted in full restoration of nerve mTORC1 signaling that was indistinguishable from control (Fig. 6H). Moreover, AKT signaling was markedly restored although still slightly decreased (Fig. 6H). The treatment dramatically ameliorated the hind-limb paresis, ataxia, and tremor in aged TSC2-SCKO mutants (Movies S1 and S2). Rapamycin also reduced glial numbers in sciatic nerves to near control levels, restored to normal the number of myelinated fibers (although axons remained clearly hypomyelinated), and largely restored normal Remak bundle structure (Fig. 6 I–L and Fig. S4 F–H). From these data, we conclude that constitutive mTORC1 activation in the SC lineage mediates most of the adverse nerve development effects in TSC2-SCKO mice. Moreover, the dramatic recovery after rapamycin treatment indicates that a regenerative program in myelination-incompetent SCs can be reactivated even after extended periods of inactivity.
Moderate mTORC1 Induction in Developing SCs Leads to Focal Hypermyelination.
The unanticipated phenotype of TSC2-SCKO mice prompted us to study nerve development in conditional mouse models with more moderate increases in mTORC1 signaling. Analogous to TSC2-SCKO mice we generated TSC1-SCKO (TSC1fl/fl;P0Cre) mice by crossing floxed TSC1 mice (34) to P0Cre transgenic mice. In contrast to TSC2-SCKO animals, postnatal TSC1-SCKO mice showed no gross neurological impairments. Western blotting of sciatic nerve lysates from P28 TSC1-SCKO mice demonstrated a less-robust elevation in mTORC1 activity compared with TSC2-SCKO nerves (Fig. 7A and Fig. S5A). AKT signaling was also less decreased in TSC1-SCKO nerves (Fig. 7A and Fig. S5A). Together, these data indicate that loss of TSC1 in developing SCs causes a smaller increase in mTORC1 activity than that observed in the TSC2-deficient model, offering us an opportunity to study dosage-dependent effects of increased mTORC1 activity.
Fig. 7.

Delayed initiation of myelination followed by focal hypermyelination in TSC1-SCKO nerves. (A) Western blot analysis of sciatic nerve lysates from TSC1-SCKO and TSC2-SCKO mutants and respective control mice at age P28 (three mice per genotype) probed with indicated antibodies. Note less-induced mTORC1 and less-repressed AKT signaling in TSC1-SCKO samples. (B–E) Representative light (B and C) and electron microscopy (D and E) of sciatic nerves from control and TSC1-SCKO mice at P28 (B and C) and P21 (D and E) showing minor hypomyelination in the mutant. (Scale bars, 10 µm in B and C; 2 µm in D and E). (F and G) Quantification of myelinated axons (F) and glial nuclei (G) in sciatic nerve semithin cross-sections from control and TSC1-SCKO mice at the indicated ages. Note statistically significant reductions of myelinated axon numbers in TSC1-SCKO nerves at P7-21, but not at P28 and P42 (F: *P < 0.001; **P = 0.035; ***P = 0.004; #P = 0.116; ##P = 0.070). The number of glial nuclei in TSC1-SCKO nerves is significantly increased at each tested age (G: *P = 0.002; **P = 0.003; ***P = 0.006; ****P = 0.002; *****P = 0.005). n = 3 mice per genotype at each age. (H–J) Electron microscopy of sciatic nerve transverse sections from 5-mo-old control (H) and TSC1-SCKO mice (I and J) showing hypermyelination in the form of redundant myelin and tomacula-like structures (red arrows) in the mutant. (Scale bars, 2 µm.) (K) Quantification of axons showing focal hypermyelination features (comma shaped outfoldings, recurrent myelin loops, tomacula) using transverse sciatic nerve sections from TSC1-SCKO mice at the indicated ages. n = 3 mice per age group.
Fig. S5.

Further analysis of TSC1-SCKO mice. (A) Densitometric quantification of Western blotting from Fig. 7A. Note less-induced mTORC1 and less repressed AKT signaling in TSC1-SCKO mice compared with TSC2-SCKO mutants. (B–D) Electron microscopy of sciatic nerve transverse sections from TSC1-SCKO mouse at P21 showing inflation of SC bodies with accumulation of diverse organelles and particles including RER, mitochondria, and material resembling compact myelin in the cytoplasm (B, arrow), amyelinated axon (C, arrow), and abnormal Remak bundle with mislocalization of larger axons (D, arrows). (Scale bars, 2 µm.) (E–H) Ultrastructural appearance of redundant myelination in transverse sciatic nerve sections from 5-mo-old TSC1-SCKO mice. Hypermyelination appears as comma-shaped outfoldings of different extent (E and F, arrows), recurrent myelin loops (G, red arrow), and hypermyelination of small diameter axons (H, red arrow). Note inflated SC cytoplasm with accumulation of mitochondria and other subcellular material (G and H, green arrows). (Scale bars, 2 µm.) (I and J) Scatter plots and cumulative g-ratio analysis with the former showing sciatic nerve g-ratios of individual myelinated fibers as a function of axon diameter in control and TSC1-SCKO mice at the indicated ages. Note convergence of g-ratio trend lines in the scatter plots as mice become older. Accordingly, there is overall hypomyelination with significantly increased cumulative g-ratios in the mutant at P21 (I), but no significant difference between control and mutant at 3 mo of age (J). n = 3 mice per genotype and age.
Consistent with the absence of gross neurological deficits, TSC1-SCKO mutants showed only mild hypomyelination, with a significant reduction in myelinated fibers early postnatally, but not at later ages in adult animals (Fig. 7 B–F). SC glia numbers in TSC1-SCKO sciatic nerves were increased at all ages, albeit to a lesser extent than in nerves from TSC2-SCKO mice (Fig. 7G). Ultrastructural analysis revealed accumulation of diverse organelles and particles, including RER and mitochondria in the glial cytoplasm, but it was less pronounced than in TSC2-SCKO mutants (Fig. S5B). Myelin wrapping and Remak bundle formation in TSC1-SCKO mice nerves were less impaired than in TSC2-SCKO mutants (Fig. S5 C and D). Unlike TSC2-SCKO mice, adult TSC1-SCKO mice developed progressive focal myelin sheath thickening and redundant myelin in the form of outfoldings, recurrent myelin loops, tomacula-like structures, and hypermyelination of small-caliber axons (Fig. 7 H–J and and Fig. S5 E–H). The aberrant myelin overgrowth progressed with age (Fig. 7K) and often resulted in substantial deformation and constriction of axons. The growth of myelin resulted in convergence of g-ratios in TSC1-SCKO and control sciatic nerves with age (Fig. S5 I and J). Thus, the increase in mTORC1 activity in TSC1-SCKO nerves eventually induces features of enhanced myelin production that lead to aberrant myelin structures.
Similar aberrant myelin growth has been recently observed in adult mutant mice lacking PTEN in SCs, but the effects of PTEN ablation in the SC lineage on early nerve development are unknown (9). PTEN deletion leads to inhibition of TSC2 via increased PI3K/AKT signaling, and consequently mTORC1 induction (35). We postulated that the increase in mTORC1 signaling after inactivation of PTEN in developing SCs would cause a phenotype similar to that observed in TSC1-SCKO mice, with initial delays in myelination followed by aberrant myelin ensheathment in adulthood. To test this hypothesis, we generated mice with inactivation of PTEN in the SC lineage using the P0Cre recombinase driver (PTENfl/fl ;P0Cre, designated PTEN-SCKO). We observed increased phosphorylation of mTORC1 substrates in sciatic nerves at P28, but the increase was much milder than in TSC1-SCKO nerves (Fig. 8A and Fig. S6A). Morphological analysis showed a robust delay in initiation of myelination at P7–P14 accompanied by increased glial numbers in the PTEN-SCKO mice (Fig. 8 B–D). Moreover, we observed inflated SC glia bodies with organelle accumulations and Remak bundle defects (Fig. S6 B and C), features similar to that observed in TSC1-SCKO nerves. At later postnatal times, there was a normalization of SC numbers that was associated with restored myelination (Fig. 8 C and D), and gradual development of a tomaculous neuropathy (Fig. S6 D and E).
Fig. 8.

Delayed initiation of myelination in PTEN-SCKO mice and induction of focal hypermyelination in TSC2-SCKO nerves. (A) Western blot analysis of sciatic nerve lysates from TSC1-SCKO and PTEN-SCKO mutants and the respective control mice at age P28 (three mice per genotype) probed with the indicated antibodies. Note reduced phosphorylation of S6rp and 4E-BP1 in PTEN-SCKO compared with TSC1-SCKO samples. In contrast to TSC1-SCKO nerves, AKT signaling is drastically elevated in PTEN-SCKO nerves as reflected by increased site-specific phosphorylation of AKT. (B) Representative light (Upper) and electron microscopy (Lower) of transverse sciatic nerve sections from control and PTEN-SCKO mice at age P7. Note markedly reduced numbers of myelinated axons in the PTEN-SCKO nerve. [Scale bars: 10 µm (light microscopy) and 2 µm (electron microscopy).] (C and D) Quantification of myelinated axons (C) and glial nuclei (D) in sciatic nerve semithin cross-sections from control and PTEN-SCKO mice at the indicated ages. Note statistically significant reductions of myelinated axon numbers in PTEN-SCKO nerves at P7 and P14, but not at P21 and P28, indicating delayed initiation of myelination (C: *P < 0.001; **P = 0.027; #P = 0.270; ##P = 0.227). The number of glial nuclei in PTEN-SCKO nerves is significantly increased at each investigated age (D: *P = 0.001; **P < 0.001; ***P < 0.001; ****P = 0.021). n = 3–5 mice per genotype at each age. (E) Treatment scheme used to dose 3-mo-old TSC2-SCKO mice with rapamycin. Treatment was initiated at 3 mo and continued for 4 wk. Rapamycin treatment was then discontinued and the mice were killed 8 wk later (at 6 mo of age). (F) Western blot analysis of sciatic nerve lysates from TSC2-SCKO and control mice prepared immediately after rapamycin treatment or 2 mo after rapamycin withdrawal (lysates from three mice per group shown). Note constitutive activation of mTORC1 as assessed by downstream substrate phosphorylation in TSC2-SCKO nerves after withdrawal of rapamycin. (G–J) Semithin light microscopy of transverse sciatic nerve sections from TSC2-SCKO mice before rapamycin treatment (G; at 3 mo of age), directly after rapamycin treatment (H; at 4 mo of age), and 2 mo after rapamycin withdrawal (I; at 6 mo of age). (J) Control nerve 2 mo after rapamycin withdrawal. Note dramatically improved myelination status and nerve integrity in TSC2-SCKO nerve following rapamycin withdrawal, and parallel occurrence of focal hypermyelination (example depicted by arrow). (Scale bars, 10 µm.) (K–M) Ultrastructural appearance of focal hypermyelination in transverse sciatic nerve sections from 6-mo-old TSC2-SCKO mice, 2 mo after rapamycin withdrawal. The depicted examples of focal hypermyelination include myelin outfoldings of different extend (K and L, arrows) and recurrent myelin loops (M, arrow). (Scale bars, 1 µm.)
Fig. S6.

Further analysis of PTEN-SCKO mice. (A) Densitometric quantification of Western blotting from Fig. 8A. Note less-induced mTORC1 and strongly stimulated AKT signaling in PTEN-SCKO mice compared with TSC1-SCKO mutants. (B and C) Representative electron microscopy of sciatic nerve transverse sections from PTEN-SCKO mouse at age P28 showing inflation of SC bodies with accumulation of RER, mitochondria, and electron dense vesicles (B), and abnormal Remak bundles with hypertrophic SC cytoplasm (C, arrow). (Scale bars, 1 µm.) (D and E) Representative electron microscopy of transverse sciatic nerve sections from control and PTEN-SCKO mice at age P28. Note occurrence of focally hypermyelinated axon (arrow) among grossly normal appearing myelinated fibers. (Scale bars, 2 µm.)
Collectively, these data show that greatly sustained mTORC1 activity in the SC lineage of TSC2-SCKO mice leads to detrimental hyperproliferation that prohibits SC maturation from proceeding past the promyelinating stage. Less accentuated increases in mTORC1 activity (such as in TSC1-SCKO and PTEN-SCKO mice) allow SC precursors to progress to a myelinating fate although myelination is delayed. Distinct from these developmental effects, our data indicate that increased mTORC1 activity in differentiated SCs from adult nerves results in exuberant myelin growth.
Myelin Growth After Rapamycin Withdrawal in TSC2-SCKO Mice.
To further probe the distinct role of mTORC1 in already myelinated nerves, we next asked whether hypermyelination could be provoked in TSC2-SCKO nerves. Three-month-old TSC2-SCKO mice were treated for 4 wk with rapamycin to initiate the formation of thin myelin sheaths (Fig. 8 E, G, and H). The treatment was then discontinued for 8 wk to allow reconstitution of mTORC1 hyperactivity in SCs that started myelination (Fig. 8 E and F). Remarkably, sensorimotor rotarod performance improved after withdrawal of rapamycin treatment (Fig. S7A), consistent with progressively improving myelination secondary to mTORC1 induction. Indeed, the myelination status and nerve integrity in rapamycin-withdrawn TSC2-SCKO and control mice were similar at the experimental endpoint (Fig. 8 I and J and Fig. S7B). This finding contrasts with the hypomyelination of TSC2-SCKO nerves before rapamycin withdrawal (Fig. 8H), and indicates that rapamycin withdrawal indeed results in marked stimulation of myelin growth. Indeed, this exuberant myelin growth in TSC2-SCKO nerves resulted in the formation of myelin outfoldings, recurrent loops, focal myelin thickening, and hypermyelination of small caliber axons (Fig. 8 K–M and Fig. S7 C–I), features remarkably similar to those in TSC1-SCKO nerves. These results strongly support an important role for mTORC1 activity in stimulating myelin growth after the onset of myelination in differentiated SCs. This function is distinct from the role of mTORC1 in developing SCs, where it regulates their proliferation.
Fig. S7.

Further analysis of TSC2-SCKO mice following withdrawal of rapamycin treatment. (A) Accelerated rotarod analysis of control and TSC2-SCKO mice before and after rapamycin withdrawal at the indicated ages. Note significantly improved sensorimotor rotarod performance, indistinguishable from control mice, already 1 mo following rapamycin withdrawal (*P = 0.039; **P = 0.018; ***P = 0.013; #P = 0.092; ##P = 0.051). n = 3 mice per group. (B, Left) Scatter plot showing sciatic nerve g-ratios of individual myelinated fibers as a function of axon diameter. (Right) Corresponding cumulative g-ratio analysis of sciatic nerves from 6-mo-old control and TSC2-SCKO mice 2 mo after rapamycin withdrawal shows no significant difference between control and mutant preparations. n = 3 mice per genotype. (C–F) Representative electron microscopy of transverse sciatic nerve sections from 6-mo-old control and TSC2-SCKO mice, 2 mo following withdrawal of rapamycin treatment. Focal hypermyelination in form of comma-shaped outfoldings (E, red arrow) and recurrent myelin loops (E, green arrow) is depicted in the mutant. Myelinated axons show hypertrophy of the SC body (F, blue arrow) compared with the control preparation. (Scale bars, 2 µm.) (G–I) Focal hypermyelination in transverse sciatic nerve sections from 6-mo-old TSC2-SCKO mice, 2 mo after withdrawal of rapamycin treatment. (G) Depiction of hypermyelination of small caliber axon. Note compression of axonal profiles (G and H, arrows), which can lead to Wallerian-like axon degeneration (I, arrow). (Scale bars, 1 µm.)
Discussion
This study shows that the induction of mTORC1 hyperactivity in the SC lineage, depending on intensity and timing, can have surprisingly different outcomes for PNS myelination. mTORC1 is rapidly down-regulated in wild-type SCs as nerve development proceeds. Aberrant mTORC1 hyperactivity during nerve development secondary to TSC2 inactivation causes dysmyelination by overriding the physiological transition from SC proliferation to maturation and myelination. Throughout nerve development and during adulthood, TSC2-deficient SCs remain in a hypertrophic and hyperproliferative state with excessive protein translation. Such immature SCs are incapable of activating the transcriptional network required for myelination. In contrast, induction of less-intense mTORC1 hyperactivity during nerve development after deletion of TSC1 is permissive for terminal SC differentiation. However, this is associated with transient SC maturation delays leading to the retarded initiation of myelination. This is similar to the phenotype resulting from perinatal deletion of PTEN in the SC lineage. In adulthood, however, sustained mTORC1 hyperactivity in differentiated SCs of both TSC1 and PTEN mutants causes focal hypermyelination, consistent with the previously proposed promyelinating role of mTORC1 (5, 9). Intriguingly, a comparable hypermyelination effect is observed in adult TSC2-SCKO mice in which myelination has been initialized with rapamycin administration, and is then discontinued to induce mTORC1 hyperactivity in adulthood.
Based on the current knowledge of mTORC1 signaling (6, 7, 12) and the cellular and molecular changes found here, we thus propose a model in which gradually down-regulated mTORC1 activity in developing SCs is required for cessation of proliferation, concomitant differentiation, and the subsequent onset of myelination. It is plausible that perturbation of such a program through sustained mTORC1 hyperactivity has profound effects on SC development and myelination. In contrast, progressive depletion of mTORC1 activity in developing raptor-deficient SCs, in principle similar to the physiological decline of mTORC1 in wild-type nerves, does not impair SC differentiation (5). Rather, in such mice myelin ensheathment following SC differentiation is attenuated as a consequence of mTORC1 extinction. The mechanisms of how mTORC1 and its substrates may regulate the degree of myelin ensheathment and focal growth in differentiated SCs are unknown, and require future investigation. Collectively, our study, together with previous data, provide a broader insight into the pivotal role of mTORC1 signaling for proliferation, differentiation, and subsequent myelination of the SC lineage. Our findings raise a number of new questions about the upstream regulators and downstream effectors important for the distinct functions of mTORC1 in SCs and their precursors.
The rescue of myelination by rapamycin treatment of TSC2-SCKO mice demonstrates that the myelination failure is primarily a result of overstimulated mTORC1. However, it is possible that decreases in mTORC2 and PI3K/AKT signaling, resulting from TSC1/2 complex disruption and mTORC1 negative feedback effects, could also contribute to some of the nerve abnormalities. Indeed, p-AKT(Ser473) and p-AKT(Thr308) levels, which reflect mTORC2 and PI3K activities, were substantially restored by rapamycin treatment of TSC2-SCKO mice and further normalized after rapamycin withdrawal. The recent finding that inactivation of mTORC2 in developing SCs has no major impact on PNS myelination (5) argues against a significant role of mTORC2 in the dysmyelination of TSC2-SCKO mice. On the other hand, PI3K/AKT has been established as a key positive regulator of PNS myelination, in part through mTOR-independent functions (9, 10). The delay in myelin wrapping and Remak bundle defects in both TSC1- and TSC2-SCKO mice could result from reduced PI3K/AKT signaling and subsequent diminished activation of Rho GTPases, such as Rac1 (10). Moreover, the somewhat counterintuitive decrease in SREBP signaling that leads to low cholesterol levels in TSC2-SCKO nerves is likely a result of the attenuated PI3K/AKT activity (36). The TSC1-SCKO and PTEN-SCKO mice display similar delays in myelin formation and later focal hypermyelination (the latter aspect occurs earlier and is more pronounced in PTEN-SCKO mice). However, although AKT activity is greatly increased in PTEN-SCKO nerves, it is markedly reduced in TSC1-SCKO nerves. This finding suggests that mTORC1 hyperactivity during adulthood in these mutants contributes to the pathologically redundant myelin.
Inactivation of TSC1 or TSC2 in oligodendrocyte precursor cells causes reduced myelination in the CNS (37–39), with similarities to the SC lineage deficits observed herein (38, 39). Our finding that TSC1/2 complex disruption in developing SCs promotes proliferation and suppresses differentiation has recent precedents in nonglial cell types (40–42). For example, TSC1 deletion in developing osteoblasts or chondrocytes leads to severely impaired bone development secondary to uncontrolled proliferation, and thus impeded differentiation of these cells (41, 42). The aberrant proliferation phenotype in these and other examples of conditional TSC1/2 deletion in vivo (34, 43, 44) is not surprising given the functions of mTORC1 in stimulating cell cycle progression through a variety of mechanisms (45–48). However, elevated proliferation is not always a phenotypic outcome of mTORC1 induction in conditional TSC1/2 mouse models, as seen for example in radial glia (49) and myocytes (50). Indeed, in some cell types proliferation appears even reduced (51, 52). These differences may be related to cell type or context-specific functions of the TSC1/2 complex. Indeed, we provide evidence that TSC2 regulates the abundance of the key cell cycle inhibitor p27Kip1 in the SC lineage as described in other cell types (29, 30, 32, 53). The reduction in p27Kip1 levels in TSC2-SCKO nerves results in a CDK2 increase, subsequent phosphorylation of Rb, and S-phase progression. The antiproliferative effects of rapamycin indicate that SC hyperplasia in TSC2-SCKO nerves is dependent on mTORC1 activity, consistent with the documented regulation of p27Kip1 protein stability by mTORC1 (31) and induction of p27Kip1 expression by rapamycin (54).
In conclusion, our study shows that the TSC1/2 complex in the SC lineage plays a crucial role for normal peripheral nerve development. The phenotypes elicited by inactivation of TSC1 and TSC2, together with pharmacological manipulation of mTORC1, have uncovered context- and dose-dependent functions of mTORC1 signaling that influence SC fate determination and myelination. The ability of rapamycin to reverse the profound neuropathy present in TSC2-SCKO animals is a surprising result that may provide new therapeutic opportunities. Although SCs are well known to remyelinate regenerating fibers after nerve injury, this result suggests that diseased SCs may be rejuvenated and compelled to reestablish myelination and Remak bundle formation. If glial mTORC1 dysregulation occurs in other acquired or hereditary neuropathies, then manipulating its activity could be therapeutically beneficial.
Materials and Methods
Generation of SC-Specific Mutant Mice.
All animal experiments were reviewed and approved by the Roswell Park Cancer Institute Institutional Animal Care and Use Committee (protocol approval UB1301M, to B.B.) and Washington University Animal Studies Committee (protocol approvals #20110071 and 20140044, to J.M.). To generate TSC2-SCKO, TSC1-SCKO, and PTEN-SCKO mice, the respective floxed mice [TSC2 (19), TSC1 (34), PTEN (55)] were crossed to P0-Cre transgenic mice (20). Littermates carrying floxed alleles, but lacking Cre expression, were used as controls. Genotyping for all mutants was performed by PCR strategies using standard procedures and appropriate primers (sequences available upon request).
Rapamycin Treatment of Mice.
Rapamycin (LC Laboratories) was dissolved in a carrier solution consisting of 5% (vol/vol) polyethyleneglycol 400, 5% (vol/vol) Tween 80, and 4% (vol/vol) ethanol in sterile H2O. Mice received daily intraperitoneal injections at 10 µg rapamycin per gram mouse weight (or only the carrier solution as control).
Nerve Histology, Histomorphometry, and g-Ratio Calculations.
Harvested mouse nerves were placed in 0.1 M phosphate buffer containing 3% (vol/vol) glutaraldehyde (Polysciences) for several days and then postfixed in 1% osmium tetroxide in phosphate buffer overnight at 4 °C. Following en bloc staining with 1% uranlyacetate in 70% (vol/vol) ethanol overnight at 4 °C, the samples were dehydrated and embedded in Araldite 502 epoxy resin (Polysciences). Next, 500-nm-thick semithin sections were prepared on a Leica ultramicrotome and stained with a Toluidine blue solution on a hot plate. For the quantification of the total number of structures (e.g., myelinated axons) per sciatic nerve cross-section, high-resolution tile scans (63× objective) of the entire nerve area were acquired, and automatically stitched together for nerve reconstruction using Leica Application Suite X software. Tile-scan composite nerve photographs were then used to determine the total number of myelinated axons, glial nuclei, fibers displaying focal hypermyelination (including outfoldings, recurrent myelin loops, tomacula), and the nerve size with ImageJ software. The g-ratios of individual myelinated axons in sciatic nerves as a measure of myelin thickness were determined using a plugin for the ImageJ software, which allows semiautomated analysis of randomly selected axons on nerve transverse sections (gratio.efil.de). One-hundred randomly chosen fibers were measured per mouse nerve. Cumulative g-ratios were calculated for each mouse by averaging all individual g-ratios.
Nerve Protein Analysis and Western Blotting.
Sciatic nerves were rapidly dissected, stripped from the epineurium in ice-cold PBS, and lysed in RIPA buffer supplemented with protease and phosphatase inhibitors (Roche, Sigma). Western blotting of nerve protein lysates was performed using Invitrogen Life Technologies Bolt Mini gels and Mini Bolt wet transfer modules according to the manufacturer’s instructions. Proteins were visualized with Lab Safe GEL Blue and Swift Membrane stain (G-Biosciences). Blot documentation was performed with a Bio-Rad ChemiDocMP digital Imaging System. Integrated band intensities of protein bands were measured using Bio-Rad Image Lab software and normalized by comparison with the loading control. The following primary antibodies from Cell Signaling Technologies were used: TSC2 (#4308), TSC1 (#6935), mTOR (#2983, #2972), p70-S6K (#2708), p-p70-S6K(Thr389) (#9205, #9234), S6rp (#2217), p-S6rp(Ser240/244) (#5364, #2215), 4E-BP1 (#9644), p-4E-BP1(Thr37/46) (#2855), AKT (#4691), p-AKT(Ser473) (#4060), p-AKT(Thr308) (#4056), FASN (#3187), Cyclin B1 (#4138), Cyclin D1 (#2978), Cyclin E1 (#4129), Cyclin A2 (#4656), CDK2 (#2546), p-Rb (Ser807/811) (#9308), JUN (#9165), p44/42 Erk1/2 (#9102), p-Erk1/2(Thr202/Tyr204) (#9101), eIF4E (#9742), eiF2α (#5324), p-mTOR(Ser2448) (#2971). The following primary antibodies from other manufacturers were used: MBP (Aves Labs, #MBP), P0 (Aves Labs, #PZ0), MAG (Invitrogen, #34–6200), CNPase (Aves Labs, #CNP), GAPDH (Millipore, #MAB374), p27Kip1 (Santa Cruz Biotechnology, #sc-1641), SREBP2 (Santa Cruz Biotechnology, sc-5603), SREBP1 (Santa Cruz Biotechnology, sc-367), HMGCR (Santa Cruz Biotechnology, sc-27578), β-actin (Sigma Aldrich, #A2228). HRP-coupled secondary antibodies from Cell Signaling Technologies and Jackson Immuno Research were used for signal detection.
Immunofluorescence and Quantification.
Sciatic nerve segments were immersion fixed in 4% (mass/vol) paraformaldehyde/PBS for 2 h, cryoprotected in 30% (mass/vol) sucrose, embedded in Tissue-Tek OCT compound (Sakura Finetek), and sectioned at 12 μm on a Leica cryostat. Immunofluorescence on longitudinal and transverse frozen nerve sections including DAPI staining was performed using standard procedures with primary antibody incubation overnight at 4 °C, and secondary antibody incubation at room temperature for 1 h in blocking buffer. Ki67+, p-H3+, or c-Casp3+ SCs were quantified in four randomly selected areas from longitudinal sciatic nerve sections (at least three mice per genotype). Teased fibers from mouse tibial nerves were produced after 30-min postfixation of freshly dissected nerve samples in 4% (mass/vol) paraformaldehyde/PBS at 4 °C. The samples were washed three times in cold PBS for 5 min and then desheated axon bundles were separated with fine dissection needles in cold PBS on Fisherbrand Superfrost/Plus microscope slides (Fisher Scientific). Slides were air-dried for 1 h and stored at −20 °C. After postfixation in a 1:1 mix of acetone/methanol for 10 min at −20 °C, the slides were washed in PBS, blocked with 10% (mass/vol) fish skin gelatin/PBS containing 0.1% Triton for 1 h at 25 °C, and incubated with primary antibodies overnight at 4 °C. After washing, secondary antibodies were applied for 1 h, and the slides were mounted using Vectashield Mounting Medium with DAPI (Vector Laboratories). SOX10+ SCs associated with TUJ1+ axons were counted along a total fiber distance of ∼25 mm per mouse using Leica Application Suite X software (three mice per genotype). Following primary antibodies were used for immunofluorescence: p-S6rp(Ser240/244) (Cell Signaling Technologies, #5364), S100-Biotin (Thermo Scientific, #MA5-12966), SOX10 (Cell Signaling Technologies, #89356), TUJ1 (BioLegend #801201), Ki67 (Cell Signaling Technologies, #12202), phospho-Histone H3 (Ser10) (Millipore, #9661), Cleaved-Caspase 3 (Asp175) (Cell Signaling Technologies, #9661), OCT6 (kind gift from John Bermingham, McLaughlin Research Institute for Biomedical Sciences, Great Falls, MT), SOX2 (Active Motif, #39823), Egr2 (Covance #PRB-236P). Alexa 488 and Alexa 568-conjugated secondary antibodies or Streptavidin-conjugates were used for signal detection. Samples were counterstained with DAPI and mounted in Vectashield (Vector Laboratories).
Statistical Analysis and Presentation of Data.
All demonstrated photomicrographs (immunolabeling, light and electron microscopy) are representative of at least three biological replicates. All quantitative data are presented as mean ± SEM. All statistical analyses were performed using Graph Pad Prism software. A two-tailed Student’s t test was used for group comparisons and statistical significance was considered if P < 0.05.
SI Materials and Methods
Behavioral Analysis.
Accelerated rotarod analysis of TSC2-SCKO and littermate control mice was performed using a Ugo Basile Rotarod apparatus (#47600) according to the manufacturer’s instructions. The mice were allowed to stay on the rod for a maximum of 300 s. Behavioral assessment was carried out in a quiet environment during the day, and the experimenter was blind to the genotypes of the mice during data acquisition.
Microscopic Nerve Imaging.
We used a Leica DMi8 digital imaging system coupled to an automated Leica LMT200 high-precision scanning stage and DFC7000T digital camera for image acquisition of nerve plastic semithin sections. Confocal imaging of immunofluorescent samples was performed using a Leica SP511 confocal system. Electron micrographs of ultrathin sections were taken with a FEI Tecnai transmission electron microscope.
Assessment of New Protein Synthesis with SUnSET.
For analysis of the rate of new protein synthesis in sciatic nerves, 6-wk-old mice were injected with the antibiotic puromycin (0.04 μmol/g mouse weight), and 60 min after injection sciatic nerves were dissected and snap-frozen in liquid nitrogen. Western blotting of sciatic nerve lysates was performed as described above, and following antibodies were used to detect puromycin incorporation into newly generated sciatic nerve proteins: primary: puromycin clone 12D10 (Millipore, #MABE343); secondary: AffiniPure Goat Anti-Mouse IgG, Fcγ Subclass 2a Specific (Jackson Immuno Research, #115-005-206). An HRP-coupled anti-goat antibody was used for signal detection.
Nerve Lipid Measurements.
Total cholesterol, triglyceride, and fatty acid levels in sciatic nerves were determined using colorimetric assays with commercial detection reagents [Infinity Total Cholesterol and Infinity Triglycerides, Thermo Scientific; NEFA HR (2), Wako Chemicals]. Snap-frozen sciatic nerves were weighed, homogenized in chloroform:methanol (2:1), and centrifuged at 11,000 × g for 10 min at 4 °C. Aliquots for the respective measurements were evaporated in a microcentrifuge tube, the detection reagents added, and incubated at room temperature. The solutions were transferred to a 96-well plate with standards for chlolesterol/tryglyceride/fatty acids, and the respective concentrations were determined with a plate reader following the manufacturer’s instructions.
Nerve Electrophysiology.
TSC2-SCKO mice were anesthetized and placed on a heating pad. Stimulating electrodes were placed just above the left ankle and the left sciatic notch for nerve stimulation. Recording electrodes were placed in the footpad. Evoked compound muscle action potentials were obtained using a Viking Quest electromyography device (Nicolet) using supramaximal stimulation.
Supplementary Material
Acknowledgments
We thank M. Gambello (Emory University School of Medicine) for the conditional TSC2 mice and helpful discussion; M. Wong (Washington University School of Medicine in St. Louis) for the conditional TSC1 mice; L. Wrabetz (Hunter James Kelly Research Institute) and A. Messing (University of Wisconsin–Madison) for the P0Cre transgenic mice; Robert Loren, Amy Strickland, and Nina Panchenko for assistance with mouse colony maintenance; Robert Loren for assistance with behavioral analysis; and C. Deppmann (University of Virginia) for reading the manuscript and helpful comments. This work was supported by Empire State Development Corporation for Hunter James Kelly Research Institute Grants W753 and U446 (to B.B.); Hunter’s Hope Foundation (B.B.); Muscular Dystrophy Association Grants 236648 (to B.B.) and 292306 (to E.B.); and National Institutes of Health Grants NS040745, NS087306, and AG13730 (to J.M.).
Footnotes
The authors declare no conflict of interest.
This article is a PNAS Direct Submission.
This article contains supporting information online at www.pnas.org/lookup/suppl/doi:10.1073/pnas.1620761114/-/DCSupplemental.
References
- 1.Jessen KR, Mirsky R. The origin and development of glial cells in peripheral nerves. Nat Rev Neurosci. 2005;6:671–682. doi: 10.1038/nrn1746. [DOI] [PubMed] [Google Scholar]
- 2.Scherer SS, Wrabetz L. Molecular mechanisms of inherited demyelinating neuropathies. Glia. 2008;56:1578–1589. doi: 10.1002/glia.20751. [DOI] [PMC free article] [PubMed] [Google Scholar]
- 3.Zenker J, Ziegler D, Chrast R. Novel pathogenic pathways in diabetic neuropathy. Trends Neurosci. 2013;36:439–449. doi: 10.1016/j.tins.2013.04.008. [DOI] [PubMed] [Google Scholar]
- 4.Sherman DL, et al. Arrest of myelination and reduced axon growth when Schwann cells lack mTOR. J Neurosci. 2012;32:1817–1825. doi: 10.1523/JNEUROSCI.4814-11.2012. [DOI] [PMC free article] [PubMed] [Google Scholar]
- 5.Norrmén C, et al. mTORC1 controls PNS myelination along the mTORC1-RXRγ-SREBP-lipid biosynthesis axis in Schwann cells. Cell Reports. 2014;9:646–660. doi: 10.1016/j.celrep.2014.09.001. [DOI] [PubMed] [Google Scholar]
- 6.Kennedy BK, Lamming DW. The mechanistic target of rapamycin: The grand conducTOR of metabolism and aging. Cell Metab. 2016;23:990–1003. doi: 10.1016/j.cmet.2016.05.009. [DOI] [PMC free article] [PubMed] [Google Scholar]
- 7.Laplante M, Sabatini DM. mTOR signaling in growth control and disease. Cell. 2012;149:274–293. doi: 10.1016/j.cell.2012.03.017. [DOI] [PMC free article] [PubMed] [Google Scholar]
- 8.Crino PB. The mTOR signalling cascade: Paving new roads to cure neurological disease. Nat Rev Neurol. 2016;12:379–392. doi: 10.1038/nrneurol.2016.81. [DOI] [PubMed] [Google Scholar]
- 9.Goebbels S, et al. Genetic disruption of Pten in a novel mouse model of tomaculous neuropathy. EMBO Mol Med. 2012;4:486–499. doi: 10.1002/emmm.201200227. [DOI] [PMC free article] [PubMed] [Google Scholar]
- 10.Domènech-Estévez E, et al. Akt regulates axon wrapping and myelin sheath thickness in the PNS. J Neurosci. 2016;36:4506–4521. doi: 10.1523/JNEUROSCI.3521-15.2016. [DOI] [PMC free article] [PubMed] [Google Scholar]
- 11.Inoki K, Li Y, Xu T, Guan KL. Rheb GTPase is a direct target of TSC2 GAP activity and regulates mTOR signaling. Genes Dev. 2003;17:1829–1834. doi: 10.1101/gad.1110003. [DOI] [PMC free article] [PubMed] [Google Scholar]
- 12.Dibble CC, Manning BD. Signal integration by mTORC1 coordinates nutrient input with biosynthetic output. Nat Cell Biol. 2013;15:555–564. doi: 10.1038/ncb2763. [DOI] [PMC free article] [PubMed] [Google Scholar]
- 13.Zeng LH, et al. Tsc2 gene inactivation causes a more severe epilepsy phenotype than Tsc1 inactivation in a mouse model of tuberous sclerosis complex. Hum Mol Genet. 2011;20:445–454. doi: 10.1093/hmg/ddq491. [DOI] [PMC free article] [PubMed] [Google Scholar]
- 14.Henske EP, Jóźwiak S, Kingswood JC, Sampson JR, Thiele EA. Tuberous sclerosis complex. Nat Rev Dis Primers. 2016;2:16035. doi: 10.1038/nrdp.2016.35. [DOI] [PubMed] [Google Scholar]
- 15.Magnuson B, Ekim B, Fingar DC. Regulation and function of ribosomal protein S6 kinase (S6K) within mTOR signalling networks. Biochem J. 2012;441:1–21. doi: 10.1042/BJ20110892. [DOI] [PubMed] [Google Scholar]
- 16.Sheean ME, et al. Activation of MAPK overrides the termination of myelin growth and replaces Nrg1/ErbB3 signals during Schwann cell development and myelination. Genes Dev. 2014;28:290–303. doi: 10.1101/gad.230045.113. [DOI] [PMC free article] [PubMed] [Google Scholar]
- 17.Court FA, et al. Restricted growth of Schwann cells lacking Cajal bands slows conduction in myelinated nerves. Nature. 2004;431:191–195. doi: 10.1038/nature02841. [DOI] [PubMed] [Google Scholar]
- 18.Woodhoo A, Sommer L. Development of the Schwann cell lineage: From the neural crest to the myelinated nerve. Glia. 2008;56:1481–1490. doi: 10.1002/glia.20723. [DOI] [PubMed] [Google Scholar]
- 19.Hernandez O, Way S, McKenna J, 3rd, Gambello MJ. Generation of a conditional disruption of the Tsc2 gene. Genesis. 2007;45:101–106. doi: 10.1002/dvg.20271. [DOI] [PubMed] [Google Scholar]
- 20.Feltri ML, et al. P0-Cre transgenic mice for inactivation of adhesion molecules in Schwann cells. Ann N Y Acad Sci. 1999;883:116–123. [PubMed] [Google Scholar]
- 21.Schmidt EK, Clavarino G, Ceppi M, Pierre P. SUnSET, a nonradioactive method to monitor protein synthesis. Nat Methods. 2009;6:275–277. doi: 10.1038/nmeth.1314. [DOI] [PubMed] [Google Scholar]
- 22.Huang J, Manning BD. A complex interplay between Akt, TSC2 and the two mTOR complexes. Biochem Soc Trans. 2009;37:217–222. doi: 10.1042/BST0370217. [DOI] [PMC free article] [PubMed] [Google Scholar]
- 23.Tremblay F, et al. Identification of IRS-1 Ser-1101 as a target of S6K1 in nutrient- and obesity-induced insulin resistance. Proc Natl Acad Sci USA. 2007;104:14056–14061. doi: 10.1073/pnas.0706517104. [DOI] [PMC free article] [PubMed] [Google Scholar]
- 24.Huang J, Dibble CC, Matsuzaki M, Manning BD. The TSC1-TSC2 complex is required for proper activation of mTOR complex 2. Mol Cell Biol. 2008;28:4104–4115. doi: 10.1128/MCB.00289-08. [DOI] [PMC free article] [PubMed] [Google Scholar]
- 25.Chrast R, Saher G, Nave KA, Verheijen MH. Lipid metabolism in myelinating glial cells: Lessons from human inherited disorders and mouse models. J Lipid Res. 2011;52:419–434. doi: 10.1194/jlr.R009761. [DOI] [PMC free article] [PubMed] [Google Scholar]
- 26.Lewis CA, Griffiths B, Santos CR, Pende M, Schulze A. Regulation of the SREBP transcription factors by mTORC1. Biochem Soc Trans. 2011;39:495–499. doi: 10.1042/BST0390495. [DOI] [PubMed] [Google Scholar]
- 27.Caron A, Richard D, Laplante M. The roles of mTOR complexes in lipid metabolism. Annu Rev Nutr. 2015;35:321–348. doi: 10.1146/annurev-nutr-071714-034355. [DOI] [PubMed] [Google Scholar]
- 28.Li H, et al. The cyclin-dependent kinase inhibitor p27(Kip1) is a positive regulator of Schwann cell differentiation in vitro. J Mol Neurosci. 2011;45:277–283. doi: 10.1007/s12031-011-9518-2. [DOI] [PubMed] [Google Scholar]
- 29.Rosner M, et al. p27Kip1 localization depends on the tumor suppressor protein tuberin. Hum Mol Genet. 2007;16:1541–1556. doi: 10.1093/hmg/ddm103. [DOI] [PubMed] [Google Scholar]
- 30.Soucek T, Yeung RS, Hengstschläger M. Inactivation of the cyclin-dependent kinase inhibitor p27 upon loss of the tuberous sclerosis complex gene-2. Proc Natl Acad Sci USA. 1998;95:15653–15658. doi: 10.1073/pnas.95.26.15653. [DOI] [PMC free article] [PubMed] [Google Scholar]
- 31.Hong F, et al. mTOR-raptor binds and activates SGK1 to regulate p27 phosphorylation. Mol Cell. 2008;30:701–711. doi: 10.1016/j.molcel.2008.04.027. [DOI] [PubMed] [Google Scholar]
- 32.Lacher MD, et al. Rheb activates AMPK and reduces p27Kip1 levels in Tsc2-null cells via mTORC1-independent mechanisms: Implications for cell proliferation and tumorigenesis. Oncogene. 2010;29:6543–6556. doi: 10.1038/onc.2010.393. [DOI] [PubMed] [Google Scholar]
- 33.Sherr CJ, Roberts JM. CDK inhibitors: Positive and negative regulators of G1-phase progression. Genes Dev. 1999;13:1501–1512. doi: 10.1101/gad.13.12.1501. [DOI] [PubMed] [Google Scholar]
- 34.Uhlmann EJ, et al. Astrocyte-specific TSC1 conditional knockout mice exhibit abnormal neuronal organization and seizures. Ann Neurol. 2002;52:285–296. doi: 10.1002/ana.10283. [DOI] [PubMed] [Google Scholar]
- 35.Menon S, et al. Spatial control of the TSC complex integrates insulin and nutrient regulation of mTORC1 at the lysosome. Cell. 2014;156:771–785. doi: 10.1016/j.cell.2013.11.049. [DOI] [PMC free article] [PubMed] [Google Scholar]
- 36.Yecies JL, et al. Akt stimulates hepatic SREBP1c and lipogenesis through parallel mTORC1-dependent and independent pathways. Cell Metab. 2011;14:21–32. doi: 10.1016/j.cmet.2011.06.002. [DOI] [PMC free article] [PubMed] [Google Scholar]
- 37.Jiang M, et al. Regulation of PERK-eIF2α signalling by tuberous sclerosis complex-1 controls homoeostasis and survival of myelinating oligodendrocytes. Nat Commun. 2016;7:12185. doi: 10.1038/ncomms12185. [DOI] [PMC free article] [PubMed] [Google Scholar]
- 38.Carson RP, et al. Hypomyelination following deletion of Tsc2 in oligodendrocyte precursors. Ann Clin Transl Neurol. 2015;2:1041–1054. doi: 10.1002/acn3.254. [DOI] [PMC free article] [PubMed] [Google Scholar]
- 39.Lebrun-Julien F, et al. Balanced mTORC1 activity in oligodendrocytes is required for accurate CNS myelination. J Neurosci. 2014;34:8432–8448. doi: 10.1523/JNEUROSCI.1105-14.2014. [DOI] [PMC free article] [PubMed] [Google Scholar]
- 40.Zhou Y, Rychahou P, Wang Q, Weiss HL, Evers BM. TSC2/mTORC1 signaling controls Paneth and goblet cell differentiation in the intestinal epithelium. Cell Death Dis. 2015;6:e1631. doi: 10.1038/cddis.2014.588. [DOI] [PMC free article] [PubMed] [Google Scholar]
- 41.Huang B, et al. mTORC1 prevents preosteoblast differentiation through the Notch signaling pathway. PLoS Genet. 2015;11:e1005426. doi: 10.1371/journal.pgen.1005426. [DOI] [PMC free article] [PubMed] [Google Scholar]
- 42.Yan B, et al. mTORC1 regulates PTHrP to coordinate chondrocyte growth, proliferation and differentiation. Nat Commun. 2016;7:11151. doi: 10.1038/ncomms11151. [DOI] [PMC free article] [PubMed] [Google Scholar]
- 43.Menon S, et al. Chronic activation of mTOR complex 1 is sufficient to cause hepatocellular carcinoma in mice. Sci Signal. 2012;5:ra24. doi: 10.1126/scisignal.2002739. [DOI] [PMC free article] [PubMed] [Google Scholar]
- 44.Rachdi L, et al. Disruption of Tsc2 in pancreatic beta cells induces beta cell mass expansion and improved glucose tolerance in a TORC1-dependent manner. Proc Natl Acad Sci USA. 2008;105:9250–9255. doi: 10.1073/pnas.0803047105. [DOI] [PMC free article] [PubMed] [Google Scholar]
- 45.Ramírez-Valle F, Badura ML, Braunstein S, Narasimhan M, Schneider RJ. Mitotic raptor promotes mTORC1 activity, G(2)/M cell cycle progression, and internal ribosome entry site-mediated mRNA translation. Mol Cell Biol. 2010;30:3151–3164. doi: 10.1128/MCB.00322-09. [DOI] [PMC free article] [PubMed] [Google Scholar]
- 46.Fingar DC, et al. mTOR controls cell cycle progression through its cell growth effectors S6K1 and 4E-BP1/eukaryotic translation initiation factor 4E. Mol Cell Biol. 2004;24:200–216. doi: 10.1128/MCB.24.1.200-216.2004. [DOI] [PMC free article] [PubMed] [Google Scholar]
- 47.Dowling RJ, et al. mTORC1-mediated cell proliferation, but not cell growth, controlled by the 4E-BPs. Science. 2010;328:1172–1176. doi: 10.1126/science.1187532. [DOI] [PMC free article] [PubMed] [Google Scholar]
- 48.Wang X, Proud CG. Nutrient control of TORC1, a cell-cycle regulator. Trends Cell Biol. 2009;19:260–267. doi: 10.1016/j.tcb.2009.03.005. [DOI] [PubMed] [Google Scholar]
- 49.Way SW, et al. Loss of Tsc2 in radial glia models the brain pathology of tuberous sclerosis complex in the mouse. Hum Mol Genet. 2009;18:1252–1265. doi: 10.1093/hmg/ddp025. [DOI] [PMC free article] [PubMed] [Google Scholar]
- 50.Meikle L, et al. A mouse model of tuberous sclerosis: Neuronal loss of Tsc1 causes dysplastic and ectopic neurons, reduced myelination, seizure activity, and limited survival. J Neurosci. 2007;27:5546–5558. doi: 10.1523/JNEUROSCI.5540-06.2007. [DOI] [PMC free article] [PubMed] [Google Scholar]
- 51.Inoki K, et al. mTORC1 activation in podocytes is a critical step in the development of diabetic nephropathy in mice. J Clin Invest. 2011;121:2181–2196. doi: 10.1172/JCI44771. [DOI] [PMC free article] [PubMed] [Google Scholar]
- 52.Wang Y, et al. Tuberous sclerosis 1 (Tsc1)-dependent metabolic checkpoint controls development of dendritic cells. Proc Natl Acad Sci USA. 2013;110:E4894–E4903. doi: 10.1073/pnas.1308905110. [DOI] [PMC free article] [PubMed] [Google Scholar]
- 53.Uhlmann EJ, et al. Heterozygosity for the tuberous sclerosis complex (TSC) gene products results in increased astrocyte numbers and decreased p27-Kip1 expression in TSC2+/− cells. Oncogene. 2002;21:4050–4059. doi: 10.1038/sj.onc.1205435. [DOI] [PubMed] [Google Scholar]
- 54.Luo Y, et al. Rapamycin resistance tied to defective regulation of p27Kip1. Mol Cell Biol. 1996;16:6744–6751. doi: 10.1128/mcb.16.12.6744. [DOI] [PMC free article] [PubMed] [Google Scholar]
- 55.Lesche R, et al. Cre/loxP-mediated inactivation of the murine Pten tumor suppressor gene. Genesis. 2002;32:148–149. doi: 10.1002/gene.10036. [DOI] [PubMed] [Google Scholar]
Associated Data
This section collects any data citations, data availability statements, or supplementary materials included in this article.