

Abstract
Long non‐coding RNA (lncRNA) have been the focus of increasing attention due to the role they play in many diseases, including osteosarcoma. The function of taurine upregulated gene 1 (TUG1) and its mechanism in osteosarcoma remain unclear. In our research, we found that TUG1 was elevated and correlated with a poor prognosis in osteosarcoma patients. In addition, the following functional experiment showed that decreased TUG1 could remarkably inhibit osteosarcoma cell migration and invasion, indicating that TUG1 functioned as an oncogene in osteosarcoma. Moreover, we revealed that TUG1 and Rho‐associated coiled‐coil‐containing protein kinase 1 (ROCK1), a metastasis‐related gene targeted by microRNA‐335‐5p (miR‐335‐5p), had the same miR‐335‐5p combining site. The subsequent luciferase assay verified TUG1 was a target of miR‐335‐5p. Furthermore, the results of a real‐time quantitative PCR showed that TUG1 and miR‐335‐5p could affect each other's expression. respectively. Finally, we affirmed that TUG1 affected ROCK1 expression and ROCK1‐mediated migration/invasion by working as a competitive endogenous RNA (ceRNA) via miR‐335‐5p. In summary, the findings of this study, based on ceRNA theory, combining the research foundation of miR‐335‐5p and ROCK1, and taking TUG1 as a new study point, provide new insight into molecular‐level reversing migration and invasion of osteosarcoma.
Keywords: ceRNA, lncRNA TUG1, migration/invasion, miR‐335‐5p, osteosarcoma
Osteosarcoma is the most prevalent primary malignant tumor in adolescents, and is associated with an unfavorable prognosis and a high rate of disability in youth.1, 2, 3 Pulmonary metastasis being present at diagnosis, a result of its vicious biological behavior, is usually correlated with the high fatality of those with this disease.4, 5 The percentage of patients with pulmonary metastasis of osteosarcoma at the first visit is approximately 20%.6 Therefore, investigating available metastasis‐related molecules and identifying their mechanisms is especially urgent for both clinical surgeons and medical researchers.
Recently, long non‐coding RNA (lncRNA), which are a group of >200 nucleotides in length, have become the focus in numerous kinds of cellular processes, including the modulation of cell proliferation, apoptosis and invasion, reprogramming of stem cell differentiation and chromatin remodeling.7, 8, 9, 10 Taurine upregulated gene 1 (TUG1) was originally reported to be upregulated in response to taurine treatment of developing mouse retinal cells and is mostly reported as an oncogene in diverse malignant tumors, including non‐small cell lung cancer, colorectal cancer, glioma, bladder cancer and esophageal squamous cell carcinoma.11, 12, 13, 14, 15 There are few reports on the expression level of TUG1 and its function in osteosarcoma. Ma et al. report that TUG1 was highly expressed and correlated with poor prognosis in osteosarcoma patients.16 However, the mechanism of TUG1 in osteosarcoma remains unknown.
MicroRNA (miRNA) are another type of noncoding RNA, which are 20–200 nucleotides in length, and miRNA are known as an oncogene or tumor suppressor gene in multiple cancers. They regulate target genes by interfering with transcription or inhibiting translation.17 In previous research, we focused on microRNA‐335 (miR‐335) in osteosarcoma. We verified that miR‐335 was decreased and worked as a tumor suppressor gene in osteosarcoma tissues and cell lines. Upregulation of miR‐335 could suppress osteosarcoma cell migration and invasion by targeting regulation of rho‐associated coiled‐coil kinase 1 (ROCK1).18 The competitive endogenous RNA (ceRNA) theory about miRNA and lncRNA is currently widely accepted.19, 20, 21, 22 Li reports that lncRNA H19 promoted metastasis by functioning as ceRNA of miR‐200s in osteosarcoma.23 To date, whether TUG1 could affect miR‐335‐5p remains unclear.
Here, we demonstrate that TUG1 was highly expressed in osteosarcoma, and TUG1 promoted migration and invasion by acting as a ceRNA of miR‐335‐5p in osteosarcoma cells.
Materials and Methods
Patients and tissue samples
Osteosarcoma tissues and paired para‐tumor bone tissues used in this study were collected from 44 patients, with their permission, during tumorectomy at the First Affiliated Hospital of Dalian Medical University/Central Hospital affiliated to Shenyang Medical College between February 2008 and February 2016. All 44 cases had a definite pathological diagnosis and the clinical stages of these patients were determined according to the TNM classification of the International Union Against Cancer (UICC). The Institute Research Medical Ethics Committee of the Central Hospital affiliated to Shenyang Medical College granted approval for this study.
Cell culture
Human osteosarcoma cell lines MG‐63, U2OS and MNNG/HOS were, respectively, cultured in DMEM, DMEM (Gibco, California, USA) and MEM (Gibco). Human osteoblast cell line hFOB 1.19 was cultured in DMEM/F12 (Gibco). All media were supplemented with 10% (v/v) FBS (Sigma?Aldrich, St. Louis, MO, USA), 100 IU/mL penicillin (Baomanbio, Shanghai, China) and 100 mg/mL streptomycin (Baomanbio). All cell lines were cultured at 37°C in a humidified atmosphere containing 5% CO2.
Plasmid construction
The TUG1 fragment containing the miR‐335‐5p binding site was amplified and cloned into the pmirGLO Vector (Promega, Madison, Wisconsin, USA) to gain the reporter vector pmiRGLO‐TUG1‐wild‐type (pmirGLO‐TUG1‐wt). The putative binding site of miR‐335‐5p in TUG1 was mutated by using a QuikChange Site‐Directed Mutagenesis Kit (Agilent, Santa Clara, California, USA) to synthetize pmirGLO‐TUG1‐mutant‐type (pmirGLO‐TUG1‐mut). The same method was used to obtain pmirGLO‐ROCK1‐wt and pmirGLO‐ROCK1‐mut reporter plasmids. The above plasmids were used for the following luciferase reporter assays. Similarly, the TUG1 fragment containing miR‐335‐5p binding site was amplified and cloned into the KpnI and XhoI restriction sites (Promega) of pcDNA3.1 vector to synthetize pcDNA3.1‐TUG1‐wild‐type (pcDNA3.1‐TUG1‐wt); pcDNA3.1‐TUG1‐mutant‐type (pcDNA3.1‐TUG1‐mut) was also gained by using a QuikChange Site‐Directed Mutagenesis Kit (Agilent). These two plasmids were used to construct TUG1 overexpression cell models.
Reverse transcription and quantitative real‐time PCR
The procedure was carried out as previously described.24 In brief, total RNA of osteosarcoma tissues and cells were extracted by TRIzol (Invitrogen, Carlsbad, California, USA) according to the manufacturer's protocol. cDNA was reverse transcribed using M‐MLV (Invitrogen) containing 5 μg total RNA, then the qPCR was performed using SYBR Mixture (CWBIO, Beijing, China). U6 and β‐actin were used as an internal control.18, 25 Primers were synthesized by Sangon Biotech (Shanghai, China) and the sequences were as follows: miR‐335‐5p forward 5′‐GTCAAGAGCAATAACGAAAAATG‐3′, reverse; 5′‐GAGGTCAGGAGCAATAATGAA‐3′; U6 forward 5′‐TTACATTGCTATCCACAGAACGG‐3′, reverse 5′‐ CTATGCTGCTGCTTTTTGCTC‐3′; ROCK1 forward 5′‐AGGAAGGCGGACATATTAGTCCCT‐3′, reverse 5′‐AGACGATAGTTGGGTC CCGGC‐3′; β‐actin forward 5′‐AGTGTGACGTGGACATCCGCAAAG‐3′, reverse 5′‐ATCCACATCTGCTGGAAGGTGGAC‐3′; TUG1 forward 5′‐ TAGCAGTTCCCCAATCCTTG‐3′, reverse 5′‐ CACAAATTCCCATCATTCCC‐3′. All reactions were performed in triplicate.
Cell transfection
The procedure was carried out as previously described. U2OS and MNNG/HOS cells at 60–80% confluence were then selected for cell transfection.26 Plasmids were transfected into osteosarcoma cells by using Lipofectamine 2000 (Invitrogen) according to the manufacturer's instructions.27 The sequence of TUG1 siRNA were as follows: 1# TUG1 siRNA, sense 5′‐GGGAUAUAGCCA GAGAACAAUUCUA‐3′, antisense 5′‐UAGAAUUGUUCUCUGGCUAUAUCCC‐3′; 2# TUG1 siRNA, sense 5′‐GCUUGGCUUCUAUUCUGAAUCCUUU‐3′, antisense 5′‐AAAGGAUUCAGAAUAGAAGCCAAGC‐3′; 3# TUG1 siRNA, sense 5′‐CAGCUGUUACCAUUCAACUUCUUAA‐3′, antisense 5′‐UUAAGAAGUUGAAU GGUAACAGCUG‐3′. TUG1‐siRNA and non‐specific siRNA were purchased from Invitrogen.
Western blot analysis
Osteosarcoma tissues and cells were split by using a radio immunoprecipitation assay lysis buffer. Proteins were subjected to 10% SDS‐PAGE and transferred onto a PVDF membrane, then incubated with ROCK1 antibodies (Cell Signaling Technology, Danvers, MA, USA; dilution rates of 1:1000) and GAPDH antibodies (Abcam, Cambridge, MA, USA; dilution rates of 0.5 μg/mL).
Dual luciferase reporter assay
The procedure was carried out as previously described. MiR‐335‐5p mimics/mimic control and pmirGLO‐ROCK1‐wt/pmirGLO‐ROCK1‐mut plasmids were co‐transfected into cultured U2OS or MNNG/HOS cells by using Lipofectamine 2000 (Invitrogen) and incubated for 48 h.28 Then the Dual‐Luciferase Reporter Assay System (Promega) was used to evaluate fluorescence intensity changes according to the manufacturer's protocol. The same procedures were executed to verify the targeting combining effect between TUG1 and miR‐335‐5p.
Transwell assay
The procedures for transwell assays were performed as described previously.18 Briefly speaking, U2OS and MNNG/HOS cells were seeded on uncoated and Matrigel‐coated upper chambers (BD Bioscience, USA) for migration and invasion assays, respectively.18 Medium without serum and with 10% FBS was supplemented into the upper and lower wells, respectively, for a further 24 h incubation. Afterwards, the non‐migrating or non‐invading cells were carefully removed. Then the filters were fixed in 90% alcohol and followed by crystal violet stain. Five random fields were counted per chamber by using an inverted microscope (Olympus, Tokyo, Japan), and each experiment was repeated three times.
Statistical analysis
All experiments were repeated in triplicate and all data from three independent experiments were expressed as mean ± SD. GraphPad Prism V5.0 (GraphPad Software, San Diego, California, USA) software and SPSS 19.0 statistical software were used for statistical analysis. Correlation between TUG1 and clinicopathological features were analyzed using Pearson's χ2‐test. Survival analysis was performed using the log‐rank test in GraphPad Prism V5.0. Differences in the two groups were analyzed using Student's t‐test or one‐way anova. Differences were considered significant if P < 0.05.
Results
Elevated TUG1 was expressed and correlated with poor prognosis in osteosarcoma patients
First, we detected the expression of TUG1 in 44 osteosarcoma tissues and paired para‐tumor bone tissues by using real‐time quantitative PCR (qRT‐PCR). In addition, we measured TUG1 expression in three osteosarcoma cell lines, MG‐63, U2OS, MNNG/HOS, and a human osteoblast cell line, hFOB 1.19. The expression level of TUG1 was remarkably elevated in osteosarcoma tissues and cell lines compared to para‐tumor bone tissues and human osteoblast cell line hFOB 1.19 (Fig. 1a,b) (P < 0.01). Second, we tried to assess whether the elevated TUG1 was correlated with the final survival time of osteosarcoma. Our Kaplan–Meier analysis and log‐rank test revealed that high expression of TUG1 was inversely correlated with osteosarcoma patients’ overall survival (Fig. 1c) (P < 0.01). Third, further correlation analysis confirmed that the high level of TUG1 was closely correlated with clinicopathological features, especially with clinical stage (P = 0.028) and distant metastasis (P = 0.009; determined by using qRT‐PCR) (Table1).
Figure 1.
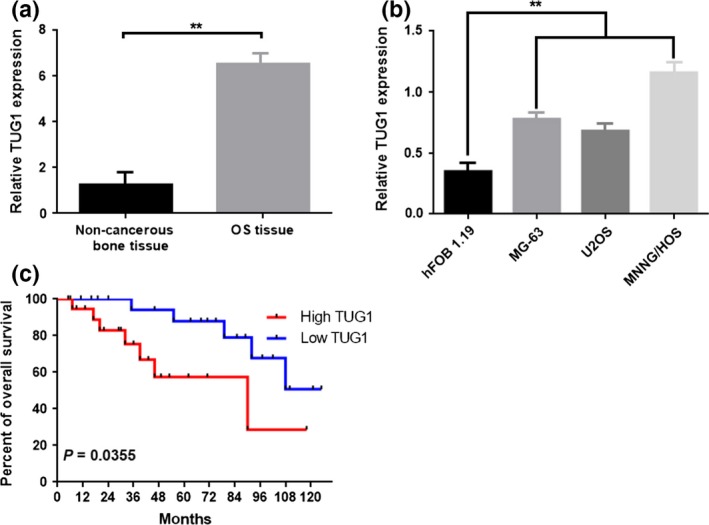
Elevated lncRNA TUG1 was expressed in osteosarcoma tissues and cell lines. (a) Quantitative RT‐PCR (qRT‐PCR analysis of lncRNA TUG1 expression in osteosarcoma tissues and paired noncancerous bone tissues (n = 44). **P < 0.01 versus noncancerous bone tissues group. (b) qRT‐PCR analysis of lncRNA TUG1 expression in osteosarcoma cell lines and human osteoblast cell line hFOB 1.19. **P < 0.01 versus hFOB 1.19. (c) Kaplan–Meier analyses of the associations between TUG1 expression level and overall survival of patients with osteosarcoma (the log‐rank test was used to calculate P‐values). *P = 0.0355 < 0.05 versus low TUG1 expression group. Data are shown as a mean ± SD from three independent experiments.
Table 1.
Association of TUG1 expression with clinic pathological features of osteosarcoma
| Features | Number of cases | TUG1 | P‐valuea | |
|---|---|---|---|---|
| High | Low | |||
| Age at diagnosis | ||||
| <18 | 26 | 17 | 9 | 0.632 |
| ≥18 | 18 | 13 | 5 | |
| Gender | ||||
| Female | 23 | 16 | 7 | 0.837 |
| Male | 21 | 14 | 7 | |
| Histological subtype | ||||
| Osteoblastic | 8 | 6 | 2 | 0.923 |
| Chondroblastic | 16 | 9 | 5 | |
| Fibroblastic | 11 | 8 | 3 | |
| Mixed | 15 | 7 | 4 | |
| Clinical stage | ||||
| I+IIA | 15 | 7 | 8 | 0.028 |
| IIB/III | 29 | 23 | 6 | |
| Distant metastasis | ||||
| Absent | 16 | 7 | 9 | 0.009 |
| Present | 28 | 23 | 5 | |
| Tumor size (cm) | ||||
| <5 | 16 | 10 | 6 | 0.541 |
| ≥5 tumor size | 28 | 20 | 8 | |
| Anatomic location | ||||
| Tibia/femur | 27 | 19 | 8 | 0.694 |
| Elsewhere | 17 | 11 | 6 | |
P‐value obtained from Pearson χ2‐test or Fisher's exact test.
Downregulation of TUG1 inhibited osteosarcoma cells migration/invasion and decreased ROCK1 expression
Based on the expression level of TUG1 in osteosarcoma, we explored the potential function of TUG1 in migration and invasion in osteosarcoma cell lines. TUG1 siRNA and non‐specific siRNA were transfected into U2OS and MNNG/HOS cells, respectively. After a 36‐h transfection, the TUG1 expression level was determined again using qRT‐PCR, and the following transwell assays were executed to evaluate changes with respect to migration and invasion ability. As shown in Fig. 2a, transfection of TUG1 siRNA resulted in an obvious knockdown of TUG1 expression compared to non‐specific siRNA transfection and 1# TUG1 siRNA presented the most suppressive effect (**P < 0.01, *P < 0.05). Therefore, 1# TUG1 siRNA was selected for the subsequent RNAi experiments. The results of the transwell assay showed that the migration and invasion ability of U2OS and MNNG/HOS cells were notably weakened in the TUG1 siRNA group compared to the non‐specific siRNA group (Fig. 2b,c) (P < 0.01).
Figure 2.

Downregulation of TUG1 inhibited osteosarcoma cells migration/invasion and decreased the expression of ROCK1. (a) TUG1 mRNA expression was notably downregulated in the TUG1 siRNA group, detected using qRT‐PCR. 1#TUG1 siRNA presented the most suppressive effect and, therefore, was selected for the following RNAi experiments. **P < 0.01, *P < 0.05 versus non‐specific siRNA group; (b,c) Transwell assays were performed to evaluate the migration/invasion ability changes in U2OS and MNNG/HOS cells. **P < 0.01 versus non‐specific siRNA group (magnification, ×200; scale bar, 100 μm); (d) ROCK1 protein was decreased after TUG1 siRNA, measured using western blot. **P < 0.01 versus non‐specific siRNA group. Data are presented as mean ± SD from three independent experiments.
ROCK1 was known as a migration/invasion‐related protein in malignant tumors.18, 29, 30 In the previous study we focused on ROCK1‐mediated migration and invasion in osteosarcoma cells. Here, we also checked the effect that TUG1 played on ROCK1. As shown in Fig. 2d, compared to the non‐specific siRNA group, the ROCK1 protein expression was obviously decreased in the TUG1 siRNA group (P < 0.01).
TUG1 was a target of miR‐335‐5p
Accumulative evidence has revealed that lncRNA could indirectly regulate miRNA by functioning as a competing endogenous RNA (ceRNA) through a mechanism of competitively binding miRNA. Based on the previous study, we wondered whether the inhibitory effect TUG1 played on migration and invasion was achieved through a similar mechanism on miR‐335‐5p in osteosarcoma cells. First, the result of bioinformatics software (starBase and TargetScan) provided us an encouraging outcome. As shown in Fig. 3a, TUG1 has a similar theoretical combing site for miR‐335‐5p, just as ROCK1 did. Second, we verified that miR‐335‐5p had low expression (P < 0.01) and could inhibit migration and invasion by targeting ROCK1 in osteosarcoma (Fig. 3b–e). Third, we investigated whether miR‐335‐5p could target TUG1. We constructed the luciferase reporter plasmids containing wild‐type or mutant miR‐335‐5p putative binding sites in TUG1 (pmirGLO‐TUG1‐wt and pmirGLO‐TUG1‐mut; Fig. 3f). The results of a luciferase assay demonstrated that compared to negative control (NC), co‐transfection of pmirGLO‐TUG1‐wt and miR‐335‐5p mimics resulted in significant weakening of fluorescence in U2OS cells, but the effects vanished when we mutated the putative miR‐335‐5p binding sites in TUG1 (co‐transfection of pmirGLO‐TUG1‐mut and miR‐335‐5p mimics; P < 0.01). The same phenomenon was observed in MNNG/HOS cells (Fig. 3g) (P < 0.01). In addition, we analyzed the expression relationship between TUG1 and miR‐335‐5p. When we increased (transfection of pcDNA3.1‐TUG1‐wt) or decreased (transfection of TUG1 siRNA) TUG1 (Fig. 3h) (P < 0.01), the expression level of miR‐335‐5p was negatively changed (Fig. 3i) (P < 0.01). Importantly, the results of qRT‐PCR indicated that when upregulation of TUG1 was performed in another way (transfection of pcDNA3.1‐TUG1‐mut [Fig. 3h] [P < 0.01]), the expression level of miR‐335‐5p was not changed (Fig 3i) (P < 0.01). In contrast, when we increased (transfection of miR‐335 mimics) or decreased (transfection of miR‐335 inhibitor) miR‐335‐5p, the expression level of TUG1 was also negatively changed (Fig. 3j,k) (P < 0.01). Conclusively, the abovementioned results provided us the evidence that TUG1 was a potential target of miR‐335‐5p and there was a reciprocal repression effect between TUG1 and miR‐335‐5p.
Figure 3.
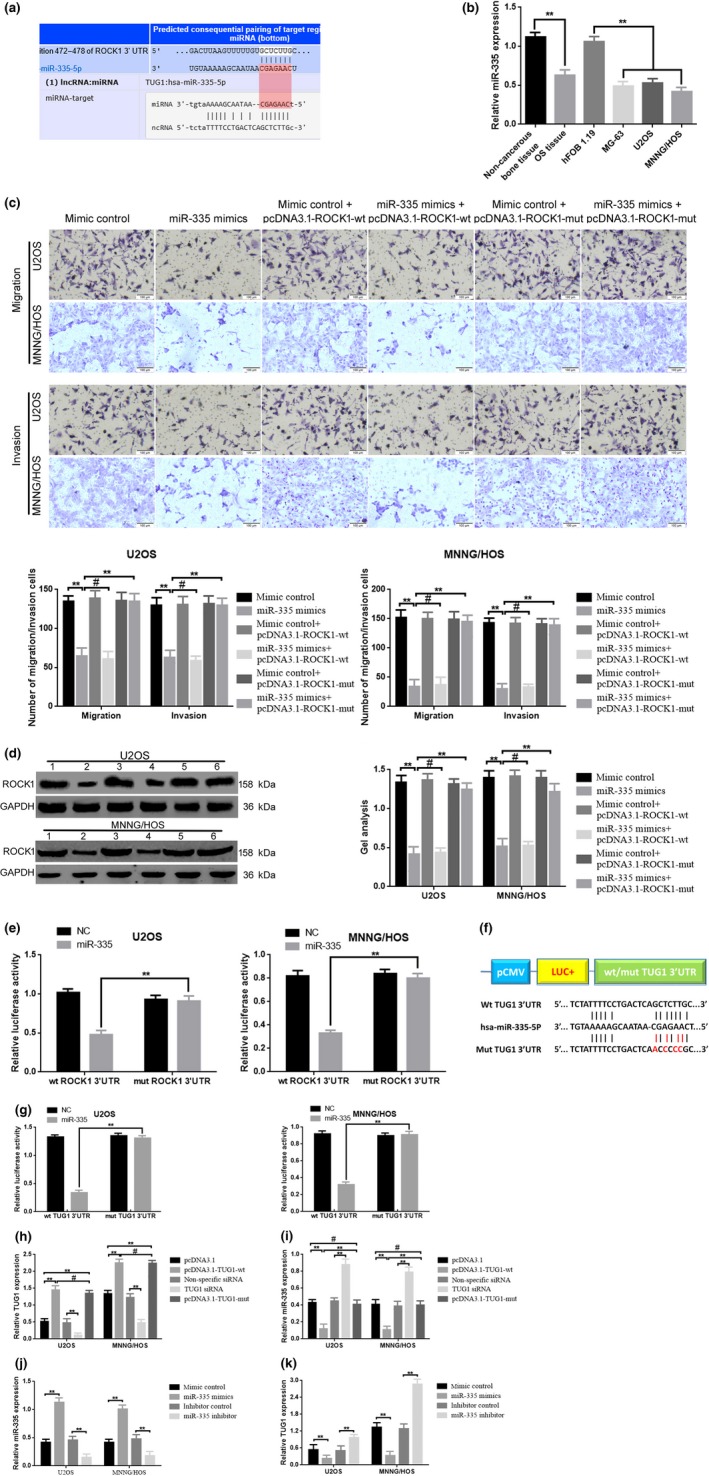
TUG1 was a target of miR‐335‐5p. (a) TUG1 and ROCK1 had the same theoretical combing site for miR‐335‐5p predicted by Starbase and TargetScan. (b) miR‐335‐5p was downregulated in osteosarcoma tissues and cell lines, detected using qRT‐PCR. **P < 0.01 versus noncancerous bone tissues group, **P < 0.01 versus hFOB 1.19. (c) The results of transwell assays indicated that upregulation of miR‐335‐5p by transfection of miR‐335‐5p mimics inhibited migration/invasion, while the inhibitory effect could be reversed by pcDNA3.1‐ROCK1‐mut but not pcDNA3.1‐ROCK1‐wt in osteosarcoma cell line U2OS and MNNG/HOS cells. **P < 0.01 versus mimic control (NC), # P > 0.05 versus miR‐335‐5p mimics, **P < 0.01 versus miR‐335‐5p mimics. (d) Upregulation of miR‐335‐5p by transfection of miR‐335‐5p mimics inhibited ROCK1 protein expression; also, the inhibitory effect could be reversed by pcDNA3.1‐ROCK1‐mut but not pcDNA3.1‐ROCK1‐wt in osteosarcoma cell line U2OS and MNNG/HOS cells. **P < 0.01 versus mimic control (NC), #P > 0.05 versus miR‐335‐5p mimics, **P < 0.01 versus miR‐335‐5p mimics. (e) Weakened fluorescence was presented when co‐transfection of miR‐335 mimics and pcDNA‐3.1‐ROCK1‐wt was detected by luciferase assays. **P < 0.01 versus co‐transfection of miR‐335 mimics and pcDNA‐3.1‐ROCK1‐mut; the results of (a–e) verified that ROCK1 is a target of miR‐335‐5p. (f) Diagram of the constructed TUG1 reporter plasmid containing wild‐type or mutant miR‐335‐5p binding site. (g) Weakened fluorescence was observed in co‐transfection of miR‐335 mimics and the pcDNA‐3.1‐TUG1‐wt group as detected by luciferase assays. **P < 0.01 versus co‐transfection of miR‐335 mimics and pcDNA‐3.1‐TUG1‐mut. (h,i) TUG1 negatively regulate miR‐335‐5p expression verified by using of qRT‐PCR. **P < 0.01 versus pcDNA3.1 group, **P < 0.01 versus non‐specific siRNA group, #P > 0.05 versus pcDNA3.1‐TUG1‐wt group. (j,k) miR‐335‐5p negatively regulate TUG1 expression, measured using qRT‐PCR. **P < 0.01 versus mimic control group; **P < 0.01 versus inhibitor control group. Data are shown as a mean ± SD from three independent experiments.
TUG1 affected ROCK1 expression in a ceRNA manner via miR‐335‐5p
In the above, we verified that TUG1 and ROCK1 were both the targets of miR‐335‐5p, with a similar binding site, and were both taking part in migration and invasion in U2OS and MNNG/HOS cells. Consequently, we wondered about the relationship between TUG1 and ROCK1. First, we confirmed that upregulation of TUG1 (transfection of pcDNA3.1‐TUG1‐wt) led to an increase of ROCK1 expression in mRNA and protein level, but when we mutated the potential combing site for miR‐335‐5p in TUG1 (transfection of pcDNA3.1‐TUG1‐mut), the facilitative effect TUG1 played on ROCK1 was dismissed (Fig. 4a–c) (P < 0.01). Meanwhile, we detected another two previously reported target genes of miR‐335‐5p, RAS p21 protein activator 1 (RASA1) and paired box 6 (PAX6), by using real‐time PCR. The results are shown in Fig. 4d and e; the expression of RASA1 and PAX6 are also upregulated in the pcDNA3.1‐TUG1‐wt group but not in the pcDNA3.1‐TUG1‐mut group (P < 0.01). Combined with the above results, the findings indicated that TUG1 affect ROCK1 in a ceRNA manner via miR‐335‐5p. Moreover, miR‐335‐5p mimics were used to further confirm the potential ceRNA mechanism between TUG1 and miR‐335‐5p. As verified above, both pcDNA3.1‐TUG1‐wt and pcDNA3.1‐TUG1‐mut could elevate TUG1 expression, while miR‐335‐5p mimics could reverse the increased effect of pcDNA3.1‐TUG1‐wt while miR‐335‐5p mimics could reverse the increased effect pcDNA3.1‐TUG1‐wt playing on TUG1 expression but not pcDNA3.1‐TUG1‐mut do (Fig. 4f) (P < 0.01). Simultaneously, we measured the co‐working effect of miR‐335‐5p mimics and TUG1 overexpression plasmids. As the results show in Fig. 4g,h, compared to pcDNA3.1 and pcDNA3.1‐TUG1‐mut, pcDNA3.1‐TUG1‐wt facilitates ROCK1 expression both in mRNA and protein level, and the facilitative effects were reversed by miR‐335‐5p mimics (co‐transfection of miR‐335‐5p mimics and pcDNA3.1‐TUG1‐wt). In addition, when the co‐transfection of miR‐335‐5p mimics and pcDNA3.1‐TUG1‐mut was carried out, the expression of ROCK1 was even more depressed. (Because of the depression effect miR‐335‐5p on ROCK1) (Fig. 4f,g) (P < 0.01). The same phenomenon was also found when detecting RASA1 and PAX6 (Fig. 4i,j) (P < 0.01). In addition, the re‐executed transwell assays confirmed that compared to pcDNA3.1‐TUG1‐mut, transfection of pcDNA3.1‐TUG1‐wt could promote osteosarcoma cell migration and invasion, but the promoted effect was weakened by miR‐335‐5p mimics (co‐transfection of pcDNA3.1‐TUG1‐wt and miR‐335‐5p mimics) (Fig. 4k,l) (P < 0.01).
Figure 4.
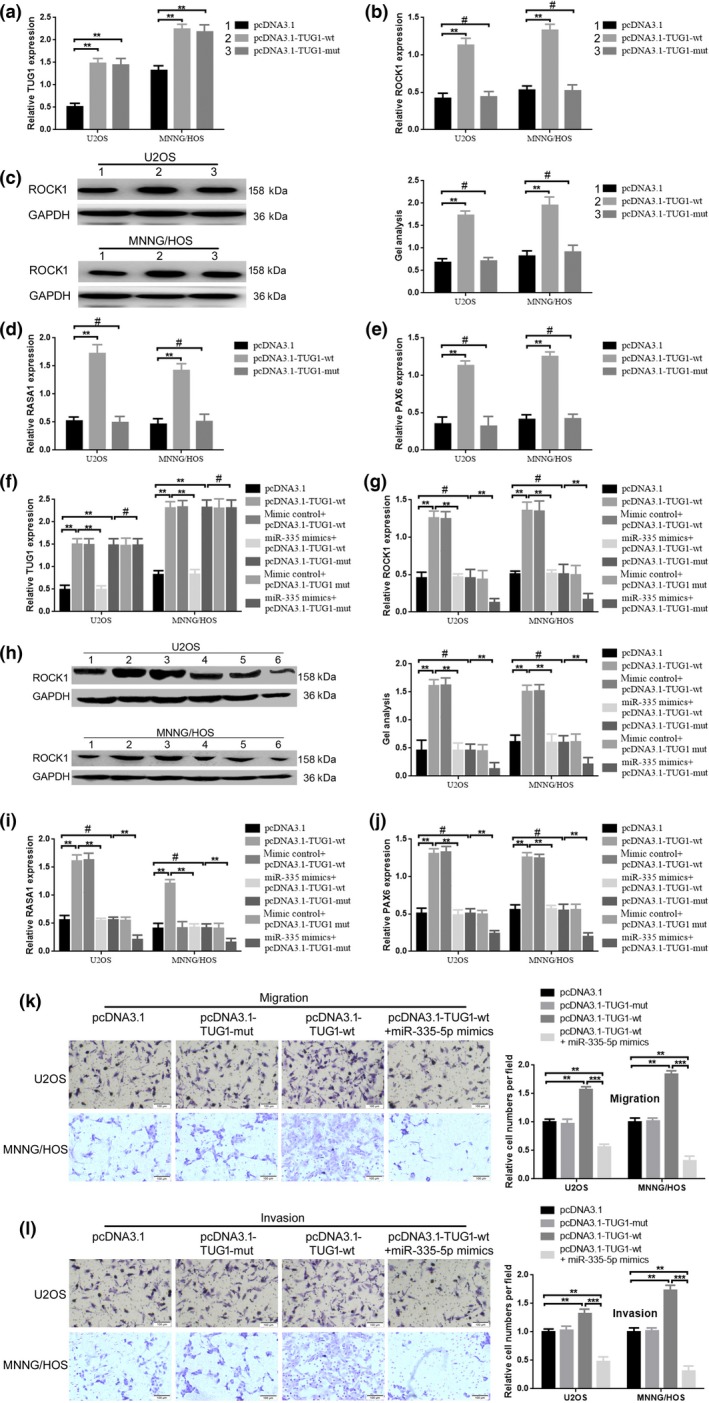
TUG1 affected ROCK1 expression in a ceRNA manner via miR‐335‐5p. (a–c) Upregulation of TUG1 by transfection of pcDNA3.1‐TUG1‐wt. pcDNA3.1‐TUG1‐mut could not elevate ROCK1 expression in mRNA and protein level, as confirmed by qRT‐PCR and western blot. **P < 0.01 versus pcDNA3.1 group, #P > 0.05 versus pcDNA3.1 group. (d,e) Compared to pcDNA3.1‐TUG1‐mut, transfection of pcDNA3.1‐TUG1‐wt promoted RASA1 and PAX6 mRNA expression verified by qRT‐PCR. **P < 0.01 versus pcDNA3.1 group, #P > 0.05 versus pcDNA3.1 group; (f) TUG1 expression was detected by using qRT‐PCR after co‐transfection of pcDNA3.1‐TUG1‐wt/pcDNA3.1‐TUG1‐mut and miR‐335‐5p mimics. (g,h) pcDNA3.1‐TUG1‐wt but not pcDNA3.1‐TUG1‐mut promoted ROCK1 expression and the promotion could be reversed by miR‐335‐5p mimics. **P < 0.01 versus pcDNA3.1, **P < 0.01 versus pcDNA3.1‐TUG1‐wt, **P < 0.01 versus pcDNA3.1‐TUG1‐mut, #P > 0.05 versus pcDNA3.1. I‐J. pcDNA3.1‐TUG1‐wt but not pcDNA3.1‐TUG1‐mut promoted RASA1 and PAX6 mRNA expression and the promotion could be reversed by miR‐335‐5p mimics. **P < 0.01 versus pcDNA3.1, **P < 0.01 versus pcDNA3.1‐TUG1‐wt, **P < 0.01 versus pcDNA3.1‐TUG1‐mut, #P > 0.05 versus pcDNA3.1. (k,l) Elevated TUG1 promoted osteosarcoma cells migration/invasion, but the promoted effect was reduced by miR‐335‐5p. ** P < 0.01 versus pcDNA3.1 group, ***P < 0.001 versus pcDNA3.1‐TUG1‐wt group.
In brief, as the schematic diagram of the mechanism shows in Fig. 5, all the above results support that TUG1 increased ROCK1 expression and promoted ROCK1‐mediated migration/invasion by working as a ceRNA of miR‐335‐5p in osteosarcoma cells.
Figure 5.
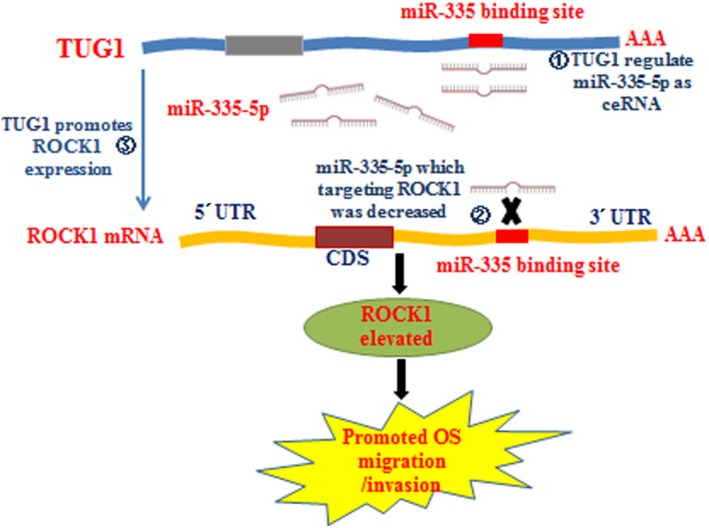
Schematic diagram of mechanism on this research: TUG1 promotes ROCK1 expression via acting as a sponge of miR‐335‐5p and promotes OS metastasis.
Discussion
Increasing evidence is showing that non‐coding RNA play key roles in epigenetic regulation.31 Non‐coding RNA are generally divided into miRNA and lncRNA according to length, and lncRNA are a class of crucial and popular non‐coding RNA that presently contain more than 200 nucleotides in length.32 It is widely reported that lncRNA are involved in multiple malignant tumors.33, 34, 35, 36 TUG1, 7.1‐kb in length, is located at chromosome 22q12 and was first found and considered as a novel retinal non‐coding RNA.37 TUG1, which controls the relocation of growth‐control genes, is one of the lncRNA that are bound to the polycomb repressive complex 2 (PRC2) and is identified as a pivotal oncogene in various malignant tumors.14, 25, 38, 39 Up till now, research about TUG1 and osteosarcoma was rare. Xie et al.40 revealed that TUG1 contributed to osteosarcoma tumorigenesis by sponging miR‐9‐5p; Zhang found that a decrease of TUG1 led to an inhibition of proliferation and conversely to a promotion of apoptosis in osteosarcoma cells.41 In the present study, we found an elevated expression level of TUG1 in osteosarcoma tissues and cell lines and the increased TUG1 was closely correlated with clinicopathological features, especially with clinical stage and distant metastasis. The functional experiment revealed that downregulation of TUG1 could inhibit ROCK1 expression and weaken osteosarcoma cell migration and invasive ability, which indicates that TUG1 works as an oncogene in osteosarcoma.
MiRNA, 20–200 nucleotides in length, is another series of non‐coding RNA that regulate gene expression at the post‐transcriptional/translational level. As a member of the miRNA, miR‐335‐5p is widely reported as a pivotal molecule in various cell processes, especially in tumors, such as cell differentiation, proliferation, apoptosis, migration and invasion.42, 43 The target genes of miR‐335‐5p include RAS p21 protein activator 1 (RASA1) in gastric cancer, paired box 6 (PAX6) in breast cancer, BCL2 like 2 (BCL2L2) in renal carcinoma, poly (ADP‐ribose) polymerase1 (PARP‐1) in small cell lung cancer and ROCK1 in osteosarcoma.44, 45, 46, 47 The results of the current study revealed that ROCK1 3′UTR had the binding site for miR‐335‐5p by using bioinformatics prediction (TargetScan). The first re‐executed luciferase reporter assay and western blot confirmed that miR‐335‐5p could directly target ROCK1 and regulate osteosarcoma cell migration/invasion mediated by ROCK1.
Among the working mechanisms of lncRNA, competing endogenous RNA (ceRNA) theory was first proposed by Leonardo Salmena and received high recognition worldwide.21 LncRNA regulating miRNA in a ceRNA manner has been extensively reported in numerous tumor‐related diseases.19, 48, 49, 50, 51 Here, we predicted that TUG1 and ROCK1 had the same binding site for miR‐335‐5p and then we confirmed that different levels of TUG1 containing the mutant miR‐335‐5p binding site could negatively affect miR‐335‐5p expression. Interestingly, we also found that upregulation and downregulation of miR‐335‐5p could accordingly affect TUG1 expression. The repression effect between TUG1 and miR‐335‐5p presented the possibility that TUG1 could affect miR‐335‐5p in a ceRNA manner. Furthermore, when we upregulated TUG1 containing a wild type miR‐335‐5p binding site, the expression level of ROCK1 was increased. However, the phenomenon ceased when the miR‐335‐5p binding site in TUG1 was mutated. In addition, miR‐335‐5p mimics were used to finally prove the ceRNA mechanism between TUG1 and miR‐335‐5p. The results of qRT‐PCR, western blot and transwell assay reconfirmed that TUG1 could regulate ROCK1 expression and ROCK1 mediated migration/invasion by acting as a ceRNA of miR‐335‐5p.
Metastasis of osteosarcoma is an intricate biological process involving multiple signal pathways and various mechanisms. We first demonstrated that TUG1 increased ROCK1 expression by acting as a ceRNA of miR‐335‐5p to promote migration and invasion of osteosarcoma, indicating that TUG1 may be a promising therapeutic target in treating osteosarcoma in the future.
Disclosure Statement
The authors have no conflict of interest to declare.
Acknowledgments
This work was supported by the National Natural Science Foundation of China (No. 81502333), the China Postdoctoral Science Foundation (No. 2016M591437) and the PhD Start‐up Research Foundation of Liaoning Province (No. 201601225).
Cancer Sci 108 (2017) 859–867
Funding Information
National Natural Science Foundation of China, (Grant/Award Number: ‘81502333’), PhD Start‐up Research Foundation of Liaoning Province, Grant/Award Number: ‘201601225’ China Postdoctoral Science Foundation, (Grant/Award Number: ‘2016M591437’).
Contributor Information
Wei Zhao, Email: zhaowei332@126.com.
Weiguo Zhang, Email: zwg_landy1116@163.com.
References
- 1. Berner K, Johannesen TB, Berner A et al Time‐trends on incidence and survival in a nationwide and unselected cohort of patients with skeletal osteosarcoma. Acta Oncol 2015; 54: 25–33. [DOI] [PMC free article] [PubMed] [Google Scholar]
- 2. Eyre R, Feltbower RG, Mubwandarikwa E, Eden TO, McNally RJ. Epidemiology of bone tumours in children and young adults. Pediatr Blood Cancer 2009; 53: 941–52. [DOI] [PubMed] [Google Scholar]
- 3. Lee L, Fei L, Pope J, Wagner LM. Early lymphocyte recovery and outcome in osteosarcoma. J Pediatr Hematol Oncol 2016; 39: 179–83. [DOI] [PubMed] [Google Scholar]
- 4. Sampo M, Koivikko M, Taskinen M et al Incidence, epidemiology and treatment results of osteosarcoma in Finland – a nationwide population‐based study. Acta Oncol 2011; 50: 1206–14. [DOI] [PubMed] [Google Scholar]
- 5. Ottaviani G, Jaffe N. The epidemiology of osteosarcoma. Cancer Treat Res 2009; 152: 3–13. [DOI] [PubMed] [Google Scholar]
- 6. Mirabello L, Troisi RJ, Savage SA. Osteosarcoma incidence and survival rates from 1973 to 2004: data from the surveillance, epidemiology, and end results program. Cancer 2009; 115: 1531–43. [DOI] [PMC free article] [PubMed] [Google Scholar]
- 7. Ballantyne MD, Pinel K, Dakin R et al Smooth muscle enriched long noncoding RNA (SMILR) regulates cell proliferation. Circulation 2016; 133: 2050–65. [DOI] [PMC free article] [PubMed] [Google Scholar]
- 8. Flynn RA, Chang HY. Long noncoding RNAs in cell‐fate programming and reprogramming. Cell Stem Cell 2014; 14: 752–61. [DOI] [PMC free article] [PubMed] [Google Scholar]
- 9. Khaitan D, Dinger ME, Mazar J et al The melanoma‐upregulated long noncoding RNA SPRY4‐IT1 modulates apoptosis and invasion. Cancer Res 2011; 71: 3852–62. [DOI] [PubMed] [Google Scholar]
- 10. Mehta SL, Kim T, Vemuganti R. Long noncoding RNA FosDT promotes ischemic brain injury by interacting with REST‐associated chromatin‐modifying proteins. J Neurosci 2015; 35: 16443–9. [DOI] [PMC free article] [PubMed] [Google Scholar]
- 11. Han Y, Liu Y, Gui Y, Cai Z. Long intergenic non‐coding RNA TUG1 is overexpressed in urothelial carcinoma of the bladder. J Surg Oncol 2013; 107: 555–9. [DOI] [PubMed] [Google Scholar]
- 12. Li J, An G, Zhang M, Ma Q. Long non‐coding RNA TUG1 acts as a miR‐26a sponge in human glioma cells. Biochem Biophys Res Commun 2016; 477: 743–8. [DOI] [PubMed] [Google Scholar]
- 13. Li Z, Shen J, Chan MT, Wu WK. TUG1: a pivotal oncogenic long non‐coding RNA of human cancers. Cell Prolif 2016; 49: 471–5. [DOI] [PMC free article] [PubMed] [Google Scholar]
- 14. Lin PC, Huang HD, Chang CC et al Long noncoding RNA TUG1 is downregulated in non‐small cell lung cancer and can regulate CELF1 on binding to PRC2. BMC Cancer 2016; 16: 583. [DOI] [PMC free article] [PubMed] [Google Scholar]
- 15. Sun J, Ding C, Yang Z et al The long non‐coding RNA TUG1 indicates a poor prognosis for colorectal cancer and promotes metastasis by affecting epithelial–mesenchymal transition. J Transl Med 2016; 14: 42. [DOI] [PMC free article] [PubMed] [Google Scholar]
- 16. Ma B, Li M, Zhang L et al Upregulation of long non‐coding RNA TUG1 correlates with poor prognosis and disease status in osteosarcoma. Tumour Biol 2016; 37: 4445–55. [DOI] [PubMed] [Google Scholar]
- 17. Fabbri M, Croce CM, Calin GA. MicroRNAs. Cancer J 2008; 14: 1–6. [DOI] [PubMed] [Google Scholar]
- 18. Wang Y, Zhao W, Fu Q. miR‐335 suppresses migration and invasion by targeting ROCK1 in osteosarcoma cells. Mol Cell Biochem 2013; 384: 105–11. [DOI] [PubMed] [Google Scholar]
- 19. Cesana M, Cacchiarelli D, Legnini I et al A long noncoding RNA controls muscle differentiation by functioning as a competing endogenous RNA. Cell 2011; 147: 358–69. [DOI] [PMC free article] [PubMed] [Google Scholar]
- 20. Denzler R, Agarwal V, Stefano J, Bartel DP, Stoffel M. Assessing the ceRNA hypothesis with quantitative measurements of miRNA and target abundance. Mol Cell 2014; 54: 766–76. [DOI] [PMC free article] [PubMed] [Google Scholar]
- 21. Salmena L, Poliseno L, Tay Y, Kats L, Pandolfi PP. A ceRNA hypothesis: the Rosetta Stone of a hidden RNA language? Cell 2011; 146: 353–8. [DOI] [PMC free article] [PubMed] [Google Scholar]
- 22. Wang Y, Xu Z, Jiang J et al Endogenous miRNA sponge lincRNA‐RoR regulates Oct4, Nanog, and Sox2 in human embryonic stem cell self‐renewal. Dev Cell 2013; 25: 69–80. [DOI] [PubMed] [Google Scholar]
- 23. Li M, Chen H, Zhao Y, Gao S, Cheng C. H19 functions as a ceRNA in promoting metastasis through decreasing miR‐200s activity in osteosarcoma. DNA Cell Biol 2016; 35: 235–40. [DOI] [PubMed] [Google Scholar]
- 24. Zhao W, Xu H. High expression of TRPM8 predicts poor prognosis in patients with osteosarcoma. Oncol Lett 2016; 12: 1373–9. [DOI] [PMC free article] [PubMed] [Google Scholar]
- 25. Li J, Zhang M, An G, Ma Q. LncRNA TUG1 acts as a tumor suppressor in human glioma by promoting cell apoptosis. Exp Biol Med 2016; 241: 644–9. [DOI] [PMC free article] [PubMed] [Google Scholar]
- 26. Ma CC, Xiong Z, Zhu GN et al Long non‐coding RNA ATB promotes glioma malignancy by negatively regulating miR‐200a. J Exp Clin Cancer Res 2016; 35: 90. [DOI] [PMC free article] [PubMed] [Google Scholar]
- 27. Zhang EB, Yin DD, Sun M et al P53‐regulated long non‐coding RNA TUG1 affects cell proliferation in human non‐small cell lung cancer, partly through epigenetically regulating HOXB7 expression. Cell Death Dis 2014; 5: e1243. [DOI] [PMC free article] [PubMed] [Google Scholar]
- 28. Lv J, Fan HX, Zhao XP et al Long non‐coding RNA Unigene56159 promotes epithelial–mesenchymal transition by acting as a ceRNA of miR‐140‐5p in hepatocellular carcinoma cells. Cancer Lett 2016; 382: 166–75. [DOI] [PubMed] [Google Scholar]
- 29. Wang W, Zhou X, Wei M. MicroRNA‐144 suppresses osteosarcoma growth and metastasis by targeting ROCK1 and ROCK2. Oncotarget 2015; 6: 10297–308. [DOI] [PMC free article] [PubMed] [Google Scholar]
- 30. Zhou L, Xu Z, Ren X, Chen K, Xin S. MicroRNA‐124 (MiR‐124) inhibits cell proliferation, metastasis and invasion in colorectal cancer by downregulating rho‐associated protein kinase 1 (ROCK1). Cell Physiol Biochem 2016; 38: 1785–95. [DOI] [PubMed] [Google Scholar]
- 31. Marchese FP, Huarte M. Long non‐coding RNAs and chromatin modifiers: their place in the epigenetic code. Epigenetics 2014; 9: 21–6. [DOI] [PMC free article] [PubMed] [Google Scholar]
- 32. St Laurent G, Wahlestedt C, Kapranov P. The landscape of long noncoding RNA classification. Trends Genet 2015; 31: 239–51. [DOI] [PMC free article] [PubMed] [Google Scholar]
- 33. Askarian‐Amiri ME, Leung E, Finlay G, Baguley BC. The regulatory role of long noncoding RNAs in cancer drug resistance. Methods Mol Biol 2016; 1395: 207–27. [DOI] [PubMed] [Google Scholar]
- 34. Jiang C, Li X, Zhao H, Liu H. Long non‐coding RNAs: potential new biomarkers for predicting tumor invasion and metastasis. Mol Cancer 2016; 15: 62. [DOI] [PMC free article] [PubMed] [Google Scholar]
- 35. Schmitt AM, Chang HY. Long noncoding RNAs in cancer pathways. Cancer Cell 2016; 29: 452–63. [DOI] [PMC free article] [PubMed] [Google Scholar]
- 36. Yan K, Arfat Y, Li D et al Structure prediction: new insights into decrypting long noncoding RNAs. Int J Mol Sci 2016; 17: 132. [DOI] [PMC free article] [PubMed] [Google Scholar]
- 37. Rapicavoli NA, Blackshaw S. New meaning in the message: noncoding RNAs and their role in retinal development. Dev Dyn 2009; 238: 2103–14. [DOI] [PubMed] [Google Scholar]
- 38. Huang MD, Chen WM, Qi FZ et al Long non‐coding RNA TUG1 is up‐regulated in hepatocellular carcinoma and promotes cell growth and apoptosis by epigenetically silencing of KLF2. Mol Cancer 2015; 14: 165. [DOI] [PMC free article] [PubMed] [Google Scholar]
- 39. Zhai HY, Sui MH, Yu X et al Overexpression of long non‐coding RNA TUG1 promotes colon cancer progression. Med Sci Monit 2016; 22: 3281–7. [DOI] [PMC free article] [PubMed] [Google Scholar]
- 40. Xie CH, Cao YM, Huang Y et al Long non‐coding RNA TUG1 contributes to tumorigenesis of human osteosarcoma by sponging miR‐9‐5p and regulating POU2F1 expression. Tumour Biol 2016; 37: 15031–41. [DOI] [PubMed] [Google Scholar]
- 41. Zhang Q, Geng PL, Yin P, Wang XL, Jia JP, Yao J. Down‐regulation of long non‐coding RNA TUG1 inhibits osteosarcoma cell proliferation and promotes apoptosis. Asian Pac J Cancer Prev 2013; 14: 2311–5. [DOI] [PubMed] [Google Scholar]
- 42. Cao J, Zhang Y, Yang J et al NEAT1 regulates pancreatic cancer cell growth, invasion and migration though mircroRNA‐335‐5p/c‐met axis. Am J Cancer Res 2016; 6: 2361–74. [PMC free article] [PubMed] [Google Scholar]
- 43. He D, Hong L, Guo W. The role low microRNA‐335 expression in prognosis prediction of human cancers. J Cancer Res Ther 2016; 12: 1070–4. [DOI] [PubMed] [Google Scholar]
- 44. Lu Y, Yang H, Yuan L et al Overexpression of miR‐335 confers cell proliferation and tumour growth to colorectal carcinoma cells. Mol Cell Biochem 2016; 412: 235–45. [DOI] [PubMed] [Google Scholar]
- 45. Luo Y, Tong L, Meng H et al MiR‐335 regulates the chemo‐radioresistance of small cell lung cancer cells by targeting PARP‐1. Gene 2016; 600: 9–15. [DOI] [PubMed] [Google Scholar]
- 46. Meng Y, Zou Q, Liu T, Cai X, Huang Y, Pan J. microRNA‐335 inhibits proliferation, cell‐cycle progression, colony formation, and invasion via targeting PAX6 in breast cancer cells. Mol Med Rep 2015; 11: 379–85. [DOI] [PubMed] [Google Scholar]
- 47. Wang K, Chen X, Zhan Y et al miR‐335 inhibits the proliferation and invasion of clear cell renal cell carcinoma cells through direct suppression of BCL‐W. Tumour Biol 2015; 36: 6875–82. [DOI] [PubMed] [Google Scholar]
- 48. Ergun S, Oztuzcu S. Oncocers: ceRNA‐mediated cross‐talk by sponging miRNAs in oncogenic pathways. Tumour Biol 2015; 36: 3129–36. [DOI] [PubMed] [Google Scholar]
- 49. Karreth FA, Pandolfi PP. ceRNA cross‐talk in cancer: when ce‐bling rivalries go awry. Cancer Discov 2013; 3: 1113–21. [DOI] [PMC free article] [PubMed] [Google Scholar]
- 50. Pilyugin M, Irminger‐Finger I. Long non‐coding RNA and microRNAs might act in regulating the expression of BARD1 mRNAs. Int J Biochem 2014; 54: 356–67. [DOI] [PubMed] [Google Scholar]
- 51. Xia T, Liao Q, Jiang X et al Long noncoding RNA associated‐competing endogenous RNAs in gastric cancer. Sci Rep 2014; 4: 6088. [DOI] [PMC free article] [PubMed] [Google Scholar]