

Abstract
Estradiol (E2) increases not only the cell growth but also the cancer stem cell (CSC) proportion in estrogen receptor (ER)‐positive breast cancer cells. It has been suggested that the non‐canonical hedgehog (Hh) pathway activated by E2 plays an important role in the regulation of CSC proportion in ER‐positive breast cancer cells. We studied anti‐CSC activity of a non‐canonical Hh inhibitor GANT61 in ER‐positive breast cancer cells. Effects of GANT61 on the cell growth, cell cycle progression, apoptosis and CSC proportion were investigated in four ER‐positive breast cancer cell lines. CSC proportion was measured using either the mammosphere assay or CD44/CD24 assay. Expression levels of pivotal molecules in the Hh pathway were measured. Combined effects of GANT61 with antiestrogens on the anti‐cell growth and anti‐CSC activities were investigated. E2 significantly increased the cell growth and CSC proportion in all ER‐positive cell lines. E2 increased the expression levels of glioma‐associated oncogene (GLI) 1 and/or GLI2. GANT61 decreased the cell growth in association with a G1‐S cell cycle retardation and increased apoptosis. GANT61 decreased the E2‐induced CSC proportion measured by the mammosphere assay in all cell lines. Antiestrogens also decreased the E2‐induced cell growth and CSC proportion. Combined treatments of GANT61 with antiestrogens additively enhanced anti‐cell growth and/or anti‐CSC activities in some ER‐positive cell lines. In conclusion, the non‐canonical Hh inhibitor GANT61 inhibited not only the cell growth but also the CSC proportion increased by E2 in ER‐positive breast cancer cells. GANT61 enhanced anti‐cell growth and/or anti‐CSC activities of antiestrogens in ER‐positive cell lines.
Keywords: Antiestrogen, breast cancer stem cells, estrogen, GANT61, hedgehog signaling pathway
Recent studies have indicated that there are cancer stem cell (CSC) populations in breast cancer and that the CSC play important roles in metastasis, recurrence, and resistance to anticancer drugs and radiation therapy. Eradication of the CSC might be key to obtaining a total cancer cell kill or to prolongation of successful anticancer therapy.1
Estrogen plays critical roles in the development and progression of breast cancer. Recent studies have indicated that estrogen increases not only the cell growth but also the CSC proportion in estrogen receptor (ER)‐positive breast cancer cells.2, 3, 4, 5 Increased CSC populations may induce the development of metastasis and resistance to endocrine therapy.6
Molecular action mechanisms responsible for the increase in the CSC proportion induced by 17β‐estradiol (E2) have been studied in recent years but remain to be elucidated. Sun et al. (2014) suggest that E2 directly binds to the promoter region of a pivotal effector of the hedgehog (Hh) signaling pathway, glioma‐associated oncogene (GLI) 1, increases GLI1 mRNA and protein expression, promotes the activity of GLI1 target genes and increases self‐renewal of CSC.4 To clarify this attractive hypothesis, we performed a preliminary study using four ER‐positive breast cancer cell lines. The results of the study revealed that E2 significantly increased the CSC proportion in association with an upregulation of GLI1 and/or GLI2 expression levels in all cell line tested.
The Hh signaling pathway plays an important role in tumor initiation and progression. Aberrant Hh signaling has been detected in various human cancers, including basal cell carcinoma and breast cancer. The Hh pathway is a complex signaling through both canonical and non‐canonical signaling pathways. Targeting Hh signaling has been recently investigated with canonical Hh inhibitors such as Smoothened (SMO) inhibitors. Resistance to the SMO inhibitors has already been observed in basal cell carcinoma patients. The most promising agent in this context is the GLI1/2 inhibitor GANT61, which has been investigated in various tumor types in recent years.7
Therefore, we conducted the present study to test the hypothesis that the non‐canonical Hh inhibitor GANT61 may decrease the GLI1/2 activation induced by E2 and decrease the CSC proportion in ER‐positive breast cancer cells. In addition, GANT61 is known to have substantial anti‐cell growth activity in various tumor types.7 Combined treatments of GANT61 with antiestrogens were also tested in ER‐positive breast cancer cells.
Materials and Methods
Reagents
GANT61 was obtained from CHEMSCENE, LLC (Monmouth Junction, NJ, USA). E2, an active metabolite of TAM, 4‐hydroxytamoxifen (OHT), and a steroidal antiestrogen, fulvestrant, were obtained from Sigma‐Aldrich (St. Louis, MO, USA).
Breast cancer cell lines and cell culture
KPL‐1 and KPL‐3C breast cancer cell lines were established in our laboratory. Their biological characteristics have been described elsewhere.8, 9 MCF‐7, T‐47D and MDA‐MB‐231 cell lines were kindly provided by the late Dr Robert B. Dickson (Lombardi Cancer Research Center, Washington, DC, USA). All cell lines were maintained in D‐MEM (Sigma) supplemented with 10% FBS. We and others previously demonstrated that MCF‐7 and T‐47D cells expressed high levels of ER‐α and progesterone receptor (PgR), and no detectable level of human epidermal growth factor receptor (HER) 2. KPL‐1 and KPL‐3C cells have been shown to express a lower level of ER‐α and no detectable level of either PgR or HER2. MDA‐MB‐231 cells express neither ER‐α nor HER2.
Antitumor activity
To investigate the effects of GANT61 and/or antiestrogens on the cell growth, breast cancer cells (1–5 × 10⁴ cells per well) were seeded on 24‐well plates (SB Medical, Tokyo, Japan) and grown in the D‐MEM supplemented with 10% FBS at 37°C in a 5% CO2 atmosphere for 2 days. After washing with PBS (Nissui, Tokyo, Japan), the cells were treated with an estrogen‐deprived medium consisting of phenol red‐free RPMI1640 (Life Technologies, Carlsbad, CA, USA) supplemented with 5% dextran‐coated charcoal‐treated FBS (Sigma‐Aldrich) plus 1 nM E2 and the indicated concentrations of GANT61 and/or antiestrogens for 3 days. After the treatments, the cells were harvested and counted with a Coulter counter (Coulter Electronics, Harpenden, UK). Reproducibility was confirmed in at least two separate experiments.
To evaluate the antitumor effects of combined treatments, a combination index based on the 50% inhibitory concentration (IC50) was calculated according to the following formula: combination index = IC50 with the combined treatment/IC50 with the single treatment. A combination index <0.5 was considered evidence of an additive interaction.5
Cell cycle and apoptosis assays
To investigate the effects of agents on cell cycle progression, harvested cells were stained with propidium iodide using the CycleTest Plus DNA Reagent Kit (Becton‐Dickinson, San Jose, CA, USA). Apoptotic cells were stained with an Annexin‐V‐FLUOS Staining Kit (Roche Diagnostics GmbH, Penzberg, Germany) according to the manufacturer's recommendations. Flow cytometry was performed with a FACSCalibur flow cytometer (Becton‐Dickinson), and the DNA histogram was analyzed using CELLQuest version 6.0 (Becton‐Dickinson). Reproducibility was confirmed in at least two separate experiments.
Cancer stem cell analysis by the CD44/CD24 assay
To analyze cell surface markers, harvested cells were treated with two fluorescence‐labeled antibodies: a PE‐conjugated anti‐CD24 antibody (clone G44‐26, Becton‐Dickinson), and FITC‐conjugated anti‐CD44 antibody (clone L5, Becton‐Dickinson). Flow cytometry was performed with a FACSCalibur flow cytometer (Becton‐Dickinson), and analyzed using CELLQuest Software version 6.0 (Becton‐Dickinson). Cells that express CD44‐high, and CD24‐negative or low were recognized as CSC.5
Cancer stem cell analysis by the mammosphere assay
Breast cancer cells (0.3–1.5 × 10⁵ cells per well) were seeded on 35‐mm dishes (SB Medical) and grown in D‐MEM supplemented with 10% FBS at 37°C in a 5% CO2 atmosphere for 2 days. After washing with PBS, cells were treated with the estrogen‐deprived medium supplemented with 1 nM E2 and the indicated concentrations of GANT61 and/or antiestrogens for 6 days. These cells were then dispersed, and single‐cell suspensions (5 × 10³ cells/well) were incubated in MammoCult Basal Medium (STEMCELL Technologies, Vancouver, Canada) supplemented with 10% MammoCult Proliferation Supplements (STEMCELL Technologies, Durham, NC, USA) in non‐adhesive 6‐well plates (Corning Inc., Corning, NY, USA) for 7 days. Mammospheres greater than 60 μm in size were counted with an Olympus phase‐contrast microscope.5
Cancer stem cell analysis by the ALDEFLUOR assay
The ALDEFLUOR Kit (STEMCELL Technologies) was used to isolate a cell population exhibiting strong aldehyde dehydrogenase (ALDH) activity. Harvested cells were suspended in ALDEFLUOR assay buffer containing ALDH substrate (BODIPYTM‐aminoacetaldehyde, 1 μmol/L per 1 × 10⁶ cells) and incubated at 37°C for 30 min. As a negative control, cells were treated with 50 mmol/L diethylaminobenzaldehyde, a specific ALDH inhibitor.5
RNA isolation and quantitative reverse‐transcription polymerase chain reaction
Cells were seeded at 2 × 10⁵ cells/well in 6‐well plates and incubated at 37°C to allow cell attachment. Then, the cells were treated with GANT61 for 3 days. After incubation, the total RNA from the cells was extracted using an RNeasy MiniKit (QIAGEN GmbH, Hilden, Germany), according to the manufacturer's instructions, and cDNA synthesis was performed with a ReverTra Ace qPCR RT Kit (TOYOBO, Tokyo, Japan). A quantitative real‐time PCR analysis of GLI1, GLI2, GLI3 and SHH mRNA was performed on cDNA using TaqMan gene expression assays according to the manufacturer's instructions (Applied Biosystems, Life Technologies, Waltham, MA, USA) and 7500 Real‐Time PCR Systems (Applied Biosystems). Each amplification reaction was performed in duplicate, and the average of the two threshold cycles was used to calculate the amount of transcripts in the sample. The mRNA quantification was expressed, in arbitrary units, as the ratio of the sample quantity to the calibrator or to the mean values of the control samples. All values were normalized to an endogenous control, ACTB.
Western blot analysis
Cells were lysed for protein extraction using Pierce RIPA Buffer with protease inhibitor and phosphatase inhibitor (Thermo Fisher Scientific, Waltham, MA, USA). The total protein concentration was measured using the Pierce BCA Protein Assay Kit (Thermo Fisher Scientific). Isolated proteins were separated by 5–20% SDS‐PAGE or 7.5% SDS‐PAGE and transferred to an Immobilon‐FL (Merck Millipore Corporation, Billerica, MA, USA) or transferred to an Amersham Hybond P PVDF 0.45 (GE Healthcare Japan, Tokyo, Japan). Membranes were blocked with Odyssey Blocking Buffer (LI‐COR Biosciences, Lincoln, NE, USA) or blocking buffer (5% BSA in 1 × Tris‐buffered Saline with 0.1% tween 20) at room temperature for 1 h and then subjected to immunoblots using primary antibodies at 4°C overnight, followed by an incubation with secondary antibodies at room temperature for 1 h. Labeled protein was visualized using the Odyssey CLx Imaging System (LI‐COR Biosciences) or ECL Prime Western Blotting Detection Reagent (GE Healthcare Japan) with the expression of β‐actin as the internal standard.
Rabbit polyclonal antibodies against GLI1, GLI2 and survivin were purchased from Cell Signaling Technologies (Danvers, MA, USA). Mouse polyclonal antibody against β‐actin was from Sigma Aldrich. Secondary antibodies, goat anti‐rabbit lgG‐HRP and goat anti‐mouse lgG‐HRP were purchased from Santa Cruz Biotechnology (Dallas, Texas, USA), and IRDye800CW Goat Anti‐Rabbit IgG and IRDye680RD Goat Anti‐Mouse IgG were purchased from LI‐COR Biosciences.
Statistical analysis
All values are expressed as the mean ± SE. Analysis of variance with StatView computer software (ATMS, Tokyo, Japan) was used to compare differences between two groups. A two‐sided P‐value less than 0.05 was considered significant.
Results
Effects of E2 on the cell growth, cancer stem cell proportion and mRNA levels of GLI1, GLI2 and GLI3
The treatment with 1 nM E2 significantly increased the cell growth in all ER‐positive breast cancer cell lines tested (Fig. 1a). It drastically increased the proportion of CD44high/CD24low cells in all cell lines (Fig. 1b). It significantly increased the number of mammospheres in all cell lines (Fig. 1c).
Figure 1.
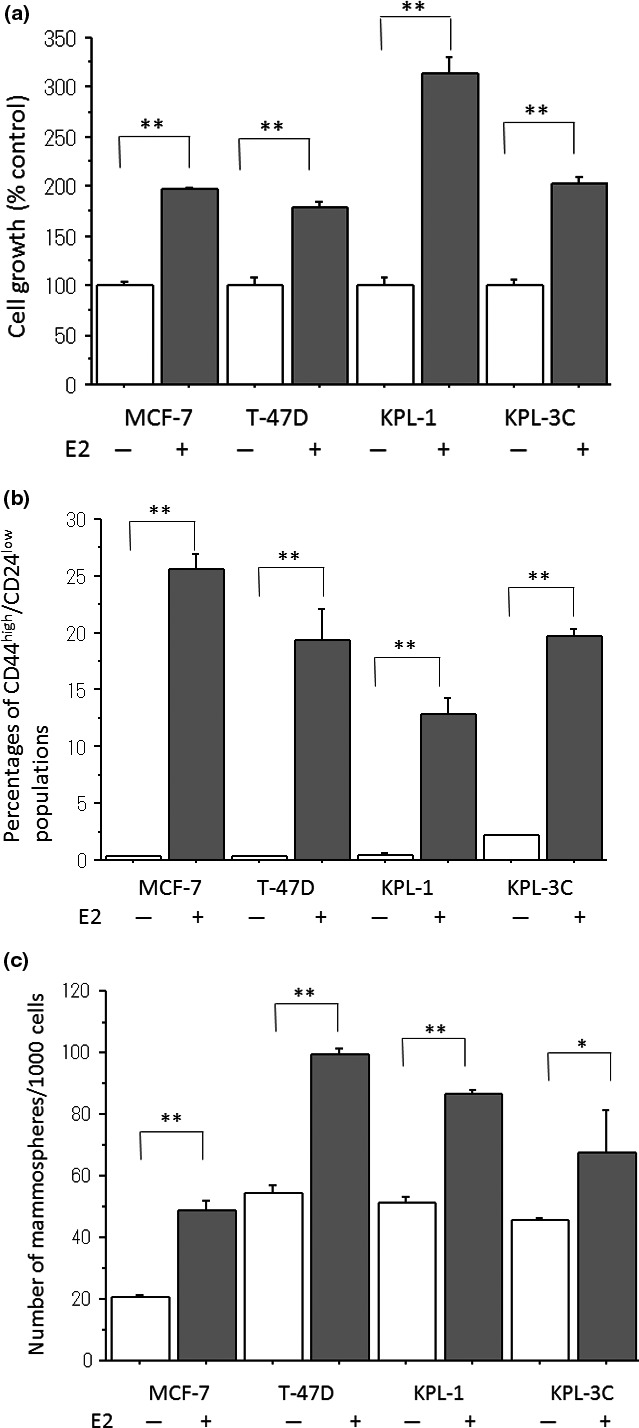
Effects of estradiol (E2) on the cell growth (a), the proportion of CD44high/CD24low cells (b) and the number of mammospheres (c) in four estrogen receptor (ER)‐positive breast cancer cell lines. All the cell lines were treated with the estrogen‐deprived medium plus minus 1 nM E2 for 3 days. (a) The cell numbers were measured using the Coulter counter. The values are expressed as the means ± SE of % control. (b) The proportion of CD44high/CD24low cells was measured as described in the Materials and Methods. The values are expressed as the means ± SE of the percentages of CD44high/CD24low cells. (c) The number of mammospheres/1000 cells seeded was measured as described in the Materials and Methods. The values are expressed as the means ± SE of the numbers of mammospheres/1000 cells. *P < 0.05; **P < 0.01 in comparison with the control.
The E2 treatment drastically increased the mRNA expression of GLI1 in all cell lines except for T‐47D cells (Fig. 2a). It significantly increased the mRNA expression of GLI2 in all cell lines except for MCF‐7 cells (Fig. 2b). It did not significantly change the mRNA expression of GLI3 in any cell lines (Fig. S1).
Figure 2.
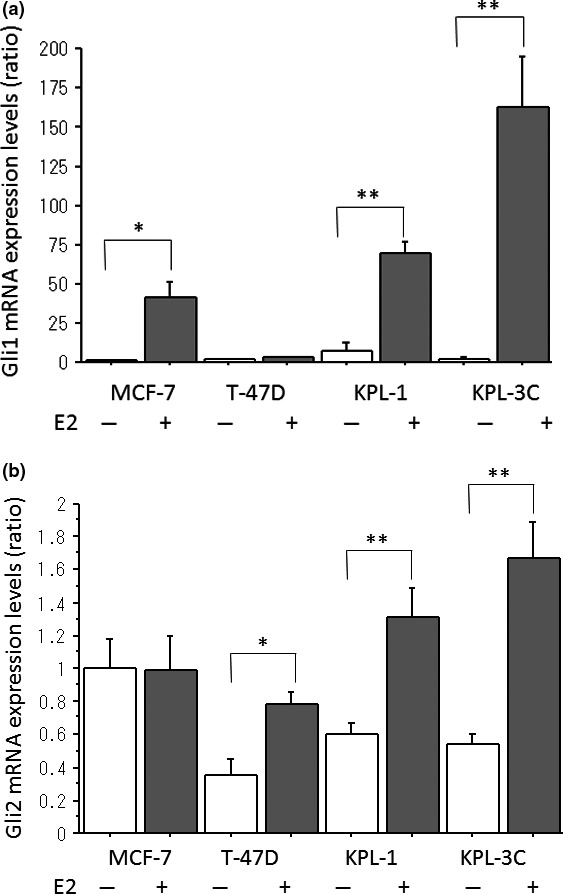
Effects of estradiol (E2) on the mRNA expression levels of GLI1 (a) and GLI2 (b) in four estrogen receptor (ER)‐positive breast cancer cell lines. All the cell lines were treated with the estrogen‐deprived medium plus minus 1 nM E2 for 3 days. The expression levels were measured as described in the Materials and Methods. The values were analyzed after normalization to the controls and expressed as the means ± SE. *P < 0.05; **P < 0.01 in comparison with the control.
Anti‐cell growth activity of GANT61
Although low concentrations (0.1–1 μM) of GANT61 did not inhibit the growth of any ER‐positive breast cancer cell lines tested under either an estrogen‐deprived or estrogen‐supplemented condition, high concentrations (5–20 μM) of GANT61 dose‐dependently inhibited their growth (Fig. 3a–d). The ER‐negative MDA‐MB‐231 cells were more sensitive to GANT61 (Fig. S2). The IC50 of the ER‐positive cell lines and MDA‐MB‐231 cell line under E2‐supplemented conditions are shown in Table S1.
Figure 3.
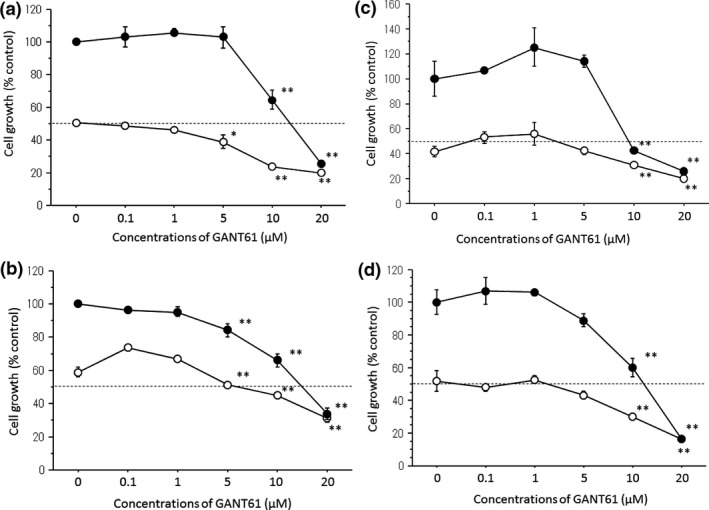
Anti‐cell growth effects of GANT61 in MCF‐7 (a), T‐47D (b), KPL‐1 (c) and KPL‐3C (d) cell lines. All the cell lines were treated with the estrogen‐deprived medium plus (●) or minus (○) 1 nM estradiol (E2) supplemented with 0–20 μM GANT61 for 3 days. The cell numbers were measured using the Coulter counter. The values are expressed as the means ± SE of % control. *P < 0.05; **P < 0.01 in comparison with the control.
Effects of GANT61 on cell cycle progression and apoptosis
GANT61 dose‐dependently increased the cell proportion at the G1 phase, decreased the cell proportion at the S phase and caused a G1‐S cell cycle retardation in all cell lines tested (Fig. 4a–d). In addition, GANT61 modestly increased apoptosis in all cell lines in association with suppression of an anti‐apoptotic effector, survivin expression (Figs S3 and S4).
Figure 4.
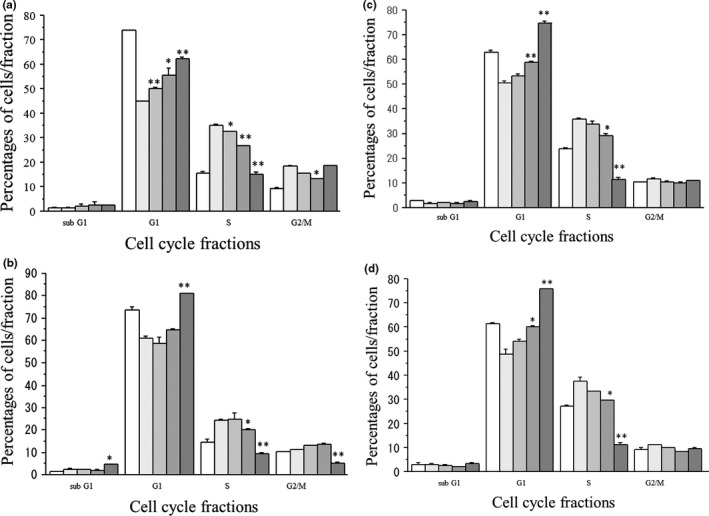
Effects of GANT61 (0–20 μM) on cell cycle progression in MCF‐7 cells (a), T‐47D cells (b), KPL‐1 cells (c) and KPL‐3C cells (d). Cells were treated with 1 nM estradiol (E2) and the indicated concentrations of GANT61 for 2 days. Percentages of cells at each cell cycle phase were analyzed as described in the Materials and Methods. The values are means ± SE. White bars, control; the most light grey bars, E2 plus 1 μM GANT61; the second light gray bars, E2 plus 5 μM GANT61; the third light gray bars, E2 plus 10 μM GANT61; and the most dark grey bars, E2 plus 20 μM GANT61. *P < 0.05; **P < 0.01 in comparison with cells treated with E2 alone.
Effects of GANT61 on the putative cancer stem cell proportions
E2 drastically increased the CSC proportion measured by the CD44/CD24 assay in all ER‐positive cell lines tested. GANT61 modestly decreased the CD44high/CD24low proportion in MCF‐7 cells but significantly increased that in T‐47D, KPL‐1 and KPL‐3C cells (Fig. 5a–d). Representative results of the CD44/CD24 assays are shown in Figure 5e.
Figure 5.
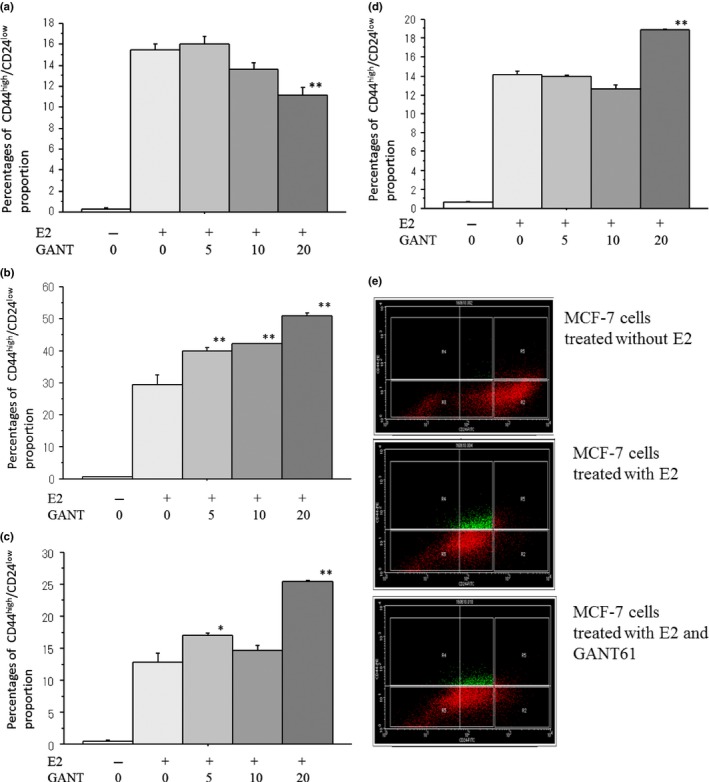
Effects of GANT61 (0–20 μM) on the proportion of CD44high/CD24low cells in MCF‐7 cells (a), T‐47D cells (b), KPL‐1 cells (c) and KPL‐3C cells (d). Cells were treated with 1 nM E2 and the indicated concentrations of GANT61 for 3 days. Percentages of CD44high/CD24low cells were analyzed as described in the Materials and Methods. The values are means ± SE. White bars, control; the most light grey bars, E2 plus 1 μM GANT61; the second light gray bars, E2 plus 5 μM GANT61; the third light gray bars, E2 plus 10 μM GANT61; and the most dark grey bars, E2 plus 20 μM GANT61. *P < 0.05; **P < 0.01 in comparison with cells treated with E2 alone. In addition, representative results of the CD44high/CD24low assay in MCF‐7 cells treated with or without E2 plus minus 10 μM GANT61 are shown in (e).
Estradiol significantly increased the CSC proportion measured by the mammosphere assay in all cell lines. GANT61 dose‐dependently decreased the number of mammospheres in all cell lines (Fig. 6a–d). Representative results of the mammosphere assays are shown in Figure 6e.
Figure 6.
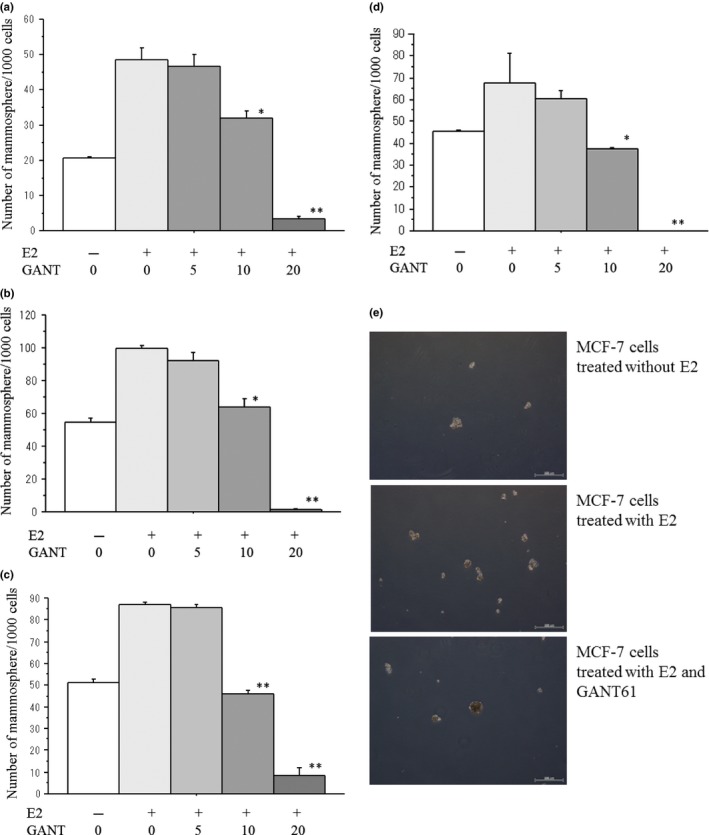
Effects of GANT61 (0–20 μM) on the number of mammpspheres/1000 cells seeded in MCF‐7 cells (a), T‐47D cells (b), KPL‐1 cells (c) and KPL‐3C cells (d). Cells were treated with 1 nM E2 and the indicated concentrations of GANT61 for 6 days. The number of mammospheres/1000 cells was analyzed as described in the Materials and Methods. The values are means ± SE. White bars, control; the most light grey bars, E2 plus 1 μM GANT61; the second light gray bars, E2 plus 5 μM GANT61; the third light gray bars, E2 plus 10 μM GANT61; and the most dark grey bars, E2 plus 20 μM GANT61. *P < 0.05; **P < 0.01 in comparison with cells treated with E2 alone. In addition, representative results of the mammosphere assay in MCF‐7 cells treated with or without E2 plus minus 10 μM GANT61are shown in (e).
Unexpectedly, E2 significantly decreased the CSC proportion measured by the ALDEFLUOR assay in most ER‐positive cell lines tested. GANT 61 modestly decreased the ALDH1‐positive proportion in all cell lines (Fig. S5a–d).
Effects of GANT61 on the mRNA expression levels of Hh signaling molecules
E2 and GANT61 differentially regulated the expression levels of Hh signaling molecules in the ER‐positive breast cancer cell lines. In MCF‐7 cells, E2 significantly increased GLI1 expression but not GLI2 and SHH expressions (Fig. 7a–c and Fig. S6). GANT61 dose‐dependently decreased GLI1 expression induced by E2 (Fig. 7a and Fig. S6). In T‐47D cells, E2 significantly increased GLI2 and SHH expressions but not GLI1 expression (Fig. 7d–f). GANT61 dose‐dependently decreased expression levels of GLI2 and SHH induced by E2 (Fig. 7e,f). In KPL‐1 cells, E2 significantly increased expression levels of GLI1, GLI2 and SHH (Fig. 7g–i). GANT61 dose‐dependently decreased expression levels of GLI1, GLI2 and SHH (Fig. 7g–i). In KPL‐3C cells, E2 significantly increased expression levels of GLI1, GLI2 and SHH (Fig. 7j–l). GANT61 dose‐dependently decreased expression levels of GLI1 and SHH but not GLI2 (Fig.7j–l). The influences of GANT61 on the expression levels of Hh signaling molecules increased by E2 are summarized in the Table 1.
Figure 7.
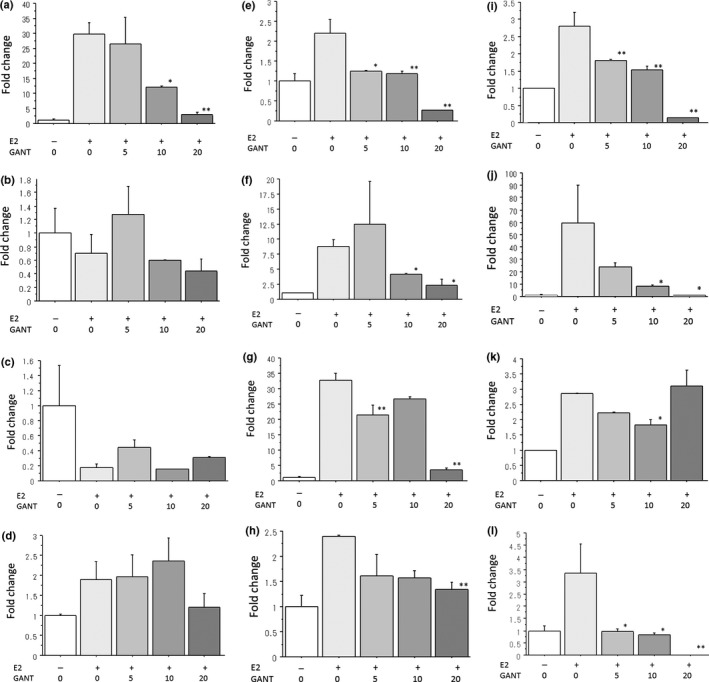
Effects of GANT61 (0–20 μM) on the mRNA expression levels of GLI1, GLI2 and SHH in MCF‐7 cells (a–c), T‐47D cells (d–f), KPL‐1 cells (g–i) and KPL‐3C cells (j,l). Cells were treated with 1 nM E2 and the indicated concentrations of GANT61 for 3 days. The expression levels were measured as described in the Materials and Methods. The values were analyzed after normalization to the controls and expressed as the means ± SE. White bars, control; the most light grey bars, E2 plus 1 μM GANT61; the second light gray bars, E2 plus 5 μM GANT61; the third light gray bars, E2 plus 10 μM GANT61; and the most dark grey bars, E2 plus 20 μM GANT61. *P < 0.05; **P < 0.01 in comparison with cells treated with E2 alone.
Table 1.
Summary of the changes in the mRNA expression levels of GLI1, GLI2 and SHH in four estrogen receptor (ER)‐positive cell lines after the treatments with E2 and GANT61
| MCF‐7 | T‐47D | KPL‐1 | KPL‐3C | |
|---|---|---|---|---|
| GLI1 | ↓a | NA | ↓ | ↓ |
| GLI2 | NA | ↓ | ↓ | NC |
| SHH | NA | ↓ | ↓ | ↓ |
NA, not applicable; NC, no change. Cells were treated with 1 nM E2 and the indicated concentrations of GANT61 for 3 days. *Significantly decreased.
Combined anti‐cell growth activity of GANT61 with antiestrogens
To investigate the possible synergistic anti‐cell growth activity of GANT61 and the antiestrogen, 4‐OHT or fulvestrant, all cell lines were treated with the estrogen‐deprived medium supplemented with 1 nM E2 plus the indicated concentration of 4‐OHT or fulvestrant and 0–20 μM GANT61 for 3 days. The indicated concentrations of the antiestrogens were selected according to the experimental results obtained with cells treated with the estrogen‐deprived medium supplemented with 1 nM E2 plus various concentrations of antiestrogens.
The combined treatments of 4‐OHT or fulvestrant with GANT61 showed a modestly additive anti‐cell growth interaction in MCF‐7, T‐47D and KPL‐1 cells but not in KPL‐3C cells (Fig. 8a–h and Table 2). A significant additive interaction (the combination index was less than 0.5) between antiestrogens and GANT61 was observed in T‐47D and KPL‐1 cells (Table 2). In contrast, no additive interaction was observed in MDA‐MB‐231 cells (Fig. S7 and Table 2). The combined treatments of 4‐OHT or fulvestrant with GANT61 also showed an additive interaction in the G1 arrest in all cell lines and in the induction of apoptosis in MCF‐7 and T‐47D cell lines (Fig. S8).
Figure 8.
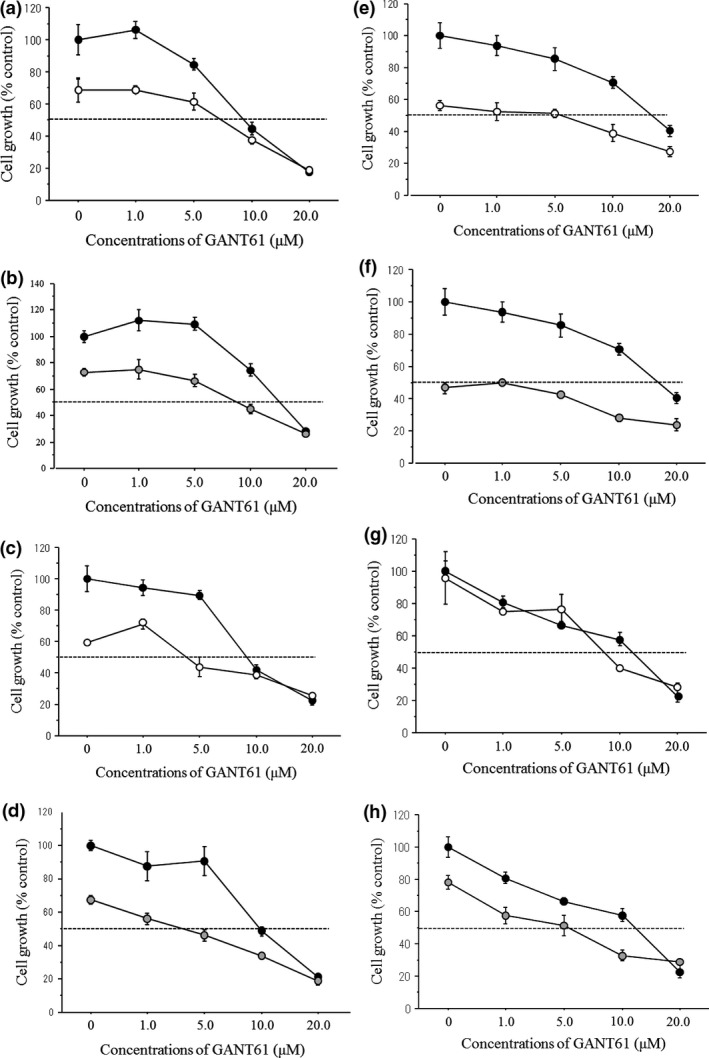
Growth inhibitory curves of the combined treatments of GANT61 with antiestrogens under the E2‐supplemented condition in MCF‐7 cells (a,b), T‐47D cells (c,d), KPL‐1 cells (e,f), and KPL‐3C cells (g,h). Cells were treated with GANT61 (0–20 μM) and the antiestrogen, 4‐OHT (0.05 or 0.1 μM) or fulvestrant (0.025–0.1 μM), for 3 days. The values are means ± SE. Closed circles, E2; open circles, E2 plus 4‐OHT; and gray circles, E2 plus fulvestrant.
Table 2.
The combination index of GANT61 with 4‐OHT or fulvestrant for four estrogen receptor (ER)‐positive breast cancer cell lines and an ER‐negative MDA‐MB‐231 cell line
| Cell lines | 4‐OHT | Fulvestrant |
|---|---|---|
| MCF‐7 | 0.63 ± 0.10 | 0.58 ± 0.19 |
| T‐47D | 0.40 ± 0.25 | 0.58 ± 0.24 |
| KPL‐1 | 0.48 ± 0.30 | 0.17 ± 0.11 |
| KPL‐3C | 0.93 ± 0.17 | 0.87 ± 0.17 |
| MDA‐MB‐231 | 0.72 ± 0.14 | 1.02 ± 0.13 |
Combined anti‐cancer stem cell activity of GANT61 and antiestrogens
Antiestrogens, 4‐OHT and fulvestrant modestly decreased the CSC proportion measured by the mammosphere assay in all cell lines tested except for the MCF‐7 cell line (Fig. 9a–d). GANT61 and antiestrogens additively decreased the CSC proportion measured by the mammosphere assay in MCF‐7 and KPL‐1 cell lines but not T‐47D and KPL‐3C cell lines (Fig. 9a–d).
Figure 9.
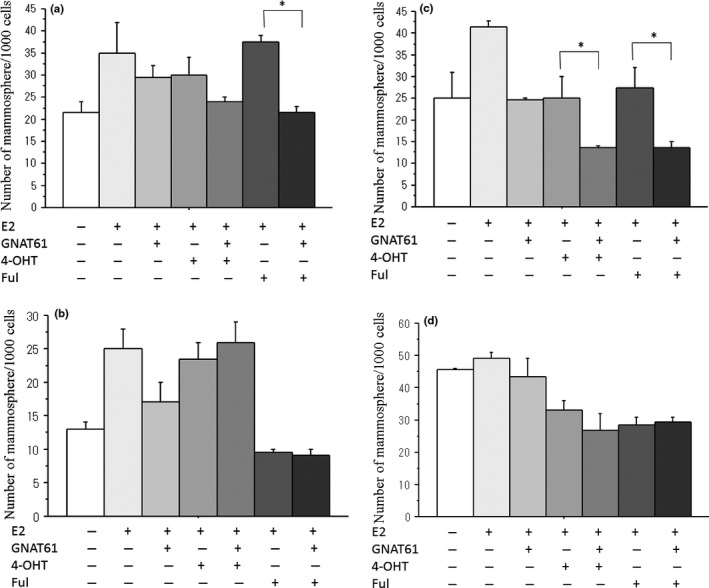
Effects of GANT61 and antiestrogens on the number of mammospheres in MCF‐7 cells (a), T‐47D cells (b), KPL‐1 cells (c) and KPL‐3C cells (d). Cells were treated with 1 nM E2 and 10 μM GANT61 plus antiestrogen, 4‐OHT (0.05 or 0.1 μM) or fulvestrant (0.025–0.1 μM) for 6 days. The number of mammospheres was analyzed as described in the Materials and Methods. The values are means ± SE. White bars, control; the most light grey bars, E2 alone; the second light gray bars, E2 plus GANT61; the third light gray bars, E2 plus 4‐OHT; the fourth light bars, E2 plus 4‐OHT and GANT61; the fifth light bars, E2 plus fulvestrant; and the most dark grey bars, E2 plus fulvestrant and GANT61. *P < 0.05; **P < 0.01 in comparison with cells treated with E2 plus 4‐OHT or fulvestrant.
The effects of this combination on the expression levels of GLI1 were also investigated in MCF‐7 and KPL‐1 cell lines. GANT61 and antiestrogens significantly decreased GLI1 mRNA expressions, and their combinations additively decreased the GLI1 expressions in MCF‐7 cells (Fig. S9a). Antiestrogens significantly decreased GLI1 mRNA expressions, but their combinations did not additively decreased GLI1 mRNA expressions in KPL‐1 cells (Fig. S9b).
Discussion
Several preclinical studies using the non‐canonical Hh inhibitor GANT61 as an anticancer agent have indicated that this agent targets almost all of the classical hallmarks of cancer (i.e. cell viability, proliferation, apoptosis, DNA damage repair, epithelial–mesenchymal transition, autophagy, CSC and immune response) in various types of malignancies, including breast cancer.7 A recent study revealed that GANT61 inhibited the growth of various breast cancer cell lines in vitro and in vivo.10 However, an anti‐cell growth effect of GANT61 on the increased cell growth by E2 in ER‐positive breast cancer cells has never been reported. Furthermore, the effect of GANT61 on the proportion of CSC induced by E2 in ER‐positive breast cancer cells has never been reported. The results of the present study have shown for the first time that GANT61 significantly inhibited the increased cell growth and CSC proportion by E2 in ER‐positive breast cancer cells.
The Hh pathway plays important roles in controlling cell proliferation, cell fate and patterning, and stem cell maintenance, self‐renewal and tissue repair.11, 12 The Hh signaling is transduced by two distinct mechanisms, known as the canonical and non‐canonical pathways. The canonical pathway depends on the interaction between Hh ligands such as SHH from the secreting cells and the Patched receptor on the other cells. This interaction releases the Patched‐mediated inhibition of the SMO complex, initiating signal transduction in the receiving cells. This results in release of the activated form of GLI acting as a transcriptional regulator. In addition to the canonical Hh signaling pathway, a non‐canonical Hh pathway was recently reported.13, 14 This mechanism involves activation of the Hh pathway components by other signaling cascades such as oncogenic pathways.7
Sun et al. (2014) suggested that E2 activates the Hh signaling through the non‐canonical pathway in ER‐positive breast cancer cells. According to their study results, E2 directly binds to the promoter region of the GLI1 gene, increases GLI1 expression, promotes the activity of GLI1 target genes and increases self‐renewal of CSC.4 These findings prompted us to test whether a non‐canonical Hh inhibitor GANT61 can suppress the increased CSC proportion by E2 in ER‐positive breast cancer cells.
The results of the present study have shown that E2 drastically increased the cell growth and CSC proportion in association with an increase in the expression levels of Hh signaling molecules, SHH, GLI1 and/or GLI2 in ER‐positive breast cancer cell lines (Figs 1 and 2, and Fig. S1). More importantly, GANT61 dose‐dependently decreased the CSC proportion induced by E2 in association with a decrease in the expression levels of SHH, GLI1 and/or GLI2 induced by E2 in these cell lines (Fig. 7 and Table 1). These findings strongly support the hypothesis that a non‐canonical Hh inhibitor GANT61 can suppress the increased CSC proportion induced by E2 in ER‐positive breast cancer cells.
We used three different methods, the CD44/CD24 assay, the ALDEFLUOR assay and the mammosphere assay, to detect and quantitate the putative CSC proportion in the present study. E2 increased the putative CSC proportion measured by the CD44/CD24 assay by approximately 20‐fold (Fig. 1b). In contrast, E2 significantly decreased the ALDH1‐positive proportion measured by the ALDEFLUOR assay (Fig. S5a–d), and E2 increased the number of mammospheres by approximately twofold (Fig. 1c). Surprisingly, GANT61 decreased the putative CSC proportion measured by the mammosphere assay or ALDEFLUOR assay but increased the putative CSC proportion measured by the CD44/CD24 assay (Figs 5 and 6, and Fig. S5a–d). Based on these results, it should be concluded that these three different methods may detect and quantitate three distinct cell populations.15 It has been well known that different CSC assays detect different CSC‐like cell populations.16 Therefore, inconsistent results could be expected using different CSC assays. We believe that the mammosphere assay which measures ability of self‐renewal of cells is more important in terms of the CSC function than either the CD44/CD24 assay or ALDEFLUOR assay. Further studies are needed to elucidate the difference in biological characteristics of these three cell populations detected by the three different methods.
GANT61 was discovered in a cell‐based screening system for small molecule inhibitors of GLI‐mediated transcription. GANT61 has been shown to selectively inhibit both GLI1 and GLI2‐mediated gene transactivation.17 In the present study, GANT61 differentially decreased the expression levels of GLI1 and/or GLI2 but not GLI3 in the respective cell lines (Fig. 7 and Table 1). GANT61 has been demonstrated to decrease both gene and protein expression of the target genes GLI1 and Patched 1 and to reduce the transcriptional output using GLI reporter assays in various cell types.17, 18, 19, 20, 21
The cytotoxic effect of GANT61 has been investigated in a number of cancer cell types, with the IC50 values ranging from 5 to 15 μM in most cancer cell lines.7 In line with the reported results, the IC50s of GANT61 for four ER‐positive breast cancer cell lines tested were approximately 10 μM in the present study. It has been indicated that GANT61 inhibits proliferation by its effects on cell cycle progression. Several independent studies have shown that GANT61 induces a G1 arrest, consistent with decreased expression levels of the Hh target Cyclin D and/or increased expression levels of p21.20, 22, 23 In the present study, GANT61 was shown to dose‐dependently induce a G1‐S cell cycle retardation in ER‐positive breast cancer cell lines (Fig. 4). It is also suggested that inhibition of Hh signaling can cause apoptosis either through activation of Fas signaling24 or through decreasing protein levels of the anti‐apoptotic Bcl‐225 or survivin.26 As expected, GANT61 dose‐dependently increased apoptosis in ER‐positive breast cancer cell lines in the present study (Figs S3 and S4).
Several studies have indicated that the Hh signaling plays a key role in the regulation of CSC, by controlling the transcription of a number of genes implicated in cell fate determination and stemness features.27, 28, 29 Moreover, a recent study has revealed that E2 activates the Hh signaling through the non‐canonical pathway, increases GLI1 expression, promotes the activity of GLI1 target genes and increases self‐renewal of CSC.4 The results of the present study strongly support this hypothesis; that is, E2 regulates CSC maintenance through the non‐canonical Hh pathway in ER‐positive breast cancer cells. In addition, two recent studies have shown important roles of the non‐canonical Hh pathway to regulate breast CSC in other subtypes of breast cancer. Colavito et al. show that non‐canonical activation of GLI1 induced by the nuclear factor kappa‐light‐chain‐enhancer of activated B cells pathway was involved in the maintenance of CSC in claudin‐low breast cancer cell lines.30 Han et al.31 indicate that non‐canonical activation of GLI2 induced by forkhead box C1 regulated CSC properties in basal‐like breast cancer cells. These findings suggest that the non‐canonical Hh pathway may be a common player in the regulation of breast CSC.
It has been suggested that breast CSC play a certain role in the development of resistance to endocrine therapy in breast cancer.6 We hypothesized that a combined treatment with an antiestrogen and a CSC‐regulating agent GANT61 may render an additive/synergistic anti‐cancer effect on ER‐positive breast cancer cells. As expected, combined treatments of GANT61 with antiestrogens, 4‐OHT and fulvestrant additively inhibited the growth of three out of four ER‐positive breast cancer cell lines tested in the present study (Fig. 8 and Table 2). It is well known that antiestrogens block an E2‐triggering ER signaling pathway and result in a G1 arrest and induction of apoptosis in ER‐positive breast cancer cells. GANT61 alone provided ER‐positive breast cancer cell lines with a G1 arrest and induction of apoptosis in a dose‐dependent manner in the present study (Fig. 4, and Figs S3 and S4). In fact, the combined treatments with antiestrogens and GANT61 showed an additive interaction in terms of the G1 arrest and induction of apoptosis in a part of ER‐positive breast cancer cell lines tested in the present study (Fig. S8). Further studies such as using antiestrogen‐resistant breast cancer cell lines are needed to clarify the hypothesis that a combined treatment of GANT61 with antiestrogens may overcome endocrine resistance in breast cancer cells. However, the results of the present study suggested for the first time that a combined treatment with antiestrogens and GANT61 may render an additive anti‐cancer activity in ER‐positive breast cancers. These results warrant a possible introduction of GANT61 or other non‐canonical Hh inhibitors into clinical use in the near future.
The combined treatments with antiestrogens and GANT61 did not additively reduce the proportion of CSC in all ER‐positive breast cancer cells tested in the present study (Fig. 9). However, these combinations additively decreased the GLI1 mRNA expressions and decreased the CSC proportion measured by the mammmosphere assay only in MCF‐7 cells (Fig. S9a and Fig. 9a). This result does not totally coincide with the additive anti‐cancer effects of the combined treatments. It can be speculated that molecular action mechanisms responsible for anti‐cell growth and anti‐CSC effects for antiestrogens and GANT61 may be different.
In conclusion, the results of the present study strongly support the hypothetical action mechanism responsible for the increase in the CSC proportion by E2 to be mediated through the non‐canonical Hh signaling pathway. GANT61 downregulated the expression levels of GLI1, GLI2 and/or SHH, and decreased the CSC proportion induced by E2 in the ER‐positive breast cancer cell lines. GANT61 also inhibited the growth of the cell lines in association with a G1 arrest and induction of apoptosis. Combined treatments of GANT61 with antiestrogens additively inhibited the cell growth and enhanced the reduction in the CSC proportion in a part of ER‐positive breast cancer cell lines tested. These findings suggest for the first time that non‐canonical Hh inhibitors may be active as therapeutics in the treatment of patients with ER‐positive breast cancer.
Disclosure Statement
J. Kurebayashi received advisory/consultation fees and research funding from Takeda Pharmaceutical. J. Kurebayashi received research funding from Takeda Pharmaceutical, Esai, Chugai and AstraZeneca Pharmaceuticals. The other authors have no conflict of interest to declare.
Supporting information
Fig. S1. Effects of E2 on the mRNA expression levels of GLI3 in four ER‐positive breast cancer cell lines.
Fig. S2. Anti‐cell growth effects of GANT61 in the ER‐negative MDA‐MB‐231 cell line.
Fig. S3. Effects of GANT61 (0–20 μM) on apoptosis in MCF‐7 cells (a), T‐47D cells (b), KPL‐1 cells (c) and KPL‐3C cells (d). Cells were treated with 1 nM E2 and the indicated concentrations of GANT61 for 2 days. Percentages of apoptotic cells were analyzed as described in the Materials and Methods. The values are means ± SEs. White bars, control; the most light grey bars, E2 plus 1 μM GANT61; the second light gray bars, E2 plus 5 μM GANT61; the third light gray bars, E2 plus 10 μM GANT61; and the most dark grey bars, E2 plus 20 μM GANT61. * P < 0.05; **P < 0.01 in comparison with cells treated with E2 alone.
Fig. S4. Effects of E2 and GANT61 on the protein expression levels of survivin in MCF‐7 cells. The expression levels were measured with a western blotting as described in the Materials and Methods.
Fig. S5. Effects of E2 and GANT61 on the proportion of ALDH1‐positive cells in MCF‐7 cells (a), T‐47D cells (b), KPL‐1 cells (c) and KPL‐3C cells (d). The proportion was measured by the Aldefluor assay as described in the Materials and Methods.
Fig. S6. Effects of E2 and GANT61 on the protein expression levels of GLI1 and GLI2 in MCF‐7 cells. The expression levels were measured with a western blotting as described in the Materials and Methods.
Fig. S7. Growth inhibitory curves of the combined treatments of GANT61 with antiestrogens, 4‐OHT (a) and fulvestrant (b), under the E2‐supplemented condition in the MDA‐MB‐231 cells.
Fig. S8. Effects of combined treatments of GANT61 with antiestrogens on cell cycle progression and apoptosis in MCF‐7 cells (a, b), T‐47D cells (c, d), KPL‐1 cells (e, f), and KPL‐3C cells (g, h). Cells were treated with GANG61 (0–20 μM) and the antiestrogen, 4‐OHT (0.05 or 0.1 μM) or fulvestrant (0.025–0.1 μM), for 2 days. Percentages of cells at each cell cycle phase were analyzed as described in the Materials and Methods. Percentages of apoptotic cells were analyzed as described in the Materials and Methods. The values are means ± SEs. White bars, control; the most light grey bars, E2 alone; the second light gray bars, E2 plus GANT61; the third light gray bars, E2 plus 4‐OHT; the fourth light bars, E2 plus 4‐OHT and GANT61; the fifth light bars, E2 plus fulvestrant; and the most dark grey bars, E2 plus fulvestrant and GANT61. * P < 0.05; **P < 0.01 in comparison with cells treated with E2 plus 4‐OHT or fulvestrant.
Fig. S9. Effects of GANT61 and antiestrogens on the expression levels of GLI1 in MCF‐7 cells (a) and KPL‐1 cells (b). Cells were treated with 1 nM E2 and 10 μM GANT61 plus antiestrogen, 4‐OHT (0.05 or 0.1 μM) or fulvestrant (0.025–0.1 μM) for 3 days. The GLI1 expression levels were analyzed as described in the Materials and Methods. The values are means ± SEs. White bars, control; the most light grey bars, E2 alone; the second light gray bars, E2 plus GANT61; the third light gray bars, E2 plus 4‐OHT; the fourth light bars, E2 plus 4‐OHT and GANT61; the fifth light bars, E2 plus fulvestrant; and the most dark grey bars, E2 plus fulvestrant and GANT61. * P < 0.05; **P < 0.01 in comparison with cells treated with E2 plus 4‐OHT or fulvestrant.
Table S1. ER‐positivity and the IC50s of GANT61 in four ER‐positive breast cancer cell lines and an ER‐negative MDA‐MB‐231 cell line. All the cell lines were treated with the estrogen‐deprived medium plus 1 nM E2 supplemented with 0–20 μM GANT61 for 3 days. The values are expressed as the means ± SEs (μM).
Acknowledgments
We thank Dr. Yasumitsu Nishimura of the Department of Hygiene, Kawasaki Medical School for his technical advice. We also thank Mrs. Kaoru Tsuboi and Ms. Megumi Ogo for their technical assistance. This work was supported by Research Project Grants from Kawasaki Medical School (26‐5 and 27‐1) and the Ministry of Education, Culture, Sports, Science, and Technology, Japan (26461964).
Cancer Sci 108 (2017) 918–930
Funding Information
This work was supported by Research Project Grants from Kawasaki Medical School (26‐5 and 27‐1) and the Ministry of Education, Culture, Sports, Science, and Technology, Japan (26461964).
References
- 1. Liu S, Wicha MS. Targeting breast cancer stem cells. J Clin Oncol 2010; 28: 4006–12. [DOI] [PMC free article] [PubMed] [Google Scholar]
- 2. Fillmore CM, Gupta PB, Rudnick JA et al Estrogen expands breast cancer stem‐like cells through paracrine FGF/Tbx3 signaling. Proc Natl Acad Sci U S A 2010; 107: 21737–42. [DOI] [PMC free article] [PubMed] [Google Scholar]
- 3. Deng H, Zhang XT, Wang ML, Zheng HY, Liu LJ, Wang ZY. ER‐α36‐mediated rapid estrogen signaling positively regulates ER‐positive breast cancer stem/progenitor cells. PLoS ONE 2014; 9: e88034. [DOI] [PMC free article] [PubMed] [Google Scholar]
- 4. Sun Y, Wang Y, Fan C et al Estrogen promotes stemness and invasiveness of ER‐positive breast cancer cells through GLI1 activation. Mol Cancer 2014; 13: 137. [DOI] [PMC free article] [PubMed] [Google Scholar]
- 5. Kurebayashi J, Kanomata N, Yamashita T, Shimo T, Moriya T. Antitumor and anticancer stem cell activities of eribulin mesylate and antiestrogens in breast cancer cells. Breast Cancer 2016; 23: 425–36. [DOI] [PubMed] [Google Scholar]
- 6. O'Brien CS, Farnie G, Howell SJ, Clarke RB. Breast cancer stem cells and their role in resistance to endocrine therapy. Horm Cancer 2011; 2: 91–103. [DOI] [PMC free article] [PubMed] [Google Scholar]
- 7. Gonnissen A, Isebaert S, Haustermans K. Targeting the hedgehog signaling pathway in cancer: beyond Smoothened. Oncotarget 2015; 6: 13899–913. [DOI] [PMC free article] [PubMed] [Google Scholar]
- 8. Kurebayashi J, Kurosumi M, Sonoo H. A new human breast cancer cell line, KPL‐1 secretes tumour‐associated antigens and grows rapidly in female athymic nude mice. Br J Cancer 1995; 71: 845–53. [DOI] [PMC free article] [PubMed] [Google Scholar]
- 9. Kurebayashi J, Kurosumi M, Sonoo H. A new human breast cancer cell line, KPL‐3C, secretes parathyroid hormone‐related protein and produces tumours associated with microcalcifications in nude mice. Br J Cancer 1996; 74: 200–7. [DOI] [PMC free article] [PubMed] [Google Scholar]
- 10. Benvenuto M, Masuelli L, De Smaele E et al In vitro and in vivo inhibition of breast cancer cell growth by targeting the Hedgehog/GLI pathway with SMO (GDC‐0449) or GLI (GANT‐61) inhibitors. Oncotarget 2016; 7: 9250–70. [DOI] [PMC free article] [PubMed] [Google Scholar]
- 11. Moraes RC, Zhang X, Harrington N et al Constitutive activation of Smoothened (Smo) in mammary glands of transgenic mice leads to increased proliferation, altered differentiation and ductal dysplasia. Development 2007; 134: 1231–42. [DOI] [PubMed] [Google Scholar]
- 12. Lewis MT, Ross S, Strickland PA et al Defects in mouse mammary gland development caused by conditional haploinsufficiency of Patched‐1. Development 1999; 126: 5181–93. [DOI] [PubMed] [Google Scholar]
- 13. Brennan D, Chen X, Cheng L, Mahoney M, Riobo NA. Noncanonical hedgehog signaling. Vitam Horm 2012; 88: 55–72. [DOI] [PMC free article] [PubMed] [Google Scholar]
- 14. Malhotra GK, Zhao X, Band H, Band V. Shared signaling pathways in normal and breast cancer stem cells. J Carcinog 2011; 10: 38. [DOI] [PMC free article] [PubMed] [Google Scholar]
- 15. Badve S, Nakshatri H. Breast‐cancer stem cells‐beyond semantics. Lancet Oncol 2012; 13: e43–8. [DOI] [PubMed] [Google Scholar]
- 16. Shao J, Fan W, Ma B, Wu Y. Breast cancer stem cells expressing different stem cell markers exhibit distinct biological characteristics. Mol Med Rep 2016; 14: 4991–8. [DOI] [PMC free article] [PubMed] [Google Scholar]
- 17. Lauth M, Bergström A, Shimokawa T, Toftgård R. Inhibition of GLI‐mediated transcription and tumor cell growth by small‐molecule antagonists. Proc Natl Acad Sci U S A 2007; 104: 8455–60. [DOI] [PMC free article] [PubMed] [Google Scholar]
- 18. You M, Varona‐Santos J, Singh S, Robbins DJ, Savaraj N, Nguyen DM. Targeting of the hedgehog signal transduction pathway suppresses survival of malignant pleural mesothelioma cells in vitro . J Thorac Cardiovasc Surg 2014; 147: 508–16. [DOI] [PubMed] [Google Scholar]
- 19. Desch P, Asslaber D, Kern D et al Inhibition of GLI, but not Smoothened, induces apoptosis in chronic lymphocytic leukemia cells. Oncogene 2010; 29: 4885–95. [DOI] [PubMed] [Google Scholar]
- 20. Wickstrom M, Dyberg C, Shimokawa T et al Targeting the hedgehog signal transduction pathway at the level of GLI inhibits neuroblastoma cell growth in vitro and in vivo . Int J Cancer 2013; 132: 1516–24. [DOI] [PubMed] [Google Scholar]
- 21. Fu J, Rodova M, Roy SK et al GANT‐61 inhibits pancreatic cancer stem cell growth in vitro and in NOD/SCID/IL2R gamma null mice xenograft. Cancer Lett 2013; 330: 22–32. [DOI] [PMC free article] [PubMed] [Google Scholar]
- 22. Mazumdar T, Sandhu R, Qadan M et al Hedgehog signaling regulates telomerase reverse transcriptase in human cancer cells. PLoS ONE 2013; 8: e75253. [DOI] [PMC free article] [PubMed] [Google Scholar]
- 23. Srivastava RK, Kaylani SZ, Edrees N et al GLI inhibitor GANT‐61 diminishes embryonal and alveolar rhabdomyosarcoma growth by inhibiting SHh/AKT‐mTOR axis. Oncotarget 2014; 5: 12151–65. [DOI] [PMC free article] [PubMed] [Google Scholar]
- 24. Yan R, Peng X, Yuan X et al Suppression of growth and migration by blocking the hedgehog signaling pathway in gastric cancer cells. Cell Oncol (Dordr) 2013; 36: 421–35. [DOI] [PubMed] [Google Scholar]
- 25. Mazumdar T, Devecchio J, Shi T, Jones J, Agyeman A, Houghton JA. Hedgehog signaling drives cellular survival in human colon carcinoma cells. Cancer Res 2011; 71: 1092–102. [DOI] [PMC free article] [PubMed] [Google Scholar]
- 26. Vlčková K, Ondrušová L, Vachtenheim J et al Survivin, a novel target of the Hedgehog/GLI signaling pathway in human tumor cells. Cell Death Dis 2016; 7: e2048. [DOI] [PMC free article] [PubMed] [Google Scholar]
- 27. Coni S, Infante P, Gulino A. Control of stem cells and cancer stem cells by hedgehog signaling: pharmacologic clues from pathway dissection. Biochem Pharmacol 2013; 85: 623–8. [DOI] [PubMed] [Google Scholar]
- 28. Santini R, Vinci MC, Pandolfi S et al Hedgehog‐GLI signaling drives self‐renewal and tumorigenicity of human melanoma‐initiating cells. Stem Cells 2012; 30: 1808–18. [DOI] [PubMed] [Google Scholar]
- 29. Heiden KB, Williamson AJ, Doscas ME et al The sonic hedgehog signaling pathway maintains the cancer stem cell self‐renewal of anaplastic thyroid cancer by inducing snail expression. J Clin Endocrinol Metab 2014; 99: e2178–87. [DOI] [PMC free article] [PubMed] [Google Scholar]
- 30. Colavito SA, Zou MR, Yan Q, Nguyen DX, Stern DF. Significance of glioma‐associated oncogene homolog 1 (GLI1) expression in claudin‐low breast cancer and crosstalk with the nuclear factor kappa‐light‐chain‐enhancer of activated B cells (NFκB) pathway. Breast Cancer Res 2014; 16: 444. [DOI] [PMC free article] [PubMed] [Google Scholar]
- 31. Han B, Qu Y, Jin Y et al FOXC1 activates Smoothened‐independent hedgehog signaling in basal‐like breast cancer. Cell Rep 2015; 13: 1046–58. [DOI] [PMC free article] [PubMed] [Google Scholar]
Associated Data
This section collects any data citations, data availability statements, or supplementary materials included in this article.
Supplementary Materials
Fig. S1. Effects of E2 on the mRNA expression levels of GLI3 in four ER‐positive breast cancer cell lines.
Fig. S2. Anti‐cell growth effects of GANT61 in the ER‐negative MDA‐MB‐231 cell line.
Fig. S3. Effects of GANT61 (0–20 μM) on apoptosis in MCF‐7 cells (a), T‐47D cells (b), KPL‐1 cells (c) and KPL‐3C cells (d). Cells were treated with 1 nM E2 and the indicated concentrations of GANT61 for 2 days. Percentages of apoptotic cells were analyzed as described in the Materials and Methods. The values are means ± SEs. White bars, control; the most light grey bars, E2 plus 1 μM GANT61; the second light gray bars, E2 plus 5 μM GANT61; the third light gray bars, E2 plus 10 μM GANT61; and the most dark grey bars, E2 plus 20 μM GANT61. * P < 0.05; **P < 0.01 in comparison with cells treated with E2 alone.
Fig. S4. Effects of E2 and GANT61 on the protein expression levels of survivin in MCF‐7 cells. The expression levels were measured with a western blotting as described in the Materials and Methods.
Fig. S5. Effects of E2 and GANT61 on the proportion of ALDH1‐positive cells in MCF‐7 cells (a), T‐47D cells (b), KPL‐1 cells (c) and KPL‐3C cells (d). The proportion was measured by the Aldefluor assay as described in the Materials and Methods.
Fig. S6. Effects of E2 and GANT61 on the protein expression levels of GLI1 and GLI2 in MCF‐7 cells. The expression levels were measured with a western blotting as described in the Materials and Methods.
Fig. S7. Growth inhibitory curves of the combined treatments of GANT61 with antiestrogens, 4‐OHT (a) and fulvestrant (b), under the E2‐supplemented condition in the MDA‐MB‐231 cells.
Fig. S8. Effects of combined treatments of GANT61 with antiestrogens on cell cycle progression and apoptosis in MCF‐7 cells (a, b), T‐47D cells (c, d), KPL‐1 cells (e, f), and KPL‐3C cells (g, h). Cells were treated with GANG61 (0–20 μM) and the antiestrogen, 4‐OHT (0.05 or 0.1 μM) or fulvestrant (0.025–0.1 μM), for 2 days. Percentages of cells at each cell cycle phase were analyzed as described in the Materials and Methods. Percentages of apoptotic cells were analyzed as described in the Materials and Methods. The values are means ± SEs. White bars, control; the most light grey bars, E2 alone; the second light gray bars, E2 plus GANT61; the third light gray bars, E2 plus 4‐OHT; the fourth light bars, E2 plus 4‐OHT and GANT61; the fifth light bars, E2 plus fulvestrant; and the most dark grey bars, E2 plus fulvestrant and GANT61. * P < 0.05; **P < 0.01 in comparison with cells treated with E2 plus 4‐OHT or fulvestrant.
Fig. S9. Effects of GANT61 and antiestrogens on the expression levels of GLI1 in MCF‐7 cells (a) and KPL‐1 cells (b). Cells were treated with 1 nM E2 and 10 μM GANT61 plus antiestrogen, 4‐OHT (0.05 or 0.1 μM) or fulvestrant (0.025–0.1 μM) for 3 days. The GLI1 expression levels were analyzed as described in the Materials and Methods. The values are means ± SEs. White bars, control; the most light grey bars, E2 alone; the second light gray bars, E2 plus GANT61; the third light gray bars, E2 plus 4‐OHT; the fourth light bars, E2 plus 4‐OHT and GANT61; the fifth light bars, E2 plus fulvestrant; and the most dark grey bars, E2 plus fulvestrant and GANT61. * P < 0.05; **P < 0.01 in comparison with cells treated with E2 plus 4‐OHT or fulvestrant.
Table S1. ER‐positivity and the IC50s of GANT61 in four ER‐positive breast cancer cell lines and an ER‐negative MDA‐MB‐231 cell line. All the cell lines were treated with the estrogen‐deprived medium plus 1 nM E2 supplemented with 0–20 μM GANT61 for 3 days. The values are expressed as the means ± SEs (μM).