

Abstract
Most solid cancers spread to new sites via the lymphatics before hematogenous dissemination. However, only a small fraction of an intravenously administered anti‐cancer drug enters the lymphatic system to reach metastatic lymph nodes (LN). Here, we show that the enhanced permeability and retention (EPR) effect is not induced during the early stages of LN metastasis. Luciferase‐expressing tumor cells were injected into the subiliac LN of the MXH10/Mo‐lpr/lpr mouse to induce metastasis to the proper axillary LN (PALN). In vivo biofluorescence imaging was used to confirm metastasis induction and to quantify the EPR effect, measured as PALN accumulation of intravenously injected indocyanine green (ICG) liposomes. PALN blood vessel volume changes were measured by contrast‐enhanced high‐frequency ultrasound imaging. The volume and density of blood vessels in the PALN increased until day 29 after inoculation, whereas the LN volume remained constant. ICG retention was first detected on day 29 post‐inoculation. While CD31‐positive cells increased up to day 29 post‐inoculation, α‐smooth muscle actin‐positive cells were detected on day 29 post‐inoculation for the first time. These results suggest that the EPR effect was not induced in the early stages of LN metastasis; therefore, systemic chemotherapy would likely not be beneficial during the early stages of LN metastasis. The development of an alternative drug delivery system, independent of the EPR effect, is required for the treatment of LN metastasis.
Keywords: Drug delivery system, enhanced permeability and retention effect, indocyanine green, lymph node metastasis, MXH10/Mo‐lpr/lpr mouse
The overall response rates to systemic chemotherapy are relatively low for metastatic lymph nodes (LN). Only a small fraction of the administered dose reaches tumor cells because the drug is preferentially re‐absorbed from the interstitium into blood capillaries1, 2 and because intranodal pressure is elevated.3 The enhanced permeability and retention (EPR) effect4 describes the phenomenon by which molecules of certain sizes accumulate into a tumor due to tumor vasculature permeability. Cabral et al.5 report that sub‐50 nm polymetric micelles incorporating platinum anticancer drugs accumulated in metastatic foci within clinically tumor‐positive LN due to the EPR effect, suggesting the importance of controlling nanocarrier size when treating LN metastasis. Our group has shown the induction of sinus hyperplasia, increased blood vessel density,6 increased intranodal pressure3 but no change in LN volume6 in the early stages of LN metastasis. Jeong et al.7 report a lack of angiogenesis during the formation of LN metastasis, consistent with observations that hyperplasia,3 increases in intranodal pressure3 and blood vessel density6, 8 are detected before angiogenesis in clinically tumor‐negative LN.
The EPR effect is relevant to the development of drug delivery systems (DDS) to treat LN metastasis but little is known about the EPR effect in metastatic LN. We established a recombinant inbred mouse, MXH10/Mo‐lpr/lpr (MXH10/Mo/lpr), with LN that swell to a diameter of 10 mm at 3 months, a size similar to that of human LN.9 We developed a model of LN metastasis in which metastasis is induced to the proper axillary LN (PALN) via lymphatic vessels following inoculation of tumor cells into the subiliac LN (SiLN).6, 8, 9
The focus of our study was metastatic LN that would be clinically tumor‐negative based on imaging. Lymphovascular invasion within the primary tumor and surrounding tissues is related to sentinel LN metastasis. Patients with clinically tumor‐negative LN may still have LN containing micrometastases that could metastasize to distant LN or organs.
The accumulation of indocyanine green (ICG) in metastatic LN was used to examine the EPR effect. Vasodilatation‐mediated increases in vascular volume and tumor‐induced angiogenesis occurred before the EPR effect became evident. These findings suggest that treatment of LN metastasis should not be based solely on the EPR effect. The development of new DDS for early‐stage treatment of LN metastasis should be based on methods independent of the EPR effect.10, 11, 12, 13
Materials and Methods
In vivo studies were approved by our Institutional Animal Care and Use Committee.
Synthesis of acoustic and indocyanine green liposomes and their characterization
Acoustic liposomes (AL) were used as an ultrasound contrast agent for imaging LN vasculature, and ICG liposomes were used to evaluate the EPR effect in solid tumors and metastatic PALN.14 Two types of ICG liposomes with different size distributions, ICG liposomes #1 (<200 nm diameter) and ICG liposomes #2 (>200 nm diameter), were made. The threshold of the EPR effect was set at a diameter of 200 nm.15 ICG (80 μM) dissolved in 10 mL PBS was added to a thin lipid film to form multi‐lamellar liposome vesicles. After repeated freeze‐thaw cycles, the ICG‐containing liposomes diameters were adjusted to 100–300 nm using an extruder (Northern Lipids, Burnaby, BC, Canada) and filters. Three filters (600 nm, twice; 200 nm, six times; and 100 nm, twice) were used for ICG liposomes #1, and one filter (600 nm, twice) used for ICG liposomes #2. Unencapsulated ICG was removed using PD‐10 columns (GE Healthcare, Chalfont St. Giles, UK). The resulting ICG liposomes were passed through a filter with a 0.45‐μm pore size (MILLEX HV filter unit, Durapore polyvinylidene‐difluoride [PVDF] membrane, Millipore, USA) for sterilization. The lipid concentration was measured using the Phospholipids C‐test Wako (Wako Pure Chemical Industries, Osaka, Japan) and adjusted to 1.0 mg/mL. Diameters and zeta potentials of the ICG liposomes were measured using a particle size and zeta potential analyzer (ELSZ‐2, Otsuka Electronics, Osaka, Japan). The light absorption of the ICG liposomes was measured to confirm peak absorbance at a wavelength near 800 nm (UV2500 spectrophotometer, Shimadzu, Kyoto, Japan). To determine ICG stability at body temperature, 1‐mL aliquots of ICG liposomes were incubated at 37°C and evaluated at varying times. ICG released from liposomes during the incubation period was removed by PD‐10 columns, and the remaining ICG in the liposomes was measured at 0 min, 5 min, 1 h, 6 h and 24 h after incubation using a multidetection microplate reader (absorbance 800 nm; SpectraMax M2/M2e, Molecular Devices, Sunnyvale, CA, USA).
Cell culture
We cultured C3H/He mouse mammary carcinoma FM3A‐Luc cells stably expressing the luciferase (Luc) gene9 and mouse malignant fibrous histiocytoma‐like KM‐Luc/GFP cells stably expressing a fusion of luciferase (Luc) and enhanced‐green fluorescent protein (EGFP) genes.8 Both cell lines were incubated at 37°C in 5% CO2 and 95% air to 80% confluence. The cell lines had different growth rates: 1.1/day for FM3A‐Luc cells and 3.8/day for KM‐Luc/GFP cells.16 Both cell types expressed VEGF‐A and VEGF‐B but not VEGF‐C; KM‐Luc/GFP but not FM3A‐Luc cells showed slight VEGF‐D expression.3 On the inoculation day, only cells without Mycoplasma contamination were used.
Mice
MXH10/Mo/lpr mice9 were bred under pathogen‐free conditions at the Animal Research Institute, Tohoku University. Seventy‐six mice were used in the study (weight: 25–35 g, 12–16 weeks). The longitudinal diameter of the PALN was 9.76 ± 0.35 mm (n = 6). Animals were anesthetized by inhalation of 2.5% isoflurane in oxygen.
Induction of solid tumor
FM3A‐Luc cells (1.0 × 10⁷ cells/mL) in 100 μL PBS (Collaborative Biomedical Products, Bedford, Canada) were subcutaneously injected into the rear flank (n = 12). KM‐Luc/GFP cells (1.0 × 10⁷ cells/mL) in 100 μL PBS were inoculated (n = 8) using the same procedure for FM3A‐Luc cells.
Leakage of indocyanine green liposomes from the vasculature in solid tumors
200 μL of ICG liposomes (lipid concentration: 1 mg/mL) was injected into the tail vein on day 11 post‐inoculation of FM3A‐Luc cells and on day 6 post‐inoculation of KM‐Luc/GFP cells. The fluorescence intensity of leaked ICG liposomes was measured at 0 min, 5 min, 1 h, 6 h, 24 h and 48 h for FM3A‐Luc cells and at 24 h for KM‐Luc/GFP cells using an in vivo bioluminescence imaging system (IVIS; Xenogen, Alameda, CA, USA). Mice inoculated with FM3A‐Luc cells were randomly divided into three groups (n = 4 per group); namely, ICG (free ICG), ICG liposomes #1 and ICG liposomes #2 groups. An additional experiment using ICG liposomes #1 was carried out with non‐tumor‐bearing mice (n = 4); this group was termed ICG liposomes #1.
Induction of metastasis in the PALN
Cell implantation procedures were performed under general anesthesia. Hair shaving and skin depilation in the abdominal and experimental regions were carried out before inoculation. The inoculation day was defined as day 0. The unilateral SiLN of each mouse was inoculated with either 60 μL (9.0 × 10⁴ cells/mL) of FM3A‐Luc cells (n = 30) or 60 μL (2.0 × 10⁴ cells/mL) of KM‐Luc/GFP cells (n = 10) in PBS/Matrigel (1:2, v/v). Twenty‐six mice received 60 μL of vehicle (20 μL PBS plus 40 μL Matrigel); 18 mice were used as controls for mice inoculated with FM3A‐Luc cells, and 8 as controls for mice inoculated with KM‐Luc/GFP cells. Implantation was carried out using a 24‐gauge needle, under the guidance of a high‐frequency ultrasound imaging system (VEVO 770; Visual Sonics, Toronto, ON, Canada) with a 25‐MHz transducer (RMV‐710; axial resolution, 70 μm; focal length, 15 mm; Visual Sonics). The needle was maintained in the same position in the SiLN for 1 min to solidify the Matrigel with/without tumor cells and, thus, prevent the mixture from flowing out of the SiLN after removal of the needle.
Metastasis detection in the PALN
Induction of metastasis to the PALN was assessed using IVIS6, 8 on days 6, 13, 20 and 27 post‐inoculation of FM3A‐Luc cells (n = 15), and days 4 and 7 post‐inoculation of KM‐Luc/GFP cells (n = 9). Each mouse was anesthetized and 15 mg/kg luciferin was injected intraperitoneally. Bioluminescence imaging for 30 s was conducted 10 min after each injection using IVIS. Induction of metastasis occurred if the luciferase intensity in the PALN exceeded the background level (4 × 10⁴ photons/s). Mice were divided into two groups: the Control group (PBS/Matrigel inoculated into the SiLN) and the Meta group (FM3A‐Luc or KM‐Luc/GFP cells inoculated into the SiLN and luciferase activity in the PALN exceeded 4 × 10⁴ photons/s). Luciferase activity in solid tumor was measured using IVIS on day 11 for FM3A‐Luc cells (n = 12) and day 6 for KM‐Luc/GFP cells (n = 5).
3D reconstruction of PALN microvasculature
3D images of PALN were evaluated on days 7, 14, 21 and 28 for FM3A‐Luc cells and days 5 and 8 for KM‐Luc/GFP cells, using a contrast‐enhanced high‐frequency ultrasound system (VEVO 770, Mark‐204‐MS; Sigma Koki, Hidaka, Japan) with AL as the contrast agent. Consecutive B‐mode images (slice thickness: 200 μm) were captured throughout the entire PALN during the diagnostic window from before to 120 s after the intravenous injection of a 200 μL bolus of AL.
Leakage of indocyanine green liposomes in the SiLN and PALN
Indocyanine green liposomes #1 were injected on days 7, 14, 21 and 28 post‐inoculation of FM3A‐Luc cells (n = 48), and on days 4 and 7 post‐inoculation of KM‐Luc/GFP cells (n = 18). Mice were sacrificed 24 h after injection of ICG liposomes (on days 8, 15, 22 and 29), the SiLN and PALN were harvested, weighed and frozen in liquid nitrogen. The frozen LN were homogenized in 1 mL of PBS using a T25 basic Ultra Turrax S1 (IKA Works, Staufen, Germany). A total of 500 μL of the supernatant was transferred into a 48‐well plate and the fluorescence intensity measured using IVIS.
Accumulation of indocyanine green liposomes #1 in the organs of non‐tumor‐bearing mice
Indocyanine green liposomes #1 were intravenously injected into non‐tumor‐bearing mice (n = 4) to evaluate the biodistribution of ICG liposomes #1. The organs were removed from each mouse 48 h after the injection of ICG liposomes #1 and the accumulation of ICG liposomes #1 was measured ex vivo by IVIS.
Histological analysis
Proper axillary lymph nodes in the Meta group inoculated with FM3A‐Luc cells were excised on day 22 (n = 3) or day 29 (n = 3). PALN in the Control (i.e. vehicle only) group (n = 3) were obtained on day 3 post‐inoculation. LN were fixed in 10% formaldehyde overnight at 4°C, dehydrated and embedded in paraffin. Specimens were serially sectioned (5 μm) and stained with HE using an automated HE staining processor (Symphony, Ventana Medical Systems, Tucson, AZ, USA). Immunohistochemistry (IHC) to stain for CD31 and α‐smooth muscle actin (α‐SMA) was carried out using an automated processor (Discovery XT, Ventana Medical Systems). IHC to identify vascular endothelial cells used a pre‐diluted polyclonal goat anti‐CD31 antibody (1/100 dilution; sc‐1506, Santa Cruz Biotechnology, USA) applied for 2 h at room temperature in combination with biotinylated anti‐goat IgG (H+L) (BA5000, Vector Laboratories, Burlingame, CA, USA) applied for 20 min at room temperature. IHC staining of vascular smooth muscle cells was carried out using a pre‐diluted polyclonal rabbit anti‐α‐SMA antibody (1/300 dilution; ab5694, Abcam, Cambridge, UK; 2 h at room temperature) in combination with a biotinylated anti‐rabbit IgG (H+L) (BA1000, Vector Laboratories; 20 min at room temperature). The tumor boundary was measured using a low‐magnification microscope (×10 or ×20; Olympus BX51TF, Olympus, Tokyo, Japan) and a digital camera (DP72; Olympus). The hotspot method was used to calculate the mean areas of the CD31‐positive and α‐SMA‐positive regions.6 Four hotspot fields with the highest amount of CD31‐positive or α‐SMA‐positive staining were selected under low magnification (×10 or ×20), and CD31‐positive and α‐SMA‐positive areas were calculated as percentages of the total area.
Statistical analysis
Measurements are presented as the mean ± SEM or SD. Statistical comparisons were made using the Tukey–Kramer or Kruskal–Wallis and Steel–Dwass tests. P < 0.05 was considered to be statistically significant. Analyses were performed using Excel 2007 (Microsoft, Redmond, WA, USA) and Statcel2 software (Statcel2 software, OMS Ltd., Tokorozawa, Japan).
Results
In vitro stability of indocyanine green liposomes
Two different size distributions of ICG liposomes were produced to evaluate EPR effects in the early stages of LN metastasis. The average diameter was 161 nm for ICG liposomes #1 and 271 nm for ICG liposomes #2 (Fig. 1a). Both types of ICG liposomes were stable for ≤6 h; approximately 20% of the ICG liposomes collapsed after 24 h at 37°C (Fig. 1b). The scattering intensity distributions and cumulative absolute frequencies of ICG liposomes #1 and #2 are shown in Figure 1(c), while the number distributions and cumulative frequencies are presented in Figure 1(d).
Figure 1.
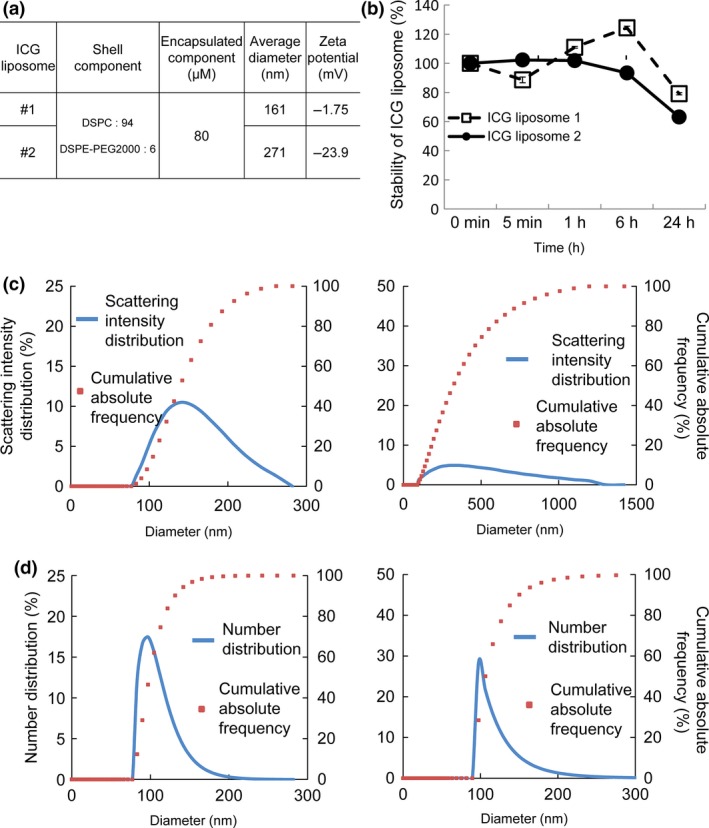
Characteristics of indocyanine green (ICG) liposomes. (a) Physicochemical properties of ICG liposomes #1 and ICG liposomes #2. The composition of phospholipids, average particle size and zeta potential of ICG liposomes #1 and #2 are shown. The average particle diameter (hydrodynamic diameter) was calculated by the cumulant method from the autocorrelation function obtained by the photon correlation method. (b) Absorbance at 800 nm (% of the value at 0 min) measured in vitro. ICG liposomes were incubated at 37°C and the absorbance of ICG at 800 nm was measured at 0 min, 5 min, 1 h, 6 h and 24 h. Quantified data are presented as the mean ± SEM (n = 3). The error bars are not visible if they are smaller than the sizes of the symbols. (c) The scattering intensity distributions (%) and cumulative absolute frequencies (%) of ICG liposomes #1 (left) and #2 (right) were observed to occur over diameters of 70–300 nm and 100–1300 nm, respectively. (d) The number distributions (%) and cumulative frequencies (%) of ICG liposomes #1 (left) and #2 (right) were observed to occur over diameters of 70–200 nm and 90–250 nm, respectively.
Indocyanine green liposome distribution in solid tumor
In our previous study, the accumulation of ICG liposomes in solid tumor due to the EPR effect was observed 24 h after the injection of ICG liposomes (diameter 134.7 ± 9.39 nm).3 Here, we investigated the effects of liposome size on the time‐dependent accumulation and loss of ICG liposomes due to the EPR effect (Fig. 2a,c). Free ICG and ICG liposomes #1 in non‐tumor‐bearing mice were used as controls. Figure 2(a) (i) shows the luciferase activity in solid tumor before injection of ICG liposomes, and Figure 2(a)(ii) shows the fluorescence intensity of ICG in solid tumor after intravenous injection of ICG liposomes. Fluorescence activity was detected in the whole body 5 min after injection (i.e. free ICG, ICG liposomes #1 and ICG liposomes #2 in tumor‐bearing mice and ICG liposomes #1 in non‐tumor‐bearing mice). For tumor‐bearing mice, the fluorescence intensity at 1 h post‐injection was higher in the ICG group than in both ICG liposome groups. At 6 h post‐injection in tumor‐bearing mice, the intensity of the fluorescent signal in the abdominal cavity was higher in the ICG liposomes #1 group than the ICG (free) or ICG liposomes #2 groups. At 24 and 48 h post‐injection, the fluorescence intensity decreased significantly in the ICG (free) and ICG liposomes #2 groups but remained high in the ICG liposomes #1 group. In non‐tumor‐bearing mice injected with ICG liposomes #1, fluorescence intensity was high at 5 min and 1 h post‐injection, but declined to low levels 24 and 48 h post‐injection. In additional experiments in non‐tumor‐bearing mice, organ accumulation of ICG liposomes #1 was measured ex vivo. There were no significant differences in ICG liposomes #1 accumulation among the excised organs at 48 h post‐injection of ICG liposomes #1 (Fig. 2b).
Figure 2.
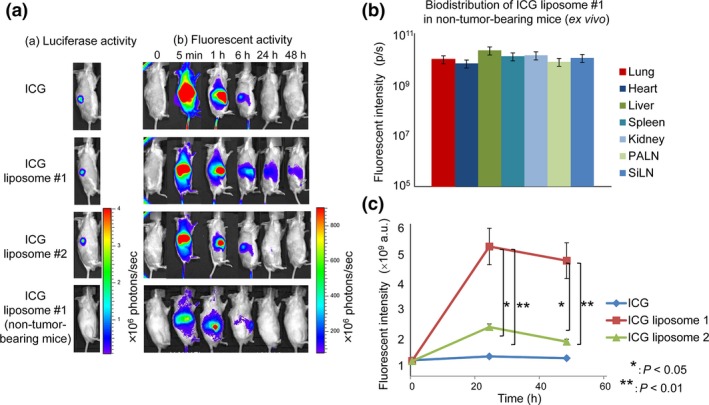
Indocyanine green (ICG) liposomes in solid tumor. (a) Representative fluorescence images from a mouse model of a solid tumor obtained at different time points after the intravenous injection of ICG (free), liposomes #1 and liposomes #2 into tumor‐bearing mice and ICG liposomes #1 into non‐tumor‐bearing mice. (b) Biodistribution of ICG liposomes #1 in non‐tumor‐bearing mice (ex vivo). The organs were removed at 48 h post‐injection of ICG liposomes #1 and the fluorescence intensity of each organ was measured. (c) Quantification of the fluorescence intensity of solid tumor (shown in (a)). Quantified data are presented as the mean ± SEM (n = 3). *P < 0.05, ICG liposomes #2 versus ICG liposomes #1; **P < 0.01, ICG versus ICG liposomes #1.
Tumor growth and indocyanine green liposome accumulation in a metastatic lymph nodes
Liposomes #1 and a mouse model of LN metastasis were used to evaluate EPR effects in metastasized LN. The mouse model consisted of a primary tumor (in the SiLN) and a sentinel LN (the PALN), and tumor engraftment and growth in the SiLN and PALN were detected by measuring the fluorescence produced by luciferase‐expressing tumor cells. Figure 3(a–d) shows quantification of tumor growth in the SiLN and PALN based on changes in luciferase activities in FM3A‐Luc and KM‐Luc/GFP cell lines. Metastasis in the PALN was detected on day 20 post‐inoculation for FM3A‐Luc cells and day 7 post‐inoculation for KM‐Luc/GFP cells. No metastasis was evident in control mice (n = 4) not inoculated with FM3A‐Luc or KM‐Luc/GFP cells (not shown). Figure 3(e–h) shows accumulation of ICG liposomes due to EPR in both primary tumor (SiLN) and the sentinel LN (PALN). In both cell lines, the Meta group showed a gradual accumulation of ICG liposomes #1 in the SiLN (Fig. 3e,f). In the Meta group, the accumulation of ICG liposomes #1 in the SiLN was high on day 29 post‐inoculation for FM3A‐Luc cells and day 9 post‐inoculation for KM‐Luc/GFP cells (Fig. 3e,f). In the Meta group, high retention of ICG in the SiLN occurred when the luciferase activity of FM3A‐Luc cells in the PALN increased to >1.0 × 10⁷ photons/s (Fig. 3c,e). A similar trend was observed in the Meta group for KM‐Luc/GFP cells (Fig. 3d,f).
Figure 3.
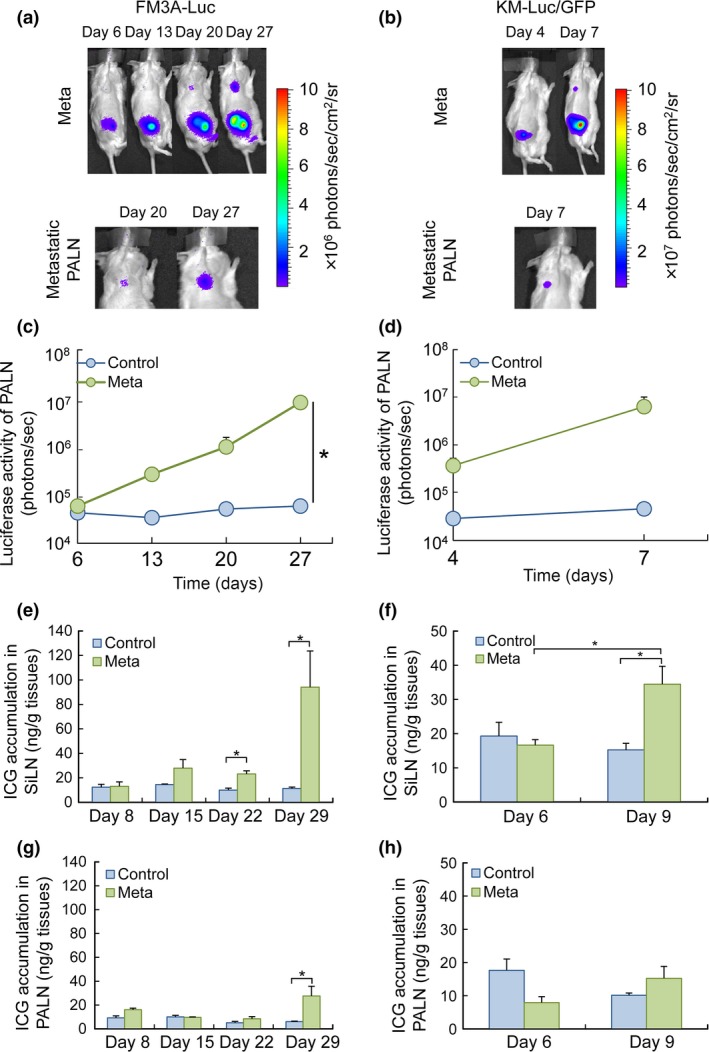
Indocyanine green (ICG) accumulation in the SiLN and PALN parallels the changes in luciferase activity due to tumor growth. (a) Induction of metastasis in the PALN following the inoculation of FM3A‐Luc cells into the SiLN of a mouse in the Meta group (n = 7). The upper panels show representative bioluminescence images of the entire mouse, while the lower panels show magnified images of the metastatic PALN on days 20 and 27 post‐inoculation. (b) Induction of metastasis in the PALN after the inoculation of KM‐Luc/GFP cells into the SiLN of a mouse in the Meta group (n = 4). Metastasis in the PALN was detected on day 7 post‐inoculation. The upper panels show representative bioluminescence images of the entire mouse, while the lower panel shows a magnified image of the metastatic PALN on day 7 post‐inoculation. (c) Temporal changes in luciferase activity in the PALN after the inoculation of FM3A‐Luc cells into the SiLN. Data are presented as the mean ± SEM. (d) Temporal changes in luciferase activity in the PALN after the inoculation of KM‐Luc/GFP cells into the SiLN. Data are presented as the mean ± SEM. (e–h) Temporal changes in ICG accumulation in the SiLN (e,f) and PALN (g,h). For mice inoculated with FM3A‐Luc cells, ICG accumulation was detected in the SiLN on day 22 post‐inoculation (P < 0.05, Control vs Meta) and in the PALN on day 29 post‐inoculation (P < 0.05, Control vs Meta). For mice inoculated with KM‐Luc/GFP cells, ICG accumulation was detected in the SiLN on day 9 post‐inoculation (P < 0.05, Control vs Meta) but was not detected in the PALN up to and including day 9 post‐inoculation. The EPR effect threshold for ICG accumulation was around 20 ng/g of tissue. Data are presented as the mean ± SEM.
Contrast‐enhanced ultrasound monitoring of metastatic lymph nodes
Before EPR effects are induced, micro‐environmental changes have to be elicited following an increase in vascular volume due to vasodilatation.7 Figure 4 quantifies changes in blood vessel volume and density in the PALN. The mouse model of LN metastasis with FM3A‐Luc cell inoculation was used to evaluate longitudinal changes due to induction of EPR. Figure 4 shows a gradual increase in both blood vessel density and volume in the PALN, but no change in LN size. On day 28 post‐inoculation there were significant increases in blood vessel density and volume relative to the increase in LN size. FM3A‐Luc cells in the PALN had induced an EPR effect by day 29 post‐inoculation (vide supra) (Fig. 3g).
Figure 4.
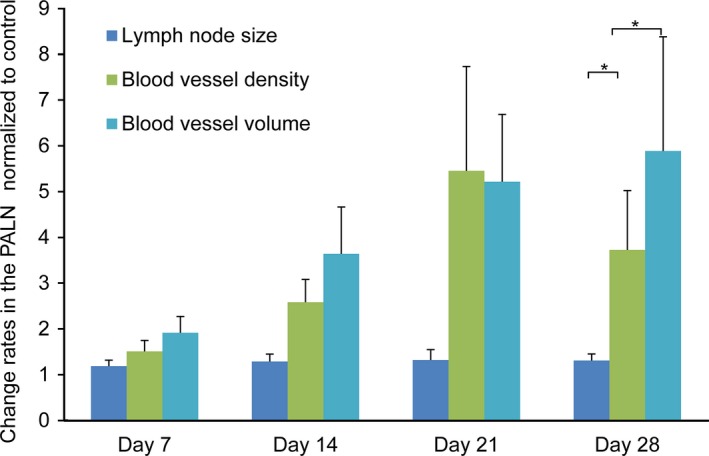
Changes in lymph node (LN) size, blood vessel density and blood vessel volume in the PALN, measured using a 3D contrast‐enhanced ultrasound imaging system. FM3A‐Luc cells were inoculated into the SiLN in the Meta group (n = 15), while vehicle without cells was inoculated into the SiLN in the Control group (n = 18). The rates of change in LN size, blood vessel density and blood vessel volume in the PALN were normalized to the respective control values. Data are presented as the mean ± SD. P < 0.05, LN size vs blood vessel density; P < 0.05, LN size vs blood vessel volume.
Histological analysis
To evaluate changes in the vasculature of the metastatic PALN following inoculation of FM3A‐Luc cells into the SiLN, PALN sections were stained with HE, anti‐CD31 antibody or anti‐α‐SMA antibody (Fig. 5). Because the accumulation of ICG liposomes in PALN metastasized by FM3A‐Luc cells was shown to occur on day 29 (Fig. 3), the changes in vessel structure were evaluated before and after induction of EPR. The CD31‐positive area was increased on days 22 and 29 post‐inoculation (Fig. 5a[i, ii, v and viii],b), while the α‐SMA‐positive area was increased only on day 29 post‐inoculation (Fig. 5a[i, vi and ix],c).
Figure 5.
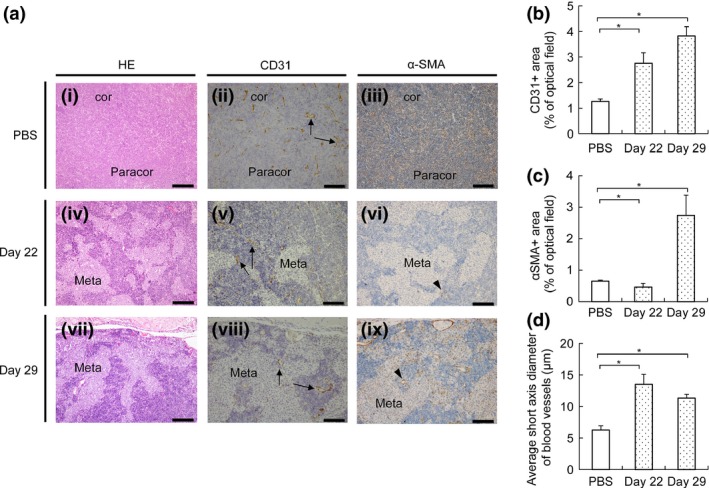
Evaluation of blood vessels by IHC analysis. (a) Sections of the PALN stained with HE, anti‐CD31 antibody or anti‐α‐SMA antibody. (i–iii) PBS injected into the SiLN (observations made on day 3; representative of n = 3). (iv–ix) FM3A‐Luc cells injected into the SiLN (observations made on days 22 and 29; representative of n = 3). In the Control group (i–iii), basic structures such as the cortex and paracortex were preserved and the blood vessels remained discretely distributed. In the Meta group, tumor cells invaded the cortex and paracortex over time, and the size of the blood vessels in the lymph node (LN) increased. α‐SMA‐positive cells were detected on day 29 post‐inoculation. Black bars: 200 μm (HE), 100 μm (CD31, α‐SMA). Cor, cortex region; paracor, paracortex region; meta, metastatic region. Arrows: vascular endothelium. Arrow heads: α‐SMA‐positive cells. (b) CD31‐positive area in the Control group and on days 22 and 29 after inoculation of FM3A‐Luc cells in the Meta group. Data are presented as the mean ± SD (n = 3). The CD31‐positive area was increased on day 22 post‐inoculation (P < 0.05, PBS vs Meta) and day 29 post‐inoculation (P < 0.05, PBS vs Meta). (c) α‐SMA‐positive area in the Control group and on days 22 and 29 after the inoculation of FM3A‐Luc cells in the Meta group. Data are presented as the mean ± SD (n = 3). Compared with the Control group, the α‐SMA‐positive area in the Meta group was significantly smaller on day 22 post‐inoculation (P < 0.05, PBS vs Meta) and larger on day 29 post‐inoculation (P < 0.05, PBS vs Meta). (d) Average short axis diameter of the blood vessels in the Control group (n = 3) and on days 22 and 29 after inoculation of FM3A‐Luc cells in the Meta group. Data are presented as the mean ± SD (n = 3). The average short axis diameter of the blood vessels was increased on day 22 post‐inoculation (P < 0.05, PBS vs Meta) and day 29 post‐inoculation (P < 0.05, PBS vs Meta).
Discussion
Our study shows that systemically administered fluorescent liposomes with a mean diameter of 161 nm did not accumulate in LN during the early stages of metastasis (i.e. before volume changes were seen), whereas accumulation was confirmed in solid. This phenomenon indicates that EPR occurred in solid tumors for ICG liposomes <200 nm in diameter. Zeta potential and particle size are crucial factors that affect biocompatibility and influence EPR (Fig. 1). Importantly, we show that EPR was not induced in the early stages of LN metastasis.
The concept of targeted drug delivery with systemic administration of nanotherapeutics is based on EPR in solid tumors and tumor‐induced angiogenesis.17 The EPR effect, which occurs due to gaps between the endothelial cells of tumor vessels, depends on the size of the delivered particle. The successful use of a DDS utilizing EPR to treat LN metastasis has been reported,18 but the LN in this study were macrometastatic. The present study did detect the accumulation of ICG liposomes with a diameter of 161 nm in LN injected with FM3A‐Luc or KM‐Luc/EGFP cells, but only after the LN had increased in size and structural and functional changes had occurred in blood vessels (Figs 3, 4, 5). Dissection of metastasized LN is recommended as a standard procedure for various cancer types.19 Our study shows that nanotherapeutics would be effective for patients for whom LN dissection is contraindicated.
We define “the early stage of LN metastasis” as an “LN containing tumor cells but showing no change in LN size.” Clinical diagnostic imaging systems such as ultrasound, MRI and computed tomography can diagnose metastatic LN based on their size and shape, and this is classified by the N stage in the TMN grouping.20 We evaluated LN size with an ultrasound imaging system and for the presence of tumor cells with an in vivo luminescence imaging system (Figs 3 and 4). Figures 3 and 4 reveal that no accumulation of ICG liposomes was detected in metastatic LN that had not increased in size. Jeong et al.7 demonstrate that angiogenesis was not induced in metastatic LN because of the vessel‐rich environment and antiangiogenic therapy to inhibit sprouting tumor vessels did not inhibit early tumor growth. The critical finding of the present study suggests that a new therapeutic approach independent of EPR is needed to treat the early stages of LN metastasis. Tumor vasculature varies in structure and contains vessels lined by endothelial cells that can have defective or dilated intercellular junctions. Tumor vascularization becomes mature when endothelial cells are completely covered with a smooth muscle layer. CD31‐positive cells increased in number as the tumor progressed in the metastatic PALN, whereas α‐SMA‐positive cells were detected only at the late stage of tumor progression (Fig. 4). Because LN are vascular‐rich organs, metastasized tumor cells are able to form foci during the early stages of metastasis without the occurrence of angiogenesis.7 The EPR effect occurs due to extravasation of particles from the circulation via abnormal fenestrations in the tumor vasculature.
The results of the present study suggest that efforts to improve therapeutic strategies for LN metastasis and ensure timely treatment should not be limited to approaches that rely solely on the EPR effect.
Disclosure Statement
The authors have no conflicts of interest to declare.
Acknowledgments
The authors thank T. Sato for technical assistance and the Biomedical Research Core of Tohoku University Graduate School of Medicine for technical support. This study was supported in part by JSPS KAKENHI Grant Numbers 16K15816 (SM), 26293425 (SM), 25293382 (MS), 15K15690 (MS) and 26242051 (TK).
Cancer Sci 108 (2017) 846–852
Funding Information
This study was supported in part by JSPS KAKENHI Grant Numbers 16K15816 (SM), 26293425 (SM), 25293382 (MS), 15K15690 (MS) and 26242051 (TK).
References
- 1. Sato T, Mori S, Arai Y, Kodama T. The combination of intralymphatic chemotherapy with ultrasound and nano‐/microbubbles is efficient in the treatment of experimental tumors in mouse lymph nodes. Ultrasound Med Biol 2014; 40: 1237–49. [DOI] [PubMed] [Google Scholar]
- 2. Swartz MA. The physiology of the lymphatic system. Adv Drug Deliv Rev 2001; 50: 3–20. [DOI] [PubMed] [Google Scholar]
- 3. Miura Y, Mikada M, Ouchi T et al Early diagnosis of lymph node metastasis: importance of intranodal pressures. Cancer Sci 2016; 107: 224–32. [DOI] [PMC free article] [PubMed] [Google Scholar]
- 4. Matsumura Y, Maeda H. A new concept for macromolecular therapeutics in cancer chemotherapy: mechanism of tumoritropic accumulation of proteins and the antitumor agent smancs. Cancer Res 1986; 46: 63877–92. [PubMed] [Google Scholar]
- 5. Cabral H, Makino J, Matsumoto Y et al Systemic targeting of lymph node metastasis through the blood vascular system by using size‐controlled nanocarriers. ACS Nano 2015; 9: 4957–67. [DOI] [PubMed] [Google Scholar]
- 6. Li L, Mori S, Kodama M et al Enhanced sonographic imaging to diagnose lymph node metastasis: importance of blood vessel volume and density. Cancer Res 2013; 73: 20827–92. [DOI] [PubMed] [Google Scholar]
- 7. Jeong HS, Jones D, Liao S et al Investigation of the lack of angiogenesis in the formation of lymph node metastases. J Natl Cancer Inst 2015; 107: djv155. [DOI] [PMC free article] [PubMed] [Google Scholar]
- 8. Li L, Mori S, Sakamoto M et al Mouse model of lymph node metastasis via afferent lymphatic vessels for development of imaging modalities. PLoS ONE 2013; 8: e55797. [DOI] [PMC free article] [PubMed] [Google Scholar]
- 9. Shao L, Mori S, Yagishita Y et al Lymphatic mapping of mice with systemic lymphoproliferative disorder: usefulness as an inter‐lymph node metastasis model of cancer. J Immunol Methods 2013; 389: 69–78. [DOI] [PubMed] [Google Scholar]
- 10. Kato S, Mori S, Kodama T. A novel treatment method for lymph node metastasis using a lymphatic drug delivery system with nano/microbubbles and ultrasound. J Cancer 2015; 6: 12827–94. [DOI] [PMC free article] [PubMed] [Google Scholar]
- 11. Kato S, Shirai Y, Kanzaki H et al Delivery of molecules to the lymph node via lymphatic vessels using ultrasound and nano/microbubbles. Ultrasound Med Biol 2015; 41: 14117–21. [DOI] [PubMed] [Google Scholar]
- 12. Kodama T, Hatakeyama Y, Kato S, Mori S. Visualization of fluid drainage pathways in lymphatic vessels and lymph nodes using a mouse model to test a lymphatic drug delivery system. Biomed Opt Express 2015; 6: 124–34. [DOI] [PMC free article] [PubMed] [Google Scholar]
- 13. Kodama T, Matsuki D, Tada A, Takeda K, Mori S. New concept for the prevention and treatment of metastatic lymph nodes using chemotherapy administered via the lymphatic network. Sci Rep 2016; 6: 32506. [DOI] [PMC free article] [PubMed] [Google Scholar]
- 14. Kodama T, Tomita N, Horie S et al Morphological study of acoustic liposomes using transmission electron microscopy. J Electron Microsc 2010; 59: 1877–96. [DOI] [PubMed] [Google Scholar]
- 15. Liu D, Mori A, Huang L. Role of liposome size and RES blockade in controlling biodistribution and tumor uptake of GM1‐containing liposomes. Biochim Biophys Acta 1992; 1104: 95–101. [DOI] [PubMed] [Google Scholar]
- 16. Shao L, Ouchi T, Sakamoto M, Mori S, Kodama T. Activation of latent metastases in the lung after resection of a metastatic lymph node in a lymph node metastasis mouse model. Biochem Biophys Res Commun 2015; 460: 5437–8. [DOI] [PubMed] [Google Scholar]
- 17. Petros RA, DeSimone JM. Strategies in the design of nanoparticles for therapeutic applications. Nat Rev Drug Discov 2010; 9: 615–27. [DOI] [PubMed] [Google Scholar]
- 18. Endo K, Ueno T, Kondo S et al Tumor‐targeted chemotherapy with the nanopolymer‐based drug NC‐6004 for oral squamous cell carcinoma. Cancer Sci 2013; 104: 369–74. [DOI] [PMC free article] [PubMed] [Google Scholar]
- 19. Shabbir M, Kayes O, Minhas S. Challenges and controversies in the management of penile cancer. Nat Rev Urol 2014; 11: 702–11. [DOI] [PubMed] [Google Scholar]
- 20. Ganeshalingam S, Koh D‐M. Nodal staging. Cancer Imaging 2009; 9: 104–11. [DOI] [PMC free article] [PubMed] [Google Scholar]