

Abstract
Orchestrating appropriate behavioral responses in the face of competing signals that predict either rewards or threats in the environment is crucial for survival. The basolateral amygdala (BLA) and prelimbic (PL) medial prefrontal cortex (mPFC) have been implicated in reward-seeking and fear-related responses, but how information flows between these reciprocally-connected structures to coordinate behavior is unknown. We recorded neuronal activity from the BLA and PL while rats performed a task where in shock- and sucrose-predictive cues were simultaneously presented to induce competition. The correlated firing primarily displayed a BLA→PL directionality during the shock-associated cue. Furthermore, the majority of optogenetically-identified PL-projecting BLA neurons recorded encoded the shock-associated cue, and more accurately predicted behavioral responses during competition than unidentified BLA neurons. Finally, BLA→PL photostimulation increased freezing, whereas both chemogenetic and optogenetic inhibition reduced freezing. The BLA→PL circuit plays a critical role in governing the selection of behavioral responses in the face of competing signals.
Keywords: basolateral amygdala, prelimbic cortex, prefrontal, optogenetics, phototagging, behavioral flexibility, electrophysiology, correlated activity, machine learning, support vector machine, decoding, conflict, competition
Introduction
When animals engage in reward-seeking behaviors such as foraging or hunting, they often expose themselves to potential threats, and must assess competing signals that may trigger conflicting motivational drives. The ability to appropriately weigh competing environmental cues and execute appropriate behavioral responses is paramount for survival and a key feature of mental health, yet little is known about the neural circuits that underpin this ability.
For decades, the amygdala has been identified as a focal point in emotional processing and is thought to be a hub for translating sensory information into motivated behaviors1,2. The basolateral nucleus of the amygdala (BLA) is important for the acquisition, encoding and retrieval of both positive and negative associations, and plasticity occurs in BLA neurons upon the encoding of cues that predict either positive or negative outcomes3–8. The BLA also shows prominent neuronal correlates of reward-seeking and fear-related responses in semi-naturalistic tasks in which animals need to for age and retrieve food in the presence of imminent predator-like threats9,10.
An important target of the BLA thought to be crucial for the coordination of reward-seeking and fear-related behaviors is the medial prefrontal cortex (mPFC)11–13, which receives robust monosynaptic glutamatergic inputs from the BLA14,15 and sends a reciprocal connection in return16. Similar to the BLA, the mPFC has been widely implicated in the regulation of both reward-seeking17,18 and fear-related behavior19–21, and pharmacological inactivation of the mPFC produces deficits in the coordination of these behaviors22,23. Furthermore, the mPFC shows prominent neuronal responses that are highly correlated with the time course of behavioral manifestations of reward-seeking and fear-related behavior11,18. While some studies have examined the necessity of BLA activity for fear-related signaling in the mPFC24,25, little is known about how dynamic interactions between these structures may govern the coordination of reward-seeking and fear-related behavior upon presentation of competing signals.
In this study, we used electrophysiological recordings, optogenetic-mediated photo identification of BLA→PL neurons, supervised machine learning algorithms to decode behavior during competition, and circuit-specific manipulations during a modified Pavlovian cue discrimination task, in which conditioned stimuli predicting either sucrose or shock were presented separately on some trials and simultaneously in others. We address the following questions: (1) Is correlated firing between the BLA and PL dynamic upon presentations of cues associated with positive (rewards) or negative (punishments) outcomes?; (2) What is the directionality of information flow?; (3) Can we use neural activity and behavior during Pavlovian discrimination to accurately decode the behavior of an animal during the presentation of conflicting signals?; and (4) Is the BLA-mPFC projection necessary for and sufficient to promote fear-related behavior?
We also examined whether either brain region was particularly sensitive to the sucrose-predictive or the shock-predictive cue. Based on our finding that predominantly excitatory cross-correlations between the BLA and PL developed a BLA→PL directionality during the shock-predictive but not the sucrose-predictive cue, we hypothesized that this projection supplies information critical for driving fear responses. To further test this, we used channelrhodopsin-2 (ChR2) to activate BLA inputs to PL and observed a selective enhancement of conditioned fear but not reward-seeking responses. Conversely, we used both optogenetic and chemogenetic approaches to inhibit BLA inputs to PL and observed suppressed freezing.
Results
To investigate the neural dynamics that occur when an animal is challenged with competing environmental signals, we developed a novel variation of a Pavlovian discrimination task wherein one conditioned stimulus (CS) was paired with a reward, whereas a second CS was paired with shock. We used CSs of different sensory modalities (auditory and visual) to subsequently allow us to simultaneously present these stimuli during “competition” trials without perceptual interference (Fig. 1a and Supplementary Fig. S1a).
Figure 1.

Behavioral tasks to examine the discrimination and competition of reward and fear memories. (a) During discrimination, discrete conditioned stimuli (CS) predicted either sucrose or shocks. These CSs were termed the “CS-Suc” and “CS-Shock”, and their sensory modalities (light vs tone) were counterbalanced across animals. Sucrose was removed from the port if animals did not collect it by the end of the CS (vacuum; “Vac”). During competition, in addition to the individual CS-Suc and CS-Shock, animals were challenged by the co-presentation of these associations to induce conflicting motivational drives and “competition”. (b and c) For simplicity, we operationalize the term “Rew” to refer to port-entry behavior and “Fear” to refer to freezing. (b) Port entry responses per CS during the last discrimination session. Inset show the average time that animals spent in the port per CS (paired T-test: t15 = 20.3, ***P < 0.001, n = 16 animals). (c) Freezing responses per CS during the last discrimination session. Inset shows the average time that animals spent freezing per CS (paired T-test: t15 = 20.6, ***P < 0.001, n = 16 animals). (d) Port entry responses during the last competition session. Inset shows the average time in the port per CS (repeated measures one-way ANOVA: F2,30 = 107.6, P < 0.001, n = 16 animals; Bonferroni post-hoc tests: t15 > 6.85 and ***P < 0.001 for all comparisons). (e) Freezing responses during the last competition session. Inset shows the average time that animals spent freezing per CS (repeated measures one-way ANOVA: F2,30 = 89.0, P < 0.001, n = 16 animals; Bonferroni post-hoc tests: t15 > 6.01 and ***P < 0.001 for all comparisons). Error bands in line plots and error bars in insets represent s.e.m.
Rats first learned a reward association in which a novel cue (e.g., light) was associated with the delivery of a palatable sucrose solution. Rats rapidly learned to explore the sucrose port during the cue presentation as compared to the inter-trial intervals (ITI; Supplementary Fig. S1c). Rats then learned to discriminate a second cue (e.g., tone) with an electrical shock, while still being exposed to the sucrose-predictive cue. Rats responded to the cue that predicted shock by freezing, which is a robust and consistent behavioral manifestation thought to be related to fear. By the third discrimination session, rats exhibited differential behavioral responses during the sucrose-predictive and shock-predictive cues. For simplicity, we used the terms reward and fear epochs to describe the time during which the cues associated with either sucrose or shock, respectively, were presented. As observed in Fig. 1b,c (also see Supplementary Fig. S1d), rats spent more time exploring the sucrose port than freezing during the reward epochs, whereas they spent more time freezing than exploring the sucrose port during the fear epochs.
During subsequent “competition” sessions, the cue-sucrose and cue-shock associations were simultaneously presented to induce motivational conflict and competition of reward-seeking and fear-related behavior. Pairing of these associations produced a mean performance that was between the behaviors produced when the cue-sucrose and cue-shock were presented independently (Fig. 1d,e and Supplementary Fig. S1d). Throughout training, while the reward- and fear-associated cues were of different sensory modalities, these cues were counterbalanced across animals and did not introduce significant differences in behavioral performance (Supplementary Fig. S1e-g).
BLA led more excitatory correlations with PL during the shock-predictive cue
To explore the potential contribution of interactions between the BLA and PL in governing behavioral selection in the face of conflicting cues signaling competing motivational drives, we first investigated the correlated activity across these two brain regions during distinct behavioral epochs during a discrimination session wherein the CS-Suc and CS-Shock were presented independently (Fig. 2). Recording sites are shown in Supplementary Fig. S2a-d. Details on the detection of correlated activity are provided in the Online Methods (section on cross-correlations) and in Supplementary Fig. S3a. Of 3,037 total possible pairs of BLA and PL neurons, we observed 639 pairs with positively correlated activity, which we termed “Excitatory BLA/PL cross-correlations” (example shown in Fig. 2a), and 107 pairs with negatively correlated activity, which we termed “Inhibitory BLA/PL cross-correlations” (example shown in Fig. 2b). Although excitatory cross-correlations (CCs) were more common during all task epochs (ITI, CS-Suc and CS-Shock; Fig. 2c,e), inhibitory CCs were also observed less frequently and with more variability in number of significant correlated pairs across each epoch within our data set (Fig. 2d,f).
Figure 2.

Correlated activity between the BLA and PL varied between the retrieval of reward- and fear-related memories. (a-b) Neural activity was simultaneously recorded in the BLA and PL (n = 12 animals). Representative CCs between BLA/PL neural pairs (25-ms bins) exhibit either excitatory correlations (i.e., the target cell showed increased firing when the reference cell fired) or inhibitory correlations (i.e., the target cell showed reduced firing when the reference cell fired). Significant peaks or troughs were detected within ±100 ms from the reference spikes. Correlations due to common input (i.e., zero lag) were excluded by examining CCs generated with smaller bin widths (5-ms bins; see Supplementary Fig. S3). Only a small fraction of cell pairs showed zero lag (see Supplementary Fig. S6c-d). (c-d) Excitatory correlations predominated over inhibitory correlations in all task epochs (Bonferroni-corrected chi-square tests: χ2 > 136.5, P < 0.001 in all task epochs). In the heatmaps, cell pairs were ordered based on the latency of peaks and troughs. Mean latency±s.e.m. of peaks for excitatory CCs: ITI, 3.9±2.4 ms; CS-Suc, 5.9±2.5 ms; and CS-Shock, 13.0±2.4 ms. Mean latency of troughs for inhibitory CCs: ITI, 12.5±5.3 ms; CS-Suc, 17.1±7.6 ms; CS-Shock, -1.4±5.2 ms. Numbers at the bottom of the heatmaps indicate the overall proportion of correlated cell pairs per epoch. Vertical dash lines represent the time of the reference spikes, and the horizontal dash lines represent the separation between putative BLA-led versus PL-led correlations. (e-f) Distinct populations of BLA/PL neural pairs exhibited correlated activity during different epochs. (g) Putative leading structure in the excitatory CCs, based on the latency of peaks. Cell pairs were deemed as BLA-led if the peak occurred within +2.5 to +100 ms from the reference, whereas they were deemed as PL-led if the peak occurred within -100 to -2.5 ms from the reference (n's reported within each bar). BLA leading was significantly greater than PL leading only during the CS-Shock (ITI, χ2 = 3.83, P = 0.14; CS-Suc, χ2 = 0.91, P = 0.71; CS-Shock, χ2 = 29.2, ***P < 0.001). The leading ratio during the CS-Shock was also significantly different than during other epochs (ITI vs CS-Suc, χ2 = 0.71, P = 0.78; ITI vs CS-Shock, χ2 = 10.4, **P = 0.004; CS-Suc vs CS-Shock, χ2 = 16.0, ***P < 0.001). (h) Putative leading structure in the inhibitory CCs. There was a trend towards higher BLA than PL leading during the CS-Suc (ITI, χ2 = 0.89, P = 0.72; CS-Suc, χ2 = 4.28, ~P = 0.11; CS-Shock, χ2 = 0.15, P = 0.97). The leading ratio during the CS-Suc was significantly different than during the CS-Shock (ITI vs CS-Suc, χ2 = 2.33, P = 0.35; ITI vs CS-Shock, χ2 = 1.37, P = 0.56; CS-Suc vs CS-Shock, χ2 = 5.70, *P = 0.05).
We wondered whether the directionality of information flow was dynamic depending on environmental cues predicting unconditioned stimuli of positive or negative valence. To begin exploring this question, we examined the proportion of pairs during each epoch wherein spiking of neurons in the BLA or PL preceded spiking in the other structure. We observed that a significantly greater proportion of BLA/PL pairs showing excitatory CCs were putatively led by neurons in the BLA during the CS-Shock, but not during either the CS-Suc or ITI epochs (Fig. 2g). Conversely, among inhibitory CCs, the BLA putatively led a greater proportion of cell pairs during the CS-Suc (Fig. 2h), though admittedly there was a smaller sample size among inhibitory cross-correlations. Smaller bin widths showed more variable cross-correlations, due primarily to sparse, low firing rates (Supplementary Fig. S4).
To control for stimulus generalization, we found that rats displayed neither reward-seeking nor fear-related behaviors during a habituation phase prior to any training, or during the discrimination of a neutral cue (CS-) that was never paired with sucrose or shock (Supplementary Fig. S5a-c). Importantly, significantly smaller proportions of BLA/PL cell pairs exhibited correlated activity during the CS- and during habituation (Supplementary Fig. S5d), suggesting that BLA/PL correlations developed over the course of training. We also confirmed that cue modality did not influence the BLA/PL lead and lag dynamics (Supplementary Fig. S6a,b). Furthermore, the lead and lag dynamics were consistent across distinct BLA/PL populations that exhibited correlated activity during different task events (Supplementary Fig. S6c,d). Interestingly, these dynamics were also strong in a BLA/PL population that exhibited excitatory correlations during all task events, but that showed significant shifts in BLA and PL leading across task events (see bottom panels in Supplementary Fig. S6c). Finally, these lead and lag dynamics were also maintained across multiple combinations of putative projection cells and interneurons (Supplementary Fig. S6e-i).
Populations of BLA cells that encoded sucrose and shock cues exhibited similar levels of correlated activity with PL
Preferential encoding of the “reward” and “fear” memories by the BLA cells could potentially contribute to differential patterns of BLA/PL correlations. We examined this possibility by assessing CS-elicited changes in BLA activity and then quantifying correlations with PL for the reward and fear encoding BLA cells (Fig. 3a-d). Details on CS-evoked responses are provided in the Online Methods. While many BLA cells responded to either of the CSs or to both (Fig. 3a,b and Supplementary Fig. S7a,c,e), no significant differences were observed between the proportions of BLA cells that exhibited biased responses to either the CS-Suc or CS-Shock (Fig. 3c). Furthermore, the reward- and fear-biased populations showed similar levels of cross-correlated activity with PL (Fig. 3d). In addition, the patterns of lead and lag in the cross-correlations were preserved across multiple combinations of BLA and PL cells that responded to either the reward- or fear-associated cues (Supplementary Fig. S7g-j). Therefore, the differential dynamics we observed in the BLA/PL cross-correlations across reward and fear epochs could not solely be attributed to preferential encoding of the BLA cells of the reward and fear memories.
Figure 3.

BLA neurons biased towards encoding the CS-Sucrose (Rew) or CS-Shock (Fear) exhibited similar proportions of correlated activity with PL, whereas a greater proportion of “fear”-biased PL cells exhibited correlated activity with BLA. (a-b) BLA populations based on the response to the reward-associated cue (i.e., CS-Suc; “R”), fear-associated cue (i.e., CS-Shock; “F”), or to both cues (“R” and “F” combinations). There were no significant differences in proportions across these populations (Bonferroni-corrected chi-square tests: χ2 < 9.50 and P > 0.056 for all comparisons). (c) Separation of reward and fear biased BLA cells, based on the peak response to each cue. Cells in the light-gray zones exhibited larger responses to the reward-related cue, and were deemed as “reward biased”. Cells in the dark-gray zones exhibited larger responses to the fear-related cue, and were deemed as “fear biased”. Inset shows the average proportion of reward and fear biased cells in the BLA per subject (paired T-test: t11 = 0.61, P = 0.56, n = 12 animals). (d) Reward and fear biased BLA cells showed similar proportions of cross-correlated activity with simultaneously recorded PL cells. These values were normalized to the total number of correlated neural pairs per subject per cue (repeated measures two-way ANOVA: cells, F1,22 = 0.01, P = 0.91; cue, F1,22 = 1.48, P = 0.24; interaction, F1,22 = 0.04, P = 0.85, n = 12 animals). (e-f) PL populations based on the response to the cues. Asterisk in the F+ bar indicates that this population was significantly larger than most other populations (χ2 = 8.86 and P = 0.079 compared to R+F+; χ2 > 11.06 and P < 0.024 compared to all other populations). (g) Separation of reward and fear biased PL cells, based on the peak response to each cue. A greater proportion of PL cells exhibited fear bias than reward bias (t11 = 3.03, *P = 0.011, n = 12 animals). (h) A greater proportion of fear-biased PL cells showed cross-correlated activity with simultaneously recorded BLA cells (cells, F1,22 = 13.5, P = 0.0013; cue, F1,22 = 3.66, P = 0.069; interaction, F1,22 = 1.23, P = 0.28; CS-Suc, t11 = 3.32, **P = 0.0026; CS-Shock, t11 = 3.73, ***P < 0.001, n = 12 animals). Error bars represent s.e.m.
A larger population of PL cells encoded the fear memory, and this population exhibited stronger correlations with the BLA than the PL population that encoded reward
We next examined whether the PL cells that encoded the reward and fear associations exhibited distinct degrees of cross-correlated activity with the BLA. Representative PL cells exhibiting significant responses to the reward- and fear-associated cues are shown in Supplementary Fig. S7b. In contrast to the BLA, PL exhibited a larger proportion of cells that encoded the fear-associated cue (Fig. 3e,f and Supplementary Fig. S7d). Furthermore, a significantly greater overall population of PL cells exhibited biased responses to the fear-associated cue (Fig. 3g), and this population showed more cross-correlations with the BLA than the population of PL cells that exhibited biased responses to the reward-associated cue (Fig. 3h). This suggested that fear-biased cells in PL have greater functional connections with the BLA.
Taken together, these observations raised the possibility that information was flowing from the BLA to the PL during fear-related cues. However, these experiments did not allow us to differentiate between direct information flow, indirect connectivity, or activity driven by a common upstream site. These findings ultimately prompted us to perform optogenetic-mediated photo identification of BLA→PL neurons.
The majority of photoidentified BLA→PL neurons recorded were excited to the shock-predictive cue
Given that the BLA, rather than PL, led more excitatory correlations during the CS-Shock, we wondered whether this might be related to monosynaptic input from the BLA to PL. To test this hypothesis, we used a dual virus approach as performed by Nieh and colleagues26, wherein a retrograde viral vector injected into PL (canine adenovirus, CAV2) carried Cre-recombinase into the BLA, while an anterograde viral vector injected into the BLA allowed for Cre-dependent expression of Channelrhodopsin-2 (ChR2) fused to enhanced yellow fluorescent protein (eYFP; see Fig. 4a). We first confirmed in an ex vivo preparation that this viral approach produced reliable ChR2 expression and selective photoresponses in BLA→PL neurons (Fig. 4b,c). We also determined in the ex vivo preparation the photoresponse latency threshold in these cells (Fig. 4d,e). For in vivo recordings, we implanted into the BLA an optrode (probe that combined an optical fiber with recording wires) to allow for photo identification of the BLA→PL cells shortly after the recording session during the behavioral task (Fig. 4f). Photo Identification parameters are provided in the Online Methods (section on photo identification of the BLA-PL population).
Figure 4.

The majority of BLA-PL cells recorded showed selective excitations to the shock-predictive cue. An optogenetic approach was used to photoidentify these cells (“BLA-PL population”). (a-e) Assessment of photoresponse latencies in slices. (a) Ex vivo whole-cell patch-clamp recordings were performed after selectively expressing ChR2 in BLA-PL cells using a Cre-dependent viral system (n = 7 animals). Expressing cells (n = 6 cells) and non-expressing neighbors (n = 24 cells) were recorded while stimulating with blue light (5-ms pulses at 1 Hz). (b) Representative traces from a ChR2+∷BLA-PL cell and 4 non-expressing neighbors. (c) Distribution of all cells sampled with whole-cell patch-clamp recording. (d) Representative traces show the latency of photoresponses at various light power densities (power range, 0.5-84 mW/mm2). Latencies were calculated from light onset to action potential peaks. (e) Distribution of photoresponse latencies for the BLA-PL cells. Dots represent individual cells, and error bar represents s.e.m. (f-h) Photo Identification of BLA-PL cells in behaving animals. (f) Optrodes were chronically implanted in the BLA for neural recordings after selectively expressing ChR2 in BLA-PL cells. Optimal ChR2 expression and detection of photoresponses was achieved in a subset of animals (n = 2/6 animals, 33%). (g) BLA-PL cell displaying photoresponses in vivo (bin-width, 20 ms). (h) Assessment of photoresponse latencies in vivo. Latencies were calculated from laser onset to the time at which cells exhibited a significant increase in firing frequency. Eleven out of sixty cells (18%) were deemed as BLA-PL cells as they displayed photoresponse latencies shorter than 12 ms, which was the longest latency observed in slices. One cell displayed latencies greater than 12 ms (white-filled bin) and it was excluded from further analyses. (i-j) Response profile of photoidentified BLA populations. Error bands in line plots represent s.e.m. (i) BLA-PL population. A greater proportion of these cells displayed selective excitatory responses to the fear-associated cue (“F+”, n = 6/11 cells, 55%). (j) An additional BLA population that exhibited significant inhibition during ChR2 stimulation. These cells thus did not terminate in PL, and perhaps received inhibitory influence from the BLA-PL network. These cells were deemed as network-inhibited cells (“Netw(-)”, n = 8/60 cells, 13%). During the discrimination task, the majority of these cells exhibited either inhibitory responses to the fear cue (“F-”, 3/8, 38%) or excitatory responses to the reward cue (“R+”, 3/8, 38%).
Among the BLA neurons recorded in vivo, 11/60 (18%) were identified as BLA→PL neurons, based on short-latency photoresponses that were below the 12-ms threshold determined in our visually-guided ex vivo recordings (Fig. 4g,h). In addition, we observed a subpopulation of BLA cells (8/60, 13%) exhibiting inhibition in response to the photostimulation of BLA→PL neurons. We termed this subpopulation the “network-inhibited” cells, though the precise number of synapses or distribution of the neurons in this network is not known.
We found that a greater proportion of the photoidentified BLA→PL neurons showed excitatory responses to the fear-associated cue (“F+”; Fig. 4i). This was in contrast to the network-inhibited cells in which only one cell showed selective excitatory responses to the fear-associated cue (Fig. 4j), while the majority of the cells recorded showed inhibitory responses to the fear cue (“F-”) or excitatory responses to the reward-associated cue (“R+”).
Activity of BLA→PL neurons decoded behavior in moments of conflict more accurately than unidentified BLA neurons
Based on the above findings taken together, we hypothesized that the neural activity of photoidentified BLA→PL neurons during independent presentations of the fear and reward-related cues would allow us to decode the behavior of animals challenged with competing signals, specifically the simultaneous co-presentation of CS-Suc and CS-Shock (Fig. 5). The selection of a behavioral output during competition trials varied between animals, and even between trials within a single animal (Fig. 5b), as competition trials could produce behaviors related to either reward-seeking (port entry) or fear (freezing).
Figure 5.

BLA cells terminating in PL more accurately predicted the animal's behavioral response during competition. (a) Photo Identification of the distinct BLA populations: “BLA-PL” (8/57, 14%), population terminating in PL; “Netw(-)” (8/57, 14%), population that showed inhibition during photostimulation; and “Unidentified” (41/57, 72%), population that did not respond to light stimulation. (b) Schematic of the competition task in which in addition to CS-Suc and CS-Shock trials, animals were challenged by the co-presentation of these associations to induce behavioral competition. Below, trial-by-trial behavioral output for a representative animal during each trial type. (c-d) Support vector machine (SVM) model to predict behavioral responses during 20 competition trials. The SVM model was trained using neural activity during the CS-Suc and CS-Shock trials. Data for the entire 20 s of CS presentation was used to classify neural activity. The model was then tested during competition trials to predict behavioral responses based on neural activity. For this given example, this BLA-PL cell accurately predicted behavioral responses on 85% of the competition trials. (e) Mean decoding accuracy for the distinct BLA populations. Superimposed dots represent individual cells (n's per population are reported in the bars). All BLA populations showed averaged decoding accuracies that were significantly higher than chance (Bonferroni-corrected paired T-test comparisons against scrambled data are represented by the asterisks above the number of cells per population: BLA-PL, t7 = 3.31, *P = 0.013; Netw(-), t7 = 3.74, **P = 0.007; Unidentified, t40 = 2.29, *P = 0.028). Furthermore, the BLA-PL population but not the Netw(-) population showed significantly higher decoding accuracy than unidentified cells (one-way ANOVA: F2,54 = 3.36, P = 0.042; Bonferroni post-hoc tests: BLA-PL vs Unidentified, t47 = 2.74, *P = 0.017; Netw(-) vs Unidentified, t47 = 1.22, P = 0.23). (f) Mean decoding accuracy for the BLA populations, when their activity was paired with the activity of simultaneously recorded PL cells with which they showed either uncorrelated activity (“Unc”) or significantly correlated activity (“Corr”). Superimposed dots represent BLA/PL neural pairs (number of cell pairs per population are reported within the bars). All populations showed decoding accuracies that were significantly higher than chance (BLA-PL Unc, t38 = 2.91, **P = 0.006; BLA-PL Corr, t38 = 6.76, ***P < 0.001; Netw(-) Unc, t32 = 5.87, ***P < 0.001; Netw(-) Corr, t68 = 10.5, ***P < 0.001; Unidentified Unc, t284 = 8.36, ***P < 0.001; Unidentified Corr, t124 = 4.24, ***P < 0.001). Furthermore, the BLA-PL cells showed significantly higher decoding accuracy when its activity was paired with correlated PL activity (one-way ANOVA: F5,584 = 11.1, P < 0.001; Bonferroni post-hoc tests: “BLA-PL”, Unc vs Corr, t76 = 2.64, *P = 0.011; “Netw(-)”, Unc vs Corr, t100 = 0.68, P = 0.50; “Unidentified”, Unc vs Corr, t408 = 1.18, P = 0.24). Error bars represent s.e.m.
To test this, we used a support vector machine (SVM) algorithm to compare the decoding accuracy of individual neurons in the BLA. CS-Suc trials, which reliably induced port entry, and CS-Shock trials, which reliably induced freezing, were used as training data for the SVM (Fig. 5c; see section on machine learning in the Online Methods). The SVM algorithm was then tested on competition trials to determine the percentage of trials for which the activity of each individual BLA neuron accurately predicted behavioral selection (port entry or freezing; Fig. 5d). Here, a representative BLA→PL neuron is shown to have 85% decoding accuracy (Fig. 5d).
Indeed, photoidentified BLA→PL neurons showed a significantly higher mean decoding accuracy than unidentified BLA neurons (Fig. 5e). Additionally, cross-regional neuronal pairs containing a photoidentified BLA→PL neuron had greater decoding accuracy if the PL neurons showed correlated firing with the PL-projecting BLA neuron (Fig. 5f). The significantly greater accuracy in predicting action selection during competition trials suggests that the BLA→PL projection encodes information that can guide behavior.
Photostimulation of BLA inputs to PL was sufficient to promote freezing
To test whether the BLA→mPFC projection was sufficient to promote fear-related behavior such as freezing, we photostimulated ChR2-expressing BLA terminals in the mPFC (Fig. 6a-d and Supplementary Fig. S8a). During the Pavlovian discrimination session, rats expressing ChR2 displayed significantly more freezing during laser-ON than laser-OFF epochs relative to eYFP-expressing controls (Fig. 6c).
Figure 6.
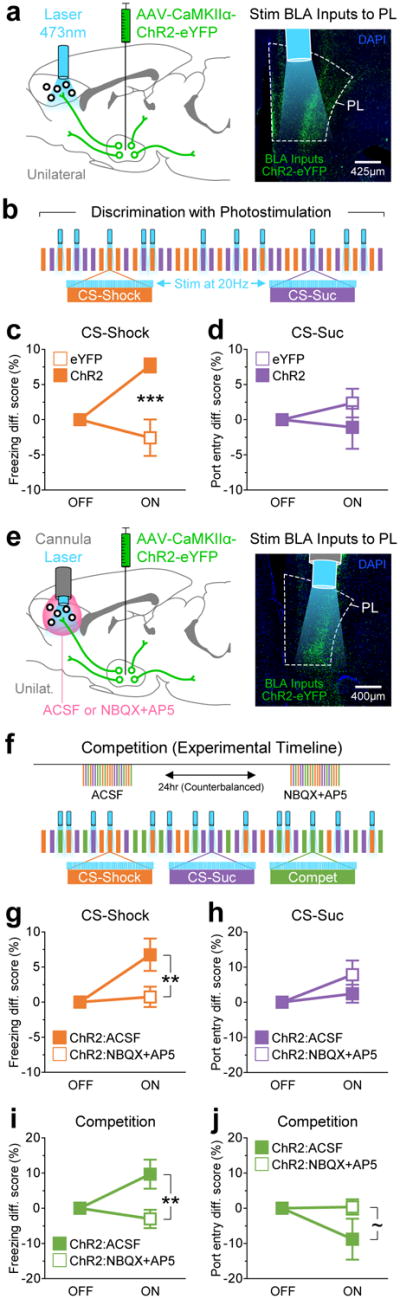
Stimulation of BLA inputs to PL facilitated fear-related behavior, and biased behavioral responses towards fear during competition. (a) Optogenetic strategy to stimulate BLA inputs to PL. The BLA was unilaterally transduced with either eYFP (n = 10 animals) or ChR2 (n = 8 animals), and an optical fiber was chronically implanted in the dorsal regions of PL to locally stimulate BLA inputs. (b) Schematic of the discrimination task in which half of the trials were paired with 20-Hz blue light stimulation. The trial and laser sequences were pseudorandom. (c) Freezing behavior during CS-Shock trial, illustrated as the difference score in the percentage of time spent freezing, relative to laser-OFF. Stimulation of BLA inputs to PL significantly enhanced freezing responses (repeated measures two-way ANOVA: group, F1,16 = 11.4, P = 0.004; laser, F1,16 = 2.88, P = 0.11; interaction, F1,16 = 11.4, P = 0.004; eYFP vs ChR2 during laser-ON: t16 = 4.78, ***P = 0.0002). (d) Port entry behavior during CS-Suc trials, illustrated as the difference score in the percentage of time spent in the sucrose port, relative to laser-OFF. No significant differences were detected for port entry responses (group, F1,16 = 0.95, P = 0.34; laser, F1,16 = 0.13, P = 0.72; interaction, F1,16 = 0.95, P = 0.34). (e) Pharmacology experiment to rule out the possible contribution of stimulation of fibers of passage. After unilateral transduction of the BLA with ChR2 (n = 8 animals), a cannula was chronically implanted above PL to allow for the infusion of either ACSF or the AMPA and NMDA receptor antagonists NBQX and AP5 ~10-15 min prior to inserting an optical fiber for optical stimulation and behavioral testing. (f) Experimental design for drug treatment and schematic of the competition task in which half of the trials were paired with light stimulation. The trial and laser sequences were pseudorandom. (g) Freezing behavior during CS-Shock trials. Ruling out the possibility of stimulation of fibers of passage, the NBQX+AP5 treatment abolished the stimulation effect on freezing observed after the ACSF treatment (drug, F1,14 = 4.88, P = 0.044; laser, F1,14 = 7.64, P = 0.015; interaction, F1,14 = 4.88, P = 0.044; ACSF vs NBQX+AP5 during laser-ON: t7 = 3.12, **P = 0.0075). (h) Port entry behavior during CS-Suc trials. No significant differences were detected (drug, F1,14 = 1.27, P = 0.28; laser, F1,14 = 4.58, P = 0.0504; interaction, F1,14 = 1.27, P = 0.28). (i) Freezing during competition trials. Stimulation of BLA inputs to PL also enhanced freezing during competition trials under the ACSF treatment, and this effect was abolished by the NBQX+AP5 treatment (drug, F1,14 = 6.79, P = 0.02; laser, F1,14 = 1.89, P = 0.19; interaction, F1,14 = 6.79, P = 0.02; ACSF vs NBQX+AP5 during laser-ON: t7 = 3.69, **P = 0.0024). (j) Port entry behavior during competition. There was a trend towards reduced port entry responses during competition (drug, F1,14 = 2.18, P = 0.16; laser, F1,14 = 1.83, P = 0.20; interaction, F1,14 = 2.18, P = 0.16; ACSF vs NBQX+AP5 during laser-ON: t7 = 2.09, ~P = 0.056). Error bars represent s.e.m.
To control for the potential contribution of vesicle release from BLA terminals at targets other than PL, which may be induced by backpropagating action potentials or stimulating axons of passage, in a separate experiment (Fig. 6e-j and Supplementary Fig. S8b,c) we used a standard pharmacological control for projection-specific optogenetic manipulation27. In ChR2-expressing animals, we either infused a glutamate receptor antagonist cocktail (NBQX+AP5; see Methods) or artificial cerebrospinal fluid (ACSF) unilaterally into the PL, counterbalanced for order across two different sessions wherein a subset of trials were paired with photostimulation. If off-site vesicle release contributed to the behavioral change in ChR2-expressing animals relative to eYFP animals, then we would expect those contributions to exist after the NBQX+AP5 treatment. We found that infusion of NBQX+AP5 abolished the light-induced increase in freezing observed in CS-Shock trials (Fig. 6g), as well as during competition trials (Fig. 6i), confirming that transmission from BLA terminals within the PL was sufficient to promote cue-induced freezing.
Inhibition of the BLA→PL pathway suppressed cue-induced fear-related behavior
Although our photostimulation experiments demonstrated the sufficiency of the BLA→PL projection to augment fear behavior, fear-related behavior is likely governed by parallel, redundant circuits. We next tested the necessity of the BLA→PL pathway with optogenetic and chemogenetic inhibition during discrimination and competition (Fig. 7 and Supplementary Figs. S9 and S10).
Figure 7.

The BLA-PL pathway is necessary for expression of the fear-associated memory, but not for reward-seeking behavior. (a) Optogenetic strategy to inhibit BLA inputs to PL. The BLA was bilaterally transfected with either GFP (n = 6 animals) or the opsin ArchT (n = 6 animals), and optical fibers were chronically implanted just above PL to silence BLA inputs locally. (b) Competition paradigm in which half of the trials were paired with constant yellow light to silence BLA inputs to PL. The trial and laser sequences were pseudorandomized. (c) Freezing during CS-Shock trials. Silencing of BLA inputs to PL significantly impaired freezing responses (repeated measures two-way ANOVA: group, F1,10 = 5.64, P = 0.039; laser, F1,10 = 2.75, P = 0.14; interaction, F1,10 = 5.64, P = 0.039; GFP vs ArchT during laser-ON: t10 = 3.36, **P = 0.0072). (d) Port entries during CS-Suc trials. No significant differences were detected on port entry responses (group, F1,10 = 2.53, P = 0.14; laser, F1,10 = 1.70, P = 0.22; interaction, F1,10 = 2.53, P = 0.14). (e) Freezing during competition trials. Significant group differences were detected for freezing during competition (group, F1,10 = 5.20, P = 0.046; laser, F1,10 = 4.37, P = 0.063; interaction, F1,10 = 5.20, P = 0.046; GFP vs ArchT during laser-ON: t10 = 3.23, **P = 0.0091). (f) Port entries during competition trials. Significant group differences were also detected for port entries during competition (group, F1,10 = 10.5, P = 0.009; laser, F1,10 = 9.73, P = 0.011; interaction, F1,10 = 10.5, P = 0.009; GFP vs ArchT during laser-ON: t10 = 4.58, ***P = 0.001). (g) Chemogenetic strategy to selectively silence BLA cell that terminate in PL (i.e., selective inhibition of the BLA-PL population). Using a Cre-dependent dual-virus method, BLA-PL cells were bilaterally transduced with either mCherry (n = 7 animals) or M4D-Gi (n = 7 animals), which is a Gi-coupled designer receptor that induces neuronal silencing upon activation with the designer drug clozapine-N-oxide (CNO). (h) Experimental design to treat animals with either vehicle (5% DMSO in 0.9% saline, i.p.) or CNO (10 mg/kg, i.p.) ~15-20 min prior to behavioral testing. (i) Freezing behavior during CS-Shock trials. Silencing the BLA-PL population significantly impaired freezing responses (group, F1,12 = 3.41, P = 0.09; drug, F2,24 = 7.96, P = 0.0022; interaction, F2,24 = 6.31, P = 0.006; mCherry vs M4D(Gi) during CNO: t12 = 3.66, **P = 0.0033). (j) Port entry behavior during CS-Suc trials. No significant differences were detected (group, F1,12 = 0.13, P = 0.72; drug, F2,24 = 0.69, P = 0.51; interaction, F2,24 = 0.57, P = 0.58). (k) Freezing behavior during competition trials. Silencing of the BLA-PL population impaired freezing responses (group, F1,12 = 1.45, P = 0.25; drug, F2,24 = 0.09, P = 0.91; interaction, F2,24 = 2.67, P = 0.09; mCherry vs M4D(Gi) during CNO: t12 = 2.56, *P = 0.025). (l) Port entry behavior during competition trials. No significant differences were detected (group, F1,12 = 0.13, P = 0.72; drug, F2,24 = 0.60, P = 0.55; interaction, F2,24 = 0.17, P = 0.84). Error bars represent s.e.m.
For optogenetic inhibition, we bilaterally expressed the inhibitory opsin ArchT28,29 in BLA neurons and photoinhibited BLA terminals in the mPFC during the presentation of a subset of CS-Suc, CS-Shock, and competition trials (Fig. 7a,b). We found that ArchT-expressing animals showed a significant reduction in freezing during the laser-ON versus laser-OFF trials relative to GFP-expressing controls, during CS-Shock trials (Fig. 7c) and competition trials (Fig. 7e).
Given the caveats associated with optogenetic inhibition, including the possibility of photoinhibition of adjacent mPFC subregions, effects of heating, or sensory detection of the light stimulation, we also performed chemogenetic inhibition. We selectively expressed an inhibitory chemogenetic tool, hM4D(Gi) DREADDs (Designer Receptors Exclusively Activated by Designer Drugs)30 activated by clozapine-N-oxide (CNO), in BLA→PL neurons using the CAV2-Cre virus strategy (Fig. 7g). We then systemically injected either vehicle or CNO into animals prior to sessions wherein CS-Suc, CS-Shock, and competition trials were presented in a pseudo-random order (Fig. 7h). Consistent with results from our optogenetic inhibition experiment, we observed that selective inhibition of the BLA→PL neurons reduced freezing relative to mCherry-expressing controls during CS-Shock trials (Fig. 7i) and competition trials (Fig. 7k).
Discussion
In this study, we developed a novel paradigm wherein we could study the naturalistic phenomenon of orchestrating competing mechanisms elicited by simultaneous presentation of cues associated with conflicting motivational drives in a systematic trial structure to allow for extraction of neural correlates (Fig. 1). Electrophysiological recordings revealed correlated neural activity in the BLA and PL that were predominantly excitatory during the entire task. However, the direction of information flow changed depending on the specific behavioral epoch, as the BLA was more likely to lead excitatory correlations with PL during fear-related behavior (Fig. 2), and that PL neurons encoding the fear-associated cue were more likely to be correlated with BLA activity (Fig. 3). This result was bolstered by our finding that photoidentified BLA→PL neurons predominantly showed excitation in response the fear cue and more accurately decoded behavior in the face of competing signals (Fig. 4 and 5), showing that this effect was at least in part due to direct input from BLA to PL. Conversely, inhibitory cross-correlations were more often led by the BLA upon presentation of the sucrose-predictive cue (Fig. 2h), and neurons inhibited by photoidentified BLA→PL neurons (“Network Inhibited Cells”) showed a trend towards increased excitatory responding to the reward-associated cue or inhibition to the shock-predictive cue. Although the sample sizes for the inhibitory cross-correlations and network inhibited neurons were admittedly small, these data lead us to speculate that a competing reward-related network exists and is suppressed locally within the BLA2,31.
Anatomical implications
Several subtle effects from our experiments prompted us to speculate about the possible interactions between BLA and PL neurons. From our phototagging experiment (Fig. 4), we observed “Network Inhibited” neurons in the BLA that were inhibited upon photostimulation of BLA-PL neurons. We speculate that BLA-PL neurons have collaterals that may synapse locally onto BLA interneurons that inhibit these “Network Inhibited” cells, though it is possible that they collateralize to distal GABAergic neurons that have long-range projections back to the BLA. Though we are not aware of any direct evidence that the BLA contains GABAergic neurons that project to the PL, our experiments do not allow us to exclude this possibility. Further, from our BLA-PL inhibition experiments (Supplementary Fig. 9), our data suggest that inhibition of BLA-PL neurons may also disinhibit unidentified BLA neurons.
Importantly, we took care to photoinhibit BLA terminals in PL only during the cue presentation, as we wanted to avoid paradoxical vesicle release associated with prolonged illumination of ArchT-expressing axon terminals32. Even so, we observed a minority of neurons in the PL (4%; Supplementary Fig. 9h) that showed an increase in activity upon photoinhibition of BLA terminals.
It may also be noteworthy that our optogenetic manipulations produced rather subtle behavioral changes (Figs. 6 and 7). The relatively small effect sizes may reflect either redundancy in the circuitry involved in this task, or technical challenges related to using rats as opposed to mice (including greater volume of illumination required or lower relative expression levels achieved).
We found similar proportions of correlated BLA/PL cells during all task events, and a substantial proportion of cell pairs exhibited correlated activity during more than one event. This suggests that there are consistent anatomical relationships between the BLA and PL that are selectively modulated depending upon the memory that is being retrieved. While we found evidence supporting bidirectional flow of information during reward-seeking epochs, the flow of information became biased towards the BLA→PL direction during fear epochs. Importantly, this biased flow of information was not due to increased responsiveness to the shock-predictive cue compared to the sucrose-predictive cue in the BLA. More specific hypotheses of the underlying change in effective connectivity might include that BLA neurons that signal fear memory are more likely to connect functionally in a leading manner with PL. In addition, while BLA neurons that encode the same cue-value may be more likely to facilitate each other than neurons that encode the opposite cue-value, there is debate as to whether such populations are anatomically intermingled or segregated, and how they interact7,8,31,33. This suggests that statistical interrelationships are unlikely to remain completely independent across reward and fear retrieval. Despite this, we observed dynamic changes in the functional relationship between the BLA and PL that differentiated reward versus fear memory retrieval, with the BLA driving PL activity more strongly during the retrieval of fear than reward. A possible explanation for this could be that another structure mediates the changing relationship between the BLA and PL. One potential candidate is the ventral hippocampus, which is required for the expression of conditioned fear responses22, and preferentially modulates activity in both the BLA and PL during states of elevated fear and anxiety34,35.
Could another BLA-mPFC pathway preferentially guide reward-seeking behavior?
Other mPFC subregions such as the infralimbic cortex (IL) play different functional roles than PL in the regulation of reward-seeking and fear responses. In the reward domain, while PL activity is required for the initial acquisition of goal-directed reward-seeking behavior, IL activity is required for habitual reward-seeking behavior in over-trained animals36–38. Furthermore, IL shows stronger increases in activity than PL during reward-seeking tasks18. In addition, IL activity has also been correlated with food enticement39, contextually-driven reward-seeking responses13, and Pavlovian-to-instrumental transfer of reward-seeking behavior40. In the fear domain, while PL activity is crucial for fear expression11,21,41, IL activity is crucial for fear extinction and the inhibition of fear responses later on19. The ability of IL to inhibit fear could reliably allow reward-related signals to emerge without conflicting with fear signals, thus allowing reward-seeking behavior to occur. Future studies could be focused on determining the functional role of the BLA→IL pathway during reward-fear discrimination and test the hypothesis that IL may be a reward-biased pathway between the BLA and the mPFC.
Potential implications regarding the impact of emotion on cognition
While we found evidence for both “bottom-up” (BLA→PL) and “top-down” (PL→BLA) interactions overall, BLA→PL regulation dominated over the reciprocal PL→BLA regulation during fear retrieval. This finding is consistent with other models that predict transfer of information from the BLA to PL during fear learning11,12,24,25,42. Furthermore, recent studies that examined neural oscillations in the theta and gamma frequencies of local field potentials reported synchronized activity between the BLA and PL43–45. However, these oscillations did not clearly reflect preferential “bottom-up” BLA→PL regulation during fear retrieval. In contrast, “top-down” PL→BLA regulation has been reported to dominate during the presentation of “safety” cues (e.g., cues that do not predict electrical shocks)43,44, or during anesthesia in untrained anaimals46. Thus, it appears that “bottom-up” BLA→PL regulation dominates during high-fear states, whereas “top-down” PL→BLA regulation dominates during low-fear states. Nonetheless, we did not observe stronger “top-down” PL→BLA regulation during reward-seeking behavior, which is a low-fear state. Perhaps, some “bottom-up” BLA→PL regulation might have occurred during reward-seeking that countered the opposite “top-down” PL→BLA regulation during this low-fear reward-seeking state.
After being trained using only neural activity during the individual fear- and reward-associated cues, machine learning algorithms were used to decode subject behavior using neural activity from competition trials (Fig. 5). The ability to predict behavior in the face of conflicting cues suggests that limbic representations of singular motivational states are nested within the representation of these states in conflict. Indeed, the representation of emotional conflict in the BLA is not only associated with the cues that trigger positive or negative emotional states, but also the behavioral expression of those states2 Despite variability across or even within animals, behavior on competition trials was strikingly decisive within individual trials, suggesting that emotional conflict is inherently unstable and quickly pivots towards simpler, singular motivational states. Our findings support the notion that the process of conflict resolution or state stabilization has, to some extent, already occurred in the information communicated by the BLA to the PL47–50.
In summary, the present study establishes a novel paradigm and identifies new vistas for exploration regarding the distal networks and microcircuitry involved in the neural mechanisms guiding action selection in situations of conflict.
Online Methods
Animals
All procedures were approved by the Committee on Animal Care of the Massachusetts Institute of Technology and the Animal Care and Use Review Office of the USAMRMC, in compliance with the PHS Policy on Humane Care and Use of Laboratory Animals (Public Law 99–158). Adult male Long-Evans rats weighing ~275-300 g (3-months-old) were acquired from a commercial supplier (Taconic Biosciences), and were housed individually in Plexiglas home cages in a vivarium with controlled temperature, humidity, and pressure. Rats were maintained on a regular 12-hr light/dark cycle and all experiments were performed during the light phase. Water was available ad libitum. Standard rat chow was restricted to 20 g/d.
Surgeries
Rats were anesthetized using isoflurane gas (~2.0%), and surgeries were performed using stereotaxic apparatuses (Kopf Instruments). Midline incisions were made down the scalp using surgical blades and craniotomies were opened using a dental drill. Coordinates to target the BLA were -2.60 to -2.80 mm anterior-posterior (AP), ±4.80 to ±5.00 mm medial-lateral (ML), and -8.50 to -8.80 mm dorsal-ventral (DV). Coordinates to target PL were +3.00 to +2.90 mm AP, ±0.50 to ±0.75 mm ML, and -3.75 to -4.00 mm DV. All coordinates were relative to bregma. Implants were secured to the skull using stainless steel screws (Amazon), adhesive cement (C&B Metabond, Parkell), and dental acrylic (Ortho-Jet, Lang Dental). Incisions were sutured and post-operative care and analgesia (5 mg/kg Ketoprofen or 1.5 mg/kg meloxicam) were provided for 4 days. Rats were allowed to fully recover from surgery for two weeks.
Optogenetic Manipulations
Viral vectors were infused during a surgical procedure that occurred at least 12-16 weeks prior to implanting optical fibers during a second surgical procedure. All viral aliquots were obtained from the University of North Carolina Vector Core, unless otherwise specified. DNA sequences for viral constructs can be found online (www.optogenetics.org). A 10-µL microsyringe with a 33-Ga needle (Nanofil, WPI) was used to deliver viral vectors into the targets at a rate of 0.1 µL/min, using a microsyringe pump (UMP3/Micro4; WPI). Viral volumes of ~700-1000 nL were infused per target. Needles were kept at the infusion site for an extra 10 min to allow viral diffusion. Needles were slowly withdrawn at an approximate rate of 1 mm/min.
For optogenetic stimulation, the BLA was unilaterally transduced with a serotype-5 adeno-associated viral vector (AAV5) coding for the blue light-sensitive cation-pump Chlamydomonas reinhardtii channelrhodopsin-2 (ChR2), which was fused to enhanced yellow fluorescent protein (eYFP) and expressed under the calcium/calmodulin-dependent protein kinase II alpha promoter (CaMKllα) (AAV5-CaMKllα-ChR2(H134R)-eYFP). Animals in the control group received a viral vector that only coded for eYFP (AAV5-CaMKIIα-eYFP). For optogenetic inhibition, the BLA was bilaterally transduced with a viral vector coding for the yellow light-sensitive outward proton-pump Halorubrum sodomense TP009 archaerhodopsin (ArchT), which was fused to green fluorescent protein (GFP) and expressed under the CaMKllα promoter (AAV9-CaMKllα-ArchT-GFP). Animals in the control group received a viral vector that only coded for GFP (AAV8-CaMKIIα-GFP).
Optical fibers were chronically implanted in the dorsal portion of PL to either stimulate or inhibit BLA inputs. These implants consisted of a Ø400-µm core multimode fiber (NA = 0.48; Thorlabs) that was held within a stainless steel ferrule (Precision Fiber Products). Optical fibers were cut at ~5-8 mm from the bottom of the ferrules to reach PL. Fibers were polished until reaching an efficiency to transmit light of ~85-95%. During behavioral testing, optical fibers were connected to patch cords (Doric), which were in turn connected to blue or yellow light lasers (OEM Laser Systems) using FC/PC adapters located above the operant chambers. Laser output was controlled with a Master-8 pulse stimulator (A.M.P.I.). For photostimulation, 473-nm DPSS lasers (100-mW) were used to deliver 5-ms pulses of blue light at a frequency of 20 Hz, with a power of ~10 mW at the tip of the optical fibers (~80 mW/mm2). For photoinhibition, 589-nm DPSS lasers (100-mW) were used to deliver constant yellow light at a power of ~8 mW at the tip of the optical fibers (~64 mW/mm2). The blue laser was activated 500 ms prior to CS onset and deactivated 500 ms after CS offset, whereas the yellow laser was activated 1000 ms prior to CS onset and deactivated 1000 ms after CS offset.
Pharmacology Experiment
Optogenetic and pharmacology approaches were combined to rule out the possibility of stimulation of fibers of passage. After unilaterally transducing the BLA with ChR2, a 20-Ga stainless steel cannula was chronically implanted above PL (stereotaxic coordinates: 2.95 mm anterior, 0.60 mm lateral, and 3.00 mm ventral from bregma). A 24-Ga dummy was inserted to prevent clogging of the cannula, and 24-Ga injectors extending 1 mm from the tip of the cannula were used to infuse drugs into PL. A 10-µL microsyringe (Nanofil, WPI) was used to infuse drugs at a rate of 0.1 µL/min, using a microsyringe pump (UMP3/Micro4; WPI).
Drugs were delivered into PL prior to the insertion of optical fibers and behavioral testing. Animals were tested on two days in a counterbalanced fashion shortly after infusion of either artificial cerebrospinal fluid (ACSF) or the AMPA (α-amino-3-hydroxy-5-methyl-4-isoxazolepropionic acid) and NMDA (N-Methyl-D-aspartic acid) antagonists NBQX (22 mM51; 2,3-dihydroxy-6-nitro-7-sulfamoyl-benzo[f]quinoxaline-2,3-dione; Tocris) and AP5 (38 mM51; (2R)-amino-5-phosphonovaleric acid; Tocris). A total volume of 500 nL of ACSF or NBQX+AP5 (250 nL each) was infused into PL. Injectors were kept at the infusion site for an extra 5 min to allow drug diffusion. After drug infusion (~10 min), Ø400-µm core optical fibers, which were mounted on stainless steel ferrules and glued to nylon dust caps, were inserted and attached to the cannulas. Optical fibers extended ~250-500 µm beyond the cannula tips. Animals were then transferred to operant chambers and connected to patch cords for testing.
Chemogenetic Silencing
Viral vectors were used to express either the control fluorophore mCherry or the Gi-coupled designer receptor hM4D(Gi), which silences neural activity upon activation with a designer drug. mCherry or hM4D(Gi) were selectively expressed in the BLA cells terminating in PL using a Cre-dependent dual-virus strategy in which the BLA was infused with a virus containing mCherry or hM4D(Gi) within a double-floxed inverted open reading cassette (AAV5-hSyn-DIO-mCherry or AAV5-hSyn-DIO-hM4D(Gi)-mCherry), whereas PL was infused with a retrograde canine virus type-2 coding for Cre-recombinase (CAV2-Cre52; Institute of Molecular Genetics of Montpellier). Viral volumes of ~700-1000 nL were infused per site at a rate of 0.1 µL/min. Viral expression was allowed for ~12-16 weeks prior to behavioral testing. hM4D(Gi) was activated with the designer drug clozapine-N-oxide (CNO; Sigma-Aldrich), which was diluted in a solution of 5%DMSO and 0.9% saline. Systemic injections (i.p.) were performed ~15-20 min prior to behavioral testing, at a dose of 10 mg/kg to inhibit neuronal activity. Behavioral testing was also performed after multiple vehicle injections (5%DMSO in 0.9% saline).
Behavioral Tasks
Rats were trained in standard operant chambers (23 × 30 × 40 cm; Med Associates) located inside sound-attenuating cubicles. Each chamber was equipped with a red house light, light cues, speakers for the delivery of tone or white noise cues, a syringe pump to deliver sucrose, a sucrose port that was equipped with an infrared beam for the detection of entries and exits, and a grid floor for the delivery of electrical shocks. A customized digital-relay circuit was added between the shock generator and grid floor to minimize electrical artifacts. Chambers were scrubbed with 70% isopropyl alcohol after testing each animal.
All training phases occurred in the context. The first phase of training consisted of the acquisition of a Pavlovian reward association in which rats learned to associate a conditioned stimulus with sucrose (i.e., CS-Suc). To facilitate reward acquisition, rats were pre-exposed multiple times to sucrose in the homecage as well as in the training chambers. Reward conditioning consisted of the presentation of either a light cue or a sine wave tone cue (5 kHz, 80 dB) that lasted for 20 s, and predicted the delivery of a 30% sucrose solution (120 µL/trial). Sucrose was delivered over 10 s during the cue presentation (5-15 s, relative to CS onset). Rats underwent three reward sessions (one per day), and each consisted of a total of 25 trials delivered over ~35 min. The ITI was variable with an average of 1 min. Sucrose was removed by a vacuum immediately after cue offset if rats did not retrieve it during the CS.
The second phase of training consisted of the discrimination of conditioned stimuli that predicted sucrose reward (CS-Suc), aversive shocks (CS-Shock), or no outcome (CS-). The light and tone cues were counterbalanced across rats for the CS-Suc and CS-Shock associations. The white noise cue was always used for the CS-. The aversive shocks (0.40 mA) lasted for 0.5 s and co-terminated with the CS (19.5-20 s, relative to CS onset). CS-Suc, CS-Shock, and CS- trials occurred in a pseudorandom manner. Rats underwent at least three discrimination sessions (one per day), and each consisted of a total of 60 trials delivered over ~83 min. The ITI was variable with an average of 1 min.
The third phase of training tested the direct competition of reward and fear related behaviors. In addition to individual CS-Suc and CS-Shock trials, this phase of training included “competition” trials in which the CS-Suc and CS-Shock associations were co-presented to induce conflicting motivational drives and the potential for competition between reward and fear associated behaviors. CS-Suc, CS-Shock, and competition trials occurred in a pseudorandom manner, and a total of 60 trials were delivered over ~83 min during these competition sessions (variable ITI with an average of 1 min).
Reward and Fear Behaviors
Entries into the sucrose port provided a readout of reward-related behavior. Timestamps for port entries and exits were sampled from beam breaks (Med-PC IV, Med Associates). These timestamps were used to quantify the amount of time that animals spent in the port. Freezing responses, which are defined as the lack of all movement except for respiration53, provided a readout of fear-related behavior. Videos were sampled using infrared cameras at 30 fps, and freezing was quantified using an automated custom MATLAB script that quantified frame-by-frame changes in total pixel intensity, as approximations for animal motion. Frame-by-frame motion values were then converted into freezing scores using a binary method relative to a motion threshold (i.e., motion levels above a certain threshold were classified as no freezing, whereas motion levels below a certain threshold were classified as freezing). The time that animals spent in the port was subtracted from the freezing quantification as animals showed low motion while collecting sucrose.
In Vivo Single-Unit Electrophysiology
Extracellular single-unit recordings were performed using in-house built multichannel electrodes. An electrode consisted of a 10 × 2 pin connector (Mill-Max Manufacturing Corp) that accommodated 16 microwires for single-unit recordings, an extra microwire for analog reference, and a low resistance 200-µm silver wire to provide ground (A-M Systems). A 22.9-µm HML-insulated nichrome microwire was used (Stablohm 675, California Fine Wire). A 26-Ga stainless steel cannula was attached to one of the electrode pins to insert the microwire bundle. Microwires were secured to the connector pins using a silver print coating (GC Electronics). After testing for short circuits, all connections were secured using dental acrylic. Final cutting of the microwire tips was performed using serrated fine scissors (Fine Science Tools). Gold-platting of the microwire tips was performed to reduce impedance and improve the signal-to-noise ratio54. Gold-platting was achieved by submerging the electrode tips in a solution containing equal parts of a non-cyanide gold solution (SIFCO Selective Plating) and a 1 mg/mL polyethylene glycol solution (Sigma-Aldrich). A cathodal electric current of 1 µA was then applied until the impedance of each channel was reduced to a range of ~200-300 kΩ.
Extracellular waveforms exceeding a voltage threshold were band-pass filtered (500-5000 Hz) and digitized at 25 kHz using a multichannel extracellular recording workstation (Tucker-Davis Technologies). Rats were habituated to the recording tethers prior to experiments by connecting them multiple times (~30 min/d) while the experimenters adjusted the voltage thresholds to isolate stable single-units. During this procedure, rats also were habituated to the operant chambers. Neural activity was monitored during behavioral assessment, and the recorded waveforms were sorted offline using commercial software (Offline Sorter, Plexon Inc.). Principal components and peak-valley voltage values were assessed for each waveform, and then plotted in three-dimensional feature space to define clusters formed by single-units.
In Vivo Photo Identification of the BLA-PL Population
The activity of BLA cells terminating in PL (i.e., BLA-PL population) was monitored using a combination of single-unit recordings and optogenetic tools. First, ChR2 was selectively expressed in the BLA-PL population using the Cre-dependent dual-virus strategy in which the BLA was infused with a virus containing ChR2 within a DIO cassette (AAV5-EF1α-DIO-ChR2(H134R)-eYFP), whereas PL was infused with the retrograde CAV2-Cre virus. Viral volumes of 1 µL were infused in each target using 33-Ga needles. Viral expression was allowed for ~6 months prior to chronically implanting into the BLA a recording optrode (i.e., electrode containing an optical fiber for light delivery). In contrast to wire-bundle electrodes, optrodes were constructed by attaching microwires around an optical fiber (Ø300-µm, NA = 0.37; Thorlabs) that was in turn attached to the electrode connector. Wires extended ~500 µm from the tip of the optical fiber. Photo Identification of presumed ChR2+∷BLA-PL cells was achieved by delivering pulses of 473-nm blue light with a power of ~25-30 mW at the tip of the optical fibers (~17-20 mW/mm2 at the tip of the recording microwires). Two stimulation patterns were used: (a) 5-ms pulses at 1 Hz; and (b) 1-s pulses of constant light. These stimulation patterns were delivered in a pseudorandomly dispersed fashion with at least 20 iterations of each and with an average inter-stimulus interval of 10 s. This photo identification procedure was conducted shortly after the recording session in which animals underwent the behavioral paradigms.
Ex Vivo Slice Electrophysiology
Brain Tissue Preparation
BLA slices from 7 animals were examined. Approximately six months after transduction of the BLA with the AAV5-EF1α-DIO-ChR2-eYFP viral vector, and transduction of PL with the retrograde CAV2-Cre virus, rats were anesthetized with 90 mg/kg pentobarbital and perfused transcardially with 50 mL of cold, modified artificial cerebrospinal fluid (ACSF, at ~4°C) containing (in mM): 75 sucrose, 87 NaCl, 2.5 KCl, 1.3 NaH2PO4, 7 MgCl2, 0.5 CaCl2, 25 NaHCO3 and 5 ascorbic acid. The brain was then extracted and glued (Roti coll 1; Carh Roth GmbH) to the platform of a semiautomatic vibrating blade microtome (VT1200; Leica). The platform was placed in the slicing chamber containing modified ACSF at 4°C. 300-μm coronal sections containing the BLA were collected in a holding chamber filled with ACSF saturated with 95% O2 and 5% CO2, containing (in mM): 126 NaCl, 2.5 KCl, 1.25 NaH2PO4, 1.0 MgCl2, 2.4 CaCl2, 26.0 NaHCO3, and 10 glucose. Recordings were started 1 h after slicing, and the temperature was maintained at approximately 31°C both in the holding chamber and during the recordings.
Whole-Cell Patch-Clamp Recordings
Recordings were made on visually identified neurons expressing eYFP. Oxygenated ACSF was perfused onto the slice with a peristaltic pump (Minipuls3; Gilson) at ~3 mL/min. Recorded cells were filled with Alexa Fluor (AF) 350 and biocytin. Voltage- and current-clamp recordings were conducted using glass microelectrodes (4-7 MΩ) molded with a horizontal puller (P-1000) and filled with a solution containing (in mM): 125 potassium gluconate, 20 HEPES, 10 NaCl, 3 MgATP, 8 biocytin and 2 Alexa Fluor 350 (pH = 7.33; 287 milliOsmol). Recorded signals were amplified using a Multiclamp 700B amplifier (Molecular Devices). Analog signals were digitized at 10 kHz using Digidata 1440 and recorded using the pClamp10 software (Molecular Devices).
After opening the cell membrane, neurons where confirmed to express ChR2 if they showed a constant inward current in voltage-clamp in response to a 1-s constant blue light pulse, with a light power density of 84 mW/mm2 (20 mW with a 40× objective) delivered via a 470-nm LED light source. From the 30 recorded neurons, 6 were confirmed to express ChR2 as they showed constant inward currents in response to the light pulse. The remaining 24 neurons were confirmed to not express ChR2 nor receiving inputs from nearby ChR2 neurons, as they did not respond to the light stimulus. Cell bodies for the 24 neighboring cells were located at least 150 µm from the cell bodies of ChR2-expressing neurons.
After categorizing the cells as ChR2-expressing or non-expressing, we recorded the photoresponse of the expressing neurons in current-clamp. The six ChR2+ neurons received 5-ms single pulses delivered every 10 s, and 20-s trains of 5-ms pulses at 1 Hz at increasing light power light power density until a maximum of 84 mW/mm2 (20 mW with a 40× objective). The location within the BLA of all recorded neurons was confirmed after the recording. Co-localization of AF 350 and eYFP was confirmed for the six ChR2+ neurons.
Latency of Photoresponses
Offline analysis was performed using Clampfit software (Molecular Devices). Light-evoked latencies of action potentials (AP) were measured during 40 light stimulations delivered at 1 Hz (5-ms pulses; two individual 20-pulse trains). Latencies were measured from the onset of the light pulse to the peak of the AP.
Histology
Rats were euthanized with sodium pentobarbital (150 mg/kg) and microlesions were produced at the recording sites by passing an anodal electrical current (20 s at ~25-35 µA on at least 4 channels). Rats were transcardially perfused with ice-cold phosphate buffer saline (1×-PBS) and paraformaldehyde (4% PFA, pH = 7.3). Brains were collected and fixed in 4% PFA for 24 hr and equilibrated in 30% sucrose for 48 hr. Coronal sections were cut at 60 µm using a microtome (HM430, Thermo Fisher Scientific).
Brain sections containing the BLA and PL were incubated for 30 min in a DNA-specific fluorescent probe (DAPI: 4′,6-Diamidino-2-Phenylindole; 1:50,000 dilution). After 4 washes in 1×-PBS (10 min each), sections were mounted on microscope slides using fluorescence-compatible PVD-DABCO media. Confocal images were acquired with an Olympus FV1000 confocal laser-scanning microscope, using a 10×/0.40NA or 40×/1.30NA oil immersion objective. Image stitches and serial z-stacks were achieved with commercial imaging software (Fluoview, Olympus). Expression of eYFP and DAPI was examined in sections containing various anterior-posterior coronal levels of the BLA and PL. Microlesions were examined on confocal images and reconstructed onto coronal drawings adapted from a rat brain atlas55.
Statistical Analyses
All statistical analyses were based on two-tailed comparisons and were performed using either GraphPad Prism (GraphPad Software, Inc.), unless otherwise specified. Although no statistical tests were used to pre-determine sample sizes, our sample sizes are consistent with previous publications56–58. All data met the assumptions of every statistical tests used. The Kolmogorov-Smirnov normality test was used to determine if data sets required parametric or non-parametric statistical tests.
Randomization and Blinding
For behavioral training, the counterbalanced auditory and visual CSs were randomly assigned to animals. Pseudorandom trial sequences were generated to deliver CS-Suc, CS-Shock, CS-, Competition, laser-OFF, and laser-ON trials. All animals received the same trial and laser sequences in any given experiment. Viral treatments for optogenetic and chemogenetic experiments were randomly assigned to animals. For the pharmacology experiment, the vehicle and drug treatments were randomly assign during the initial test session, whereas they were counterbalanced during the second test session. Although blinding was not performed, behavioral testing was controlled by software and data analyses were performed using customized automated methods whenever possible. In addition, all experiments were designed with appropriate internal controls (e.g., within-subject comparisons of laser-OFF versus laser-ON trials, within-subject comparisons of CS-Suc versus CS-Shock trials, etc.).
Exclusion of Animals, Cells, or Data Points
Several animals were excluded from this study due to either electrode misplacement (n = 2 animals), lack of viral expression (n = 5 animals), viral leakage (n = 2 animals), or breakage or misplacement of optical fibers (n = 3 animals). Several cells were also excluded from this study (BLA: n = 22 cells, PL: n = 23 cells) due to repetitions across channels. In addition, for cross-correlation analyses, we excluded cells that fired at low frequencies (< 0.1 Hz), which typically produce unpopulated correlograms with spurious peaks and troughs. One data point was excluded from the decoding analysis as it was detected by the Grubbs' test as a statistically significant outlier.
Behavioral Data
Pearson's correlation test was used on a subset of freezing data to determine whether our automated quantification method provided reliable values compared to hand-scoring (df = 58; R = 0.989; P < 0.0001; n = 60 trials including CS-Suc, CS-Shock, and Compet; n = 3 animals). For the initial behavioral experiments, within-subject comparisons of port and freezing data across distinct CSs were performed using either paired T-test (in the case of two conditions) or one-way analysis of variance (ANOVA) with repeated-measures and Bonferroni post-hoc tests (in the case of three or more conditions). For optogenetic and chemogenetic experiments, normalizations were performed to port and freezing data by calculating the difference between experimental conditions (%time values were used for the subtractions). For instance, the percentage of time that animals spent performing either of the behaviors during laser-OFF trials was subtracted from laser-ON trials (i.e., laser-ON minus laser-OFF). Similarly, values obtained during the first test session in the chemogenetic experiment were subtracted from values obtained during subsequent sessions (e.g., CNO minus Veh1). Statistical comparisons between groups were performed using two-way ANOVA with repeated measures and Bonferroni post-hoc tests.
Quality of Cluster Sorting
Single-units were considered for analysis if clusters met two sorting quality statistical parameters: (a) multivariate analysis of variance (MANOVA; probability threshold for significance was set to P < 0.01), which indicated that each cluster was positioned at a statistically different feature space location at any given feature space; and (b) the non-parametric J3 statistic, which measured the ratio of between-cluster to within-cluster scatter. These cluster statistics were examined using Offline Sorter (Plexon Inc.). To avoid duplicates across channels, auto-correlograms and cross-correlograms of simultaneously recorded units were inspected using Neuroexplorer (NEX Technologies).
Putative Principal Cells and Interneurons
Using a hierarchical clustering method, BLA and PL cells were separated into putative principal neurons versus interneurons based on spike width and firing frequency59,60. Three parameters were used: (a) latency of the depolarization phase at half amplitude, (b) latency of the hyperpolarization phase at half amplitude, and (c) the average firing frequency during the entire recording session.
Cross-Correlations (CCs)
CCs were assessed to examine whether BLA and PL cells exhibited different patterns of functional interactions during distinct task epochs. Analyses for CCs were performed using a combination of tools in Neuroexplorer (NEX Technologies), Matlab (MathWorks), and R (R Core Team; https://www.R-project.org/). CCs were examined during various task epochs: (a) ITI, (b) CS-Suc, (c) CS-Shock, (d) CS-, and (e) Competition. The ITI epochs were pseudorandomly generated such that they matched the number of CS epochs in any given recording session, and such that the ITI epochs were at least 5 s away from any CS epoch. To generate CCs, the BLA spikes were used as the reference events, and the PL spikes were used as the target events. CCs were generated for a window of ±1000 ms relative to the reference spikes, using bin widths of 25 ms61.
Two correction methods were applied to control for apparent correlations that might be due to CS-elicited covariation or nonstationary firing rates: (a) trial-shift predictor in which spike trains from the reference and target neurons were compared during shifted trials (19 trial shifts were applied per neural pair); and (b) spike- shuffle predictor in which the spike trains of the reference neurons were repeatedly shuffled over time (100 random spike shuffles per trial were applied). The trial-shift predictor and spike-shuffle predictor correlograms were individually subtracted from the raw correlograms, and neural pairs were deemed significantly correlated if peaks or troughs reached statistical significance after application of both correction methods. The statistical significance of peaks and troughs was determined by Z-score transformations of the corrected correlograms, relative to the average standard deviations of correlogram generated for each predictor. Significant peaks and troughs were evaluated within an experimental window of ±100 ms relative to the reference spikes, using a Z-score criterion that was based on a two-tailed significance level of P < 0.01, and that was Bonferroni-corrected for multiple comparisons (i.e., eight 25-ms bins within the ±100 ms window; actual P = 0.01/8 = 0.00125). The significance P-value of 0.00125 corresponded to Z-score thresholds of Z > 3.23 for excitatory CCs or Z < -3.23 for inhibitory CCs. CCs had to meet these significance thresholds for both predictor-corrections (trial-shifting and spike-shuffling) in order to be considered for further analyses.
Since 25-ms bins were too broad to detect coincident firing, zero-lag “common-input” correlations62 were examined from 5-ms binned correlograms with the central bin centered at zero (i.e., ±2.5 ms). If the 5-ms binned correlograms exhibited peaks or troughs centered at zero, correlations were considered as “common input”, and they were excluded from analyses.
The timing of peaks and troughs in the 25-ms binned correlograms was examined to determine putative lead and lag. Excluding zero-lag cell pairs, correlations were considered to be led by BLA if peaks or troughs occurred after the BLA reference spikes (i.e., within +2.5 to +100 ms in the correlograms), whereas correlations were considered to be led by PL if peaks or troughs occurred before the BLA reference spikes (i.e., within -100 to -2.5 ms in the correlograms). Proportions of significantly correlated cell pairs were compared across task epochs using Bonferroni-corrected chi-square tests. Results obtained with the 25-ms binned correlograms were confirmed using 10-ms binned correlograms63. However, the narrower bins in the setting of low firing rate cells led to highly sparse correlograms with increased variability and the potential for false positive and false negative correlations. In addition, the narrower bins failed to detect many inhibitory correlations that were detected with the wider bins, due to increased variability and floor effects, especially in the low firing rate cell pairs.
CS-Evoked Responses
The response of individual cells to CSs was examined using a combination of the non-parametric Wilcoxon signed-rank test (as primary) and a Z-score test (as secondary). Given the existence of cells in both the BLA and PL that typically show either “transient” or “prolonged” responses to CSs64–68, two signed-rank tests with 1000 bootstraps and Bonferroni corrections were performed per CS. For transient responses, neural activity was binned in 25 ms intervals, and comparisons were made between a baseline window ranging from -1 to 0 s and an experimental window ranging from 0 to 300 ms, relative to CS onset. For prolonged responses, activity was binned in 50 ms intervals, and comparisons were made between a baseline window ranging from -2 to 0 s and an experimental window ranging from 0 to 1.5 s, relative to CS onset. The Z-score test confirmed that the peak responses reached a certain significance threshold of either Z > 2.58 for excitatory responses (corresponding to P < 0.01) or Z < -1.96 for inhibitory responses (corresponding to P < 0.05). Cells that met both the Wilcoxon and Z-score criteria were then considered as CS-responsive cells. Proportions of CS-responsive populations were compared using chi-square tests with Bonferroni corrections for multiple comparisons.
Machine Learning to Decode Neuronal Activity and Predict Behavior
A machine-learning algorithm69,70 was used to determine whether behavioral responses during competition trials could be predicted based on how individual cells responded during CS-Suc and CS-Shock trials. Neural data for individual cells was extracted for the entire 20 s of each trial (20 trials for the CS-Suc, 20 trials for the CS-Shock, and 20 trials for Competition). These data were then preprocessed by binning neural activity within each individual trial into 50-ms bins. Spike density estimates for each trial were then generated by convolving the binned rasters with a Gaussian kernel (standard deviation of 200 ms). The dimensionality of each cell's data was further reduced using principal component analysis across all trial types71, and retained the first four principal component scores for each trial. This procedure reduced the data from 400 data points per cell per trial (50-ms bins over 20 s) to only four data points per cell per trial. The same preprocessing steps were used for pairs of BLA and PL cells, except that the spike trains of each cell were concatenated prior to principal component analysis, and eight principle components were selected in total for each pair of cells. Each pair of cells was separately preprocessed using all possible combinations of simultaneously recorded cells.
The reduced preprocessed data was then used to train a support vector machine (SVM) classifier72,73. The SVM classifier was trained using linear kernels (fitcsvm.m, Matlab R2015b) to determine the optimal hyperplane that separated neural activity during the CS-Suc and CS-Shock trials. The identified separating hyperplane was then used to predict behavioral responses during competition trials by classifying neuronal activity as more “CS-Suc like” or more “CS-Shock like” on a trial-by-trial basis. Cross-validation was not necessary as data from the competition trials was never used to train the classifier but only used to test it. The predicted classification was compared to the actual behavioral output of the animal to determine whether the prediction was correct or incorrect. The decoding accuracy for a given cell or cell pair was calculated as the percentage of competition trials in which the predicted behavioral response matched the actual response of the animal. The statistical significance of the calculated decoding accuracies were empirically determined using permutation tests, which compared the decoding accuracy for real training data to decoding accuracies obtained after scrambling the identity of the CS-Suc and CS-Shock trials 1000 times, each time generating a permuted separating hyperplane that was used to classify the actual neural data from competition trials74. The decoding accuracy obtained using the hyperplane derived from the actual CS-Suc and CS-Shock neural data was compared to the permuted distribution only once, therefore there was no need to correct for multiple comparisons. For between-population comparisons of the decoding accuracies, we used one-way ANOVA with Bonferroni post-hoc tests. For within-population comparisons against scrambled data, we used Bonferroni-corrected paired T-tests.
Supplementary Material
Acknowledgments
The authors thank Siamak Sorooshyari for helpful discussion and assistance on MATLAB programming, as well as Craig Wildes and the entire Tye Laboratory for helpful discussion and support on this project. A.B.R. was supported by the Brain and Behavior Research Foundation (NARSAD Young Investigator Award) and NIMH (Research Supplement to Promote Diversity in Health-Related Sciences). E.Y.K. was supported by the Collaborative Clinical Neuroscience Fellowship and the American Brain Foundation Clinical Research Training Fellowship. W.A.R.G. and P.A.P.R. were supported by the MIT Summer Research Program, which received support from the Center for Brains, Minds and Machines (CBMM), NSF (STC Award CCF-1231216), and NIH (Endure Award 1R25-MH092912-01). E.H.N. was supported by the National Science Foundation Graduate Research Fellowship (NSF GRFP), the Integrative Neuronal Systems Training Fellowship (T32 GM007484), and the Training Program in the Neurobiology of Learning and Memory. A.C.F.O. was supported by an institutional NRSA training grant (5T32GM007484-38). P.N. was supported by the Singleton, Leventhal and Whitaker fellowships. C.A.L. was supported by the NSF Graduate Research Fellowship, Integrative Neuronal Systems Fellowship, and the James R. Killian Fellowship. M.J.P, K.N.P., and M.A. were supported by the MIT Undergraduate Research Opportunities Program. K.K.A. was supported by the MIT Research Assistantship Program. K.M.T. is a New York Stem Cell Foundation - Robertson Investigator and McKnight Scholar and this work was supported by funding from the JPB Foundation, PIIF, PNDRF, JFDP, Whitehall Foundation, Klingenstein Foundation, NARSAD Young Investigator Award, Alfred P Sloan Foundation, New York Stem Cell Foundation, McKnight Foundation, NIH R01-MH102441-01 (NIMH), R01-AA023305-01 (NIAAA), and NIH Director's New Innovator Award DP2-DK-102256-01 (NIDDK).
Data and Code Availability: All relevant data and code supporting the findings of this study are available from the corresponding author upon reasonable request.
Footnotes
Author Contributions: A.B.R. and K.M.T. conceived and designed experiments. A.B.R. and K.N.P. designed and constructed electrodes and optrodes for neural recordings. A.B.R. performed surgeries to chronically implant electrodes and performed single-unit recordings. A.B.R., C.A.L., and K.N.P. sorted extracellular waveforms. A.B.R. and E.Y.K. analyzed electrophysiology data. E.Y.K. wrote the MATLAB scripts for the support vector machine learning algorithms. E.M.I., M.J.P., K.N.P., P.A.P.R., and M.A. built optical fibers. A.B.R., E.M.I., M.J.P., W.A.R.G., K.N.P, and M.A. performed animal training and analyzed behaviors from videos. A.B.R., E.M.I., M.J.P., W.A.R.G., A.C.F.O., K.N.P., and M.A. performed histological assessment. E.H.N. assisted with programing of the neural recording workstation and wrote the MATLAB script for quantification of animal movement. P.N. assisted with Med-PC programming for behavioral paradigms and wrote the MATLAB scripts to analyze port entry data and waveform properties. A.B. performed ex vivo whole-cell patch-clamp electrophysiological recordings. A.B. and A.C.F.O. assisted with figures. A.B.R., E.Y.K., and K.M.T. made figures and wrote the manuscript. All authors contributed to the editing and revision of the final version of the manuscript.
Competing Financial Interests: The authors declare no competing financial interests.
References
- 1.Maren S, Quirk GJ. Neuronal signalling of fear memory. Nat Rev Neurosci. 2004;5:844–852. doi: 10.1038/nrn1535. [DOI] [PubMed] [Google Scholar]
- 2.Janak PH, Tye KM. From circuits to behaviour in the amygdala. Nature. 2015;517:284–292. doi: 10.1038/nature14188. [DOI] [PMC free article] [PubMed] [Google Scholar]
- 3.Rogan MT, Stäubli UV, LeDoux JE. Fear conditioning induces associative long-term potentiation in the amygdala. Nature. 1997;390:604–607. doi: 10.1038/37601. [DOI] [PubMed] [Google Scholar]
- 4.Paton JJ, Belova MA, Morrison SE, Salzman CD. The primate amygdala represents the positive and negative value of visual stimuli during learning. Nature. 2006;439:865–870. doi: 10.1038/nature04490. [DOI] [PMC free article] [PubMed] [Google Scholar]
- 5.Tye KM, Stuber GD, de Ridder B, Bonci A, Janak PH. Rapid strengthening of thalamo-amygdala synapses mediates cue-reward learning. Nature. 2008;453:1253–1257. doi: 10.1038/nature06963. [DOI] [PMC free article] [PubMed] [Google Scholar]
- 6.Shabel SJ, Janak PH. Substantial similarity in amygdala neuronal activity during conditioned appetitive and aversive emotional arousal. Proc Natl Acad Sci U S A. 2009;106:15031–15036. doi: 10.1073/pnas.0905580106. [DOI] [PMC free article] [PubMed] [Google Scholar]
- 7.Namburi P, et al. A circuit mechanism for differentiating positive and negative associations. Nature. 2015;520:675–678. doi: 10.1038/nature14366. [DOI] [PMC free article] [PubMed] [Google Scholar]
- 8.Beyeler A, et al. Divergent Routing of Positive and Negative Information from the Amygdala during Memory Retrieval. Neuron. 2016;90:348–361. doi: 10.1016/j.neuron.2016.03.004. [DOI] [PMC free article] [PubMed] [Google Scholar]
- 9.Choi JS, Kim JJ. Amygdala regulates risk of predation in rats foraging in a dynamic fear environment. Proc Natl Acad Sci U S A. 2010;107:21773–21777. doi: 10.1073/pnas.1010079108. [DOI] [PMC free article] [PubMed] [Google Scholar]
- 10.Amir A, Lee SC, Headley DB, Herzallah MM, Pare D. Amygdala Signaling during Foraging in a Hazardous Environment. J Neurosci Off J Soc Neurosci. 2015;35:12994–13005. doi: 10.1523/JNEUROSCI.0407-15.2015. [DOI] [PMC free article] [PubMed] [Google Scholar]
- 11.Burgos-Robles A, Vidal-Gonzalez I, Quirk GJ. Sustained conditioned responses in prelimbic prefrontal neurons are correlated with fear expression and extinction failure. J Neurosci Off J Soc Neurosci. 2009;29:8474–8482. doi: 10.1523/JNEUROSCI.0378-09.2009. [DOI] [PMC free article] [PubMed] [Google Scholar]
- 12.Senn V, et al. Long-range connectivity defines behavioral specificity of amygdala neurons. Neuron. 2014;81:428–437. doi: 10.1016/j.neuron.2013.11.006. [DOI] [PubMed] [Google Scholar]
- 13.Moorman DE, Aston-Jones G. Prefrontal neurons encode context-based response execution and inhibition in reward seeking and extinction. Proc Natl Acad Sci U S A. 2015;112:9472–9477. doi: 10.1073/pnas.1507611112. [DOI] [PMC free article] [PubMed] [Google Scholar]
- 14.McGarry LM, Carter AG. Inhibitory Gating of Basolateral Amygdala Inputs to the Prefrontal Cortex. J Neurosci Off J Soc Neurosci. 2016;36:9391–9406. doi: 10.1523/JNEUROSCI.0874-16.2016. [DOI] [PMC free article] [PubMed] [Google Scholar]
- 15.Dilgen J, Tejeda HA, O'Donnell P. Amygdala inputs drive feedforward inhibition in the medial prefrontal cortex. J Neurophysiol. 2013;110:221–229. doi: 10.1152/jn.00531.2012. [DOI] [PMC free article] [PubMed] [Google Scholar]
- 16.Gabbott PLA, Warner TA, Jays PRL, Salway P, Busby SJ. Prefrontal cortex in the rat: projections to subcortical autonomic, motor, and limbic centers. J Comp Neurol. 2005;492:145–177. doi: 10.1002/cne.20738. [DOI] [PubMed] [Google Scholar]
- 17.Ishikawa A, Ambroggi F, Nicola SM, Fields HL. Contributions of the amygdala and medial prefrontal cortex to incentive cue responding. Neuroscience. 2008;155:573–584. doi: 10.1016/j.neuroscience.2008.06.037. [DOI] [PMC free article] [PubMed] [Google Scholar]
- 18.Burgos-Robles A, Bravo-Rivera H, Quirk GJ. Prelimbic and infralimbic neurons signal distinct aspects of appetitive instrumental behavior. PloS One. 2013;8:e57575. doi: 10.1371/journal.pone.0057575. [DOI] [PMC free article] [PubMed] [Google Scholar]
- 19.Burgos-Robles A, Vidal-Gonzalez I, Santini E, Quirk GJ. Consolidation of fear extinction requires NMDA receptor-dependent bursting in the ventromedial prefrontal cortex. Neuron. 2007;53:871–880. doi: 10.1016/j.neuron.2007.02.021. [DOI] [PubMed] [Google Scholar]
- 20.Sotres-Bayon F, Quirk GJ. Prefrontal control of fear: more than just extinction. Curr Opin Neurobiol. 2010;20:231–235. doi: 10.1016/j.conb.2010.02.005. [DOI] [PMC free article] [PubMed] [Google Scholar]
- 21.Courtin J, et al. Prefrontal parvalbumin interneurons shape neuronal activity to drive fear expression. Nature. 2014;505:92–96. doi: 10.1038/nature12755. [DOI] [PubMed] [Google Scholar]
- 22.Sierra-Mercado D, Padilla-Coreano N, Quirk GJ. Dissociable roles of prelimbic and infralimbic cortices, ventral hippocampus, and basolateral amygdala in the expression and extinction of conditioned fear. Neuropsychopharmacol Off Publ Am Coll Neuropsychopharmacol. 2011;36:529–538. doi: 10.1038/npp.2010.184. [DOI] [PMC free article] [PubMed] [Google Scholar]
- 23.Sangha S, Robinson PD, Greba Q, Davies DA, Howland JG. Alterations in reward, fear and safety cue discrimination after inactivation of the rat prelimbic and infralimbic cortices. Neuropsychopharmacol Off Publ Am Coll Neuropsychopharmacol. 2014;39:2405–2413. doi: 10.1038/npp.2014.89. [DOI] [PMC free article] [PubMed] [Google Scholar]
- 24.Laviolette SR, Lipski WJ, Grace AA. A subpopulation of neurons in the medial prefrontal cortex encodes emotional learning with burst and frequency codes through a dopamine D4 receptor-dependent basolateral amygdala input. J Neurosci Off J Soc Neurosci. 2005;25:6066–6075. doi: 10.1523/JNEUROSCI.1168-05.2005. [DOI] [PMC free article] [PubMed] [Google Scholar]
- 25.Sotres-Bayon F, Sierra-Mercado D, Pardilla-Delgado E, Quirk GJ. Gating of fear in prelimbic cortex by hippocampal and amygdala inputs. Neuron. 2012;76:804–812. doi: 10.1016/j.neuron.2012.09.028. [DOI] [PMC free article] [PubMed] [Google Scholar]
- 26.Nieh EH, et al. Decoding Neural Circuits that Control Compulsive Sucrose Seeking. Cell. 2015;160:528–541. doi: 10.1016/j.cell.2015.01.003. [DOI] [PMC free article] [PubMed] [Google Scholar]
- 27.Tye KM, et al. Amygdala circuitry mediating reversible and bidirectional control of anxiety. Nature. 2011;471:358–362. doi: 10.1038/nature09820. [DOI] [PMC free article] [PubMed] [Google Scholar]
- 28.Chow BY, et al. High-performance genetically targetable optical neural silencing by light-driven proton pumps. Nature. 2010;463:98–102. doi: 10.1038/nature08652. [DOI] [PMC free article] [PubMed] [Google Scholar]
- 29.Mattis J, et al. Principles for applying optogenetic tools derived from direct comparative analysis of microbial opsins. Nat Methods. 2012;9:159–172. doi: 10.1038/nmeth.1808. [DOI] [PMC free article] [PubMed] [Google Scholar]
- 30.Armbruster BN, Li X, Pausch MH, Herlitze S, Roth BL. Evolving the lock to fit the key to create a family of G protein-coupled receptors potently activated by an inert ligand. Proc Natl Acad Sci. 2007;104:5163–5168. doi: 10.1073/pnas.0700293104. [DOI] [PMC free article] [PubMed] [Google Scholar]
- 31.Kim J, Pignatelli M, Xu S, Itohara S, Tonegawa S. Antagonistic negative and positive neurons of the basolateral amygdala. Nat Neurosci. 2016;19:1636–1646. doi: 10.1038/nn.4414. [DOI] [PMC free article] [PubMed] [Google Scholar]
- 32.Mahn M, Prigge M, Ron S, Levy R, Yizhar O. Biophysical constraints of optogenetic inhibition at presynaptic terminals. Nat Neurosci. 2016;19:554–556. doi: 10.1038/nn.4266. [DOI] [PMC free article] [PubMed] [Google Scholar]
- 33.Zhang W, et al. Functional circuits and anatomical distribution of response properties in the primate amygdala. J Neurosci Off J Soc Neurosci. 2013;33:722–733. doi: 10.1523/JNEUROSCI.2970-12.2013. [DOI] [PMC free article] [PubMed] [Google Scholar]
- 34.Adhikari A, Topiwala MA, Gordon JA. Single units in the medial prefrontal cortex with anxiety-related firing patterns are preferentially influenced by ventral hippocampal activity. Neuron. 2011;71:898–910. doi: 10.1016/j.neuron.2011.07.027. [DOI] [PMC free article] [PubMed] [Google Scholar]
- 35.Jin J, Maren S. Fear renewal preferentially activates ventral hippocampal neurons projecting to both amygdala and prefrontal cortex in rats. Sci Rep. 2015;5:8388. doi: 10.1038/srep08388. [DOI] [PMC free article] [PubMed] [Google Scholar]
- 36.Killcross S, Coutureau E. Coordination of actions and habits in the medial prefrontal cortex of rats. Cereb Cortex N Y N. 2003;199113:400–408. doi: 10.1093/cercor/13.4.400. [DOI] [PubMed] [Google Scholar]
- 37.Balleine BW, O'Doherty JP. Human and rodent homologies in action control: corticostriatal determinants of goal-directed and habitual action. Neuropsychopharmacol Off Publ Am Coll Neuropsychopharmacol. 2010;35:48–69. doi: 10.1038/npp.2009.131. [DOI] [PMC free article] [PubMed] [Google Scholar]
- 38.Smith KS, Virkud A, Deisseroth K, Graybiel AM. Reversible online control of habitual behavior by optogenetic perturbation of medial prefrontal cortex. Proc Natl Acad Sci U S A. 2012;109:18932–18937. doi: 10.1073/pnas.1216264109. [DOI] [PMC free article] [PubMed] [Google Scholar]
- 39.Valdés JL, Maldonado P, Recabarren M, Fuentes R, Torrealba F. The infralimbic cortical area commands the behavioral and vegetative arousal during appetitive behavior in the rat. Eur J Neurosci. 2006;23:1352–1364. doi: 10.1111/j.1460-9568.2006.04659.x. [DOI] [PubMed] [Google Scholar]
- 40.Keistler C, Barker JM, Taylor JR. Infralimbic prefrontal cortex interacts with nucleus accumbens shell to unmask expression of outcome-selective Pavlovian-to-instrumental transfer. Learn Mem Cold Spring Harb N. 2015;22:509–513. doi: 10.1101/lm.038810.115. [DOI] [PMC free article] [PubMed] [Google Scholar]
- 41.Corcoran KA, Quirk GJ. Activity in prelimbic cortex is necessary for the expression of learned, but not innate, fears. J Neurosci Off J Soc Neurosci. 2007;27:840–844. doi: 10.1523/JNEUROSCI.5327-06.2007. [DOI] [PMC free article] [PubMed] [Google Scholar]
- 42.Klavir O, Genud-Gabai R, Paz R. Functional connectivity between amygdala and cingulate cortex for adaptive aversive learning. Neuron. 2013;80:1290–1300. doi: 10.1016/j.neuron.2013.09.035. [DOI] [PubMed] [Google Scholar]
- 43.Likhtik E, Stujenske JM, Topiwala MA, Harris AZ, Gordon JA. Prefrontal entrainment of amygdala activity signals safety in learned fear and innate anxiety. Nat Neurosci. 2014;17:106–113. doi: 10.1038/nn.3582. [DOI] [PMC free article] [PubMed] [Google Scholar]
- 44.Stujenske JM, Likhtik E, Topiwala MA, Gordon JA. Fear and safety engage competing patterns of theta-gamma coupling in the basolateral amygdala. Neuron. 2014;83:919–933. doi: 10.1016/j.neuron.2014.07.026. [DOI] [PMC free article] [PubMed] [Google Scholar]
- 45.Karalis N, et al. 4-Hz oscillations synchronize prefrontal-amygdala circuits during fear behavior. Nat Neurosci. 2016;19:605–612. doi: 10.1038/nn.4251. [DOI] [PMC free article] [PubMed] [Google Scholar]
- 46.Likhtik E, Pelletier JG, Paz R, Paré D. Prefrontal control of the amygdala. J Neurosci Off J Soc Neurosci. 2005;25:7429–7437. doi: 10.1523/JNEUROSCI.2314-05.2005. [DOI] [PMC free article] [PubMed] [Google Scholar]
- 47.Etkin A, Egner T, Peraza DM, Kandel ER, Hirsch J. Resolving Emotional Conflict: A Role for the Rostral Anterior Cingulate Cortex in Modulating Activity in the Amygdala. Neuron. 2006;51:871–882. doi: 10.1016/j.neuron.2006.07.029. [DOI] [PubMed] [Google Scholar]
- 48.Comte M, et al. Dissociating Bottom-Up and Top-Down Mechanisms in the Cortico-Limbic System during Emotion Processing. Cereb Cortex N Y N. 2016;199126:144–155. doi: 10.1093/cercor/bhu185. [DOI] [PubMed] [Google Scholar]
- 49.Rohr CS, et al. The neural networks of subjectively evaluated emotional conflicts. Hum Brain Mapp. 2016;37:2234–2246. doi: 10.1002/hbm.23169. [DOI] [PMC free article] [PubMed] [Google Scholar]
- 50.Kanske P, Kotz SA. Emotion Speeds up Conflict Resolution: A New Role for the Ventral Anterior Cingulate Cortex? Cereb Cortex. 2011;21:911–919. doi: 10.1093/cercor/bhq157. [DOI] [PubMed] [Google Scholar]
- 51.Felix-Ortiz AC, et al. BLA to vHPC inputs modulate anxiety-related behaviors. Neuron. 2013;79:658–664. doi: 10.1016/j.neuron.2013.06.016. [DOI] [PMC free article] [PubMed] [Google Scholar]
- 52.Kremer EJ, Boutin S, Chillon M, Danos O. Canine adenovirus vectors: an alternative for adenovirus-mediated gene transfer. J Virol. 2000;74:505–512. doi: 10.1128/jvi.74.1.505-512.2000. [DOI] [PMC free article] [PubMed] [Google Scholar]
- 53.Blanchard RJ, Flannelly KJ, Blanchard DC. Defensive behavior of laboratory and wild Rattus norvegicus. J Comp Psychol Wash DC 1983. 1986;100:101–107. [PubMed] [Google Scholar]
- 54.Ferguson JE, Boldt C, Redish AD. Creating low-impedance tetrodes by electroplating with additives. Sens Actuators Phys. 2009;156:388–393. doi: 10.1016/j.sna.2009.10.001. [DOI] [PMC free article] [PubMed] [Google Scholar]
- 55.Paxinos G, Watson C. The Rat Brain in Stereotaxic Coordinates. Academic Press; 1998. [DOI] [PubMed] [Google Scholar]
- 56.Meyer RM, Burgos-Robles A, Liu E, Correia SS, Goosens KA. A ghrelin-growth hormone axis drives stress-induced vulnerability to enhanced fear. Mol Psychiatry. 2014;19:1284–1294. doi: 10.1038/mp.2013.135. [DOI] [PMC free article] [PubMed] [Google Scholar]
- 57.Do-Monte FH, Quiñones-Laracuente K, Quirk GJ. A temporal shift in the circuits mediating retrieval of fear memory. Nature. 2015;519:460–463. doi: 10.1038/nature14030. [DOI] [PMC free article] [PubMed] [Google Scholar]
- 58.Felix-Ortiz AC, Burgos-Robles A, Bhagat ND, Leppla CA, Tye KM. Bidirectional modulation of anxiety-related and social behaviors by amygdala projections to the medial prefrontal cortex. Neuroscience. 2015 doi: 10.1016/j.neuroscience.2015.07.041. [DOI] [PMC free article] [PubMed] [Google Scholar]
- 59.Barthó P, et al. Characterization of neocortical principal cells and interneurons by network interactions and extracellular features. J Neurophysiol. 2004;92:600–608. doi: 10.1152/jn.01170.2003. [DOI] [PubMed] [Google Scholar]
- 60.Likhtik E, Pelletier JG, Popescu AT, Paré D. Identification of basolateral amygdala projection cells and interneurons using extracellular recordings. J Neurophysiol. 2006;96:3257–3265. doi: 10.1152/jn.00577.2006. [DOI] [PubMed] [Google Scholar]
- 61.Livneh U, Paz R. Amygdala-Prefrontal Synchronization Underlies Resistance to Extinction of Aversive Memories. Neuron. 2012;75:133–142. doi: 10.1016/j.neuron.2012.05.016. [DOI] [PubMed] [Google Scholar]
- 62.Abeles M, Gerstein GL. Detecting spatiotemporal firing patterns among simultaneously recorded single neurons. J Neurophysiol. 1988;60:909–924. doi: 10.1152/jn.1988.60.3.909. [DOI] [PubMed] [Google Scholar]
- 63.Paz R, Bauer EP, Paré D. Measuring Correlations and Interactions Among Four Simultaneously Recorded Brain Regions During Learning. J Neurophysiol. 2009;101:2507–2515. doi: 10.1152/jn.91259.2008. [DOI] [PMC free article] [PubMed] [Google Scholar]
- 64.Tye KM, Janak PH. Amygdala neurons differentially encode motivation and reinforcement. J Neurosci Off J Soc Neurosci. 2007;27:3937–3945. doi: 10.1523/JNEUROSCI.5281-06.2007. [DOI] [PMC free article] [PubMed] [Google Scholar]
- 65.Herry C, et al. Switching on and off fear by distinct neuronal circuits. Nature. 2008;454:600–606. doi: 10.1038/nature07166. [DOI] [PubMed] [Google Scholar]
- 66.Johansen JP, Tarpley JW, LeDoux JE, Blair HT. Neural substrates for expectation-modulated fear learning in the amygdala and periaqueductal gray. Nat Neurosci. 2010;13:979–986. doi: 10.1038/nn.2594. [DOI] [PMC free article] [PubMed] [Google Scholar]
- 67.Amano T, Duvarci S, Popa D, Paré D. The fear circuit revisited: contributions of the basal amygdala nuclei to conditioned fear. J Neurosci Off J Soc Neurosci. 2011;31:15481–15489. doi: 10.1523/JNEUROSCI.3410-11.2011. [DOI] [PMC free article] [PubMed] [Google Scholar]
- 68.Pendyam S, et al. Fear signaling in the prelimbic-amygdala circuit: a computational modeling and recording study. J Neurophysiol. 2013;110:844–861. doi: 10.1152/jn.00961.2012. [DOI] [PMC free article] [PubMed] [Google Scholar]
- 69.Hastie T, Tibshirani R, Friedman J. The Elements of Statistical Learning: Data Mining, Inference, and Prediction, Second Edition. Springer; 2011. [Google Scholar]
- 70.Narayanan NS, Laubach M. Methods for studying functional interactions among neuronal populations. Methods Mol Biol Clifton NJ. 2009;489:135–165. doi: 10.1007/978-1-59745-543-5_7. [DOI] [PMC free article] [PubMed] [Google Scholar]
- 71.Richmond BJ, Optican LM. Temporal encoding of two-dimensional patterns by single units in primate inferior temporal cortex II. Quantification of response waveform J Neurophysiol. 1987;57:147–161. doi: 10.1152/jn.1987.57.1.147. [DOI] [PubMed] [Google Scholar]
- 72.Introduction An to Support Vector Machines and Other Kernel-based Learning Methods. [Accessed: 16th January 2017];Cambridge University Press. Available at: http://www.cambridge.org/gb/academic/subjects/computer-science/pattern-recognition-and-machine-learning/introduction-support-vector-machines-and-other-kernel-based-learning-methods?format=HB&isbn=9780521780193.
- 73.Schlkopf B, Smola AJ. Learning with Kernels: Support Vector Machines, Regularization, Optimization, and Beyond. The MIT Press; 2001. [Google Scholar]
- 74.Phillip I Good. Springer; Permutation, Parametric, and Bootstrap Tests of Hypotheses. [Google Scholar]
Associated Data
This section collects any data citations, data availability statements, or supplementary materials included in this article.