

SUMMARY
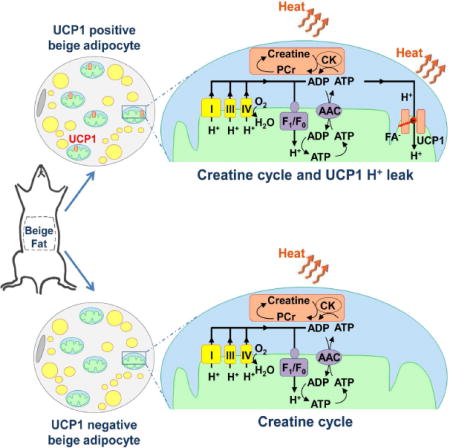
Cold and other environmental factors induce “browning” of white fat depots — development of beige adipocytes with morphological and functional resemblance to brown fat. Similar to brown fat, beige adipocytes are assumed to express mitochondrial uncoupling protein 1 (UCP1) and are thermogenic due to the UCP1-mediated H+ leak across the inner mitochondrial membrane. However, this assumption has never been tested directly. Herein we patch-clamped the inner mitochondrial membrane of beige and brown fat to provide a direct comparison of their thermogenic H+ leak (IH). All inguinal beige adipocytes had robust UCP1-dependent IH comparable to brown fat, but it was about three times less sensitive to purine nucleotide inhibition. Strikingly, only ~15% of epididymal beige adipocytes had IH, while in the rest UCP1-dependent IH was undetectable. Despite the absence of UCP1 in the majority of epididymal beige adipocytes, these cells employ prominent creatine cycling as a UCP1-independent thermogenic mechanism.
INTRODUCTION
Brown fat thermogenesis has emerged as a promising target to combat the metabolic syndrome (Betz and Enerbäck, 2015; Cypess et al., 2009; Cypess et al., 2015; van Marken Lichtenbelt et al., 2009; Virtanen et al., 2009). Heat production in brown adipocytes depends on the H+ leak across the inner mitochondrial membrane, mediated by uncoupling protein 1 (UCP1). White fat also contains diffuse islands of UCP1-expressing adipocytes, and the number of these cells is significantly increased by cold adaptation or injection of β3-adrenergic agonists (Cousin et al., 1992; Granneman et al., 2005; Guerra et al., 1998; Himms-Hagen et al., 2000; Kozak et al., 2010; Loncar et al., 1988; Wu et al., 2012; Wu et al., 2013). The overall morphology of these UCP1-expressing cells is comparable to brown adipocytes: they have numerous mitochondria and are multilocular. This is in contrast to the low mitochondrial abundance and unilocularity of white adipocytes. Due to the morphological similarity to brown fat, these UCP1-expressing cells were termed “beige” or “brite” adipocytes (Walden et al., 2012; Wu et al., 2012). Despite their morphological and functional similarities, beige and brown adipocytes have clearly distinct developmental origins (Long et al., 2014; Rosen and Spiegelman, 2014; Seale et al., 2008). Interestingly, brown adipose tissue of adult humans contains a significant population of cells with a beige adipose molecular signature, and these cells could prevent obesity and type II diabetes (Jespersen et al., 2013; Lee et al., 2014; Lidell et al., 2013; Sharp et al., 2012; Shinoda et al., 2015; Wu et al., 2012).
There is a general agreement that all beige adipocytes are capable of UCP1-dependent thermogenesis, and UCP1 is universally used as a marker of beige adipocytes. However, the evidence for UCP1-dependent thermogenesis in beige adipocytes came primarily from experiments using subcutaneous (inguinal) adipose tissue (Shabalina et al., 2013). In contrast, only a small fraction of beige adipocytes of abdominal white fat depots, such as epididymal and retroperitoneal, may express UCP1 (Himms-Hagen et al., 2000; Loncar et al., 1988), and this phenomenon has never been adequately addressed. Moreover, beige adipocytes seem to use alternative UCP1-independent thermogenic mechanisms, as demonstrated in UCP1−/− mice (Granneman et al., 2003; Ukropec et al., 2006). Creatine-dependent ADP/ATP substrate cycling has recently been illustrated to serve as a thermogenic pathway in inguinal beige adipocytes that co-exists with classic UCP1-dependent thermogenesis (Kazak et al., 2015). Thus, the molecular mechanisms of thermogenesis in beige fat require further exploration.
UCP1-dependent H+ leak current (IH) across the inner mitochondrial membrane (IMM) short-circuits the mitochondrial voltage (ΔΨ) and allows brown fat mitochondria to generate heat at the expense of ATP production. Until recently, there were no methods for direct IH measurement, which severely limited our understanding of the molecular mechanisms of mitochondrial thermogenesis. Recently, we directly measured and characterized UCP1-dependent IH in the interscapular brown fat using the patch-clamp technique (Fedorenko et al., 2012). Classic studies from the 1970s demonstrated that UCP1-dependent thermogenesis is activated by long-chain fatty acids (FA) and that UCP1 activity is equivalent to transport of H+ across the IMM (Nicholls and Locke, 1984). However, the mechanism of FA-dependent UCP1 operation had remained elusive (Cannon and Nedergaard, 2004). By directly recording UCP1 currents across the whole IMM of brown fat, we found that FA anions (FA−) activate UCP1 by serving as its transport substrates, and UCP1 operates as an unusual FA−/H+ symporter (Fedorenko et al., 2012). However, in contrast to short-chain FA−, physiologically relevant long-chain FA− cannot dissociate from UCP1 due to strong hydrophobic interactions established by their carbon tails and thus serve as continuously attached substrates. Therefore, in the presence of long-chain FA, UCP1 effectively operates as a FA-activated H+ carrier (Bertholet and Kirichok, 2017). We also demonstrated that in addition to their transport function, long-chain FA competitively release tonic inhibition of UCP1 by cytosolic purine nucleotides. Finally, although classic studies postulated that UCP1 is activated by long-chain FA released by hydrolysis of cytoplasmic lipid droplets (triggered by β3 adrenergic receptor activation), we discovered that UCP1 can also be controlled by FA generated within the IMM via phospholipid hydrolysis by a non-canonical Ca2+-independent phospholipase A2 (PLA2)(Fedorenko et al., 2012).
Here we use mitochondrial patch-clamping to compare IH properties in interscapular brown fat and beige fat of two distinct white fat depots - inguinal and epididymal. We demonstrate that β3-adrenergic receptor stimulation (with the selective agonist CL316.243, abbreviated “CL” here) leads to development of beige adipocytes in both inguinal and epididymal fat, as indicated by fragmentation of cytosolic lipid droplets, robust mitochondrial biogenesis, and upregulation of the thermogenic gene program. However, while all new CL-induced inguinal beige mitochondria exhibit UCP1-dependent IH similar to that of brown fat, the large majority of newly formed epididymal beige mitochondria (~85%) have no UCP1-dependentIH. Thus, in contrast to the current belief that all beige adipocytes are capable of UCP1-dependent thermogenesis, our data clearly demonstrate the existence of UCP1-positive and UCP1-negative beige fat cells. UCP1-positive beige adipocytes, based on the properties of their IH, appear to have similar potential for UCP1-dependent thermogenesis as brown adipocytes, except that their IH is less sensitive to inhibition by purine nucleotides. Although UCP1-negative beige adipocyte mitochondria are devoid of UCP1-dependent thermogenesis, they run robust creatine-dependent substrate cycling (Kazak et al., 2015). This may be the principal mechanism of thermogenesis employed by UCP1-negative beige fat.
RESULTS
“Browning” of inguinal and epididymal fat after chronic β3-adrenergic receptor stimulation
To induce beige adipocytes in white fat depots, we injected mice intraperitoneally with a selective β3-adrenergic receptor agonist CL for 10 days. This procedure has previously been shown to induce brown-like adipocytes in various white fat depots (Granneman et al., 2003; Granneman et al., 2005; Himms-Hagen et al., 2000). Histological analysis showed strong remodeling in both, inguinal and epididymal depots, (Figure 1A). This white fat transformation is described as “browning”, and its most obvious morphological characteristic is an increase in number and reduction in size of cytoplasmic lipid droplets. Indeed, white adipocytes of vehicle treated mice were primarily unilocular (Figure 1A, left panels), while CL-treatment resulted in accumulation of multilocular adipocytes (Figure 1A, right panels). Although the browning of epididymal fat was not as strong as that of inguinal fat, it was clearly distinguishable from vehicle treated fat with the appearance of lipid droplet multilocularity (Figure 1A).
Figure 1. Browning of inguinal and epididymal fat depots upon chronic β3-adrenergic receptor stimulation.
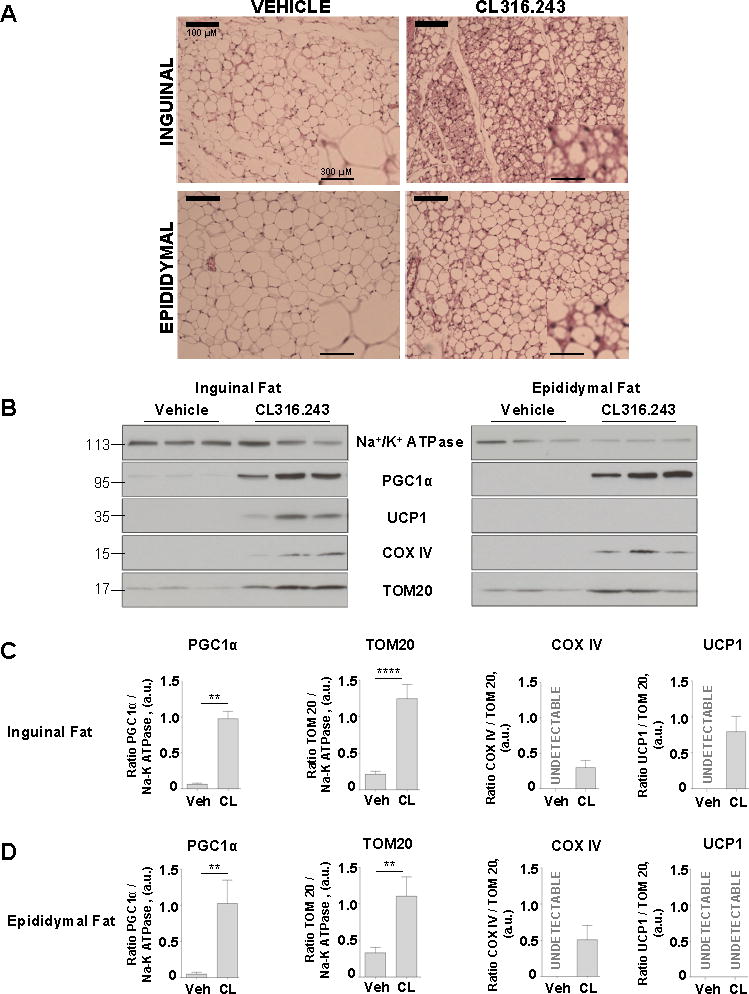
(A) Representative inguinal and epididymal fat sections of mice treated with vehicle or CL316.243 compound were stained with hematoxylin and eosin; scale bar, 100 μm. A magnified view is shown on the right corner of each picture, scale bar, 300 μm.
(B) Representative immunoblots showing the effect of β3-adrenergic receptor stimulation on the protein levels of Na+/K+ ATPase, PGC1α, UCP1 and COXIV in inguinal fat (left) and epididymal fat (right). See also Figures S1 and S2.
(C and D) PGC1α, TOM20, COX IV and UCP1 protein levels in inguinal and epididymal fat, based on the data presented in (B). Data shown as mean ± SEM, n = 5–9. See also Figures S1 and S2.
Another key parameter used to describe the browning of white fat is mitochondrial biogenesis. Robust mitochondrial biogenesis was detected by the increased abundance of the transcriptional coactivator PGC1α (a key regulator of mitochondrial biogenesis), the mitochondrial respiratory chain protein COX IV, and a component of the mitochondrial protein import machinery, TOM20, in both inguinal and epididymal depots after CL-injection (Figure 1B–D). Interestingly, while UCP1 protein expression was induced in the inguinal fat upon CL injection, it was undetectable in epididymal fat (Figure 1B–D). The interscapular brown fat did not show any significant change in the expression level of these proteins (Figure S1A).
Interestingly, UCP1 appeared non-essential for the process of browning because robust mitochondrial biogenesis, as judged by PGC1α, COX IV and TOM20 expression, was observed in both epididymal and inguinal depots of UCP1−/− mice (Figure S1C and S1D). Similar to WT mice, CL injection did not induce mitochondrial biogenesis in interscapular brown fat of UCP1−/− mice (Figure S1B).
Finally, we assessed induction of the thermogenic program in both inguinal and epididymal fat by examining relative mRNA levels for Cidea, Dio2, Prdm16, Ucp1, and Pgc1α. CL injection highly increased the expression levels of Cidea, Dio2, and Ucp1 in both tissues (Figure S2). Interestingly, although in epididymal fat UCP1 protein was undetectable with Western blot in both control and CL injected mice (Figure 1B and 1D), CL injection caused a dramatic increase in Ucp1 mRNA (Figure S2). Thus, thermogenic gene profiling further confirmed the induction of browning in both epididymal and inguinal fat.
Direct measurement of mitochondrial H+ leak in beige adipocytes: UCP1-positive and negative cells
We next applied the patch-clamp technique to the vesicles of the whole IMM (mitoplasts) (Fedorenko et al., 2012; Fieni et al., 2012) isolated from inguinal and epididymal beige fat mitochondria to directly measure H+ currents carried by UCP1. Our standard mitochondrial isolation protocol produced no mitochondria from inguinal and epididymal fat of vehicle-treated mice (due to the very low amount of mitochondria in white fat). However, we isolated significant amounts of mitochondria from both tissues of CL-injected animals, as was expected based on the mitochondrial biogenesis (Figure 1B–D). We next recorded the mitochondrial H+ leak (IH) across the whole IMM in mitoplasts isolated from inguinal and epididymal fat of CL-injected mice and compared it to IH of other tissues, such as brown fat, heart, and skeletal muscle (Figure 2). IH was induced by application of a voltage ramp from −160 mV (on the matrix side of the IMM as compared to the cytosolic side) to +100 mV to cover all possible physiological voltages across the IMM. The bath and pipette solutions were formulated to record H+ currents and contained only salts that dissociate into large anions and cations that are normally impermeant through ion channels or transporters.
Figure 2. Mitochondrial IH in beige adipocytes of inguinal and epididymal fat as compared to other tissues.
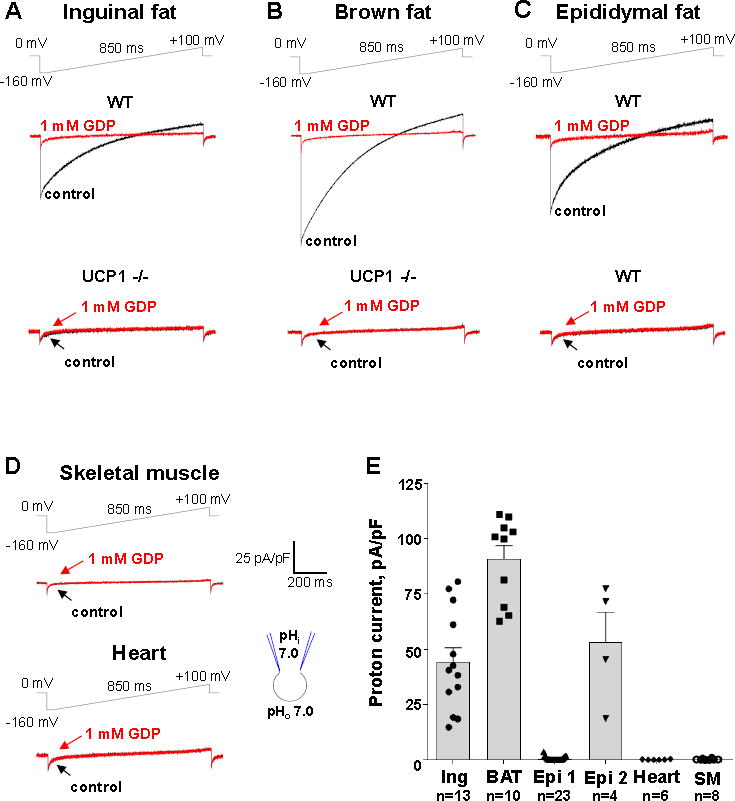
(A) Representative IH recorded from inguinal beige fat mitoplasts isolated from WT (upper panel) and UCP1−/− mice (lower panel). IH traces are shown before (control, black) and after (red) the addition of 1 mM GDP to the bath solution. The voltage protocol is indicated at the top.
(B) Representative IH recorded from brown fat mitoplasts isolated from WT (upper panel) and UCP1−/− mice (lower panel). IH traces are shown before (control, black) and after (red) the addition of 1 mM GDP to the bath solution.
(C) Representative IH recorded from two distinct types of epididymal beige fat mitoplasts isolated from WT mice: UCP1-positive (upper panel) and UCP1-negative (lower panel). IH traces are shown before (control, red) and after (black) the addition of 1 mM GDP to the bath solution.
(D) Representative IH recorded from mitoplasts isolated from skeletal muscle (upper panel) and heart (lower panel). IH traces are shown before (control, black) and after (red) the addition of 1 mM GDP to the bath solution.
(E) Bar graph showing average IH current density in inguinal beige fat (Ing), brown fat (BAT), heart, skeletal muscle (SM), and two distinct types of beige adipocyte from epididymal beige fat (UCP1 negative (Epi1) and positive (Epi2)). Data shown as mean ± SEM. See also Figure S3.
All inguinal beige fat mitoplasts (n=35) used in electrophysiological experiments had a large IH (Figure 2A and 2E) similar to that observed in brown fat mitoplasts (Figure 2B and 2E). IH in both inguinal beige fat and brown fat was inhibited by 1 mM of a classic UCP1 inhibitor guanosine diphosphate (GDP) and disappeared in UCP1 (−/−) mice (Figure 2A and 2B), clearly demonstrating that in both tissues IH was mediated by UCP1.
In contrast, only about 15% (4 out of 27) mitoplasts of epididymal beige fat had large GDP-sensitive IH, while the majority of mitoplasts had no measurable H+ current (Figure 2C). Interestingly, there were two clearly distinct populations of epididymal beige fat mitoplasts with no “intermediate” cases: 1) having no UCP1 current, and 2) having UCP1-dependent IH with an amplitude comparable to that found in brown and inguinal fat mitoplasts (Figure 2C and 2E). As expected (given the fact that UCP1 expression is limited to fat tissues), under the same conditions IH was undetectable in mitoplasts isolated from heart and skeletal muscle (Figure 2D). Although IH was missing in the majority of mitoplasts from epididymal beige fat as well as in all mitoplasts from heart and skeletal muscle, we recorded Cl− currents (likely carried by the inner membrane anion channel, IMAC) (Borecky et al., 1997) in all these mitoplasts as a positive control (Figure S3).
These experiments demonstrate that all inguinal beige adipocytes have functional UCP1 and thus can be classified as UCP1-positive. In contrast, epididymal beige adipocytes are clearly divided into two distinct subpopulations, UCP1-positive and UCP1-negative. To gain insight into spatial distribution of UCP1-positive and UCP1-negative beige adipocytes in inguinal and epididymal fat, we performed immunohistochemical analyses of both tissues. Mitochondrial immunostaining in slices of inguinal and epididymal fat revealed an increase of mitochondrial biomass after CL treatment in both tissues (Figures 3 and S4), which was in agreement with Western blot analysis for markers of mitochondrial biogenesis (Figure 1B–D). However, UCP1 protein expression differed dramatically between the two tissues. In control mice, inguinal depot UCP1 was largely undetectable, while CL injection made virtually all cells in this depot UCP1-positive (Figures 3A, 3C, and S4A). In contrast, in the epididymal fat depot CL treatment only produced isolated islands of UCP1-positive adipocytes, while the majority of mitochondria-rich beige adipocytes were UCP1-negative (Figures 3B, 3D, and S4B). These results are in agreement with electrophysiological data (Figure 2) and confirm the existence of two populations of beige adipocytes in epididymal fat, UCP1-positive and UCP1-negative. Despite the lack of UCP1 expression, the majority of UCP1-negative adipocytes had robust OXPHOS immunostaining and multilocularity, the two key parameters used to describe beige adipocytes (Figures 3B, 3D, and S4B). Interestingly, UCP1-positive epididymal beige adipocytes appear to be organized in clusters rather than being randomly spread across the tissue. This suggests that UCP1-positive cells are likely to originate from a few precursor cells and are not the result of white adipocyte interconversion.
Figure 3. Mitochondrial biogenesis and UCP1 expression in inguinal and epididymal depots after chronic β3-adrenergic stimulation.
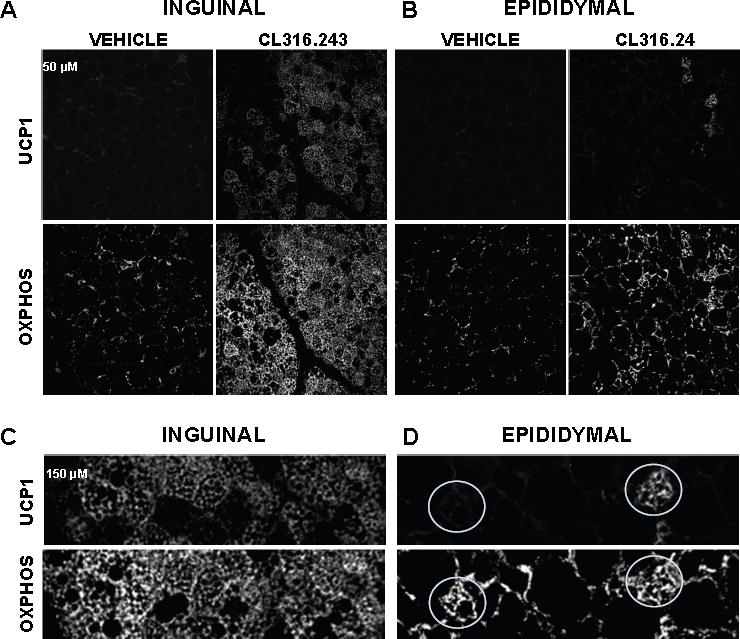
(A and B) Confocal micrographs of inguinal fat and epididymal fat of mice treated with vehicle or CL and immunolabeled with UCP1 (upper panels) and with respiratory chain complex antibodies (MitoProfile® Total OXPHOS, lower panels); scale bar, 50 μm). See also Figures S4 and S5.
(C and D) Magnified views of the areas within the white rectangles from panels A and B. Representative UCP1-positive (right) and UCP1-negative (left) beige adipocytes of epididymal fat are shown by white circles.
Mitochondrial size can be indicative of the thermogenic capacity of a fat cell, with brown adipocyte mitochondria being fragmented and round (especially upon norepinephrine stimulation), while white fat mitochondria appear larger and filamentous (Cinti, 2009; Wikstrom et al., 2014). Interestingly, the average size of mitochondria in UCP1-negative and UCP1-positve epididymal adipocytes was similar (Figure S5), which further argues for the morphological and functional similarity of these cells.
There are two outstanding questions regarding the molecular mechanism of mitochondrial thermogenesis in UCP1-positive and UCP1-negative beige adipocytes: 1) although UCP1-positive adipocytes have UCP1-dependent H+ leak, are the properties of this leak identical to those of classic brown fat? 2) Do UCP1-negative beige adipocytes possess an alternative mechanism for mitochondrial thermogenesis? We addressed these two questions with the experiments presented below.
The mechanism by which fatty acids control H+ current through UCP1 is identical in beige and brown fat
UCP1 is a brown fat specific transport protein of the IMM that belongs to the superfamily of mitochondrial solute carriers SLC25 (Nicholls and Locke, 1984; Palmieri, 2004). UCP1 increases H+ conductance of the IMM to short-circuit mitochondrial voltage and make brown fat mitochondria produce heat rather than ATP. UCP1 has two principal physiological regulators: free fatty acids (FA) that activate H+ current via UCP1 and purine nucleotides that inhibit it. There has been a long-standing debate regarding the mechanism by which FA and purine nucleotides exert their control over UCP1 (Cannon and Nedergaard, 2004). Regarding FA, opinions put forward by different research groups range widely from the ideas that FA are absolutely required for the H+ transport ability of UCP1 (Garlid et al., 2000; Klingenberg and Huang, 1999) to the notion that UCP1 is a constitutively active H+ carrier and FA are only needed to competitively remove purine nucleotide inhibition (Shabalina et al., 2004). The primary reason why the mechanism of FA-dependent UCP1 operation remained elusive was the lack of direct methods to study UCP1. By directly measuring UCP1-dependent H+ leak in brown fat using the mitochondrial patch-clamp technique, we have recently gained insight into the FA-dependent mechanism of UCP1 operation (Bertholet and Kirichok, 2017; Fedorenko et al., 2012). Here we use the same approach to determine FA-dependence of beige fat UCP1. Since brown and beige adipocytes have different developmental origins (Wu et al., 2012) and represent two distinct cell types, beige fat mitochondria may present a different environment for UCP1, which can modify its functional properties.
To compare the biophysical properties of IH between UCP1-positive beige and interscapular brown fat, we used mitoplasts isolated from inguinal beige adipocytes, as they are much more abundant than UCP1-positive beige adipocytes of epididymal fat.
Similar to brown fat UCP1 (Fedorenko et al., 2012), UCP1-dependent beige fat IH was observed immediately after breaking-in into the mitoplast (Figure 4A control trace, as well as control traces in Figure 2A and 2B upper panels) and appeared to be constitutively active, similar to what was suggested previously (Shabalina et al., 2004). However, UCP1 was not constitutively active because addition of methyl-β-cyclodextrin (MβCD), that binds FA and extracts them from the membrane, led to complete deactivation of IH (Figure 4A). After extraction of endogenous FA with MβCD and complete IH deactivation, the current could be re-activated by addition of 1.5 μM arachidonic acid. These results exactly replicate our previous data using brown fat mitoplasts (Fedorenko et al., 2012), and demonstrate that FA are required for UCP1-dependent IH, and that the IMM contains endogenous FA that activate UCP1.
Figure 4. FA dependence of beige fat UCP1.
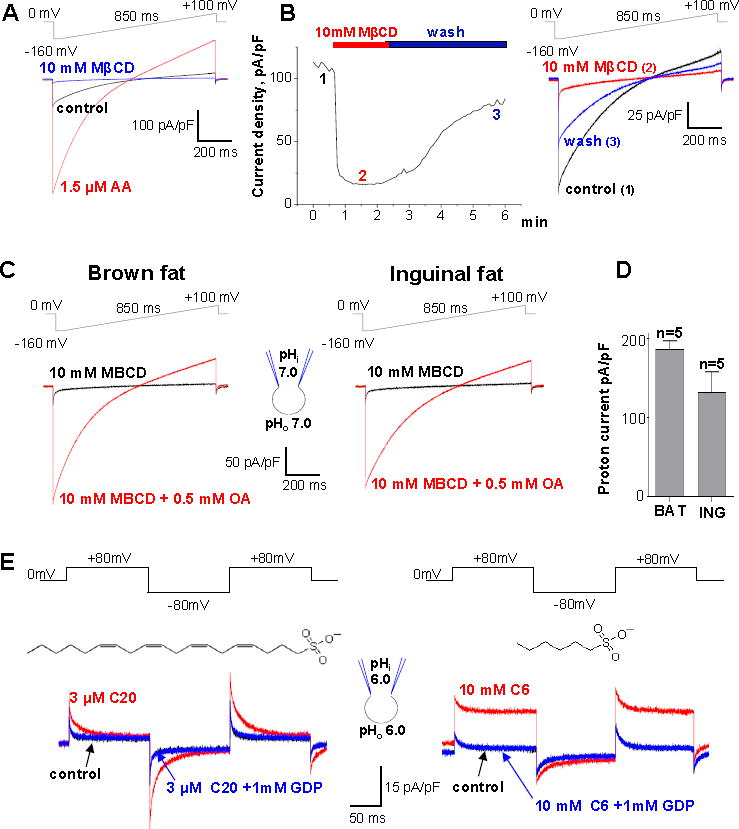
(A) IH (control, red) is de-activated by 10 mM MβCD and re-activated by 1.5 μM arachidonic acid (AA, blue). The voltage protocol is indicated at the top.
(B) Left panel: Representative time course of IH amplitude in control (1), and upon the application (2) and subsequent washout (3) of 10 mM MβCD at pH 8.0. Right panel: IH traces recorded at times 1, 2, and 3 as indicated in the left panel.
(C) Representative IH upon extraction of endogenous LCFAs with 10 mM MβCD (black) and after application of 0.5 mM OA mixed with 10 mM MβCD (red). The experiment was performed in brown fat (left panel) and inguinal beige fat (right panel).
(D) Bar graph showing average IH current density in inguinal beige fat (ING), and brown fat (BAT) based on the experiments shown in (C). Data shown as mean ± SEM.
(E) Representative IH recorded after the extraction of endogenous membrane FA with 10mM MβCD (control, black), after subsequent application of the indicated concentration of Cn-sulfonate (red), and upon adding 1 mM GDP (blue), at symmetrical pH 6.0. The structure of the activating Cn-sulfonate is shown near the currents induced: arachidonyl sulfonate (C20, left panel) and hexanesulfonate (C6, right panel). See also Figure S7.
In the case of brown fat we demonstrated that after depletion of endogenous FA from the IMM using cyclodextrins, membrane FA are rapidly re-generated upon cyclodextrin removal from the recording solution (Fedorenko et al., 2012). This FA production was likely due to the activity of phospholipase A2 (PLA2) associated with the IMM (Fedorenko et al., 2012). Interestingly, similar robust PLA2-like activity was present within the IMM of inguinal beige fat. Indeed, after removal of endogenous membrane FA and complete deactivation of UCP1 with MβCD, the subsequent removal of MβCD lead to reactivation of the UCP1 current, indicating FA regeneration within the IMM (Figure 4B). This suggests that similar to brown fat, UCP1 activity in beige fat may be affected not only by FA originating from cytoplasmic lipid droplets (Cannon and Nedergaard, 2004) but also by FA produced within the IMM.
In the experiments shown in Figure 2, we compared thermogenic capacities of beige and brown fat mitochondria by measuring the amplitude of UCP1-dependent IH in both tissues (Figure 2A, 2B, and 2E). However, the IH amplitude in this comparison could be affected by different amounts of endogenous FA present within the IMM of beige and brown fat. Therefore, to eliminate the effect of endogenous FA (which can be different in beige and brown fat), we applied exogenous FA on the background of MβCD (10 mM MβCD mixed with 0.5 mM oleic acid) to directly compareIH of beige and brown fat mitoplasts in the presence of the same amount of activating exogenous FA. Under these conditions, the difference in the IH amplitude between brown and beige fat was even smaller (Figure 4C and 4D) than observed under conditions when UCP1 was activated by endogenous FA (Figure 2A, 2B, and 2E). These data demonstrate that the thermogenic potential of UCP1-positive mitochondria from beige and brown fat is similar.
We have previously shown that brown fat UCP1 operates as a FA−/H+ cotransporter (Fedorenko et al., 2012). Interestingly, in contrast to short-chain FA− that are transported by UCP1 across the membrane, long-chain FA− cannot dissociate from UCP1 due to strong hydrophobic interactions but move within the UCP1 translocation pathway triggering H+ transport (Bertholet and Kirichok, 2017; Fedorenko et al., 2012). Therefore, in the presence of long-chain FA (the only physiologically relevant FA activators), FA anion current is not observed and UCP1 effectively operates as a FA-activated H+ carrier (Fedorenko et al., 2012) (Figure S7).
FA− currents through UCP1 can be observed in isolation from H+ currents by using low-pKa FA analogs that cannot be protonated and are always negatively charged in a physiological pH range (Fedorenko et al., 2012). Long-chain low-pKa FA− induce transient UCP1 currents due to their inability to dissociate from UCP1 because of hydrophobic interactions (Figure S7B), while short-chain low-pKa FA that establish much weaker hydrophobic interactions are carried by UCP1 across the membrane (Figure S7A). We found that beige fat UCP1 operates in the same manner. Arachidonyl sulfonate, a long-chain low-pKa FA analog induced GDP-sensitive transient currents in beige fat mitoplasts (Figure 4E, left panel). In contrast, C6-sulfonate, a low-pKa short chain FA analog is simply transported by UCP1 across the membrane (Figure 4E, right panel). Thus, beige fat UCP1 transports FA− in the same way as brown fat UCP1.
Beige fat UCP1 is less sensitive to purine nucleotide inhibition than brown fat UCP1
Two principal physiological regulators of UCP1 act in opposition: FA and Mg2+-free purine nucleotides. In vivo, UCP1 is tonically inhibited by cytosolic purine nucleotides (mainly ATP4−), and FA have to overcome this purine nucleotide inhibition to activate H+ leak via UCP1 (Nicholls, 2006; Nicholls and Lindberg, 1973). However, whether FA remove purine nucleotide inhibition by direct competition has remained controversial (Huang, 2003; Klingenberg, 2010; Nicholls, 2006; Rial et al., 1983; Shabalina et al., 2004; Winkler and Klingenberg, 1994). We have demonstrated that similar to purine nucleotides, long-chain FA can only bind to UCP1 on the cytosolic face of the IMM and there is apparent competition between long-chain FA and purine nucleotides for binding to UCP1 (Fedorenko et al., 2012). This suggests that FA competitively remove purine nucleotide inhibition, and the transport site where FA bind may partially overlap with the inhibitory purine nucleotide binding site. Thus, the role of purine nucleotides is to increase the threshold for FA binding to its transport site to insure that UCP1 H+ leak is not activated by low background concentrations of FA.
To compare affinities of purine nucleotide binding to UCP1 of beige and brown fat, we activated UCP1-dependent IH in beige and brown fat with the same FA concentration and determined affinities with which cytosolic ATP4− inhibited brown and beige fat IH (Figure 5). To eliminate the effect of endogenous membrane FA and achieve precise control over FA concentration, IH was activated with exogenous oleic acid applied on a background of 10 mM MβCD (see above). Interestingly, under these conditions beige fat UCP1 appeared to have about 3 times lower affinity for ATP than brown fat UCP1. In beige fat,IH activated by 0.5 mM OA/10 mM MβCD was inhibited by ATP with an IC50 of 20.5 ± 1.4 mM, whereas the IC50 in brown fat was 7.5 ± 1.4 mM (Figure 5). Thus, we conclude that brown and beige fat UCP1 have different affinities for purine nucleotide binding.
Figure 5. Inhibition of UCP1 by purine nucleotides in brown and beige fat.
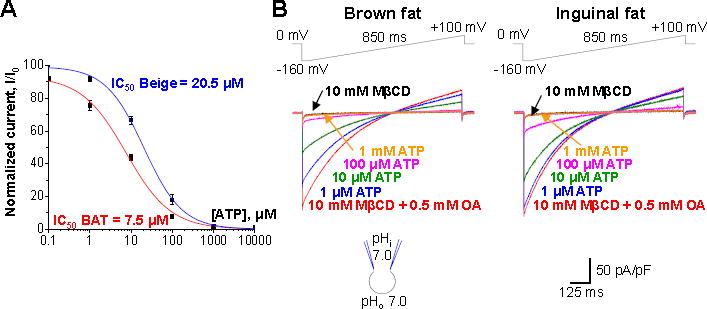
(A) The dose-dependence of IH inhibition by ATP4− in brown (red) and beige fat (blue). Current amplitudes were measured upon stepping from 0 to −160 mV, see (B).
(B) Representative IH traces in various concentrations of ATP4− on the cytosolic face of the IMM. Brown (left panel) and beige (right panel) are shown. IH was activated with 0.5 mM oleic acid (OA) mixed with 10 mM MβCD.
Beige and brown fat mitochondria have distinct OXPHOS profiles
Based on electrophysiological analysis of UCP1 currents, mitochondria of inguinal beige fat appear to be similar to mitochondria of classic brown fat (except for lower sensitivity of beige fat UCP1 to cytosolic ATP4−). To further address whether inguinal beige fat and brown fat mitochondria are similar in terms of their bioenergetics, we compared expression profiles of the respiratory chain complexes using Western Blot. This analysis was performed specifically in mitochondria (not whole tissue) isolated from beige and brown fat tissues of CL-injected mice (Figure 6). The OXPHOS antibody cocktail allowed us to quantify the expression level of the four complexes I to IV of the respiratory chain as well as the ATP synthase and then, to establish an “OXPHOS profile” of brown and beige fat mitochondria.
Figure 6. Distinct OXPHOS profiles of brown and beige fat mitochondria.
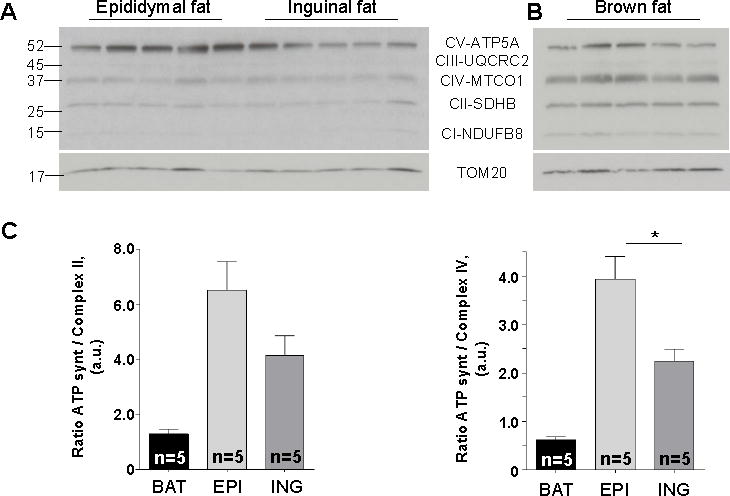
(A and B) Representative immunoblots showing protein levels of five mitochondrial respiratory protein complexes: NDUFB8 (Complex I, CI), SDHA (Complex II, CII), Core 2 subunit (Complex III, CIII), CIV-I subunit (Complex IV, CIV) and ATP5 subunit alpha (Complex V, CV) along with the loading control (TOM20) in mitochondria of beige (A) and brown (B) fat.
(C) Histograms representing the protein levels of ATP synthase relative to the levels of complex II (left panel) and complex IV (right panel), based on the data presented in (A) and (B). Data shown as mean ± SEM, n = 5.
The OXPHOS profile of interscapular brown fat mitochondria had three prominent bands: ATP synthase, complex II, and complex IV (Figure 6B). In contrast, the most prominent band detected in beige fat mitochondria (regardless of whether they came from the inguinal or epididymal depot) was ATP synthase (Figure 6A). Thus, the OXPHOS signatures of brown and beige fat mitochondria are distinct.
It is well-established that brown fat mitochondria have a low amount of the ATP synthase, arguably to prioritize UCP1-dependent thermogenesis over ATP synthesis (Cannon and Nedergaard, 2004). However, in contrast to brown fat, ATP synthase was the dominant band in the OXPHOS profile of beige fat. Indeed, the ratio of ATP synthase to complex II (Figure 6C, left panel) or complex IV (Figure 6C, right panel) appeared to be significantly higher in beige fat as compared to brown fat. Interestingly, although the overall OXPHOS profile of beige fat mitochondria appeared similar regardless of the origin (inguinal or epididymal), epididymal beige fat had a greater abundance of ATP synthase as compared to inguinal fat.
Together, these data indicate that beige fat mitochondria, regardless of whether they are UCP1-positive (inguinal) or UCP1-negative (~85% of epididymal beige fat) have characteristic OXPHOS profiles which differ significantly from the OXPHOS profile of classic brown fat.
Creatine-dependent respiration in epididymal beige fat
Recently, a UCP1-independent thermogenic pathway that relies on creatine-dependent substrate cycling has been demonstrated in inguinal beige mitochondria (Kazak et al., 2015). This alternative thermogenic mechanism appears to utilize creatine-dependent futile cycling of ATP synthesis and hydrolysis, and thus, depends on ATP synthase activity. This cycle drives hydrolysis of a molar excess of ATP with respect to creatine, resulting in a surplus of oxygen consumption under ADP-limiting conditions. Creatine-dependent increase in ADP-limited respiration was observed in inguinal beige fat mitochondria following one week of cold exposure (Kazak et al., 2015). Considering that epididymal beige mitochondria have a similar abundance of ATP synthase as inguinal beige mitochondria, they possibly could exhibit this activity following chronic CL administration. We therefore examined the relationship between creatine and ADP-limiting respiration in beige fat mitochondria isolated from the epididymal and inguinal adipose depots.
CKMT2 is the principal mitochondrial creatine kinase isoform in thermogenic fat, (Kazak et al., 2015), and so is thought to be involved in creatine-dependent substrate cycling. The level of Ckmt2 mRNA was also significantly upregulated in epididymal but not inguinal fat (Figures S6A and S6B). However, CL injection caused a significant increase in CKMT2 protein in both epididymal and inguinal fat (Figures 7A and 7B). These data indicate that CKMT2 protein abundance is primarily regulated post transcriptionally. Upon CL injection, mitochondrial creatine kinase (CK) activity was similar in epididymal and inguinal fat (Figure 7C). Phospho1, a phosphatase that may potentiate the creatine-driven substrate cycle through the regulation of downstream high-energy phosphate metabolism (Kazak et al., 2015) was also dramatically increased at the mRNA level in both epididymal and inguinal fat (Figure S6A and S6B). The mRNA levels of other proteins involved in creatine metabolism, Ckmt1, Slc6a8, Gamt, and Gatm, were also affected by CL injection, but the changes were not consistent between epididymal and inguinal fat (Figure S6A and S6B).
Figure 7. Creatine stimulates respiration in inguinal and epididymal beige fat mitochondria.
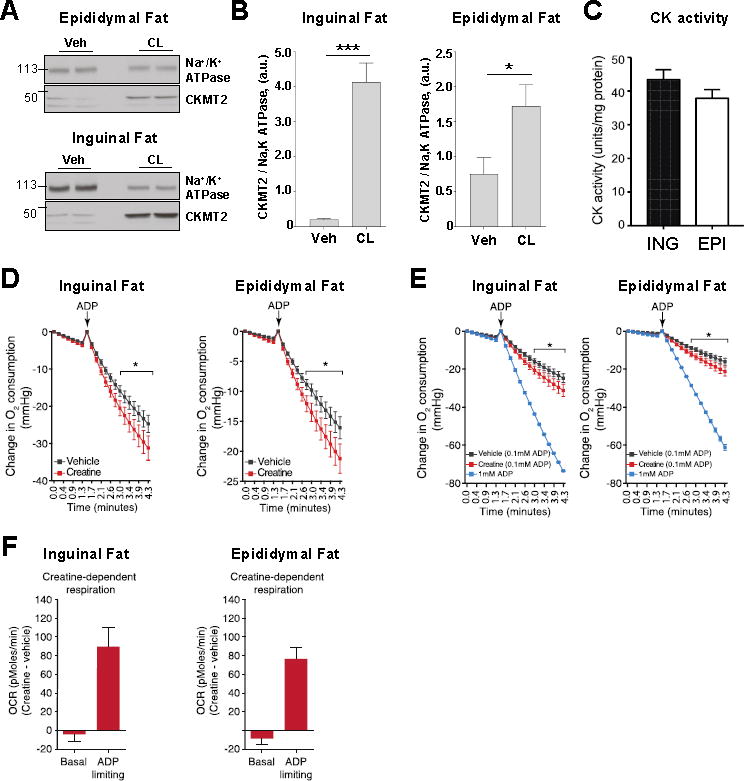
(A) Representative immunoblots showing the effect of β3-adrenergic receptor stimulation on the protein level of Na+/K+ ATPase and CKMT2 in epididymal fat (upper panel) and inguinal fat (lower panel). See also Figure S6.
(B) Histograms representing the protein level of CKMT2 relative to the level of Na+/K+ ATPase in inguinal fat (left panel) and epididymal fat (right panel). Data shown as mean ± SEM, n = 4.
(C) CK activity of inguinal fat (ING) and epididymal fat (EPI) mitochondria after β3-adrenergic receptor stimulation. Data shown as mean ± SEM, n = 6.
(D) Oxygen consumption by inguinal fat (left panel) and epididymal fat (right panel) mitochondria following treatment with vehicle or creatine (0.01 mM). Traces exhibit oxygen consumption of mitochondria during State 4 and following the addition of a limiting amount of ADP (0.1 mM). Data shown as mean ± SEM, n = 7 separate mitochondrial preparations for inguinal and epididymal fat.
(E) The vehicle-and creatine-dependent oxygen consumption traces under ADP-limiting (0.1 mM) conditions are the same as those shown in Figure 7D, and are compared to the oxygen consumption traces following addition of saturating amounts of ADP (1mM). Data shown as mean ± SEM, n = 7 separate mitochondrial preparations for inguinal and epididymal fat under ADP-limiting conditions. ADP saturating rates were obtained from two separate mitochondrial preparations.
(F) Creatine dependent basal and ADP-limiting oxygen consumption rate (OCR) in inguinal and epididymal beige fat mitochondria. The OCR of vehicle-treated beige fat mitochondria was subtracted from creatine-treated beige organelles. Data shown as mean ± SEM, n = 7 mitochondrial preparations for inguinal (left panel) and epididymal (right panel) adipose each. These data were obtained from the raw O2 traces shown in Figure 7D.
To assess the activity of the creatine-driven substrate cycle, following CL treatment, beige fat mitochondria were supplemented with pyruvate and malate in the presence of sub-saturating levels of ADP (0.1 mM). Similar to what was previously observed in inguinal beige mitochondria following cold exposure (Kazak et al., 2015), addition of a sub-stoichiometric concentration of creatine to these organelles resulted in activation of creatine-dependent respiration (Figures 7D and 7E, left panels). We next examined the effect of creatine on oxygen consumption in epididymal beige fat mitochondria following CL-treatment. Similar to inguinal beige mitochondria, creatine also strongly stimulated respiration of epididymal beige mitochondria under ADP-limiting conditions (Figure 7D and 7E, right panels).
On the basis of the mitochondrial P/O ratio (Watt et al., 2010), the molar excess of ADP phosphorylation can be estimated from the oxygen consumption rate stimulated by creatine addition. This calculation allows for stoichiometry between excess ADP production and added creatine to be inferred. Employing this analysis indicated that creatine drove a molar excess liberation of ADP to a similar extent for inguinal (18.45 ±1.237) and epididymal (16.08 ±1.24) beige mitochondria. Thus, beige fat mitochondria from subcutaneous and visceral depots have a similarly high capacity for creatine-dependent substrate cycling.
DISCUSSION
UCP1-positive and UCP1-negative beige adipocytes
Here we provided the first patch-clamp characterization of the mitochondrial thermogenic H+ leak (/H) in beige adipocytes from two distinct white fat depots — inguinal and epididymal. In contrast to respirometry studies of the H+ leak, this method: 1) measuresIH directly as H+ current across the IMM, with high amplitude and time resolution; 2) fully controls transmembrane voltage and solution composition on both sides of the IMM thus allowing forIH measurement under controlled conditions; 3) measures IH in a single mitochondrion (rather than averages over all mitochondria present in the respiration chamber). Thus a direct comparison of individual mitochondria can be applied in the same or different tissues (Fedorenko et al., 2012). Using this method we directly compared properties of IH in individual mitochondria from beige fat, brown fat, heart, and skeletal muscle under identical conditions.
All tested mitochondria of inguinal beige fat had large UCP1-dependentIH with the amplitude comparable to that of interscapular brown fat (Figure 2). In contrast, only about 15% of mitochondria of epididymal beige fat had UCP1-dependent/H.IH was undetectable in the remaining 85% of epididymal beige fat mitochondria, and in this respect they were identical to mitochondria of heart and skeletal muscle that express no UCP1 (Figure 2). Therefore, based on these electrophysiological data as well as on immunocytochemistry experiments (Figures 3 and S4), two distinct populations of beige fat cells can be identified, that are either UCP1-positive or UCP1-negative.
We classify the UCP1-negative adipocytes as beige fat because they are similar to classic UCP1-positive beige adipocytes in several important ways. Multilocularity (Figure 1), robust mitochondrial biogenesis (Figures 1 and 3), activation of thermogenic gene program (Figure S2), distinctive OXPHOS profile (Figure 6), and creatine cycle (Figure 7) are the key similarities between the UCP1-negative and UCP1-positive cells. Interestingly, although UCP1 is not detectable on the protein level in UCP1-negative adipocytes (Figures 1–3), Ucp1 mRNA is upregulated in these cells as compared to white fat (Figure S2). From all these data, it follows that the multilocular UCP1-negative cells are a type of a thermogenic beige adipocyte. In contrast, when multilocular UCP1-negative cells are compared to white adipocytes, striking differences in cytoplasmic lipid droplet morphology, mitochondrial abundance, and thermogenic gene expression become obvious. Thus, multilocular UCP1-negative adipocytes cannot be classified as white adipocytes, because with their thermogenic program they burn fat, while white adipocytes by definition is a fat storage.
Thus, we demonstrate the existence of a UCP1-negative thermogenic cell within white fat depots. Because this type of adipocyte does not express UCP1, it was previously overlooked as a potential target for obesity treatment. A better understanding of the thermogenic pathways employed by the UCP1-negative beige fat cells, such as the creatine cycle, can help to develop new approaches to the treatment of the metabolic syndrome. This approach may be especially useful for reduction of visceral fat depots, where UCP1 expression level is low.
UCP1-dependent thermogenesis in beige fat
UCP1-positive beige adipocytes, based solely on the amplitude of UCP1 current in these cells as compared to brown fat (Figures 2 and 4), appear to have a thermogenic potential similar to that of brown fat. However, functional properties of beige and brown fat UCP1 are not identical. There are two principal physiological regulators of UCP1: FA and Mg2+-free purine nucleotides. As far as FA are concerned, we found beige and brown fat UCP1 to be indistinguishable: 1) in both tissues FA are required for H+ current via UCP1 and serve as UCP1 transport substrates, 2) the amplitude of the FA-dependent IH via UCP1 is comparable between beige and brown fat, and 3) the IMM of both beige and brown fat has PLA2 activity that generates FA and can contribute to UCP1 activation along with FA derived from the hydrolysis of cytoplasmic lipid droplets. In contrast, purine nucleotides inhibit beige fat UCP1 with ~3 times higher IC50 as compared to brown fat (Figure 5). This indicates that FA would overcome purine nucleotide inhibition to activate UCP1-dependent thermogenesis more easily in beige fat compared to brown fat. Presently, it would be difficult to assess the physiological significance of this phenomenon or to explain its molecular mechanism. However, we can hypothesize that beige fat UCP1 must have a lower affinity for ATP due to a potentially higher level of local ATP concentration in the mitochondrial intermembrane space associated with a greater abundance of ATP synthase expression than brown fat (Figure 6). One possible explanation for the different affinities of brown and beige fat UCP1 for purine nucleotides could be different lipid compositions of the IMM of beige and brown fat, such as variations in the cardiolipin concentration. Cardiolipin binds to UCP1 (Lee et al., 2015) and has been shown to affect purine nucleotide binding to UCP1 (Klingenberg, 2010). Alternatively, it has recently been demonstrated that cysteine oxidation state regulates sensitivity to activation of UCP1-dependent respiration upon adrenergic stimulus in BAT and brown adipocytes (Chouchani et al., 2016). Since this activation depends on release of inhibitory purine nucleotide binding of UCP1, the difference in binding between beige and brown fat observed herein could be explained by a potentially different oxidative state of beige and brown fat mitochondria. However, the actual mechanism behind the different affinities of brown and beige fat UCP1 for purine nucleotides remains to be established.
Creatine-driven thermogenesis in beige fat
We demonstrate that regardless of UCP1 expression, creatine-driven respiration is a distinctive feature of beige adipocytes and can, in principle, be used along with mitochondrial biogenesis and multilocularity of lipid droplets to distinguish beige adipocytes. In UCP1-positive inguinal beige adipocytes, this type of thermogenesis co-exists with classic UCP1-dependent thermogenesis (Kazak et al., 2015), while in UCP1-negative beige adipocytes it is the only mechanism of mitochondrial thermogenesis illustrated so far (Figures 7 and S6). Interestingly, in contrast to UCP1-dependent thermogenesis, creatine-driven thermogenesis is unlikely to be activated by β3-adrenergic receptor stimulation on the acute basis. Rather, once beige adipocytes are generated via chronic β3-adrenergic stimulation, creatine-driven thermogenesis in these cells would contribute to the basal metabolic rate. Thus, creatine-driven thermogenesis and UCP1-dependent thermogenesis of beige fat are non-redundant and should vary in their regulatory mechanisms of and physiological roles. UCP1-negative beige adipocytes, where creatine cycle is the only thermogenic mechanism, appear to be incapable of fast adaptive thermogenesis and may rather be responsible for slow modulation of the basal metabolic rate of white fat depots depending on the tonic level of norepinephrine.
STAR METHODS
Detailed methods are provided in the online version of this paper and include the following:
CONTACT FOR REAGENT AND RESOURCE SHARING
Further information and requests for reagents may be directed to and will be fulfilled by Lead Contact Yuriy Kirichok (yuriy.kirichok@ucsf.edu)
EXPERIMENTAL MODEL
All animal experiments were performed according to procedures approved by the UCSF’s Institutional Animal Care and Use Committee and adhered to NIH standards. C57BL/6J wild-type and UCP1(−/−) mice (2–5 months old, male) from the Jackson Laboratory were maintained on a standard rodent chow diet with 12 hr light and dark cycles. CL316.243 (Sigma) at 1mg/kg was injected intraperitoneally into mice daily for 10 days.
METHOD DETAILS
Isolation of mitochondria and mitoplasts
Wild-type and UCP1(−/−) mice were sacrificed by CO2 asphyxiation followed by cervical dislocation. Mitoplasts were prepared from heart, skeletal muscle, brown fat, inguinal fat, and epididymal fat. The selected mouse tissue was isolated, rinsed and homogenized in ice-cold medium containing 250 mM sucrose, 10 mM HEPES, and 1 mM EGTA (pH adjusted to 7.2 with Trizma® base), using a glass grinder with six slow strokes of a Teflon pestle rotating at 275 (soft tissues) or 600 (fibrous tissues) rotations per minute. The homogenate was centrifuged at 700 g for 5–10 min to pellet nuclei and unbroken cells. For some tissues, the first nuclear pellet was resuspended in the same solution and homogenized again to increase the yield of mitochondria. Mitochondria were collected by centrifugation of the supernatant at 8,500 g for 10 min. Mitoplasts were produced from mitochondria using a French press. Briefly, mitochondria were suspended in a solution containing 140 mM sucrose, 440 mM D-mannitol, 5 mM HEPES, and 1 mM EGTA (pH adjusted to 7.2 with Trizma® base), and then subjected to a French press at 2,000 psi to rupture the outer membrane. Mitoplasts were pelleted at 10,500 g for 15 min and resuspended for storage in 500 μl of solution containing 750 mM KCl, 100 mM HEPES and 1 mM EGTA (pH adjusted to 7.2 with Trizma® base). Mitochondria and mitoplasts were prepared at 0–4 °C and stored on ice for up to 5 h. Immediately before the electrophysiological experiments, 15–50 μl of the mitoplast suspension was added to 500 μl solution containing 150 mM KCl, 10 mM HEPES, and 1 mM EGTA (pH adjusted to 7.0 with Trizma® base) and plated on 5 mm coverslips pretreated with 0.1% gelatin to reduce mitoplast adhesion.
Patch-clamp recording
Mitoplasts used for patch-clamp experiments were 3–5 μm in diameter and typically had membrane capacitances of 0.5–1.2 pF. Gigaohm seals were formed in the bath solution containing 150 mM KCl, 10 mM HEPES, and 1 mM EGTA, pH 7 (adjusted with Trizma® base). A 3M KCl agar salt bridge was used as the bath reference electrode. Voltage steps of 250–500 mV and 1–50 ms were applied to obtain the whole-mitoplast configuration, as monitored by the appearance of capacitance transients. The access resistance and membrane capacitance of mitoplasts were determined with the Membrane Test tool of pClamp 10 (Molecular Devices). Mitoplasts were stimulated every 5s. Pipettes were filled with 130 mM tetramethylammonium hydroxide (TMA), 1.5 mM EGTA, 2 mM magnesium chloride, 150 mM HEPES (or MES), (pH adjusted to 6.0–8.0 with D-gluconic acid, tonicity adjusted to ~360 mmol/kg with sucrose). Typically, pipettes had resistances of 25–40 MΩ, and the access resistance was 40–75 MΩ. The calculated voltage-clamp error associated with the access resistance did not exceed 10 mV. Whole-mitoplast UCP1 current was recorded in the bath solution containing 150 mM HEPES (or MES) and 1 mM EGTA (pH adjusted to 6.0–8.0 with Trizma® base, tonicity adjusted to ~300 mmol/kg with sucrose). All experiments were performed under continuous perfusion of the bath solution.
Patch-clamp data acquisition and analysis
Data acquisition and analysis were performed using PClamp 10 (Molecular Devices) and Origin 7.5 (OriginLab). All electrophysiological data presented were acquired at 10 kHz and filtered at 1 kHz. Amplitudes of H+ currents were measured 25 ms after application of the −160 mV voltage step.
Histology and immunohistochemistry
Tissues (BAT, inguinal fat, epididymal fat) were dissected, fixed in 10% formalin for 24 hr, and subsequently stored in 70% ethanol prior to paraffin embedding (5 mice per group). Paraffin-embedded 7 μm slices and hematoxylin/eosin staining were produced by the Gladstone Histology and Light Microscopy Core (Gladstone Institutes, San Francisco, CA). For immunocytochemistry, slices were subjected to citrate-based antigen retrieval and then permeabilized by incubation in 0.5% Triton X-100 in PBS for 30 minutes. Slices were incubated for 2 hours at room temperature with rabbit polyclonal antibodies against UCP1 at a dilution of 1:100 (Abcam, ab10983) and mouse OXPHOS antibodies at a dilution of 1:50 (Abcam, ab110413). After extensive washing in PBS, secondary antibodies anti-rabbit Alexa 488 and anti-mouse Alexa 555 (Invitrogen) were added for 45 min. Slices were mounted with Mowiol. Images were captured using a CSU-W1 spinning disk with Borealis upgrade on a Nikon Ti inverted microscope. Mitochondrial size was measured using ImageJ software and confocal images (×100). Average mitochondrial size was determined from 1500 mitochondria of 44 UCP1-positive beige adipocytes and 2500 mitochondria of 65 UCP1-negative adipocytes.
Immunoblots
For western blot analysis, tissues were lysed in RIPA buffer (1% Igepal, 0.1% sodium dodecyl sulfate, 0.5% sodium deoxycholate, 150 mM NaCl, 1 mM EDTA, 50 mM Tris-HCl [pH 7.4] and a cocktail of proteases inhibitors). Lysates were resolved by SDS-PAGE; transferred to PVDF membrane (Millipore); and probed with anti-UCP1 (Abcam, ab10983), anti-PGC1 α (Abcam, ab54481), anti-HSP60 (Cayman, 10011430), anti-COXIV (Abcam, ab33985), anti-Sodium Potassium ATPase antibody (Abcam, ab76020) anti-TOM20 (Santa Cruz, sc-11415), OXPHOS cocktail (Abcam, ab110413) and anti-CKMT2 (ab71722).
Mitochondrial respiration
Mitochondrial respiration was determined using an XFe24 Extracellular Flux Analyzer (Seahorse Bioscience) using 15 μg mitochondrial protein in a buffer containing 4% BSA, 10mM Pyruvate, 5mM Malate, 1mM GDP. Mitochondria were plated and centrifuged 2,000 g for 20 minutes to promote adherence to the V7 cell culture microplate. ADP addition was used at final concentration of 0.1 mM for subcutaneous and epididymal mitochondria. Calculation of Creatine:ADP Stoichiometry was done as previously reported (Kazak et al., 2015). Briefly, creatine was added to mitochondria at a concentration of 0.01 mM in a total volume of 0.555ml in the XF well. Thus, the total pmoles of creatine in the entire well was 5,550 pmoles. The XF microchamber volume during measurement of the oxygen consumption rate is 2–7μl. Based on a conservative estimate of a 7μl microchamber volume, this is equivalent to a total of 77 pmoles creatine in the microchamber. The total pmoles of oxygen consumed was measured over a 3 minute period, based on the oxygen consumption rate (measured as pmoles/min). The quantity of ADP molecules phosphorylated to ATP was calculated based on the mitochondrial P/O ratio (Watt et al., 2010).
Creatine kinase activity
Creatine kinase activity from sucrose-gradient isolated mitochondria (0.25μg total protein) was examined using the Creatine Kinase Activity Assay Kit (Sigma) according to the manufacturer’s instructions.
Gene expression analysis
Epididymal and inguinal fat tissues were dissected from male mice (6 per group), immediately followed by total RNA extraction using QIAZOL (QIAGEN) and purified with RNeasy Mini kit (QIAGEN). Total RNA was reverse transcribed using a High-Capacity cDNA Reverse Transcription kit (Applied Biosystems). Obtained cDNA was diluted to 15ng/uL and used for qPCR analysis.
15ng of cDNA and final concentration of 0.2uM of each primer were mixed with SYBR GreenERTM qPCR Supermix Universal (Thermo Fisher Scientific) according to manufacturer’s protocol. Reactions were performed in a 96-well format using Stratgene Mx3000 real time PCR system (Agilent Technologies). Relative mRNA levels were calculated using the comparative CT method and normalized to TFIIB mRNA. A complete list of primers and sequences can be found below.
Statistical analysis
Student’s t test was used to determine the significance between two groups with GraphPad Prism 7. Unless otherwise specified, *P<0.05, **P<0.01, and ***P<0.001. Errors bars plotted on graphs are presented as the mean ± SEM.
Supplementary Material
Table 1.
Mouse qRT-PCR Primer Sequences
| Gene | Sequences 5′ –> 3′ | Sequence source |
|---|---|---|
| TFIIB | Forward TGGAGATTTGTCCACCATGA Reverse GAATTGCCAAACTCATCAAAACT |
(de Jong et al., 2015) |
| Ucp1 | Forward ACTGCCACACCTCCAGTCATT Reverse CTTTGCCTCACTCAGGATTGG |
(Kazak et al., 2015) |
| Dio2 | Forward CATGCTGACCTCAGAAGGGC Reverse CCCAGTTTAACCTGTTTGTAGGCA |
NCBI/Primer Blast tool |
| Slc6a8 | Forward TGCATATCTCCAAGGTGGCAG Reverse CTACAAACTGGCTGTCCAGA |
(Kazak et al., 2015) |
| Gamt | Forward GCAGCCACATAAGGTTGTTCC Reverse CTCTTCAGACAGCGGGTACG |
(Kazak et al., 2015) |
| Gatm | Forward CAGACACAAATTGGCCGCTC Reverse CCCAGGTAGTTTGTAACCTGGC |
NCBI/Primer Blast tool |
| Ckmt1 | Forward GGCCTCAAAGAGGTGGAGAA Reverse CAGGATCTTTGGGAAGCGGT |
NCBI/Primer Blast tool |
| Ckmt2 | Forward GCATGGTGGCTGGTGATGAG Reverse AAACTGCCCGTGAGTAATCTTG |
(Kazak et al., 2015) |
| Cidea | Forward TGCTCTTCTGTATCGCCCAGT Reverse GCCGTGTTAAGGAATCTGCTG |
(Tseng et al., 2008) |
| Pgc1α | Forward CCCTGCCATTGTTAAGACC Reverse TGCTGCTGTTCCTGTTTTC |
(Kazak et al., 2015) |
| Prdm16 | Forward CCCACCAGACTTCGAGCTAC Reverse ATCCGTCAGCATCTCCCATC |
NCBI/Primer Blast tool |
| Phospho1 | Forward AAGCACATCATCCACAGTCCCTC Reverse TTGGTCTCCAGCTGTCATCCAG |
(Kazak et al., 2015) |
Acknowledgments
We thank the Histology and Light Microscopy Core at Gladstone Institutes for histology processing, and Nikon Imaging Center at UCSF for use of microscopy equipment. We thank members of the Y.K. lab for helpful discussions. This work was supported by NIH grants 5R01GM107710 (Y.K.) and DK 31405 (B.M.S.), the JPB Foundation (B.M.S.), the Canadian Institutes of Health Research (L.K.), and the Human Frontier Science Program (E.T.C.). BMS serves as a Consultant to Calico Life Sciences, LLC.
Footnotes
Publisher's Disclaimer: This is a PDF file of an unedited manuscript that has been accepted for publication. As a service to our customers we are providing this early version of the manuscript. The manuscript will undergo copyediting, typesetting, and review of the resulting proof before it is published in its final citable form. Please note that during the production process errors may be discovered which could affect the content, and all legal disclaimers that apply to the journal pertain.
SUPPLEMENTAL INFORMATION
Supplemental Information includes Supplemental Experimental Procedures, and seven figures and can be found with this article online at
AUTHOR CONTRIBUTIONS
A.M.B. and Y.K. conceived the project and designed all experiments except for respirometry. A.M.B. performed electrophysiological experiments. A.M.B., M.G.B., I.P., G.L.W., and A.B. performed biochemical, immunocytochemistry, and gene expression profiling experiments. L.K., E.T.C., and B.M.S designed and performed respiration experiments. S.K. consulted on CL-injection of mice and immunocytochemistry experiments. A.M.B., Y.K., L.K., E.T.C, and B.M.S. wrote the manuscript. Y.K. and B.M.S. supervised all research. A.M.B., L.K., E.T.C, S.K., B.M.S., and Y.K discussed the results and commented on the manuscript.
References
- Bertholet AM, Kirichok Y. UCP1: A transporter for H+ and fatty acid anions. Biochimie. 2017;134:28–34. doi: 10.1016/j.biochi.2016.10.013. [DOI] [PMC free article] [PubMed] [Google Scholar]
- Betz MJ, Enerbäck S. Human Brown Adipose Tissue: What We Have Learned So Far. Diabetes. 2015;64:2352–2360. doi: 10.2337/db15-0146. [DOI] [PubMed] [Google Scholar]
- Borecky J, Jezek P, Siemen D. 108-pS channel in brown fat mitochondria might Be identical to the inner membrane anion channel. J Biol Chem. 1997;272:19282–19289. [PubMed] [Google Scholar]
- Cannon B, Nedergaard J. Brown adipose tissue: function and physiological significance. Physiol Rev. 2004;84:277–359. doi: 10.1152/physrev.00015.2003. [DOI] [PubMed] [Google Scholar]
- Chouchani ET, Kazak L, Jedrychowski MP, Lu GZ, Erickson BK, Szpyt J, Pierce KA, Laznik-Bogoslavski D, Vetrivelan R, Clish CB, et al. Mitochondrial ROS regulate thermogenic energy expenditure and sulfenylation of UCP1. Nature. 2016;532:112–116. doi: 10.1038/nature17399. [DOI] [PMC free article] [PubMed] [Google Scholar]
- Cinti S. Transdifferentiation properties of adipocytes in the adipose organ. Am J Physiol Endocrinol Metab. 2009;297:E977–986. doi: 10.1152/ajpendo.00183.2009. [DOI] [PubMed] [Google Scholar]
- Cousin B, Cinti S, Morroni M, Raimbault S, Ricquier D, Penicaud L, Casteilla L. Occurrence of brown adipocytes in rat white adipose tissue: molecular and morphological characterization. J Cell Sci. 1992;103(Pt 4):931–942. doi: 10.1242/jcs.103.4.931. [DOI] [PubMed] [Google Scholar]
- Cypess AM, Lehman S, Williams G, Tal I, Rodman D, Goldfine AB, Kuo FC, Palmer EL, Tseng YH, Doria A, et al. Identification and importance of brown adipose tissue in adult humans. N Engl J Med. 2009;360:1509–1517. doi: 10.1056/NEJMoa0810780. [DOI] [PMC free article] [PubMed] [Google Scholar]
- Cypess Aaron M, Weiner Lauren S, Roberts-Toler C, Elía Elisa F, Kessler Skyler H, Kahn Peter A, English J, Chatman K, Trauger Sunia A, Doria A, et al. Activation of Human Brown Adipose Tissue by a β3-Adrenergic Receptor Agonist. Cell Metab. 2015;21:33–38. doi: 10.1016/j.cmet.2014.12.009. [DOI] [PMC free article] [PubMed] [Google Scholar]
- de Jong JM, Larsson O, Cannon B, Nedergaard J. A stringent validation of mouse adipose tissue identity markers. Am J Physiol Endocrinol Metab. 2015;308:E1085–1105. doi: 10.1152/ajpendo.00023.2015. [DOI] [PubMed] [Google Scholar]
- Fedorenko A, Lishko PV, Kirichok Y. Mechanism of Fatty-Acid-Dependent UCP1 Uncoupling in Brown Fat Mitochondria. Cell. 2012;151:400–413. doi: 10.1016/j.cell.2012.09.010. [DOI] [PMC free article] [PubMed] [Google Scholar]
- Garlid KD, Jaburek M, Jezek P, Varecha M. How do uncoupling proteins uncouple? Biochim Biophys Acta. 2000;1459:383–389. doi: 10.1016/s0005-2728(00)00175-4. [DOI] [PubMed] [Google Scholar]
- Granneman JG, Burnazi M, Zhu Z, Schwamb LA. White adipose tissue contributes to UCP1-independent thermogenesis. Am J Physiol Endocrinol Metab. 2003;285:E1230–1236. doi: 10.1152/ajpendo.00197.2003. [DOI] [PubMed] [Google Scholar]
- Granneman JG, Li P, Zhu Z, Lu Y. Metabolic and cellular plasticity in white adipose tissue I: effects of beta3-adrenergic receptor activation. Am J Physiol Endocrinol Metab. 2005;289:E608–616. doi: 10.1152/ajpendo.00009.2005. [DOI] [PubMed] [Google Scholar]
- Guerra C, Koza RA, Yamashita H, Walsh K, Kozak LP. Emergence of brown adipocytes in white fat in mice is under genetic control. Effects on body weight and adiposity. J Clin Invest. 1998;102:412–420. doi: 10.1172/JCI3155. [DOI] [PMC free article] [PubMed] [Google Scholar]
- Himms-Hagen J, Melnyk A, Zingaretti MC, Ceresi E, Barbatelli G, Cinti S. Multilocular fat cells in WAT of CL-316243-treated rats derive directly from white adipocytes. Am J Physiol Cell Physiol. 2000;279:C670–C681. doi: 10.1152/ajpcell.2000.279.3.C670. [DOI] [PubMed] [Google Scholar]
- Jespersen NZ, Larsen TJ, Peijs L, Daugaard S, Homoe P, Loft A, de Jong J, Mathur N, Cannon B, Nedergaard J, et al. A classical brown adipose tissue mRNA signature partly overlaps with brite in the supraclavicular region of adult humans. Cell Metab. 2013;17:798–805. doi: 10.1016/j.cmet.2013.04.011. [DOI] [PubMed] [Google Scholar]
- Kazak L, Chouchani ET, Jedrychowski MP, Erickson BK, Shinoda K, Cohen P, Vetrivelan R, Lu GZ, Laznik-Bogoslavski D, Hasenfuss SC, et al. A Creatine-Driven Substrate Cycle Enhances Energy Expenditure and Thermogenesis in Beige Fat. Cell. 2015;163:643–655. doi: 10.1016/j.cell.2015.09.035. [DOI] [PMC free article] [PubMed] [Google Scholar]
- Klingenberg M. Wanderings in bioenergetics and biomembranes. Biochim Biophys Acta. 2010;1797:579–594. doi: 10.1016/j.bbabio.2010.02.012. [DOI] [PubMed] [Google Scholar]
- Klingenberg M, Huang SG. Structure and function of the uncoupling protein from brown adipose tissue. Biochim Biophys Acta. 1999;1415:271–296. doi: 10.1016/s0005-2736(98)00232-6. [DOI] [PubMed] [Google Scholar]
- Kozak LP, Koza RA, Anunciado-Koza R. Brown fat thermogenesis and body weight regulation in mice: relevance to humans. Int J Obes (Lond) 2010;34(1):S23–27. doi: 10.1038/ijo.2010.179. [DOI] [PubMed] [Google Scholar]
- Lee P, Smith S, Linderman J, Courville AB, Brychta RJ, Dieckmann W, Werner CD, Chen KY, Celi FS. Temperature-acclimated brown adipose tissue modulates insulin sensitivity in humans. Diabetes. 2014;63:3686–3698. doi: 10.2337/db14-0513. [DOI] [PMC free article] [PubMed] [Google Scholar]
- Lee Y, Willers C, Kunji ER, Crichton PG. Uncoupling protein 1 binds one nucleotide per monomer and is stabilized by tightly bound cardiolipin. Proc Natl Acad Sci USA. 2015;112:6973–6978. doi: 10.1073/pnas.1503833112. [DOI] [PMC free article] [PubMed] [Google Scholar]
- Lidell ME, Betz MJ, Dahlqvist Leinhard O, Heglind M, Elander L, Slawik M, Mussack T, Nilsson D, Romu T, Nuutila P, et al. Evidence for two types of brown adipose tissue in humans. Nat Med. 2013;19:631–634. doi: 10.1038/nm.3017. [DOI] [PubMed] [Google Scholar]
- Loncar D, Afzelius BA, Cannon B. Epididymal white adipose tissue after cold stress in rats. II. Mitochondrial changes. J Ultrastruct Mol Struct Res. 1988;101:199–209. doi: 10.1016/0889-1605(88)90010-9. [DOI] [PubMed] [Google Scholar]
- Long Jonathan Z, Svensson Katrin J, Tsai L, Zeng X, Roh Hyun C, Kong X, Rao Rajesh R, Lou J, Lokurkar I, Baur W, et al. A Smooth Muscle-Like Origin for Beige Adipocytes. Cell Metab. 2014;19:810–820. doi: 10.1016/j.cmet.2014.03.025. [DOI] [PMC free article] [PubMed] [Google Scholar]
- Nicholls DG. The physiological regulation of uncoupling proteins. Biochim Biophys Acta. 2006;1757:459–466. doi: 10.1016/j.bbabio.2006.02.005. [DOI] [PubMed] [Google Scholar]
- Nicholls DG, Lindberg O. Brown-adipose-tissue mitochondria. The influence of albumin and nucleotides on passive ion permeabilities. Eur J Biochem. 1973;37:523–530. doi: 10.1111/j.1432-1033.1973.tb03014.x. [DOI] [PubMed] [Google Scholar]
- Nicholls DG, Locke RM. Thermogenic mechanisms in brown fat. Physiol Rev. 1984;64:1–64. doi: 10.1152/physrev.1984.64.1.1. [DOI] [PubMed] [Google Scholar]
- Palmieri F. The mitochondrial transporter family (SLC25): physiological and pathological implications. Pflugers Arch. 2004;447:689–709. doi: 10.1007/s00424-003-1099-7. [DOI] [PubMed] [Google Scholar]
- Rosen ED, Spiegelman BM. What we talk about when we talk about fat. Cell. 2014;156:20–44. doi: 10.1016/j.cell.2013.12.012. [DOI] [PMC free article] [PubMed] [Google Scholar]
- Seale P, Bjork B, Yang W, Kajimura S, Chin S, Kuang S, Scime A, Devarakonda S, Conroe HM, Erdjument-Bromage H, et al. PRDM16 controls a brown fat/skeletal muscle switch. Nature. 2008;454:961–967. doi: 10.1038/nature07182. [DOI] [PMC free article] [PubMed] [Google Scholar]
- Shabalina IG, Jacobsson A, Cannon B, Nedergaard J. Native UCP1 displays simple competitive kinetics between the regulators purine nucleotides and fatty acids. J Biol Chem. 2004;279:38236–38248. doi: 10.1074/jbc.M402375200. [DOI] [PubMed] [Google Scholar]
- Shabalina IG, Petrovic N, de Jong JM, Kalinovich AV, Cannon B, Nedergaard J. UCP1 in Brite/Beige Adipose Tissue Mitochondria Is Functionally Thermogenic. Cell Rep. 2013;5:1196–1203. doi: 10.1016/j.celrep.2013.10.044. [DOI] [PubMed] [Google Scholar]
- Sharp LZ, Shinoda K, Ohno H, Scheel DW, Tomoda E, Ruiz L, Hu H, Wang L, Pavlova Z, Gilsanz V, et al. Human BAT possesses molecular signatures that resemble beige/brite cells. PLoS One. 2012;7:e49452. doi: 10.1371/journal.pone.0049452. [DOI] [PMC free article] [PubMed] [Google Scholar]
- Shinoda K, Luijten IH, Hasegawa Y, Hong H, Sonne SB, Kim M, Xue R, Chondronikola M, Cypess AM, Tseng YH, et al. Genetic and functional characterization of clonally derived adult human brown adipocytes. Nat Med. 2015;21:389–394. doi: 10.1038/nm.3819. [DOI] [PMC free article] [PubMed] [Google Scholar]
- Tseng YH, Kokkotou E, Schulz TJ, Huang TL, Winnay JN, Taniguchi CM, Tran TT, Suzuki R, Espinoza DO, Yamamoto Y, et al. New role of bone morphogenetic protein 7 in brown adipogenesis and energy expenditure. Nature. 2008;454:1000–1004. doi: 10.1038/nature07221. [DOI] [PMC free article] [PubMed] [Google Scholar]
- Ukropec J, Anunciado RP, Ravussin Y, Hulver MW, Kozak LP. UCP1-independent thermogenesis in white adipose tissue of cold-acclimated Ucp1−/− mice. J Biol Chem. 2006;281:31894–31908. doi: 10.1074/jbc.M606114200. [DOI] [PubMed] [Google Scholar]
- van Marken Lichtenbelt WD, Vanhommerig JW, Smulders NM, Drossaerts JM, Kemerink GJ, Bouvy ND, Schrauwen P, Teule GJ. Cold-activated brown adipose tissue in healthy men. N Engl J Med. 2009;360:1500–1508. doi: 10.1056/NEJMoa0808718. [DOI] [PubMed] [Google Scholar]
- Virtanen KA, Lidell ME, Orava J, Heglind M, Westergren R, Niemi T, Taittonen M, Laine J, Savisto NJ, Enerback S, et al. Functional brown adipose tissue in healthy adults. N Engl J Med. 2009;360:1518–1525. doi: 10.1056/NEJMoa0808949. [DOI] [PubMed] [Google Scholar]
- Walden TB, Hansen IR, Timmons JA, Cannon B, Nedergaard J. Recruited vs. nonrecruited molecular signatures of brown, “brite,” and white adipose tissues. Am J Physiol Endocrinol Metab. 2012;302:E19–31. doi: 10.1152/ajpendo.00249.2011. [DOI] [PubMed] [Google Scholar]
- Watt IN, Montgomery MG, Runswick MJ, Leslie AG, Walker JE. Bioenergetic cost of making an adenosine triphosphate molecule in animal mitochondria. Proc Natl Acad Sci USA. 2010;107:16823–16827. doi: 10.1073/pnas.1011099107. [DOI] [PMC free article] [PubMed] [Google Scholar]
- Wikstrom JD, Mahdaviani K, Liesa M, Sereda SB, Si Y, Las G, Twig G, Petrovic N, Zingaretti C, Graham A, et al. Hormone-induced mitochondrial fission is utilized by brown adipocytes as an amplification pathway for energy expenditure. EMBO J. 2014;33:418–436. doi: 10.1002/embj.201385014. [DOI] [PMC free article] [PubMed] [Google Scholar]
- Wu J, Bostrom P, Sparks LM, Ye L, Choi JH, Giang AH, Khandekar M, Virtanen KA, Nuutila P, Schaart G, et al. Beige adipocytes are a distinct type of thermogenic fat cell in mouse and human. Cell. 2012;150:366–376. doi: 10.1016/j.cell.2012.05.016. [DOI] [PMC free article] [PubMed] [Google Scholar]
- Wu J, Cohen P, Spiegelman BM. Adaptive thermogenesis in adipocytes: is beige the new brown? Genes Dev. 2013;27:234–250. doi: 10.1101/gad.211649.112. [DOI] [PMC free article] [PubMed] [Google Scholar]
Associated Data
This section collects any data citations, data availability statements, or supplementary materials included in this article.